Abstract
Background:
The aim of this study was to assess the prognostic significance of positive lymph node ratio (LNR), tumor deposits (TD), and perineural invasion (PNI) in advanced colorectal signet-ring cell carcinoma (SRCC).
Methods:
A multicenter retrospective cohort analysis was conducted involving 677 patients with advanced colorectal SRCC. The associations of variables with CSS and OS were analyzed using the Kaplan-Meier method and multivariable Cox proportional hazards models. A nomogram model was developed to predict outcomes.
Results:
High-LNR, TD-positive, and PNI-positive were associated with poorer CSS and OS in both the training and validation cohorts. Multivariate Cox analysis identified T stage, M stage, TD, CEA, chemotherapy, and LNR as independent prognostic factors. A prognostic nomogram model incorporating these variables demonstrated excellent calibration and satisfactory predictive accuracy. Survival curves generated from individualized nomogram scores effectively discriminated prognostic outcomes (P < 0.001). The combined variable of LNR, TD, and PNI significantly enhanced the predictive performance. Specifically, the combined variable exhibited the highest relative contribution to OS at 23.4%, surpassing that of T and M stages. For CSS, its relative contribution was 21.4%, ranking second only to T and M stages.
Conclusion:
LNR, TD, and PNI served as prognostic factors for advanced colorectal SRCC. The combined analysis demonstrated a higher prognostic predictive value.
Introduction
Signet ring cell carcinoma (SRCC) was a distinct subtype of adenocarcinoma, showing remarkable differences from adenocarcinoma in pathological features, clinical behavior and prognosis (Allart et al., 2022). It was characterized by abundant intracytoplasmic mucin that pushes the nucleus to one side, giving the cells a signet-ring-like appearance (Anthony et al., 1996). The diagnostic criterion for SRCC was the presence of more than 50% signet ring cells in the tumor tissue (Nagtegaal et al., 2020). Compared to colorectal conventional adenocarcinoma, colorectal SRCC tended to occur in younger individuals, was often diagnosed at an advanced stage, and had a lower survival rate (Weng et al., 2022; Korphaisarn et al., 2019). Notably, in a study involving 173,460 CRC patients, 1,932 (1.11%) were diagnosed with colorectal SRCC, and 76.04% of these cases were at stage III - IV (Shi et al., 2019). Studies have shown that SRCC was characterized by a high frequency of mutations in epithelial-mesenchymal transition (EMT)- and stemness-related genes (such as RNF43, CDH1, and SMAD4), accompanied by excessive activation of the transforming growth factor-β (TGF-β) pathway (An et al., 2021). Meanwhile, upregulation of the autophagic pathway and enrichment of immune-related proteins further promoted tumor progression (Chaudhary et al., 2025). These altered molecular features, combined with tumor stemness regulation and changes in the immune microenvironment (Ye et al., 2024a; Ye et al., 2024b; Ye et al., 2024c; Ye et al., 2025), collectively lead to poor response to conventional therapeutic regimens (Pande et al., 2008).
In current clinical practice, prognosis of CRC was primarily assessed using the TNM staging system (Weiser, 2018). However, this system did not account for the number of lymph nodes retrieved during surgery, potentially resulting in an underestimation of the actual number of metastatic lymph nodes and subsequent downstaging (Berger et al., 2005). The lymph node ratio (LNR) was defined as the ratio of positive lymph nodes to the total number of lymph nodes retrieved and may exhibit superior performance in predicting prognosis (Gartagani et al., 2022). Tumor deposits (TD) served as a supplement to TNM staging in CRC. When tumor deposits were present but there was no lymph node metastasis, they were considered as N1c stage (Brierley et al., 2017). Perineural invasion (PNI) refers to cancer cells invading nerves, around nerves, or directly through them, involving at least 33% of the nerve’s circumference or any layer of the nerve sheath structure (Zhang B. et al., 2023).
Research on advanced colorectal SRCC remains limited. Previous studies predominantly relied on case reports or small sample analyses. By leveraging multicenter data, this study systematically evaluated the prognostic value of LNR, TD, and PNI in advanced colorectal SRCC. Furthermore, a combined analysis was performed to develop a clinically applicable prognostic model.
Patients and methods
Patients
The study included colorectal SRCC patients from the SEER database between 2011 and 2018 as the training cohort. Concurrently, colorectal SRCC patients from four tertiary hospitals (the Second Affiliated Hospital of Nanjing Medical University, Yixing People’s Hospital, Drum Tower Hospital Affiliated to Nanjing University School of Medicine, and Xuzhou Central Hospital) in China were included as the external validation cohort. The inclusion criteria were as follows: (1) Patients with stage III or stage IV; (2) Individuals who underwent surgical treatment. Exclusion criteria included: (1) Non-primary tumors or surgeries performed at non-primary sites; (2) Concurrent presence of other tumors; (3) Perioperative death (≤1 month post-surgery); (4) Incomplete clinical or pathological data.
Study variables
Baseline data including demographic characteristics, tumor size, tumor site, grade, TNM staging, TD, LNR, PNI, carcinoembryonic antigen (CEA) levels, and chemotherapy status were collected. Survival outcomes for patients in the SEER dataset were obtained through systematic queries, while survival outcomes in Chinese hospitals were obtained through telephone follow-ups and death registry queries.
The primary outcome of the study was cancer-specific survival (CSS), defined as the time from diagnosis to death due to colorectal SRCC. The secondary outcome was overall survival (OS), defined as the time from diagnosis to death from any cause. This study adhered to the Helsinki Declaration. Ethical approval was obtained from the institutional review boards of the four tertiary Chinese hospitals with approval numbers: IRB Approval No. 2020-092, IRB Approval No. 2022-158, IRB Approval No. 2022-469-02, and IRB Approval No. XZXY-LK-20240116-007.
Statistical methods
Categorical variables were presented as counts (%) and compared using Pearson’s chi-square test or Fisher’s exact test. LNR was categorized into tertiles using X-tile software, which was identified by scoring the maximum X-squared value in the Kaplan-Meier test based on survival time and outcomes (Tang et al., 2018). Survival curves were constructed using the Kaplan-Meier method, and both univariate and multivariate prognostic analyses were carried out by Cox proportional hazards model. Variables that exhibited statistical significance in the training cohort were subsequently incorporated into the nomogram model. Internal validation was carried out through bootstrapping, and external validation was performed in four Chinese cohort. Model accuracy was assessed using receiver operating characteristic curves (ROC), while calibration curves were employed to evaluate the consistency between the predicted probabilities and the observed probabilities. Relative variable contributions to prognosis were calculated in R. All statistical tests were two-sided, with p < 0.05 considered significant. Statistical analyses were performed using SPSS 22.0, GraphPad Prism 9.4.1, and R 4.3.1 software.
Results
Clinical and pathological characteristics of patients
A total of 677 patients were included in the study, with 556 in the training cohort and 121 in the validation cohort, as illustrated in the flowchart (Figure 1). X-tile software categorized LNR into three groups: low-LNR (LNR <0.3), moderate-LNR (0.3 ≤ LNR ≤0.7), and high-LNR (LNR >0.7) (Supplementary Figure S1). In the training cohort, high-LNR, TD-positive, and PNI-positive patients were associated with T4 stage and >4 metastatic lymph nodes (Table 1). In the validation cohort, high-LNR and PNI-positive patients frequently had more than four metastatic lymph nodes, while TD-positive patients tended to exhibit PNI and distant metastasis (Table 2).
FIGURE 1

Flowchart of the study.
TABLE 1
| Low-LNR (N = 210) | Moderate-LNR (N = 193) | High-LNR (N = 153) | p value | TD-negative (N = 274) | TD-positive (N = 282) | p value | PNI-negative (N = 330) | PNI-positive (N = 226) | p value | |
|---|---|---|---|---|---|---|---|---|---|---|
| Gender | 0.08 | 0.13 | 0.66 | |||||||
| Female | 102 (48.57) | 92 (47.67) | 90 (58.82) | 131 (47.8) | 153 (54.3) | 166 (50.3) | 118 (52.2) | |||
| Male | 108 (51.43) | 101 (52.33) | 63 (41.18) | 143 (52.2) | 12,945.7 () | 164 (49.7) | 108 (47.8) | |||
| Age | 0.17 | <0.01 | <0.01 | 0.02 | 0.09 | |||||
| Media (Q1-Q3) | 67.50 (54.00–78.25) | 63.00 (52.00–75.00) | 64.00 (53.00–74.00) | 68 (55.0–80.0) | 63 (51.0–73.25) | 67 (55.0–77.0) | 62 (50.0–74.0) | |||
| Tumor size | 0.02 | 0.02 | 0.42 | |||||||
| ≤5 cm | 100 (47.62) | 90 (46.63) | 52 (33.99) | 133 (48.5) | 109 (38.7) | 139 (42.1) | 103 (45.6) | |||
| >5 cm | 110 (52.38) | 103 (53.37) | 101 (66.01) | 141 (51.5) | 173 (61.3) | 191 (57.9) | 123 (54.4) | |||
| Tumor site | <0.01 | 0.02 | 0.23 | |||||||
| Right | 152 (72.38) | 126 (65.29) | 79 (51.63) | 192 (70.1) | 165 (58.5) | 220 (66.7) | 137 (60.6) | |||
| Left | 43 (20.48) | 52 (26.94) | 58 (37.91) | 63 (23.0) | 90 (31.9) | 82 (24.8) | 71 (31.4) | |||
| Rectum | 15 (7.14) | 15 (7.77) | 16 (10.46) | 19 (6.9) | 27 (9.6) | 28 (8.5) | 18 (8.0) | |||
| Grade | 0.01 | 0.04 | 0.08 | |||||||
| Moderate | 18 (8.57) | 7 (3.63) | 3 (1.96) | 19 (6.9) | 9 (3.2) | 21 (6.4) | 7 (3.1) | |||
| Poor | 192 (91.43) | 186 (96.37) | 150 (98.04) | 255 (93.1) | 273 (96.8) | 309 (93.6) | 219 (96.9) | |||
| T stage | <0.01 | <0.01 | <0.01 | |||||||
| T1-3 | 115 (54.76) | 89 (46.11) | 47 (30.72) | 161 (58.8) | 90 (31.9) | 179 (54.2) | 72 (31.9) | |||
| T4 | 95 (45.24) | 104 (53.89) | 106 (69.28) | 113 (41.2) | 192 (68.1) | 151 (45.8) | 154 (68.1) | |||
| N stage | <0.01 | <0.01 | <0.01 | |||||||
| <4 nodes | 132 (62.86) | 9 (4.66) | 3 (1.96) | 98 (35.8) | 46 (16.3) | 105 (31.8) | 39 (17.3) | |||
| ≥4 nodes | 78 (37.14) | 184 (95.34) | 150 (98.04) | 176 (64.2) | 236 (83.7) | 225 (68.2) | 187 (82.7) | |||
| M stage | <0.01 | <0.01 | <0.01 | |||||||
| M0 | 169 (80.48) | 123 (63.73) | 76 (49.67) | 217 (79.2) | 151 (53.5) | 240 (72.7) | 128 (56.6) | |||
| M1 | 41 (19.52) | 70 (36.27) | 77 (50.33) | 57 (20.8) | 131 (46.5) | 90 (27.3) | 98 (43.4) | |||
| TD | <0.01 | <0.01 | ||||||||
| Absent | 139 (66.19) | 90 (46.63) | 45 (29.41) | NA | NA | 198 (60.0) | 76 (33.6) | |||
| Present | 71 (33.81) | 103 (53.37) | 108 (70.59) | NA | NA | 132 (40.0) | 150 (66.4) | |||
| PNI | <0.01 | <0.01 | ||||||||
| Absent | 149 (70.95) | 106 (54.92) | 75 (49.02) | 198 (72.3) | 132 (46.8) | NA | NA | |||
| Present | 61 (29.05) | 87 (45.08) | 78 (50.98) | 76 (27.7) | 150 (53.2) | NA | NA | |||
| CEA | 0.02 | 0.10 | 0.85 | |||||||
| Negative | 99 (47.14) | 87 (45.08) | 50 (32.68) | 126 (46.0) | 110 (39.0) | 139 (42.1) | 97 (42.9) | |||
| Positive | 111 (52.86) | 106 (54.92) | 103 (67.32) | 148 (54.0) | 172 (61.0) | 191 (57.9) | 129 (57.1) | |||
| Neoadjuvant therapy | 0.95 | 0.14 | 0.13 | |||||||
| No | 197 (93.81) | 180 (93.26) | 144 (94.11) | 261 (95.3) | 260 (92.2) | 305 (92.4) | 216 (95.6) | |||
| Yes | 13 (6.19) | 13 (6.74) | 9 (5.88) | 13 (4.7) | 22 (7.8) | 25 (7.6) | 10 (4.4) | |||
| Chemotherapy | 0.66 | 0.11 | 0.98 | |||||||
| No | 69 (32.86) | 56 (29.02) | 50 (32.68) | 95 (34.7) | 80 (28.4) | 104 (31.5) | 71 (31.4) | |||
| Yes | 141 (67.14) | 137 (70.98) | 103 (67.32) | 179 (65.3) | 202 (71.6) | 226 (68.5) | 155 (68.6) | |||
| LNR | <0.01 | <0.01 | ||||||||
| Low | NA | NA | NA | 139 (50.7) | 71 (25.2) | 149 (45.2) | 61 (27.0) | |||
| Moderate | NA | NA | NA | 90 (32.8) | 103 (36.5) | 106 (32.1) | 87 (38.5) | |||
| High | NA | NA | NA | 45 (16.4) | 108 (38.3) | 75 (22.7) | 78 (34.5) |
Patient characteristics by LNR, TD and PNI in the training cohort.
TD, tumor deposit; PNI, perineural invasion; CEA, carcinoembryonic antigen; LNR, positive lymph node ratio.
TABLE 2
| Low-LNR (N = 36) | Moderate-LNR (N = 48) | High-LNR (N = 37) | p value | TD-negative (N = 72) | TD-positive (N = 49) | p value | PNI-negative (N = 65) | PNI-positive (N = 56) | p value | |
|---|---|---|---|---|---|---|---|---|---|---|
| Gender | 0.83 | 0.48 | 0.37 | |||||||
| Female | 24 (66.67) | 29 (60.42) | 24 (64.86) | 44 (61.1) | 33 (67.3) | 39 (60.0) | 38 (67.9) | |||
| Male | 12 (33.33) | 19 (39.58) | 13 (35.14) | 28 (38.9) | 16 (32.7) | 26 (40.0) | 18 (32.1) | |||
| Age | 0.94 | 0.71 | 0.76 | |||||||
| Media (Q1-Q3) | 58.50 (41.00–68.00) | 59.00 (47.25–66.00) | 57.00 (44.50–69.00) | 57.5 (44.25–67.75) | 60.0 (44.0–68.0) | 59 (48.5–67.5) | 59 (42.5–68.0) | |||
| Tumor size | 0.83 | 0.97 | 0.02 | |||||||
| ≤5 cm | 17 (47.22 | 25 (52.01) | 20 (54.05) | 37 (51.4) | 25 (51.0) | 27 (41.5) | 35 (62.5) | |||
| >5 cm | 19 (52.78) | 23 (47.92) | 17 (45.95) | 35 (48.6) | 24 (49.0) | 38 (58.5) | 21 (37.5) | |||
| Tumor site | 0.23 | 0.13 | 0.40 | |||||||
| Right | 6 (16.67) | 16 (33.33) | 11 (29.73) | 20 (27.8) | 13 (26.5) | 21 (32.3) | 12 (21.4) | |||
| Left | 9 (25.0) | 11 (22.92) | 13 (35.14) | 15 (20.8) | 18 (36.7) | 16 (24.6) | 17 (30.4) | |||
| Rectum | 21 (58.33) | 21 (43.75) | 13 (35.14) | 37 (51.4) | 18 (36.7) | 28 (43.1) | 27 (48.2) | |||
| Grade | 0.82 | 0.15 | 0.12 | |||||||
| Moderate | 1 (2.78) | 1 (2.08) | 2 (5.41) | 4 (5.6) | 0 (0.0) | 4 (6.2) | 0 (0.0) | |||
| Poor | 35 (97.22) | 47 (97.92) | 35 (94.59) | 68 (94.4) | 49 (100.0) | 61 (93.8) | 56 (100.0) | |||
| T stage | 0.86 | 0.15 | 0.14 | |||||||
| T1-3 | 17 (47.22) | 20 (41.67) | 17 (45.95) | 36 (50.0) | 18 (36.7) | 33 (50.8) | 21 (37.5) | |||
| T4 | 19 (52.78) | 28 (58.33) | 20 (54.05) | 36 (50.0) | 31 (63.3) | 32 (49.2) | 35 (62.5) | |||
| N stage | <0.01 | 0.77 | 0.03 | |||||||
| <4 nodes | 19 (52.78) | 6 (12.50) | 3 (8.11) | 16 (22.2) | 12 (24.5) | 20 (30.8) | 8 (14.3) | |||
| ≥4 nodes | 17 (47.22) | 42 (87.50) | 34 (91.89) | 56 (77.8) | 37 (75.5) | 45 (69.2) | 48 (85.7) | |||
| M stage | 0.64 | 0.02 | 0.40 | |||||||
| M0 | 27 (75.00) | 33 (68.75) | 24 (64.86) | 56 (77.8) | 28 (57.1) | 43 (66.2) | 41 (73.2) | |||
| M1 | 9 (25.00) | 15 (31.25) | 13 (35.14) | 16 (22.2) | 21 (42.9) | 22 (33.8) | 15 (26.8) | |||
| TD | 0.28 | 0.02 | ||||||||
| Absent | 25 (69.44) | 28 (58.33) | 19 (51.35) | NA | NA | 45 (69.2) | 27 (48.2) | |||
| Present | 11 (30.56) | 20 (41.67) | 18 (48.65) | NA | NA | 20 (30.8) | 29 (51.8) | |||
| PNI | 0.34 | 0.02 | ||||||||
| Absent | 23 (63.89) | 24 (50.0) | 18 (48.65) | 45 (62.5) | 20 (40.8) | NA | NA | |||
| Present | 13 (36.11) | 24 (50.0) | 19 (51.35) | 27 (37.5) | 29 (59.2) | NA | NA | |||
| CEA | 0.79 | 0.48 | 0.33 | |||||||
| Negative | 16 (44.44) | 25 (52.08) | 18 (48.65) | 37 (51.4) | 22 (44.9) | 29 (44.6) | 30 (53.6) | |||
| Positive | 20 (55.56) | 23 (47.92) | 19 (51.35) | 35 (48.6) | 27 (55.1) | 36 (55.4) | 26 (46.4) | |||
| Neoadjuvant therapy | 0.18 | 0.399 | 0.22 | 0.685 | 0.51 | |||||
| No | 35 (97.22) | 47 (97.92) | 33 (89.19) | 67 (93.1) | 48 (98.0) | 61 (93.8) | 54 (96.4) | |||
| Yes | 1 (2.78) | 1 (2.08) | 4 (10.81) | 5 (6.9) | 1 (2.0) | 4 (6.2) | 2 (3.6) | |||
| Chemotherapy | 0.47 | 0.63 | 0.23 | |||||||
| No | 13 (36.11) | 17 (35.42) | 9 (24.32) | 22 (30.6) | 17 (34.7) | 24 (36.9) | 15 (26.8) | |||
| Yes | 23 (63.89) | 31 (64.58) | 28 (75.68) | 50 (69.4) | 32 (65.3) | 41 (63.1) | 41 (73.2) | |||
| LNR | 0.28 | 0.34 | ||||||||
| Low | NA | NA | NA | 25 (34.7) | 11 (22.4) | 23 (35.4) | 13 (23.2) | |||
| Moderate | NA | NA | NA | 28 (38.9) | 20 (40.8) | 24 (36.9) | 24 (42.9) | |||
| High | NA | NA | NA | 19 (26.4) | 18 (36.7) | 18 (27.7) | 19 (33.9) |
Patient characteristics by LNR, TD and PNI in validation cohort.
TD, tumor deposit; PNI, perineural invasion; CEA, carcinoembryonic antigen; LNR, positive lymph node ratio.
Survival curves associated with the prognosis of LNR, TD, and PNI
Kaplan-Meier survival curves demonstrated that high-LNR, TD-positive, and PNI-positive were each associated with poorer CSS and OS in advanced colorectal SRCC in both cohorts (Figure 2; Supplementary Figure S2). This disparity was more pronounced in stage III tumors (Supplementary Figure S3). In stage IV tumors, only LNR remained significantly associated with survival, while TD and PNI showed no significance (Supplementary Figure S4). Similar trends were observed for OS. Interestingly, we conducted a combined analysis of TD, LNR, and PNI to construct a new combined variable, and patients were further classified into the triple-positive group (high LNR, TD-positive, PNI-positive), triple-negative group (low LNR, TD-negative, PNI-negative), or intermediate group. In the training cohort, 58 patients (10.4%) were triple-positive and 63 patients (11.3%) were triple-negative. The triple-positive group exhibited a higher cancer-related mortality risk compared to the triple-negative group, and this finding was validated in the validation cohort (Supplementary Figure S5).
FIGURE 2

In the training cohort, Kaplan-Meier survival curves for CSS and OS based on LNR (A, B), TD (C, D), and PNI (E, F). OS, Overall Survival; CSS, Cancer-Specific; LNR, positive lymph node ratio; TD, tumor deposit; PNI, perineural invasion.
Univariate and multivariate analyses
Univariate analysis in the training cohort identified that tumor size, T stage, N stage, M stage, TD, PNI, CEA, chemotherapy, and LNR had prognostic value. Multivariate Cox model revealed T stage, M stage, TD, CEA, chemotherapy, and LNR as independent prognostic factors for CSS (Table 3). In the validation cohort, T stage, M stage, PNI, CEA, and LNR independently predicted CSS (Table 3). Similar results were observed for OS (Table 4). Notably, we integrated the combined analysis of TD, LNR, and PNI into a multivariate model that included tumor size, T stage, N stage, M stage, CEA, and chemotherapy. The results showed that the combined variable independently predicted both CSS and OS in the two cohorts (Table 5).
TABLE 3
| The training cohort | The validation cohort | |||||||
|---|---|---|---|---|---|---|---|---|
| Univariate | Multivariate | Univariate | Multivariate | |||||
| HR (95% CI) | p value | HR (95% CI) | p value | HR (95% CI) | p value | HR (95% CI) | p value | |
| Gender | ||||||||
| Female | ||||||||
| Male | 0.90 (0.73–1.12) | 0.35 | 0.78 (0.47–1.27) | 0.32 | ||||
| Age | 1.00 (1.00–1.01) | 0.34 | 1.01 (0.99–1.02) | 0.42 | ||||
| Tumor size | ||||||||
| ≤5 cm | ||||||||
| >5 cm | 1.47 (1.18–1.83) | <0.01 | 1.13 (0.91–1.42) | 0.27 | 1.06 (0.67–1.69) | 0.86 | ||
| Tumor site | 0.36 | |||||||
| Right | ||||||||
| Left | 0.99 (0.78–1.26) | 0.96 | 1.04 (0.56–1.95) | 0.90 | ||||
| Rectum | 0.74 (0.48–1.16) | 0.16 | 0.96 (0.55–1.70) | 0.90 | ||||
| Grade | ||||||||
| Moderate | ||||||||
| Poor | 1.17 (0.72–1.91) | 0.52 | 1.84 (0.45–7.54) | 0.39 | ||||
| T stage | ||||||||
| T1-3 | ||||||||
| T4 | 2.12 (1.69–2.65) | <0.01 | 1.57 (1.25–2.01) | <0.01 | 2.31 (1.40–3.82) | <0.01 | 1.69 (1.01–2.83) | 0.05 |
| N stage | ||||||||
| <4 nodes | ||||||||
| ≥4 nodes | 2.65 (1.98–3.54) | <0.01 | 1.26 (0.85–1.86) | 0.26 | 1.55 (0.85–2.82) | 0.16 | ||
| M stage | ||||||||
| M0 | ||||||||
| M1 | 2.55 (2.06–3.17) | <0.01 | 1.65 (1.30–2.09) | <0.01 | 2.35 (1.47–3.76) | <0.01 | 2.32 (1.37–3.93) | <0.01 |
| TD | ||||||||
| Absent | ||||||||
| Present | 1.85 (1.49–2.29) | <0.01 | 1.30 (1.02–1.64) | 0.03 | 2.46 (1.55–3.97) | <0.01 | 1.62 (0.96–2.72) | 0.07 |
| PNI | ||||||||
| Absent | ||||||||
| Present | 1.57 (1.27–1.94) | <0.01 | 1.09 (0.87–1.36) | 0.47 | 2.15 (1.33–3.46) | <0.01 | 2.06 (1.22–3.47) | 0.01 |
| CEA | ||||||||
| Negative | ||||||||
| Positive | 1.73 (1.39–2.16) | <0.01 | 1.47 (1.16–1.85) | <0.01 | 1.89 (1.17–3.04) | 0.01 | 2.25 (1.35–3.75) | <0.01 |
| Neoadjuvant therapy | ||||||||
| No | ||||||||
| Yes | 0.87 (0.56–1.34) | 0.53 | 0.95 (0.35–2.60) | 0.92 | ||||
| Chemotherapy | ||||||||
| No | ||||||||
| Yes | 0.57 (0.46–0.72) | <0.01 | 0.49 (0.39–0.62) | <0.01 | 1.11 (0.67–1.85) | 0.69 | ||
| LNR | <0.01 | <0.01 | 0.01 | 0.01 | ||||
| Low | ||||||||
| Moderate | 2.22 (1.71–2.95) | <0.01 | 1.96 (1.37–2.79) | <0.01 | 1.72 (0.91–3.25) | 0.10 | 1.77 (0.92–3.41) | 0.09 |
| High | 3.96 (2.99–5.25) | <0.01 | 2.57 (1.78–3.72) | <0.01 | 2.79 (1.47–5.28) | <0.01 | 3.02 (1.54–5.92) | <0.01 |
Univariate and multivariate analyses of cancer-specific survival in the two cohorts.
HR, hazard ratios; CI, confidence intervals; TD, tumor deposit; PNI, perineural invasion; CEA, carcinoembryonic antigen; LNR, positive lymph node ratio.
TABLE 4
| The training cohort | The validation cohort | |||||||
|---|---|---|---|---|---|---|---|---|
| Univariate | Multivariate | Univariate | Multivariate | |||||
| HR (95% CI) | p value | HR (95% CI) | p value | HR (95% CI) | p value | HR (95% CI) | p value | |
| Gender | ||||||||
| Female | ||||||||
| Male | 0.93 (0.76–1.14) | 0.49 | 0.85 (0.54–1.34) | 0.48 | ||||
| Age | 1.00 (1.00–1.02) | 0.01 | 1.01 (1.00–1.02) | <0.01 | 1.01 (1.00–1.03) | 0.10 | ||
| Tumor size | ||||||||
| ≤5 cm | ||||||||
| >5 cm | 1.44 (1.18–1.77) | <0.01 | 1.13 (0.92–1.40) | 0.26 | 1.16 (0.75–1.79) | 0.52 | ||
| Tumor site | 0.24 | 0.99 | ||||||
| Right | ||||||||
| Left | 0.93 (0.74–1.16) | 0.93 | 0.99 (0.55–1.80) | 0.98 | ||||
| Rectum | 0.72 (0.48–1.07) | 0.10 | 1.01 (0.59–1.71) | 0.98 | ||||
| Grade | ||||||||
| Moderate | ||||||||
| Poor | 1.20 (0.76–1.91) | 0.43 | 2.11 (0.52–8.58) | 0.30 | ||||
| T stage | ||||||||
| T1-3 | ||||||||
| T4 | 1.99 (1.61–2.45) | <0.01 | 1.49 (1.20–1.86) | <0.01 | 1.93 (1.22–3.04) | 0.01 | 1.42 (0.89–2.27) | 0.14 |
| N stage | ||||||||
| <4 nodes | ||||||||
| ≥4 nodes | 2.31 (1.78–3.00) | <0.01 | 1.26 (0.88–1.80) | 0.21 | 1.10 (0.66–1.84) | 0.72 | ||
| M stage | ||||||||
| M0 | ||||||||
| M1 | 2.29 (1.86–2.81) | <0.01 | 1.59 (1.27–2.00) | <0.01 | 2.11 (1.35–3.30) | <0.01 | 1.89 (1.15–3.09) | 0.01 |
| TD | ||||||||
| Absent | ||||||||
| Present | 1.78 (1.46–2.19) | <0.01 | 1.35 (1.08–1.70) | 0.01 | 2.57 (1.65–4.00) | <0.01 | 1.85 (1.14–3.00) | 0.01 |
| PNI | ||||||||
| Absent | ||||||||
| Present | 1.53 (1.26–1.87) | <0.01 | 1.13 (0.91–1.40) | 0.28 | 1.94 (1.23–3.04) | <0.01 | 1.81 (1.11–2.94) | 0.02 |
| CEA | ||||||||
| Negative | ||||||||
| Positive | 1.69 (1.38–2.08) | <0.01 | 1.32 (1.05–1.65) | 0.02 | 1.80 (1.15–2.81) | 0.01 | 2.00 (1.26–3.20) | <0.01 |
| Neoadjuvant therapy | ||||||||
| No | ||||||||
| Yes | 0.80 (0.53–1.22) | 0.30 | 0.81 (0.30–2.22) | 0.69 | ||||
| Chemotherapy | ||||||||
| No | ||||||||
| Yes | 0.50 (0.41–0.62) | <0.01 | 0.48 (0.38–0.60) | <0.01 | 0.89 (0.56–1.40) | 0.60 | ||
| LNR | <0.01 | <0.01 | 0.02 | 0.02 | ||||
| Low | ||||||||
| Moderate | 1.97 (1.54–2.53) | <0.01 | 1.81 (1.31–2.52) | <0.01 | 1.52 (0.85–2.70) | 0.16 | 1.57 (0.87–2.84) | 0.13 |
| High | 3.49 (2.69–4.52) | <0.01 | 2.51 (1.77–3.54) | <0.01 | 2.31 (1.29–4.14) | <0.01 | 2.42 (1.31–4.46) | 0.01 |
Univariate and multivariate analyses of overall survival in the two cohorts.
HR, hazard ratios; CI, confidence intervals; TD, tumor deposit; PNI, perineural invasion; CEA, carcinoembryonic antigen; LNR, positive lymph node ratio.
TABLE 5
| The training cohort | The validation cohort | |||||||
|---|---|---|---|---|---|---|---|---|
| Cancer-specific survival | Overall survival | Cancer-specific survival | Overall survival | |||||
| HR (95% CI) | p value | HR (95% CI) | p value | HR (95% CI) | p value | HR (95% CI) | p value | |
| Tumor size | ||||||||
| ≤5 cm | ||||||||
| >5 cm | 1.18 (0.94–1.48) | 0.16 | 1.13 (0.91–1.4) | 0.26 | 1.03 (0.64–1.66) | 0.91 | 1.12 (0.71–1.77) | 0.62 |
| T stage | ||||||||
| T1-3 | ||||||||
| T4 | 1.63 (1.29–2.05) | <0.01 | 1.56 (1.25–1.94) | <0.01 | 1.86 (1.10–3.14) | 0.02 | 1.54 (0.96–2.48) | 0.07 |
| N stage | ||||||||
| <4 nodes | ||||||||
| ≥4 nodes | 1.86 (1.36–2.53) | <0.01 | 1.72 (1.30–2.27) | 0.26 | 1.47 (0.78–2.78) | 0.24 | 1.02 (0.59–1.76) | 0.95 |
| M stage | ||||||||
| M0 | ||||||||
| M1 | 1.86 (1.48–2.35) | <0.01 | 1.73 (1.38–2.15) | <0.01 | 2.17 (1.34–3.53) | 0.002 | 1.87 (1.18–2.97) | 0.01 |
| CEA | ||||||||
| Negative | ||||||||
| Positive | 1.45 (1.15–1.83) | 0.002 | 1.42 (1.14–1.76) | 0.002 | 1.83 (1.11–3.01) | 0.02 | 1.65 (1.04–2.62) | 0.03 |
| Chemotherapy | ||||||||
| No | ||||||||
| Yes | 0.50 (0.39–0.63) | <0.01 | 0.44 (0.36–0.55) | <0.01 | 1.18 (0.70–2.00) | 0.54 | 0.92 (0.57–1.47) | 0.73 |
| Combined variable | <0.01 | <0.01 | 0.001 | 0.002 | ||||
| Triple-negative | ||||||||
| Intermediate | 2.52 (1.48–4.29) | 0.001 | 2.17 (1.38–3.41) | 0.001 | 1.59 (0.64–3.94) | 0.32 | 1.74 (0.79–3.84) | 0.17 |
| Triple-positive | 3.05 (1.65–5.63) | 0.001 | 2.77 (1.62–4.74) | 0.001 | 5.12 (1.78–14.73) | 0.002 | 5.03 (1.90–13.3) | 0.001 |
Multivariate analyses of cancer - specific and overall survival in two cohorts for the combined variable of TD, LNR, PNI.
HR, hazard ratios; CI, confidence intervals; TD, tumor deposit; PNI, perineural invasion; CEA, carcinoembryonic antigen; LNR, positive lymph node ratio; Triple-positive: high LNR, TD-positive, and PNI-positive, Triple-negative: low LNR, TD-negative, and PNI-negative, Intermediate: the remaining group.
Construction and validation of the nomogram
A nomogram predicting CSS in advanced colorectal SRCC was developed based on T stage, M stage, TD, CEA, chemotherapy, and LNR (Figure 3A). Internal validation using ROC curves showed AUC values of 0.79, 0.80, and 0.83 for 1-year, 3-year, and 5-year CSS, respectively (Figure 3B). In external validation, the corresponding AUCs were 0.75, 0.65, and 0.63 (Figure 3C). Calibration curves for 3-year and 5-year CSS closely aligned with the 45-degree diagonal line (Figures 3D,E). Patients stratified by nomogram scores into low-, moderate-, and high-risk groups exhibited significantly different survival outcomes on Kaplan-Meier analysis (Figure 4). A novel nomogram integrating the combined variable was constructed (Figure 5A). The model demonstrated favorable calibration and discriminatory ability, with internal validation AUCs of 0.78, 0.80, and 0.82, and external validation AUCs of 0.81, 0.70, and 0.74 for 1-, 3-, and 5-year CSS, respectively (Figures 5B–E). Relative contribution analysis revealed that the combined variable exhibited the highest relative contribution to OS at 23.4%, surpassing that of T and M stages. For CSS, its relative contribution was 21.4%, ranking second only to T and M stages (Figures 6A,B).
FIGURE 3

The nomogram model for CSS (A), as well as time-dependent ROC curves (B, C) and calibration curves (D, E) in internal and external validation. CSS, Cancer-Specific Survival; LNR, positive lymph node ratio; TD, tumor deposit; ROC, receiver operating characteristic.
FIGURE 4

Survival curve analysis based on nomogram variable score groups (three risk groups).
FIGURE 5
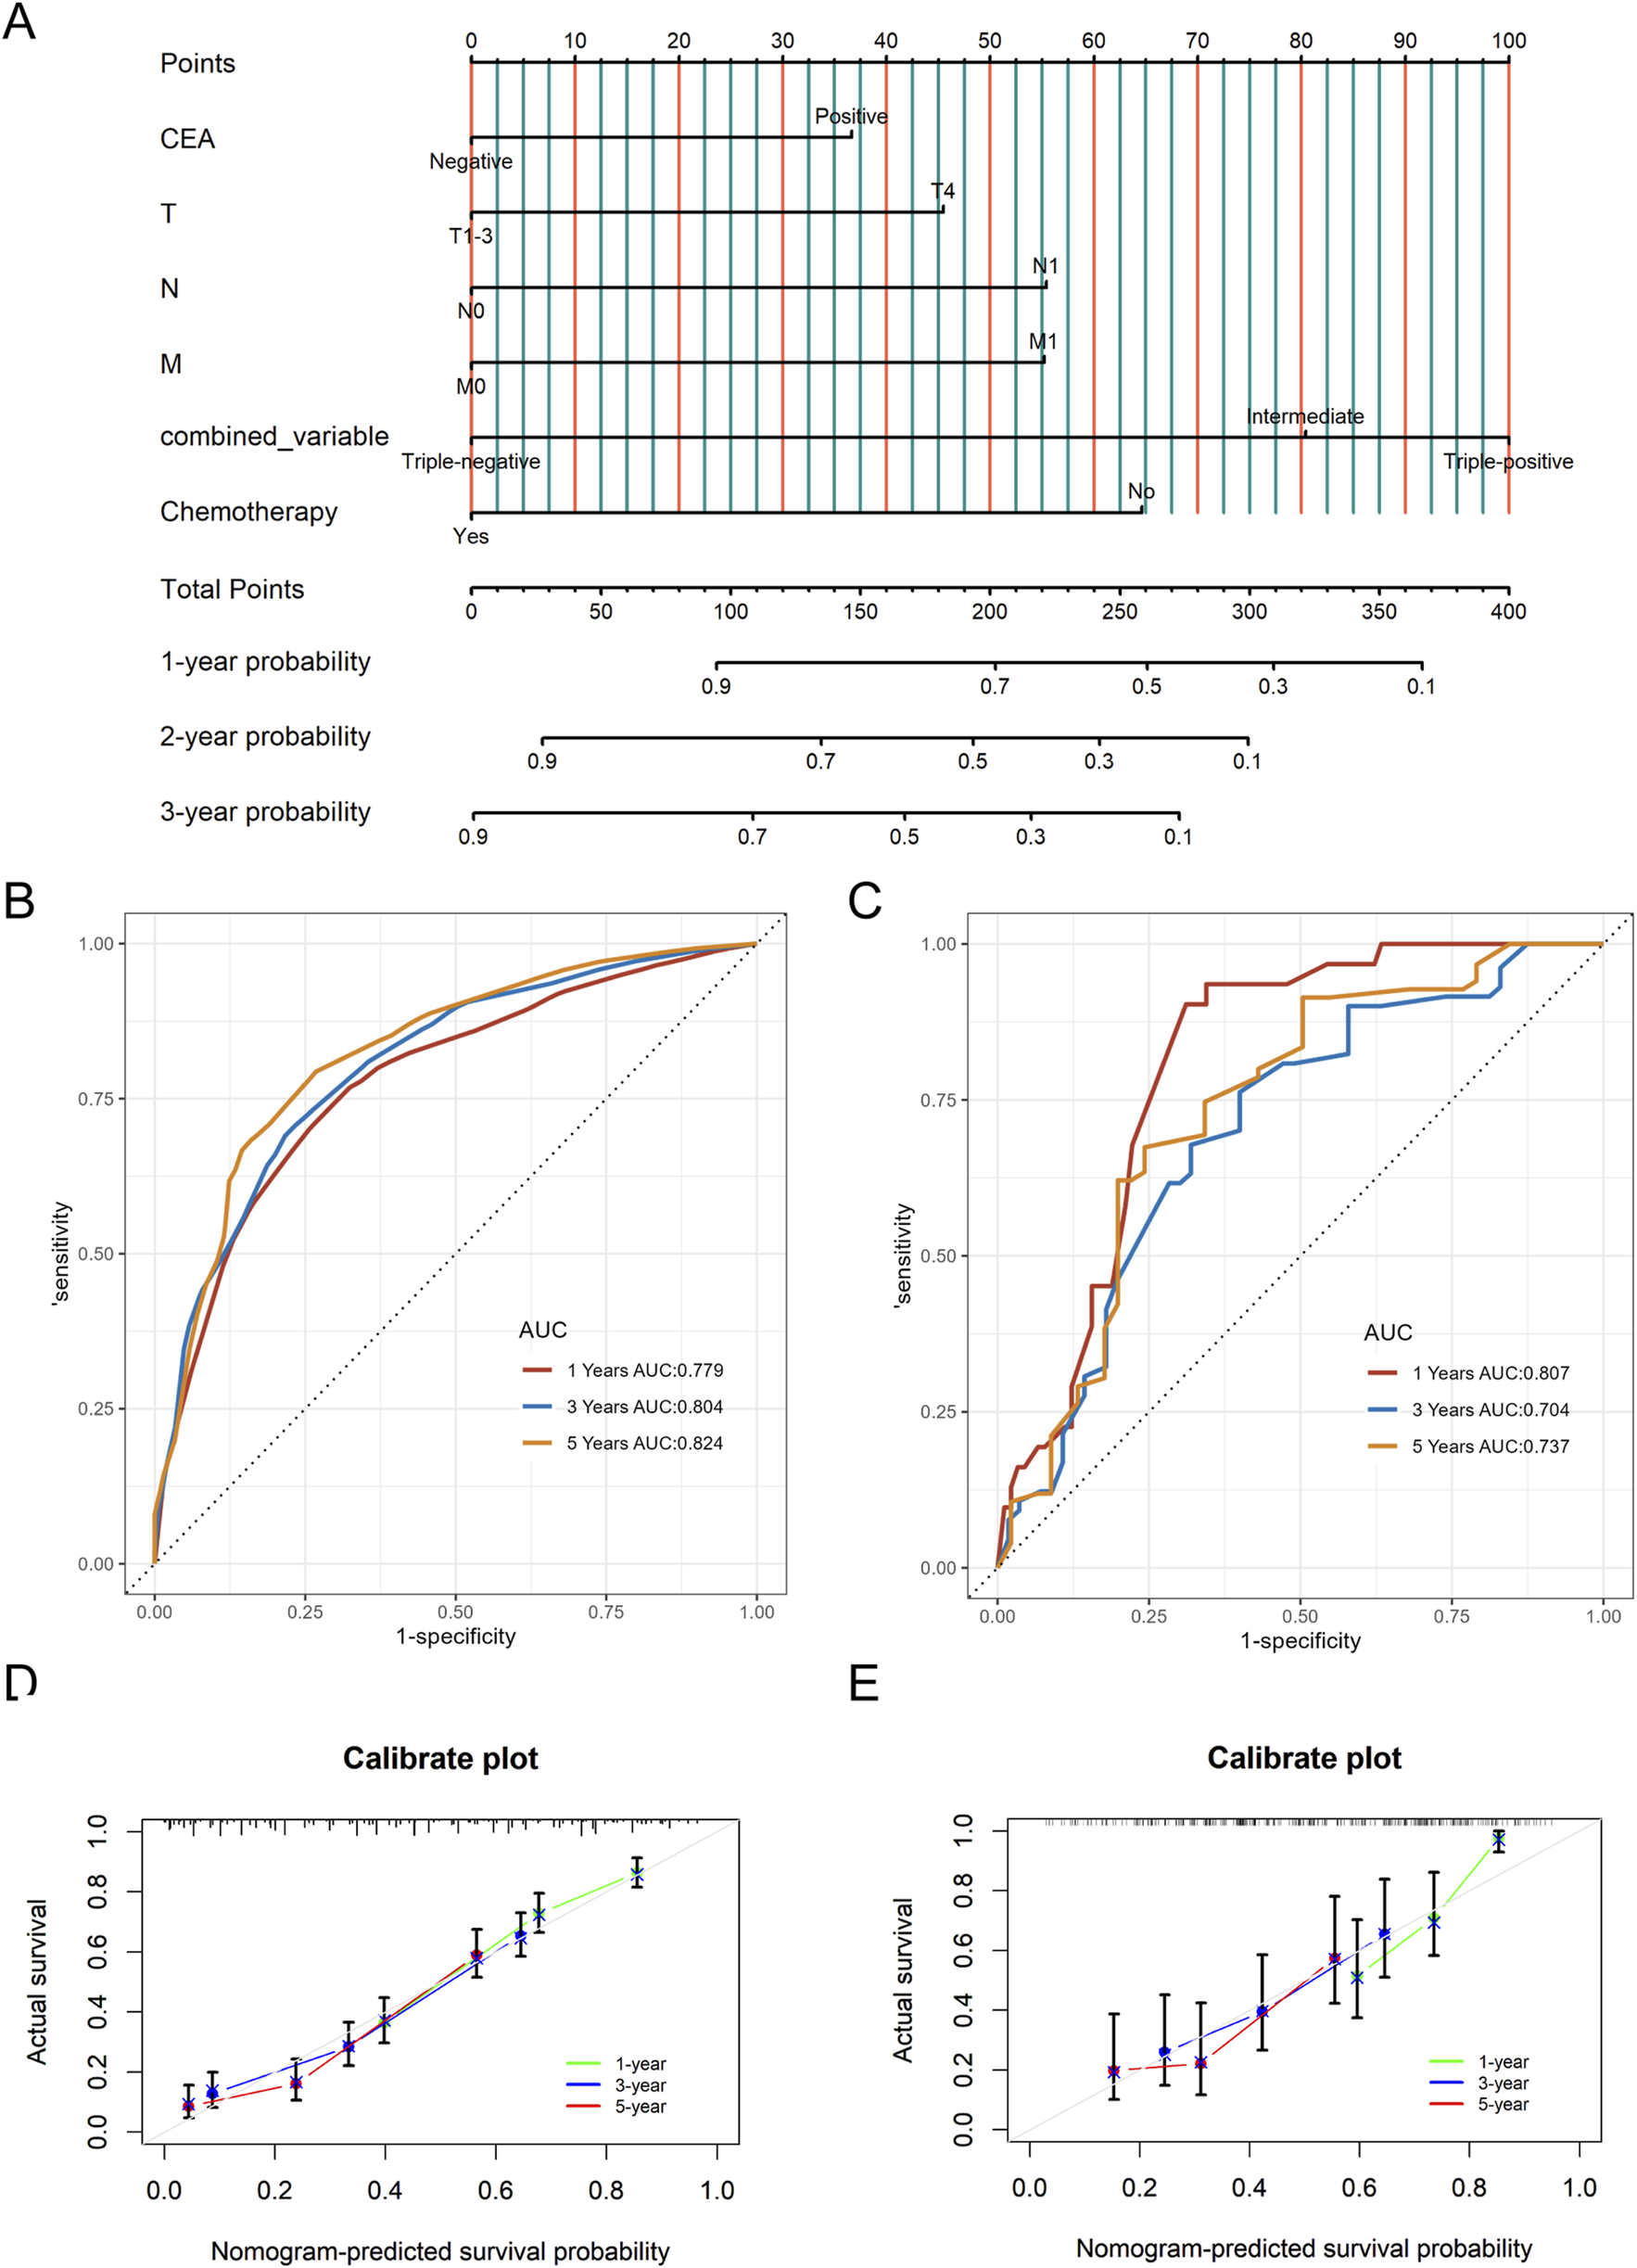
The nomogram model for CSS based on the combined variable of TD, LNR, and PNI (A), as well as time-dependent ROC curves (B, C) and calibration curves (D, E) in internal and external validation. CSS, Cancer-Specific Survival; LNR, positive lymph node ratio; TD, tumor deposit; PNI, perineural invasion; ROC, receiver operating characteristic.
FIGURE 6
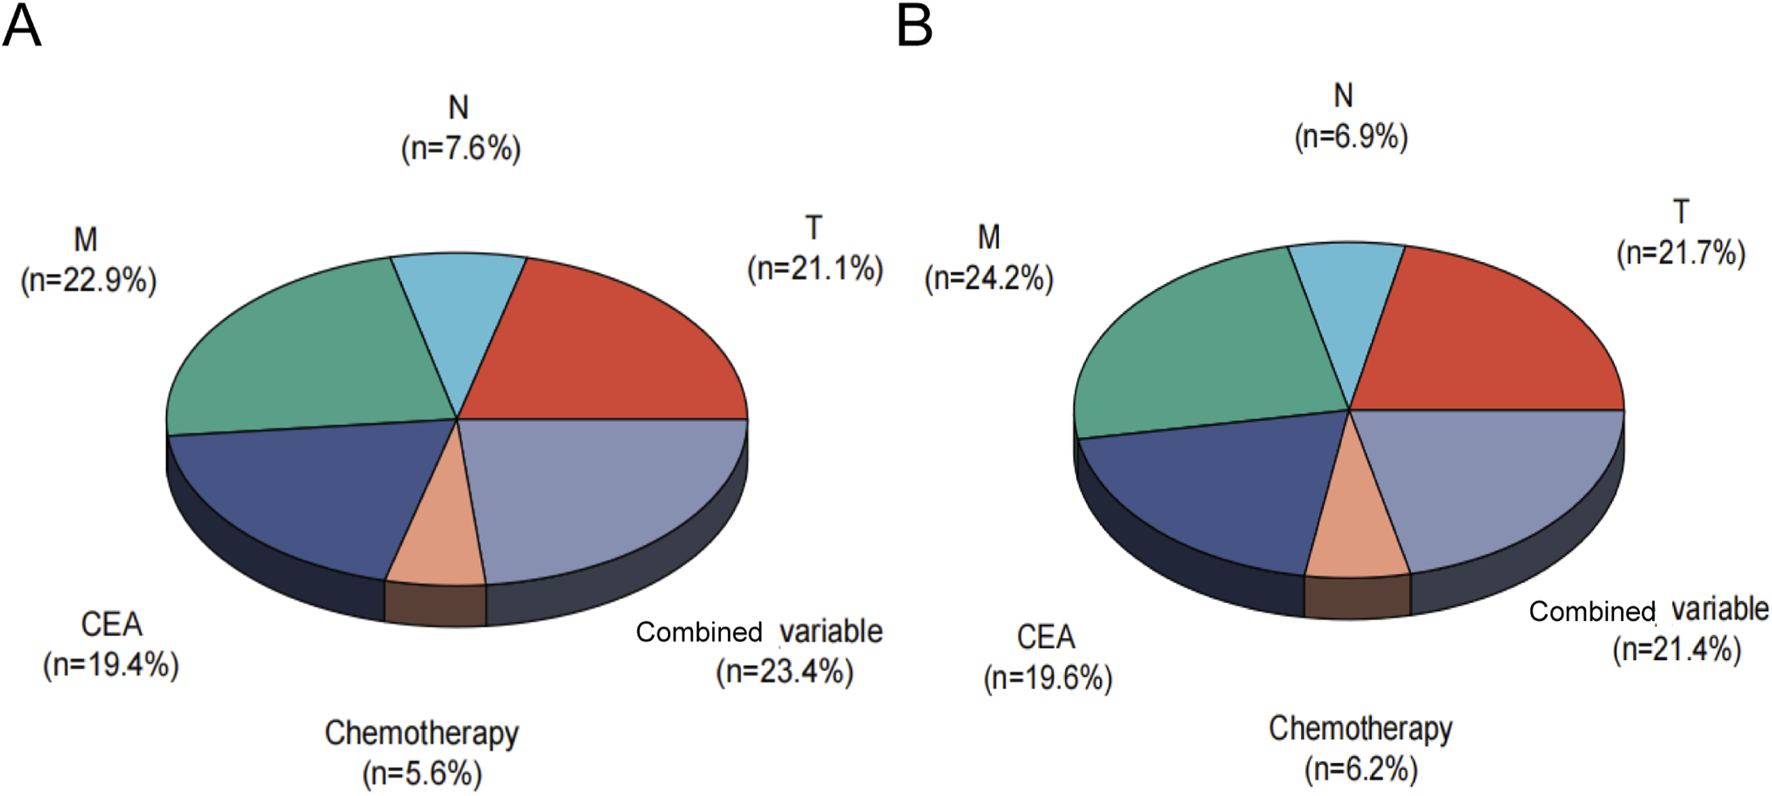
Relative contribution analysis of the combined variable for OS (A) and CSS (B). CSS, Cancer-Specific; OS, Overall-Survival, Combined variable, the triple-positive group (high LNR, TD-positive, PNI-positive), triple-negative group (low LNR, TD-negative, PNI-negative), or intermediate group.
Discussion
Signet ring cell carcinoma (SRCC) is a distinct subtype of adenocarcinoma, with remarkable differences from adenocarcinoma in pathological features, clinical behavior, prognosis, and other aspects (Dekker et al., 2019). SRCC originated primarily from mucosal epithelial cells. Microscopically, tumor cells displayed abundant mucin-filled cytoplasm, with over 50% signet ring cells in the tumor (Nagtegaal et al., 2020; Benesch and Mathieson, 2020). A higher proportion of signet ring cell components was associated with a worse prognosis (An et al., 2021; Song et al., 2019). In SRCC, the expression of adhesion molecules such as E-cadherin and β-catenin is downregulated, while intestinal trefoil factor and mucin two are upregulated, making it more prone to lymph node metastasis (Börger et al., 2007). Studies generally indicate that this type of tumor is insensitive to drugs such as cetuximab, oxaliplatin, and 5-fluorouracil (Pande et al., 2008). Therefore, exploring prognostic biomarker models related to colorectal SRCC for personalized treatment remains crucial.
LNR had demonstrated predictive value in gastrointestinal tumors (Zhu et al., 2018; Zhang C. et al., 2023). In the eighth edition of the UICC TNM classification, TD was defined as discrete nodules of cancer in the lymph drainage area of pericolorectal adipose tissue. TD was associated with poor prognosis in advanced stage rectal cancer (Wang et al., 2019). Previous studies indicated that the combined variable of TD and LNR had superior prognostic value for stage III CRC (Liu et al., 2024). PNI referred to the invasion of tumor cells into the nerve sheath and/or encirclement of the nerve circumference, which was associated with tumor invasion, metastasis, cancer-related pain, and poor clinical outcomes (Wang et al., 2024). Past studies documented the incidence of PNI across CRC stages: approximately 10% in stage I–II, 30% in stage III, and up to 40% in stage IV (Knijn et al., 2016; Al-Sukhni et al., 2017). However, the combined role of LNR, TD, and PNI as pathological biomarkers in advanced colorectal SRCC remained understudied.
The study found that TD was present in 50.7% of advanced colorectal SRCC cases, while PNI in 40.6% of cases. These rates were notably higher than those reported in general CRC literature (Knijn et al., 2016; Jin et al., 2015), likely due to the unique malignant pathological nature of SRCC. Moreover, high-LNR, TD-positive, and PNI-positive were all associated with poor prognosis. Further analysis revealed that LNR served as a consistent prognostic indicator across all stages, while TD and PNI showed significant prognostic value only in stage III, with no predictive significance in stage IV. This discrepancy may be attributed to the prevalence of distant metastasis in stage IV patients, which predominantly influences survival outcomes.
In this study, a nomogram model for advanced colorectal SRCC was constructed. By using individualized nomogram scores for risk stratification, the model effectively distinguished the survival outcomes of different subgroups, verifying its reliability. The combined analysis of TD, LNR, and PNI enhanced the prognostic assessment tool. The relative contribution analysis revealed that the combined variable accounted for 23.4% of OS prediction, surpassing the contributions of T and M stages. For CSS prediction, their combined weight reached 21.4%, second only to T and M stages. These findings underscored that TD, LNR, and PNI were essential biomarkers that complement the traditional staging system.
Nevertheless, the study has several limitations. As a retrospective design, it is inherently susceptible to selection and information biases. The absence of specific chemotherapy regimens and detailed patient health status limits the establishment of causal relationships. Secondly, the predictive performance of the nomogram diminishes over extended follow-up due to unmeasured confounding factors (e.g., secondary diseases, treatment changes). Future multicenter studies with larger sample sizes are necessary to enhance the model’s stability and generalizability.
In conclusion, LNR, TD, and PNI can serve as valuable prognostic factors for advanced colorectal SRCC. Their combined analysis represents a significant addition to the traditional staging system, offering a novel perspective for precise clinical prognosis assessment.
Statements
Data availability statement
The raw data supporting the conclusions of this article will be made available by the authors, without undue reservation.
Ethics statement
The studies involving humans were approved by The ethics committees for the four hospitals are as follows: Nanjing Medical University Second Affiliated Hospital Medical Ethics Committee, No. 2020-092; Yixing People’s Hospital Medical Ethics Committee, No. 2022-158; Nanjing University School of Medicine Affiliated Gulou Hospital Medical Ethics Committee, No. 2022-469-02; Xuzhou Central Hospital Biomedical Research Ethics Review Committee, No. XZXY-LK-20240116-007. The studies were conducted in accordance with the local legislation and institutional requirements. The ethics committee/institutional review board waived the requirement of written informed consent for participation from the participants or the participants’ legal guardians/next of kin because this was a retrospective data analysis. Therefore, the requirement for obtaining informed consent from patients was waived by the ethics committee.
Author contributions
LC: Data curation, Writing – original draft, Conceptualization, Investigation, Formal Analysis, Methodology, Supervision, Writing – review and editing. HW: Formal Analysis, Project administration, Data curation, Validation, Writing – review and editing, Conceptualization, Writing – original draft. TL: Data curation, Methodology, Supervision, Investigation, Conceptualization, Writing – review and editing, Writing – original draft. SF: Writing – original draft, Methodology, Conceptualization, Software, Investigation, Data curation. YD: Writing – original draft, Conceptualization, Software, Investigation, Methodology, Data curation. YZ: Writing – original draft, Methodology, Conceptualization, Investigation, Software. YP: Supervision, Writing – original draft, Methodology, Software, Investigation. CW: Writing – original draft, Visualization, Resources, Formal Analysis, Funding acquisition, Validation, Writing – review and editing, Project administration. XW: Funding acquisition, Formal Analysis, Software, Writing – original draft, Writing – review and editing, Resources, Visualization, Conceptualization, Investigation. LL: Data curation, Validation, Resources, Conceptualization, Visualization, Project administration, Formal Analysis, Methodology, Writing – review and editing, Supervision, Funding acquisition, Investigation, Software, Writing – original draft.
Funding
The author(s) declare that financial support was received for the research and/or publication of this article. Major Project of the Hospital Management Institute of the National Health Commission of the People’s Republic of China (YM2024ZD026); General Program of Wuxi Medical Center of Nanjing Medical University (WMCG202354), Doctoral Talent Fund of the Affiliated Wuxi People’s Hospital of Nanjing Medical University (BSRC202303).
Conflict of interest
The authors declare that the research was conducted in the absence of any commercial or financial relationships that could be construed as a potential conflict of interest.
Generative AI statement
The author(s) declare that no Generative AI was used in the creation of this manuscript.
Publisher’s note
All claims expressed in this article are solely those of the authors and do not necessarily represent those of their affiliated organizations, or those of the publisher, the editors and the reviewers. Any product that may be evaluated in this article, or claim that may be made by its manufacturer, is not guaranteed or endorsed by the publisher.
Supplementary material
The Supplementary Material for this article can be found online at: https://www.frontiersin.org/articles/10.3389/fmolb.2025.1617787/full#supplementary-material
References
1
Allart M. Leroy F. Kim S. Sefrioui D. Nayeri M. Zaanan A. et al (2022). Metastatic colorectal carcinoma with signet-ring cells: clinical, histological and molecular description from an Association des Gastro-Entérologues Oncologues (AGEO) French multicenter retrospective cohort. Dig. Liver Dis.54 (3), 391–399. 10.1016/j.dld.2021.06.031
2
Al-Sukhni E. Attwood K. Gabriel E. M. LeVea C. M. Kanehira K. Nurkin S. J. (2017). Lymphovascular and perineural invasion are associated with poor prognostic features and outcomes in colorectal cancer: a retrospective cohort study. Int. J. Surg.37, 42–49. 10.1016/j.ijsu.2016.08.528
3
An Y. Zhou J. Lin G. Wu H. Cong L. et al (2021). Clinicopathological and molecular characteristics of colorectal signet ring cell carcinoma: a review. Pathol. Oncol. Res.27, 1609859. 10.3389/pore.2021.1609859
4
Anthony T. George R. Rodriguez-Bigas M. Petrelli N. J. (1996). Primary signet-ring cell carcinoma of the Colon and rectum. Ann. Surg. Oncol.3 (4), 344–348. 10.1007/BF02305663
5
Benesch M. G. K. Mathieson A. (2020). Epidemiology of signet ring cell adenocarcinomas. Cancers (Basel)12 (6), 1544. 10.3390/cancers12061544
6
Berger A. C. Sigurdson E. R. LeVoyer T. Hanlon A. Mayer R. J. Macdonald J. S. et al (2005). Colon cancer survival is associated with decreasing ratio of metastatic to examined lymph nodes. J. Clin. Oncol.23 (34), 8706–8712. 10.1200/JCO.2005.02.8852
7
Börger M. E. Gosens M. J. E. M. Jeuken J. W. M. van Kempen L. C. L. T. van de Velde C. J. H. van Krieken J. H. J. M. et al (2007). Signet ring cell differentiation in mucinous colorectal carcinoma. J. Pathol.212 (3), 278–286. 10.1002/path.2181
8
Brierley J. D. Gospodarowicz M. K. Wittekind C. (2017). TNM classification of malignant tumours. John Wiley and Sons.
9
Chaudhary N. La Ferlita A. Choudhary B. S. Jog E. Kazi M. Yahya S. et al (2025). Patient-derived organoids and xenografts uncover therapeutic vulnerabilities in colorectal signet ring cell carcinomas. Clin. Cancer Res.31 (7), 1359–1373. 10.1158/1078-0432.CCR-24-2329
10
Dekker E. Tanis P. J. Vleugels J. L. A. Kasi P. M. Wallace M. B. (2019). Colorectal cancer. Lancet394 (10207), 1467–1480. 10.1016/S0140-6736(19)32319-0
11
Gartagani Z. Doumas S. Kyriakopoulou A. Economopoulou P. Psaltopoulou T. Kotsantis I. et al (2022). Lymph node ratio as a prognostic factor in neck dissection in oral cancer patients: a systematic review and meta-analysis. Cancers (Basel)14 (18), 4456. 10.3390/cancers14184456
12
Jin M. Roth R. Rock J. B. Washington M. K. Lehman A. Frankel W. L. (2015). The impact of tumor deposits on colonic adenocarcinoma AJCC TNM staging and outcome. Am. J. Surg. Pathol.39 (1), 109–115. 10.1097/PAS.0000000000000320
13
Knijn N. Mogk S. C. Teerenstra S. Simmer F. Nagtegaal I. D. (2016). Perineural invasion is a strong prognostic factor in colorectal cancer: a systematic review. Am. J. Surg. Pathol.40 (1), 103–112. 10.1097/PAS.0000000000000518
14
Korphaisarn K. Morris V. Davis J. S. Overman M. J. Fogelman D. R. Kee B. K. et al (2019). Signet ring cell colorectal cancer: genomic insights into a rare subpopulation of colorectal adenocarcinoma. Br. J. Cancer121 (6), 505–510. 10.1038/s41416-019-0548-9
15
Liu L. Ji J. Ge X. Ji Z. Li J. Wu J. et al (2024). Prognostic value of tumor deposits and positive lymph node ratio in stage III colorectal cancer: a retrospective cohort study. Int. J. Surg.110 (6), 3470–3479. 10.1097/JS9.0000000000001295
16
Nagtegaal I. D. Odze R. D. Klimstra D. Paradis V. Rugge M. Schirmacher P. et al (2020). The 2019 WHO classification of tumours of the digestive system. Histopathology76 (2), 182–188. 10.1111/his.13975
17
Pande R. Sunga A. Levea C. Wilding G. E. Bshara W. Reid M. et al (2008). Significance of signet-ring cells in patients with colorectal cancer. Dis. Colon Rectum51 (1), 50–55. 10.1007/s10350-007-9073-7
18
Shi T. Huang M. Han D. Tang X. Chen Y. Li Z. et al (2019). Chemotherapy is associated with increased survival from colorectal signet ring cell carcinoma with distant metastasis: a surveillance, epidemiology, and end results database analysis. Cancer Med.8 (4), 1930–1940. 10.1002/cam4.2054
19
Song I. H. Hong S. M. Yu E. Yoon Y. S. Park I. J. Lim S. B. et al (2019). Signet ring cell component predicts aggressive behaviour in colorectal mucinous adenocarcinoma. Pathology51 (4), 384–391. 10.1016/j.pathol.2019.03.001
20
Tang X. R. Li Y. Q. Liang S. B. Jiang W. Liu F. Ge W. X. et al (2018). Development and validation of a gene expression-based signature to predict distant metastasis in locoregionally advanced nasopharyngeal carcinoma: a retrospective, multicentre, cohort study. Lancet Oncol.19 (3), 382–393. 10.1016/S1470-2045(18)30080-9
21
Wang H. Huo R. He K. Cheng L. Zhang S. Yu M. et al (2024). Perineural invasion in colorectal cancer: mechanisms of action and clinical relevance. Cell Oncol. (Dordr)47 (1), 1–17. 10.1007/s13402-023-00857-y
22
Wang Y. Zhang J. Zhou M. Yang L. Wan J. Shen L. et al (2019). Poor prognostic and staging value of tumor deposit in locally advanced rectal cancer with neoadjuvant chemoradiotherapy. Cancer Med.8 (4), 1508–1520. 10.1002/cam4.2034
23
Weiser M. R. (2018). AJCC 8th edition: colorectal cancer. Ann. Surg. Oncol.25 (6), 1454–1455. 10.1245/s10434-018-6462-1
24
Weng M. T. Chao K. H. Tung C. C. Chang H. C. Shih I. L. Lin B. R. et al (2022). Characteristics of primary signet ring cell carcinoma of Colon and rectum: a case control study. BMC Gastroenterol.22 (1), 173. 10.1186/s12876-022-02258-1
25
Ye B. Hongting G. Zhuang W. Chen C. Yi S. Tang X. et al (2024a). Deciphering lung adenocarcinoma prognosis and immunotherapy response through an AI-driven stemness-related gene signature. J. Cell Mol. Med.28 (14), e18564. 10.1111/jcmm.18564
26
Ye B. Ji H. Zhu M. Wang A. Tang J. Liang Y. et al (2024b). Single-cell sequencing reveals novel proliferative cell type: a key player in renal cell carcinoma prognosis and therapeutic response. Clin. Exp. Med.24 (1), 167. 10.1007/s10238-024-01424-x
27
Ye B. Li Z. Wang Q. (2024c). A novel artificial intelligence network to assess the prognosis of gastrointestinal cancer to immunotherapy based on genetic mutation features. Front. Immunol.15, 1428529. 10.3389/fimmu.2024.1428529
28
Ye B. Fan J. Xue L. Zhuang Y. Luo P. Jiang A. et al (2025). iMLGAM: Integrated machine learning and genetic Algorithm-driven multiomics analysis for pan-cancer immunotherapy response prediction. Imeta4 (2), e70011. 10.1002/imt2.70011
29
Zhang B. Lin Y. Wang C. Chen Z. Huang T. Chen H. et al (2023a). Combining perineural invasion with staging improve the prognostic accuracy in colorectal cancer: a retrospective cohort study. BMC Cancer23 (1), 675. 10.1186/s12885-023-11114-8
30
Zhang C. Zhao S. Wang X. Wen D. (2023b). A new lymph node ratio-based staging system for rectosigmoid cancer: a retrospective study with external validation. Int. J. Surg.109 (10), 3087–3096. 10.1097/JS9.0000000000000546
31
Zhu J. Xue Z. Zhang S. Guo X. Zhai L. Shang S. et al (2018). Integrated analysis of the prognostic role of the lymph node ratio in node-positive gastric cancer: a meta-analysis. Int. J. Surg.57, 76–83. 10.1016/j.ijsu.2018.08.002
Summary
Keywords
colorectal signet ring cell carcinoma, lymph node ratio, tumor deposit, perineural invasion, prognosis
Citation
Chu L, Wang H, Ling T, Feng S, Ding Y, Zhang Y, Pan Y, Wang C, Wang X and Liu L (2025) Prognostic value of positive lymph node ratio, tumor deposit, and perineural invasion in advanced colorectal signet-ring cell carcinoma. Front. Mol. Biosci. 12:1617787. doi: 10.3389/fmolb.2025.1617787
Received
25 April 2025
Accepted
27 June 2025
Published
01 August 2025
Volume
12 - 2025
Edited by
Zhihuang Hu, Fudan University, China
Reviewed by
Jianwei Zhang, The Sixth Affiliated Hospital of Sun Yat-sen University, China
Xiagang Luo, The Second Affiliated Hospital of Nanjing Medical University Department of Gastroenterology, Jiangsu, China
Bicheng Ye, Southeast University, China
Updates
Copyright
© 2025 Chu, Wang, Ling, Feng, Ding, Zhang, Pan, Wang, Wang and Liu.
This is an open-access article distributed under the terms of the Creative Commons Attribution License (CC BY). The use, distribution or reproduction in other forums is permitted, provided the original author(s) and the copyright owner(s) are credited and that the original publication in this journal is cited, in accordance with accepted academic practice. No use, distribution or reproduction is permitted which does not comply with these terms.
*Correspondence: Cenzhu Wang, wxwcz931212@163.com; Xiaohong Wang, xhongwang@126.com; Lei Liu, liulei20102014@sina.com
†These authors have contributed equally to this work
Disclaimer
All claims expressed in this article are solely those of the authors and do not necessarily represent those of their affiliated organizations, or those of the publisher, the editors and the reviewers. Any product that may be evaluated in this article or claim that may be made by its manufacturer is not guaranteed or endorsed by the publisher.