Abstract
Introduction:
Chronic rhinosinusitis with nasal polyps (CRSwNP) is characterized by stromal edema, albumin deposition, and pseudocyst formation. Anoikis, a process in which cells detach from the correct extracellular matrix, disrupts integrin junctions, thereby inhibiting improperly proliferating cells from growing or adhering to an inappropriate matrix. Although anoikis is implicated in immune regulation and CRSwNP pathogenesis, its specific mechanistic role remains poorly defined.
Methods:
The GSE136825 and GSE179625 datasets were obtained from the GEO database and 338 anoikis-related genes (ARGs) were extracted from the literature and databases. Immune cell infiltration was analysed using the CIBERSORT algorithm. CRSwNP samples were classified via consensus clustering. Key ARGs were identified through machine learning. The diagnostic performance of candidate genes was evaluated using Receiver Operating Characteristic (ROC) analysis. Functional annotation was performed based on Gene Ontology (GO) terms, and pathway enrichment analysis was conducted using the Kyoto Encyclopedia of Genes and Genomes (KEGG) database. Regulatory networks were visualized using NetworkAnalyst and Cytoscape. Experimental validation included quantitative real-time reverse-transcription PCR (qRT-PCR), immunohistochemistry (IHC), and immunofluorescence (IF) in human tissues.
Results:
Consensus clustering stratified CRSwNP patients into two distinct anoikis-related clusters. Machine learning identified four key genes: CDH3, PTHLH, PDCD4, and androgen receptor (AR). The nomogram model demonstrated high diagnostic accuracy, with an area under the receiver operating characteristic curve (AUC) >0.90. Immune infiltration analysis revealed differential immune microenvironments between clusters, with AR overexpressed in cluster 1 and PTHLH in cluster 2. Network analysis identified 862 drugs or compounds targeting AR. Experimental validation confirmed consistency between bioinformatics predictions and tissue-level expression patterns.
Conclusion:
This study delineates two anoikis-related molecular subtypes of CRSwNP and identifies AR and PTHLH as cluster-specific biomarkers. These findings provide novel insights for personalized therapy, drug screening, and immunomodulatory strategies in CRSwNP.
1 Introduction
Chronic rhinosinusitis with nasal polyps (CRSwNP) is a common inflammatory disease with typical symptoms including nasal congestion, olfactory disturbances, facial pressure and rhinorrhoea, which severely affects the health-related quality of life (Stevens et al., 2016; Han et al., 2021). Standard treatment modalities include intranasal corticosteroids, short-course systemic corticosteroids, and nasal surgeries. While short-term systemic corticosteroids reduce polyp size and symptoms, prolonged use carries risks of adverse effects. Furthermore, nasal surgeries are associated with high recurrence rates and potential complications such as scarring or mucosal damage (Xu et al., 2020; Fokkens et al., 2020). However, the precise pathogenesis of CRSwNP remains obscure, with the condition hypothesized to arise from a multifactorial interplay of genetic, topographic, anatomical, molecular, hemodynamic, and immunological factors (Kato et al., 2022). Consequently, there is an urgent need to elucidate its etiological mechanisms and identify novel biomarkers to improve diagnostic accuracy and prognostic evaluation in CRSwNP.
Anoikis, a distinct form of programmed cell death (PCD), is characterized by cell detachment from the extracellular matrix (ECM). This process prevents abnormal proliferation and growth when cells adhere to inappropriate matrices, serving as an apoptosis-linked regulatory mechanism (Taddei et al., 2012). Current studies have explored the intrinsic and extrinsic pathways of anoikis regulation, including integrins, epidermal growth factor receptor (EGFR), TGF-β signaling, NF-κB signaling, hypoxia, reactive oxygen species (ROS), and the Hippo pathway (Adeshakin et al., 2021; Frisch et al., 2013). Research indicates differential expression of TGF-β1 in nasal polyps compared to healthy nasal mucosa, revealing its dual role. While TGF-β1 exerts anti-inflammatory effects by suppressing pro-inflammatory genes and proteins, it also upregulates fibrosis- and angiogenesis-related factors, thereby promoting tissue remodeling and cell proliferation (Balsalobre et al., 2013; Little et al., 2008).
Dysregulation of matrix metalloproteinases (MMPs) and their tissue inhibitors (TIMPs), particularly IL-17A-induced activation of the NF-κB pathway leading to MMP-9 upregulation, is a key driver of pathological tissue remodeling in chronic rhinosinusitis with nasal polyps (CRSwNP) (Watelet et al., 2004; Li et al., 2010; Kostamo et al., 2008; Chen et al., 2018). Additionally, IgE-mediated mast cell activation involves reactive oxygen species (ROS) generation (Wang et al., 2018). Furthermore, excessive upregulation of Hippo pathway components in nasal polyp epithelial cells (NPECs), combined with the effector Yes-associated protein (YAP), promotes epithelial cell proliferation and remodeling in CRSwNP (Deng et al., 2019). Finally, inflammatory factors such as TIMP-1, IL-4, IL-6, and TNF-α may activate caspase cascades in CRSwNP through receptor binding (Wen et al., 2022).
Emerging evidence has validated ARGs as novel biomarkers for various pathologies: in oncology, they facilitate diagnosis of lung adenocarcinoma and hepatocellular carcinoma (Chen et al., 2023; Diao et al., 2023); in cardiovascular medicine, they aid risk stratification for ischemic stroke (Qin et al., 2023). However, the exploration of ARGs’ mechanistic role in CRSwNP pathogenesis remains conspicuously absent, particularly regarding their correlations with cellular dynamics in nasal polyp microenvironments.
In this study, we systematically characterized the expression dynamics of ARGs and immune landscape disparities between normal sinonasal mucosa and nasal polyp tissues. By screening anoikis-associated differentially expressed genes (DEGs), we performed molecular subtyping through consensus clustering, which revealed distinct immune infiltration patterns quantified via CIBERSORTx analysis. Functional enrichment analysis demonstrated these DEGs were predominantly involved in epithelial-mesenchymal transition and eosinophil activation pathways. Additionally, we explored the correlation between immune infiltration and regulatory networks involving gene-miRNA, gene-TF, and drug interactions associated with the identified risk genes. Subsequent to this, preliminary experimental verification was conducted within the nasal polyp tissue. The detailed workflow schematic of the current study is illustrated in Figure 1. These findings provide novel insights into anoikis-mediated immunopathological mechanisms in CRSwNP and establish a foundation for precision medicine strategies in clinical management.
FIGURE 1

A detailed flow chart about the study of ARGs in CRSwNP.
2 Materials and methods
2.1 Data acquisition
We obtained gene expression profiling datasets for two nasal polyp samples associated with chronic rhinosinusitis with nasal polyposis (CRSwNP), specifically GSE136825 (platform GPL20301) and GSE179265 (platform GPL24676), from the NCBI Gene Expression Omnibus (GEO) database. The former dataset was designated as the training set, consisting of 33 control samples and 42 CRSwNP samples, while the latter was used as the validation set, comprising 7 control samples and 27 CRSwNP samples. The raw data from GEO were normalized using the R package “NormalizeBetweenArray.” A total of 338 differentially expressed genes (DEGs) were identified from both published literature and the GeneCards database.
2.2 Differentially expressed genes analysis
The R package limma was used to identify differentially expressed genes (DEGs) between normal and CRSwNP samples, with a significance threshold of p < 0.05. DEGs with |log2 fold change| > 1 were selected.
2.3 Immune cell infiltration profile
We employed the CIBERSORT algorithm to assess the relative proportions of 22 infiltrating immune cell types based on gene expression, with a significance threshold set at p < 0.05. The resulting data was then utilized for further analysis. Group comparisons of immune cell proportions were conducted utilizing the Wilcoxon test. Data visualization, such as histograms, heat maps, and box plots, was created utilizing the “ggplot2” and “vioplot” R packages. Pearson correlation coefficients for each immune cell were calculated using the “corrplot” R package, and the outcomes were illustrated in an accompanying heat map.
2.4 Correlation of infiltrating immune cells with ARGs
We computed the correlation coefficient between the expression of ARGs and the percentage of infiltrating immune cells, and visualized the results using the R package “ggplot.” A significance level of p < 0.05 was applied to detect any significant correlations.
2.5 Construction of unsupervised clusters of anoikis and PCA analysis
We performed unsupervised cluster analysis on ARGs using the “ConsensusClusterPlus” R package to identify distinct anoikis patterns in CRSwNP. The optimal number of subtypes (k) was determined based on the tendency, smoothness of the cumulative distribution function (CDF) curve, consensus score, and consensus matrix. Principal component analysis (PCA) was conducted using the “ggplot2” R package.
2.6 Gene set variation analysis
We acquired the “c5.go.symbols” and “c2.cp.kegg.symbols” datasets from the Gene Set Variation Analysis (GSVA) MSigDB database. Subsequently, we employed the R packages “GSVA” and “limma” to assess the modified pathways and biological functions within different clusters linked to ARGs.
2.7 Machine learning algorithms
We applied the Least Absolute Shrinkage and Selection Operator (LASSO), Support Vector Machine-Recursive Feature Elimination (SVM-RFE), and Random Forest (RF) algorithms to identify key ARGs among the Differentially Expressed Genes (DEGs) from both normal and CRSwNP samples. These selected genes were then compared using a Venn diagram created with the “VennDiagram” R package. Subsequently, ROC curves were constructed to assess the predictive capacity of these signature genes in the training set, and the Area Under the Curve (AUC) was calculated using the “pROC” and “InpROC” R packages, respectively. The predictive efficacy of these signature genes was further validated in the verification set. Finally, a nomogram based on these signature genes was developed using the “rms” R package.
2.8 Gene ontology and Kyoto encyclopedia of genes and genomes analysis
Gene Ontology (GO) and Kyoto Encyclopedia of Genes and Genomes (KEGG) enrichment analyses were conducted on the identified genes using the R package “clusterProfiler” to explore the distinct signaling pathways and potential functions associated with the signature genes. Statistical significance was set at p < 0.05.
2.9 Correlation of immune-infiltrating cells with signature genes
In the study, we first calculated the correlation coefficients between the expression levels of ARGs and immune infiltrating cells. Subsequently, Spearman’s rank correlation analysis was employed to investigate the association between immune infiltrating cells and the specific genes. Ultimately, Lollipop plots were generated using the R package “ggplot.”
2.10 Construction of regulatory networks
Regulatory networks for miRNA diagnostic biomarkers and transcription factor (TF) diagnostic biomarkers were built utilizing characteristic genes with NetworkAnalyst (http://www.networkanalyst.ca). Furthermore, a file containing interactions between drugs and genes was acquired from the drug-gene interaction database (DGIdb) (https://dgidb.genome.wustl.edu/) and imported into Cytoscape software for visualization.
2.11 Quantitative real-time reverse transcription PCR
In order to validate the expression of candidate genes in nasal polyps and inferior turbinate tissues (control groups), total RNA was extracted from the nasal polyps and control groups (three samples for each group) using TRIzol Universal reagent (TIANGEN, Beijing, China). The extracted RNA was then reverse transcribed with the PrimeScript RT kit (TaKaRa, Dalian, China). qRT-PCR was performed in triplicate using FastStart Universal SYBR Green Master (ROX) (Roche), with GAPDH serving as an internal control. The relative mRNA levels were calculated using the 2(-Delta Delta CT) method. The Mann-Whitney U test was employed for comparing the two groups of data due to non-normal distribution. The primers utilized for qRT-PCR are listed in Table 1.
TABLE 1
| Gene | Forward primer 5′-3′ | Reverse primer 5′-3′ |
|---|---|---|
| CDH3 | ATCATCGTGACCGACCAGAAT | GACTCCCTCTAAGACACTCCC |
| PTHLH | ATTTACGGCGACGATTCTTCC | GCTTGGAGTTAGGGGACACC |
| PDCD4 | GCAAAAAGGCGACTAAGGAAAAA | TAAGGGCGTCACTCCCACT |
| AR | CCAGGGACCATGTTTTGCC | CGAAGACGACAAGATGGACAA |
Sequences of primers.
2.12 Immunofluorescence
Sections of human sinonasal mucosal tissues, embedded in paraffin at a thickness of 4 μm, were prepared and analyzed to evaluate the expression levels of the target proteins CDH3, PTHLH, PDCD4, and AR.
2.13 Immunohistochemistry
For immunohistochemical staining, the paraffin sections were treated with specific primary antibodies. Each slide was randomly examined and photographed in 5 high-power fields of view. Subsequently, the images were exported, and the average optical density value within the field of view was analyzed using Image-ProPlus 6.0 software, with the results being recorded. The characteristic gene expression in nasal polyps was semi-quantitatively assessed using the H-Score formula: . In this formula, “i” indicates the classification of positive cells, where negative cells without coloring are scored as 0 points, weakly positive cells as 1 point (light yellow), moderately positive cells as 2 points (brown-yellow), and strongly positive cells as 3 points (brown-brown). “pi” represents the percentage of positive cells for each grade.
2.14 Statistical analysis
Statistical analyses were conducted using R version 4.1.1 and GraphPad Prism 8. Univariate and multivariate logistic regression analyses were employed to evaluate the diagnostic efficacy of the predictive model. All statistical tests were two-tailed, with statistical significance set at P < 0.05.
3 Results
3.1 Expression profiles of ARGs in CRSwNP patients
To explore the role of ARGs in CRSwNP, we conducted a systematic assessment of their expression in CRSwNP patients using the dataset GSE136825. Our analysis identified variations in the expression levels of 35 ARGs. Notably, 23 ARGs (CEACAM5, LAMB3, CDH3, MMP2, CXCR4, SERPINA1, PTHLH, MMP11, HMOX1, CCR7, HAVCR2, BCL2L15, PRKCQ, NOX4, BAX, MMP13, MMP9, TGFB1, SPIB, UBE2C, NTRK1, SEMA7A, CEACAM3) were upregulated, while 12 ARGs (LTF, PDCD4, ITGA6, CEACAM1, CPEB2, EGF, CRYAB, IL6, AR, BMP6, VTN, MIR145) showed downregulation (Figures 2A,B). Moreover, we plotted the chromosomal locations of these 35 ARGs (Figure 2C) and conducted correlation analysis to explore their interactions, revealing significant associations among specific anoikis regulatory genes (Figures 2D,E).
FIGURE 2

Expression profiles of ARGs in CRSwNP (A) Heat map showing the expression of 35 differentially expressed ARGs; (B) Box polt showing the exprssion differences of 35 ARGs between CRSwNP and control samples; (C) Relative positions of the 35 ARGs on the chromosomes; (D) Correlation circle plot showing the correlation of the 35 differentially expressed ARGs; (E) Correlation heat map showing that the correlation coefficients of the 35 differentially expressed ARGs. Red and blue represent positive and negative correlations, respectively. Correlation coefficients are shown as the area of the pie chart. *p < 0.05, **p < 0.01, ***p < 0.001.
3.2 Immune profile of CRSwNP patients and its association with ARGs
The CIBERSORT algorithm, based on gene expression analysis, was employed to evaluate the variation in the proportions of 22 infiltrating immune cell types in each sample. The results indicated a significant upregulation of regulatory T cells (Tregs), M2 macrophages, resting dendritic cells, resting mast cells, activated mast cells, and neutrophils in patients with CRSwNP, while plasma cells showed a downregulation (Figures 3A,B). These findings suggest a substantial impact of CRSwNP on the immune system. Additionally, correlation analysis revealed strong associations among activated dendritic cells, resting dendritic cells, M2 macrophages, activated mast cells, neutrophils, plasma cells, Tregs, and anoikis regulators (Figure 3C), indicating a significant role of ARGs in the immune infiltration alterations observed in CRSwNP patients.
FIGURE 3

Overview of immune infiltration in CRSwNP (A) Relative abundance of 22 infiltrating immune cells between CRSwNP and control samples; (B) Box plot showing the difference in immune infiltration between CRSwNP and control samples; (C) Correlation analysis of 35 differentially expressed ARGs with infiltrating immune cells. *p < 0.05, **p < 0.01, ***p < 0.001.
3.3 Identification of anoikis-related clusters in CRSwNP
To provide a more comprehensive depiction of the expression profile of ARGs in CRSwNP, we applied the consensus clustering algorithm to classify 42 CRSwNP samples based on the expression patterns of 35 ARGs. By varying the value of k from 2 to 7, we found that at k = 2, the consensus index of the cumulative distribution function (CDF) curve displayed minimal fluctuations within a narrow range, accompanied by a notably high consensus score, indicating the optimal value of k to be 2 (Figures 4A–D). Additionally, principal component analysis (PCA) revealed significant distinctions between the two clusters. As a result, we stratified the 42 CRSwNP patients into two distinct clusters.
FIGURE 4

Identification of molecular clusters associated with anoikis in CRSwNP (A) Consensus clustering matrix at k = 2; (B) Cumulative distribution function (CDF) curves representing k values of 2–7, respectively; (C) Representative CDF delta area curves; (D) Tracking plot for k values of 2–7, respectively.
3.4 Identification of immune microenvironment and biological function characteristics in different anoikis clusters
We examined the expression of 35 DEGs between two clusters and identified distinct patterns. Cluster 1 demonstrated high expression levels of LTF, CEACAM1, CPEB2, EGF, AR, BMP6, and MIR145, whereas cluster 2 exhibited elevated levels of CEACAM5, LAMB2, PTHLH, MMP11, and BAX (see Figure 5A). Furthermore, to assess variations in immune microenvironment characteristics between the distinct anoikis-associated clusters, we analyzed differences in infiltrating immune cells and their functions. Our findings indicate that cluster 1 was enriched with resting memory CD4+ T cells and M1-polarized macrophages, while cluster 2 showed a higher proportion of activated dendritic cells (Figure 5B), suggesting a unique immune profile between these clusters.
FIGURE 5
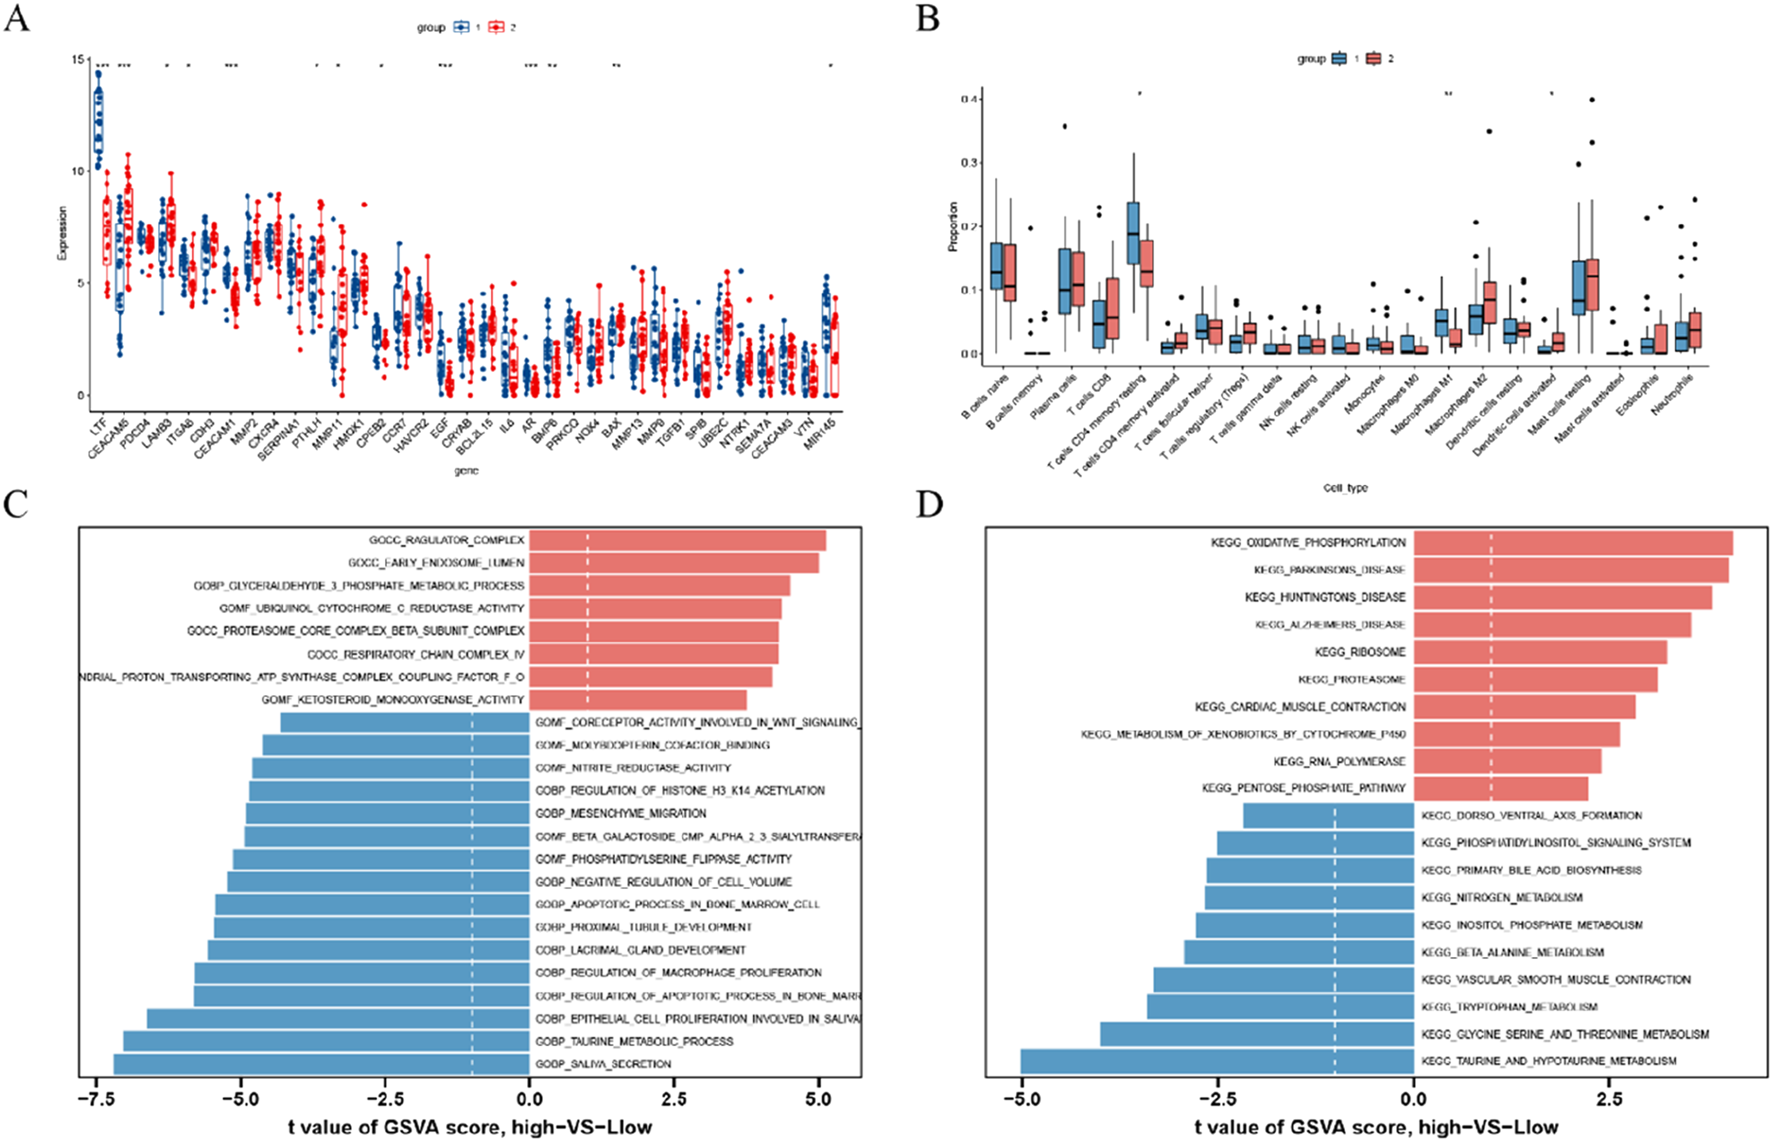
Identification of immune infiltration and biological functional characteristics in different clusters of anoikis (A) Boxplot showing the difference in expression of 35 anoikis -associated DEGs between two anoikis clusters; (B) Boxplot showing the difference in immune infiltration between two anoikis clusters; (C) GSVA results of the GO set between two anoikis clusters were plotted in the bar graph; (D) GSVA results of the KEGG gene set between two anoikis clusters are plotted in the bar graph. *p < 0.05, **p < 0.01, ***p < 0.001.
Subsequently, we conducted GSVA based on GO and KEGG gene sets. The GO analysis revealed significant upregulation of pathways including the ragulator complex, early endosome lumen, glyceraldehyde-3-phosphate metabolic process, ubiquinol cytochrome C reductase activity, proteasome core complex beta subunit complex, respiratory chain complex IV, mitochondrial proton-transporting ATP synthase complex coupling factor F O, and ketosteroid monooxygenase activity in cluster 2. Conversely, pathways related to the regulation of macrophage proliferation, mesenchyme migration, saliva secretion, taurine metabolic process, epithelial cell proliferation involved in salivary, and regulation of apoptotic process in bone marrow showed downregulation in cluster 2 (Figure 5C). The KEGG analysis revealed that pathways such as oxidative phosphorylation, Parkinson’s disease, Huntington’s disease, Alzheimer’s disease, ribosome, proteasome, cardiac muscle contraction, metabolism of xenobiotics by cytochrome P450, RNA polymerase, and pentose phosphate pathway were upregulated in cluster 2. On the other hand, pathways including taurine and hypotaurine metabolism, glycine, serine and threonine metabolism, tryptophan metabolism, vascular smooth muscle contraction, beta-alanine metabolism, inositol phosphate metabolism, glycerophospholipid metabolism, homologous recombination, systemic lupus erythematosus, metabolism of xenobiotics by cytochrome P450, and drug metabolism cytochrome P450 were downregulated in cluster 2 (Figure 5D).
3.5 Construction and validation of the lasso model, SVM model, and RF model
We utilized three algorithms to identify candidate genes associated with anoikis from a pool of 35 DEGs related to anoikis for predicting the occurrence of CRSwNP. The lasso model results indicated that 14 genes were linked to the occurrence of CRSwNP, including LTF, PDCD4, CDH3, CXCR4, SERPINA1, PTHLH, CPEB2, CRYAB, BCL2L15, AR, PRKCQ, TGFB1, SPIB, SEMA7A, and VTN (Figures 6A,B). In parallel, support vector machine (SVM) feature vectors were generated, identifying 7 genes as anoikis variables: PTHLH, PDCD4, SEMA7A, CDH3, SERPINA1, AR, and VTN (Figure 6C). Using the random forest algorithm, we identified 13 signature genes with importance scores exceeding two, including HMOX1, BCL2L15, PTHLH, CRYAB, EGF, AR, MMP9, PDCD4, NTRK1, UBE2C, BAX, BMP6, and CDH3 (Figure 6D). Finally, by intersecting the genes obtained from the three machine learning models, we identified 4 hub genes (PDCD4, CDH3, PTHLH, and AR) for further analysis (Figure 6E). The Gene Ontology (GO) and Kyoto Encyclopedia of Genes and Genomes (KEGG) results indicated that these genes were predominantly involved in nuclear division, spindle organization, tubulin binding, and cell cycle regulation (Figure 6F).
FIGURE 6

Construction and validation of the Lasso model, SVM model and RF model (A) Fourteen cross-validations of adjusted parameter selection in the LASSO model. Each curve corresponds to one gene; (B) LASSO coefficient analysis. Vertical dashed lines are plotted at the best lambda; (C) SVM-RFE algorithm for feature gene selection; (D) RF algorithm for feature gene selection; (E) Venn diagram showing the feature genes shared by LASSO, SVM-RFE algorithms, and random forest (F) Bubble plot of GO and KEGG analysis results based on the 4 feature genes.
Following this, we conducted receiver operating characteristic (ROC) analysis and calculated the area under the curve (AUC) values to assess the accuracy of each diagnostic gene. Our results showed that all 4 key genes demonstrated relatively high predictive values in the training set (GSE136825; Figures 7A–D). Additionally, we validated these findings in another dataset (GSE179625; Figure 7E).
FIGURE 7

Exploration of the diagnostic value of 4 signature genes (A) ROC curves showing the diagnostic value of the CDH3 gene in the GSE136825 dataset; (B) ROC curves showing the diagnostic value of the PDCD4 gene in the GSE136825 dataset; (C) ROC curves showing the diagnostic value of the PTHLH gene in the GSE136825 dataset; (D) ROC curves showing the diagnostic value of the AR gene in the GSE136825 dataset; (E) ROC curves showing the diagnostic value of the 4 signature genes in the GSE179265 dataset.
3.6 Establishment of nomogram for predicting CRSwNP
A nomogram was developed for CRSwNP based on four key genes (Figure 8A). Each key gene in the nomogram is assigned a score, and the total score is calculated by summing the scores of all the characteristic genes. This total score is indicative of varying risks associated with CRSwNP. Calibration curves confirmed the accuracy of the nomogram in predicting the onset of CRSwNP (Figure 8B). Decision curve analysis illustrated the potential benefits of using the nomogram for patients with CRSwNP (Figure 8C).
FIGURE 8

Construction of the nomogram model based on Characteristic ARGs (A) Construction of nomogram integrating Characteristic ARGs for CRSwNP. in the nomogram, each variable corresponds to a score, and the total score can be calculated by summing the scores of all variables; (B) Calibration curves to estimate the prediction accuracy of the nomogram; (C) Decision curve analysis showing the clinical benefit of nomogram.
3.7 Immune infiltration correlation analysis of 4 key genes
The correlation between gene expression and immune cell infiltration of the four hub genes was analyzed in the combined database of GSE136825 and GSE179625. The results indicated a positive correlation of the AR gene with Macrophages M1 and a negative correlation with Macrophages M2 (Figure 9A). The CDH3 gene exhibited positive correlations with T cells regulatory (Tregs), B cells naive, Macrophages M0, and NK cells activated, and negative correlations with T cells CD8+, Mast cells activated, Eosinophils, and Monocytes (Figure 9B). PDCD4 gene showed a positive correlation with B cells naive, Mast cells activated, and NK cells activated, while PDCD4 gene was negatively correlated with T cells CD4+ memory activated, Neutrophils, and B cells memory (Figure 9C). The PTHLH gene displayed positive correlations with Macrophages M2, T cells regulatory (Tregs), T cells gamma delta, and T cells CD4+ memory resting, whereas the PTHLH gene showed a negative correlation with Mast cells activated (Figure 9D). These findings suggest that the expression of these genes may influence the levels of immune cell infiltration, indicating their potential involvement in immune regulation in the pathogenesis of CRSwNP.
FIGURE 9

Correlation analysis of immune infiltration with signature gene expression in the combined database of GSE136825 database and GSE1719265 database (A) The correlation of CDH3 gene expressions with immune infiltration cell; (B) The correlation of PTHLH gene expressions with immune infiltration cell; (C) The correlation of PDCD4 gene expressions with immune infiltration cell; (D) The correlation of AR gene expressions with immune infiltration cell. The size of the dots represents the strength of gene correlation with immune cells; the larger the dot, the stronger the correlation. The color of the dots represents the p-value.
3.8 Construction of regulatory networks
Subsequently, we constructed the gene-miRNA regulatory network (Figure 10A) and gene-transcription factor (TF) regulatory network (Figure 10B) for the four key genes, respectively. The results revealed the intricate involvement of multiple miRNAs and TFs in regulating these pivotal genes. Furthermore, a drug interaction regulatory network for AR was developed (Figure 10C). Collectively, these findings provide valuable insights into the prospective utilization of these genes in disease diagnosis, subtype classification, survival prognosis, drug responsiveness assessment, and other pertinent domains.
FIGURE 10

Construction of regulatory network and Drug-gene interaction network (A) 4 target gene-miRNA regulatory network. Green-blue hexagon nodes represent hub genes, green squares represent miRNAs; (B) 4 target gene-TF regulatory network. Yellow hexagon nodes represent hub genes, green squares represent TFs; (C) Drug-gene interaction network. Blue squares nodes are pivotal genes and blue circle nodes are predicted drugs or molecular compounds.
3.9 Experimental verification
Finally, the potential targets mentioned previously were validated using qRT-PCR (Figure 11A), IF (Figure 11B) and IHC (Figure 11C). As depicted in the figures, mRNA and protein levels of PTHLH and CDH3 were notably elevated in nasal polyp tissue compared to the control group, whereas PDCD4 and AR were downregulated (P < 0.05). These experimental findings align with our collected data.
FIGURE 11

The expression of the identified 4 hub genes (CDH3, PTHLH, PDCD4 and AR) (N = 3) (A) mRNA expression of hub genes from human’s nasal polyps samples by qRT-PCR verification. (B) Immunofluorescence staining of consecutive serial sections of hub genes from human’s nasal polyps samples.Original magnification ×40. (C) Immunohistochemical staining of consecutive serial sections and H-Score of hub genes from human’s nasal polyps samples and control samples. Original magnification ×100. *P < 0.05; **P < 0.01; ***P < 0.001. Image magnification is 100×.
4 Discussion
CRSwNP presents a significant clinical challenge in nasal surgery due to its high recurrence rate, which adversely affects patients’ quality of life and places a substantial burden on society. Researchers have long been committed to exploring innovative diagnostic methods and therapeutic strategies to improve the diagnosis and treatment of CRSwNP. Apoptosis, the most common form of programmed cell death in multicellular organisms, can be triggered by either intrinsic or extrinsic pathways (Christgen et al., 2022). Anoikis, essentially an apoptotic process, can result from an intrinsic pathway mediated by mitochondria or an extrinsic pathway activated by cell surface death receptors (Taddei et al., 2012). However, further exploration is needed to understand the specific mechanisms through which anoikis regulates diseases. In this study, we employed three machine learning algorithms to examine the role of ARGs in CRSwNP. For the first time, we conducted a comprehensive analysis of the differential expression profile of ARGs between normal nasal samples and nasal polyp samples. Our findings revealed 35 dysregulated ARGs in CRSwNP patients, indicating the potential involvement of anoikis in the development of CRSwNP.
Considerable research has shown that CRSwNP is characterized by the upregulation of various immune cells such as monocytes, macrophages, dendritic cells, neutrophils, mast cells, eosinophils, basophils, and ILC2s, accompanied by the downregulation of Treg cells (Lei et al., 2022; Laidlaw and Buchheit, 2020). Different immune cell types play crucial roles in the pathogenesis of CRSwNP. Mast cells, for example, secrete a plethora of cytokines like IL-5, Granulocyte Macrophage Colony-Stimulating Factor, eotaxin, and RANTES, which activate eosinophils. This activation leads to tissue remodeling, chymase expression inducing mucus secretion, and the release of mediators causing tissue edema. Furthermore, mast cells release preformed mediators and newly synthesized proinflammatory molecules, potentially contributing to nasal polyp development (Takabayashi et al., 2012; Pawankar, 2005). Eosinophils worsen nasal polyp severity by producing toxic cationic proteins damaging epithelial cells and releasing proinflammatory molecules promoting type 2 inflammation (Martin et al., 1996; Seiberling et al., 2012). They also sustain plasma cells and antibody production in the bone marrow long-term and activate T cells during inflammation (Chu et al., 2011; Jacobsen et al., 2012). Disease-specific dendritic cell specialization may influence and perpetuate distinct polarized T cell responses in eosinophilic and non-eosinophilic CRSwNP. Increased expression of Thymic Stromal Lymphopoietin (TSLP) and osteopontin in CRSwNP correlates with dendritic cells’ ability to induce Th2 and Th1/Th17 responses, respectively (Cao et al., 2016; Shi et al., 2014). TSLP-stimulated dendritic cells drive naïve CD4+ T cells to differentiate into Th2 cells in an OX40-dependent way (Ito et al., 2005) and secrete high levels of CCL17 and CCL22, recruiting Th2 cells (Liao et al., 2015). Osteopontin has been shown to promote Th1 and Th17 cell differentiation by inducing IL-12, IL-6, and IL-23 production from dendritic cells (Kourepini et al., 2014). M1 macrophages produce pro-inflammatory cytokines leading to tissue damage but aiding immune clearance, while M2 macrophages mainly secrete anti-inflammatory cytokines, supporting wound healing and tissue repair (Sica and Mantovani, 2012; Murray et al., 2014; Martinez and Gordon, 2014). Imbalance in M1/M2 macrophage homeostasis may result in impaired phagocytic function in type 2 inflammation seen in CRSwNP (Lan et al., 2019). Increased CCL25 expression by M1 macrophages in CRSwNP might contribute to nasal polyp formation. The positive association of CD4+ T cells in CRS may explain the severity of inflammation (Seif et al., 2018).Clustering analysis revealed that CRSwNP patients could be categorized into two clusters, with cluster 1 showing higher levels of CD4+ memory resting T cells and M1 macrophages. Therefore, patients in cluster 1 may have a poorer prognosis, and targeting different immune cells in CRSwNP treatment strategies may be crucial for future research.
In recent years, machine learning has become increasingly prominent in the diagnosis of Chronic Rhinosinusitis with Nasal Polyps (CRSwNP), screening of key genes, and assessment of immune cells, attributed to its superior predictive performance, lower error rates, and higher reliability (Dunn and Rothenberg, 2022; Ramakrishnan et al., 2021). The study utilized LASSO, SVM-RFE, and RF algorithms to identify four signature genes: PDCD4, CDH3, PTHLH, and AR. These four genes exhibited strong diagnostic value with all Area Under the Curve (AUC) values exceeding 0.85 in the training set (n = 42). Their diagnostic performance in the validation set was also promising, with all AUC values surpassing 0.739. Notably, CDH3 and PTHLH attained AUC values of 1, potentially influenced by the limited sample size of nasal polyps (NP) in the validation group (n = 27). Additionally, a nomogram incorporating these four genes was developed to enhance their diagnostic potential for improved identification of CRSwNP onset.
Simultaneously, several studies have revealed the involvement of key diagnostic genes in the pathogenesis of CRSwNP. PDCD4, a target of miR-21, functions by inhibiting cytokine expression through the miR-21/PDCD4/NF-κB pathway, which ultimately suppresses inflammation in CRSwNP (Liu et al., 2021).
AR, which is located on the X sex chromosome, encodes the androgen receptor, which is a nuclear transcription factor.In myocarditis, it was found that inhibition of androgen receptor expression reduced the production of cytokine signal inhibitors (SOCS3, SOCS1) and enhanced the activation of signal transduction and transcriptional activators (STAT3, STAT5), resulting in M2-type polarization of macrophages (Brescia et al., 2022; Ramos et al., 2022). Moreover, the AR, acting as a nuclear transcription factor receptor, exhibits distribution throughout nasal polyps. Another study revealed that suppression of androgen receptor (AR) attenuates sepsis-induced acute lung injury (ALI) by inhibiting M1 macrophage polarization and pro-inflammatory cytokine secretion, further validating the regulatory relationship between AR and M1 macrophages (Wang et al., 2025). The study revealed that the stemness maintenance capacity of tumor-infiltrating CD8+ T cells governs sexual dimorphism in tumor immunity, while intrinsic androgen receptor (AR) signaling significantly suppresses the properties of stem-like CD8+ T cell subsets (Yang et al., 2022). Additionally, CDH3 plays a critical role in cell differentiation, growth, and migration (Gloushankova et al., 2017; Kourtidis et al., 2017), while PTHLH is involved in glandular formation in epithelial systems and serves a role in regulating epithelial–mesenchymal interactions during mammary development and ductal morphogenesis in adolescence (Wu et al., 2011). PTHLH-mediated M2 macrophage enrichment was identified in bladder cancer. Our single-cell analysis further revealed a non-significant but consistent increase of M2 macrophages in Cluster 2, implying PTHLH may contribute to their induction—a hypothesis requiring mechanistic validation (Wang et al., 2022). Parallel studies in renal carcinoma established that the SLC17A9-PTHLH-EMT signaling axis critically drives oncogenic proliferation and invasion (Li et al., 2022).
Our preliminary experimental validation indicated differential mRNA and protein expression of these key genes. According to the protein localization results, CDH3, functioning as a cadherin, is predominantly expressed at the junctions of nasal mucosal epithelial cells. PTHLH, a secreted protein, is distributed across all layers of nasal polyps, and PDCD4 is primarily localized in the cytoplasm and nucleus of glandular epithelium within nasal polyps. In conclusion, the investigation of these characteristic genes provides some degree of support for the credibility of our screening outcomes.
Gene enrichment analysis indicated that the key genes identified were predominantly linked to IGF1 receptor signaling pathways, regulation of epithelial cell proliferation, regulation of transforming growth factor β2 production, regulation of integrin biosynthetic processes, and epithelial-to-mesenchymal transition involved in cardiac fibroblast development, among other pathways. Nevertheless, further experimental validation is needed to elucidate the regulatory connections between these key genes and the underlying mechanisms of various signaling pathways in patients with CRSwNP.
Our study entailed a comprehensive examination of these central genes, focusing on analyzing their association with immune infiltration and investigating their interaction networks involving miRNAs, transcription factors (TFs), and drug regulations. Through this analysis, we aim to inform our future approaches in targeting and immunotherapy for CRSwNP. Our next step involves further investigating the potential molecular mechanisms of these genes in CRSwNP through molecular biology experiments.
This study has several limitations. First, the patient population and selection criteria in the public database datasets present certain constraints. To mitigate potential biases from dataset selection, we utilized the dataset with the most comprehensive patient information. Second, the impact of geographical or ethnic variations on gene expression profiles remains unclear. Additionally, relevant clinical data—such as age, gender, and disease duration—which may influence gene expression, were not incorporated. Finally, the specific mechanisms through which PDCD4, AR, CDH3, and PTHLH regulate immune cell infiltration and affect disease progression require further in-depth investigation.
5 Conclusion
We identified two anoikis-related clusters in CRSwNP and discovered four key genes associated with CRSwNP, in which AR was highly expressed in cluster 1 and PTHLH was highly expressed in cluster 2. These findings may provide new insights for drug screening, personalized therapy, and immunotherapy strategies for CRSwNP.
Statements
Data availability statement
The datasets presented in this study can be found in online repositories. The names of the repository/repositories and accession number(s) can be found in the article/supplementary material. Sequence data that support the findings of this study have been deposited in the European Nucleotide Archive with the primary accession code PRJNA563822 and PRJNA744406.
Ethics statement
The studies involving humans were approved by Medical Ethics Committee of The Second Affiliated Hospital of Harbin Medical University. The studies were conducted in accordance with the local legislation and institutional requirements. The participants provided their written informed consent to participate in this study.
Author contributions
ZC: Writing – original draft, Data curation, Software, Validation. LQ: Writing – original draft, Formal analysis, Funding acquisition. QH: Writing – original draft. ST: Writing – original draft. SL: Writing – original draft. QW: Writing – original draft. HY: Writing – original draft. XS: Writing – original draft. LL: Conceptualization, Writing – review and editing. ZX: Conceptualization, Visualization, Writing – review and editing. YS: Conceptualization, Funding acquisition, Writing – review and editing.
Funding
The author(s) declare that financial support was received for the research and/or publication of this article. This work was supported by the National Natural Science Foundation of China (No. 82473035); Natural Science Foundation of Heilongjiang Province of China (LH2022H009). Heilongjiang Provincial Health Commission Science and Technology Plan (20220707011051).
Conflict of interest
The authors declare that the research was conducted in the absence of any commercial or financial relationships that could be construed as a potential conflict of interest.
Generative AI statement
The author(s) declare that no Generative AI was used in the creation of this manuscript.
Any alternative text (alt text) provided alongside figures in this article has been generated by Frontiers with the support of artificial intelligence and reasonable efforts have been made to ensure accuracy, including review by the authors wherever possible. If you identify any issues, please contact us.
Publisher’s note
All claims expressed in this article are solely those of the authors and do not necessarily represent those of their affiliated organizations, or those of the publisher, the editors and the reviewers. Any product that may be evaluated in this article, or claim that may be made by its manufacturer, is not guaranteed or endorsed by the publisher.
Abbreviations
CRSwNP, Chronic rhinosinusitis with nasal polyps; ARGs, anoikis-related genes; LASSO, least absolute shrinkage and selection operator; SVM, support vector machine-recursive feature elimination; RF, random forest; ROC, receiver operating characteristics; GO, gene ontology; KEGG, Kyoto Encyclopedia of Genes and Genomes; TF, transcription factor; ECM, extracellular matrix; EGFR, epidermal growth factor receptor; ROS, reactive oxygen species; MMPs, matrix metalloproteinases; TIMPs, tissue inhibitors of metalloproteinases; DEGs, differentially expressed genes; ML, machine learning; AUC, Area under the ROC curve; CIBERSORT, Estimating Relative Subsets Of RNA Transcripts; GSVA, Gene Set Variation Analysis; DC, dendritic cell; NPs, nasal polyps; Tregs, T cells regulatory.
References
1
Adeshakin F. O. Adeshakin A. O. Afolabi L. O. Yan D. Zhang G. Wan X. (2021). Mechanisms for modulating anoikis resistance in cancer and the relevance of metabolic reprogramming. Front. Oncol.11, 626577. 10.3389/fonc.2021.626577
2
Balsalobre L. Pezato R. Perez-Novo C. Alves M. T. Santos R. P. Bachert C. et al (2013). Epithelium and stroma from nasal polyp mucosa exhibits inverse expression of TGF-β1 as compared with healthy nasal mucosa. J. Otolaryngol. Head. Neck Surg.42 (1), 29. 10.1186/1916-0216-42-29
3
Brescia G. Contro G. Ruaro A. Barion U. Frigo A. C. Sfriso P. et al (2022). Sex and age-related differences in chronic rhinosinusitis with nasal polyps electing ESS. Am. J. Otolaryngol.43 (2), 103342. 10.1016/j.amjoto.2021.103342
4
Cao P. P. Shi L. L. Xu K. Yao Y. Liu Z. (2016). Dendritic cells in inflammatory sinonasal diseases. Clin. Exp. Allergy.46 (7), 894–906. 10.1111/cea.12755
5
Chen X. Chang L. Li X. Huang J. Yang L. Lai X. et al (2018). Tc17/IL-17A up-regulated the expression of MMP-9 via NF-κB pathway in nasal epithelial cells of patients with chronic rhinosinusitis. Front. Immunol.9, 2121. 10.3389/fimmu.2018.02121
6
Chen Y. Huang W. Ouyang J. Wang J. Xie Z. (2023). Identification of anoikis-related subgroups and prognosis model in liver hepatocellular carcinoma. Int. J. Mol. Sci.24 (3), 2862. 10.3390/ijms24032862
7
Christgen S. Tweedell R. E. Kanneganti T. D. (2022). Programming inflammatory cell death for therapy. Pharmacol. Ther.232, 108010. 10.1016/j.pharmthera.2021.108010
8
Chu V. T. Fröhlich A. Steinhauser G. Scheel T. Roch T. Fillatreau S. et al (2011). Eosinophils are required for the maintenance of plasma cells in the bone marrow. Nat. Immunol.12 (2), 151–159. 10.1038/ni.1981
9
Deng H. Sun Y. Wang W. Li M. Yuan T. Kong W. et al (2019). The hippo pathway effector Yes-associated protein promotes epithelial proliferation and remodeling in chronic rhinosinusitis with nasal polyps. Allergy74 (4), 731–742. 10.1111/all.13647
10
Diao X. Guo C. Li S. (2023). Identification of a novel anoikis-related gene signature to predict prognosis and tumor microenvironment in lung adenocarcinoma. Thorac. Cancer14 (3), 320–330. 10.1111/1759-7714.14766
11
Dunn J. L. M. Rothenberg M. E. (2022). 2021 year in review: spotlight on eosinophils. J. Allergy Clin. Immunol.149 (2), 517–524. 10.1016/j.jaci.2021.11.012
12
Fokkens W. J. Lund V. J. Hopkins C. Hellings P. W. Kern R. Reitsma S. et al (2020). European position paper on rhinosinusitis and nasal polyps 2020. Rhinology58 (Suppl. S29), 1–464. 10.4193/Rhin20.600
13
Frisch S. M. Schaller M. Cieply B. (2013). Mechanisms that link the oncogenic epithelial-mesenchymal transition to suppression of anoikis. J. Cell Sci.126 (Pt 1), 21–29. 10.1242/jcs.120907
14
Gloushankova N. A. Rubtsova S. N. Zhitnyak I. Y. (2017). Cadherin-mediated cell-cell interactions in normal and cancer cells. Tissue Barriers5 (3), e1356900. 10.1080/21688370.2017.1356900
15
Han J. K. Bachert C. Fokkens W. Desrosiers M. Wagenmann M. Lee S. E. et al (2021). Mepolizumab for chronic rhinosinusitis with nasal polyps (SYNAPSE): a randomised, double-blind, placebo-controlled, phase 3 trial. Lancet Respir. Med.9 (10), 1141–1153. 10.1016/S2213-2600(21)00097-7
16
Ito T. Wang Y. H. Duramad O. Hori T. Delespesse G. J. Watanabe N. et al (2005). TSLP-activated dendritic cells induce an inflammatory T helper type 2 cell response through OX40 ligand. J. Exp. Med.202 (9), 1213–1223. 10.1084/jem.20051135
17
Jacobsen E. A. Helmers R. A. Lee J. J. Lee N. A. (2012). The expanding role(s) of eosinophils in health and disease. Blood120 (19), 3882–3890. 10.1182/blood-2012-06-330845
18
Kato A. Schleimer R. P. Bleier B. S. (2022). Mechanisms and pathogenesis of chronic rhinosinusitis. J. Allergy Clin. Immunol.149 (5), 1491–1503. 10.1016/j.jaci.2022.02.016
19
Kostamo K. Toskala E. Tervahartiala T. Sorsa T. (2008). Role of matrix metalloproteinases in chronic rhinosinusitis. Curr. Opin. Allergy Clin. Immunol.8 (1), 21–27. 10.1097/ACI.0b013e3282f3f461
20
Kourepini E. Aggelakopoulou M. Alissafi T. Paschalidis N. Simoes D. C. M. Panoutsakopoulou V. (2014). Osteopontin expression by CD103-dendritic cells drives intestinal inflammation. Proc. Natl. Acad. Sci. U. S. A.111 (9), E856–E865. 10.1073/pnas.1316447111
21
Kourtidis A. Lu R. Pence L. J. Anastasiadis P. Z. (2017). A central role for cadherin signaling in cancer. Exp. Cell Res.358 (1), 78–85. 10.1016/j.yexcr.2017.04.006
22
Laidlaw T. M. Buchheit K. M. (2020). Biologics in chronic rhinosinusitis with nasal polyposis. Ann. Allergy Asthma Immunol.124 (4), 326–332. 10.1016/j.anai.2019.12.001
23
Lan F. Zhong H. Zhang N. Johnston S. L. Wen W. Papadopoulos N. et al (2019). IFN-λ1 enhances Staphylococcus aureus clearance in healthy nasal mucosa but not in nasal polyps. J. Allergy Clin. Immunol.143 (4), 1416–1425. 10.1016/j.jaci.2018.09.041
24
Lei C. Jiang J. Zhang Y. Xiong G. (2022). Role and function of regulatory T cell in chronic rhinosinusitis with nasal polyposis. J. Immunol. Res.2022, 1144563. 10.1155/2022/1144563
25
Li X. Meng J. Qiao X. Liu Y. Liu F. Zhang N. et al (2010). Expression of TGF, matrix metalloproteinases, and tissue inhibitors in Chinese chronic rhinosinusitis. J. Allergy Clin. Immunol.125 (5), 1061–1068. 10.1016/j.jaci.2010.02.023
26
Li W. Xu N. Meng X. Yuan H. Yu T. Miao Q. et al (2022). SLC17A9-PTHLH-EMT axis promotes proliferation and invasion of clear renal cell carcinoma. iScience26 (1), 105764. 10.1016/j.isci.2022.105764
27
Liao B. Cao P. P. Zeng M. Zhen Z. Wang H. Zhang Y. N. et al (2015). Interaction of thymic stromal lymphopoietin, IL-33, and their receptors in epithelial cells in eosinophilic chronic rhinosinusitis with nasal polyps. Allergy70 (9), 1169–1180. 10.1111/all.12667
28
Little S. C. Early S. B. Woodard C. R. Shonka D. C. Jr Han J. K. Borish L. et al (2008). Dual action of TGF-beta1 on nasal-polyp derived fibroblasts. Laryngoscope118 (2), 320–324. 10.1097/MLG.0b013e318159cc0b
29
Liu R. Du J. Zhou J. Zhong B. Ba L. Zhang J. et al (2021). Elevated microRNA-21 is a brake of inflammation involved in the development of nasal polyps. Front. Immunol.12, 530488. 10.3389/fimmu.2021.530488
30
Martin L. B. Kita H. Leiferman K. M. Gleich G. J. (1996). Eosinophils in allergy: role in disease, degranulation, and cytokines. Int. Arch. Allergy Immunol.109 (3), 207–215. 10.1159/000237239
31
Martinez F. O. Gordon S. (2014). The M1 and M2 paradigm of macrophage activation: time for reassessment. F1000Prime Rep.6, 13. 10.12703/P6-13
32
Murray P. J. Allen J. E. Biswas S. K. Fisher E. A. Gilroy D. W. Goerdt S. et al (2014). Macrophage activation and polarization: nomenclature and experimental guidelines. Immunity41 (1), 14–20. 10.1016/j.immuni.2014.06.008
33
Pawankar R. (2005). Mast cells in allergic airway disease and chronic rhinosinusitis. Chem. Immunol. Allergy87, 111–129. 10.1159/000087639
34
Qin X. Yi S. Rong J. Lu H. Ji B. Zhang W. et al (2023). Identification of anoikis-related genes classification patterns and immune infiltration characterization in ischemic stroke based on machine learning. Front. Aging Neurosci.15, 1142163. 10.3389/fnagi.2023.1142163
35
Ramakrishnan V. R. Arbet J. Mace J. C. Suresh K. Shintani Smith S. Soler Z. M. et al (2021). Predicting olfactory loss in chronic rhinosinusitis using machine learning. Chem. Senses46, bjab042. 10.1093/chemse/bjab042
36
Ramos L. Massey C. J. Asokan A. Rice J. D. Kroehl M. Ramakrishnan V. R. (2022). Examination of sex differences in a chronic rhinosinusitis surgical cohort. Otolaryngol. Head. Neck Surg.167 (3), 583–589. 10.1177/01945998221076468
37
Seiberling K. A. Church C. A. Herring J. L. Sowers L. C. (2012). Epigenetics of chronic rhinosinusitis and the role of the eosinophil. Int. Forum Allergy Rhinol.2 (1), 80–84. 10.1002/alr.20090
38
Seif F. Ghalehbaghi B. Aazami H. Mohebbi A. Ahmadi A. Falak R. et al (2018). Frequency of CD4+ and CD8+ T cells in Iranian chronic rhinosinusitis patients. Allergy Asthma Clin. Immunol.14, 47. 10.1186/s13223-018-0270-9
39
Shi L. L. Song J. Xiong P. Cao P. P. Liao B. Ma J. et al (2014). Disease-specific T-helper cell polarizing function of lesional dendritic cells in different types of chronic rhinosinusitis with nasal polyps. Am. J. Respir. Crit. Care Med.190 (6), 628–638. 10.1164/rccm.201402-0234OC
40
Sica A. Mantovani A. (2012). Macrophage plasticity and polarization: in vivo veritas. J. Clin. Invest122 (3), 787–795. 10.1172/JCI59643
41
Stevens W. W. Schleimer R. P. Kern R. C. (2016). Chronic rhinosinusitis with nasal polyps. J. Allergy Clin. Immunol. Pract.4 (4), 565–572. 10.1016/j.jaip.2016.04.012
42
Taddei M. L. Giannoni E. Fiaschi T. Chiarugi P. (2012). Anoikis: an emerging hallmark in health and diseases. J. Pathol.226 (2), 380–393. 10.1002/path.3000
43
Takabayashi T. Kato A. Peters A. T. Suh L. A. Carter R. Norton J. et al (2012). Glandular mast cells with distinct phenotype are highly elevated in chronic rhinosinusitis with nasal polyps. J. Allergy Clin. Immunol.130 (2), 410–420. 10.1016/j.jaci.2012.02.046
44
Wang H. Do D. C. Liu J. Wang B. Qu J. Ke X. et al (2018). Functional role of kynurenine and aryl hydrocarbon receptor axis in chronic rhinosinusitis with nasal polyps. J. Allergy Clin. Immunol.141 (2), 586–600. 10.1016/j.jaci.2017.06.013
45
Wang J. He X. Bai Y. Du G. Cai M. (2022). Identification and validation of novel biomarkers affecting bladder cancer immunotherapy via machine learning and its association with M2 macrophages. Front. Immunol.13, 1051063. 10.3389/fimmu.2022.1051063
46
Wang X. Yin D. Sun J. Zhang L. Ye Y. Guo Q. (2025). AR deficiency protects against sepsis-induced acute lung injury by inhibiting macrophage M1 polarization and inflammatory cytokine secretion. Inflammation. 10.1007/s10753-025-02321-5
47
Watelet J. B. Bachert C. Claeys C. Van Cauwenberge P. (2004). Matrix metalloproteinases MMP-7, MMP-9 and their tissue inhibitor TIMP-1: expression in chronic sinusitis vs nasal polyposis. Allergy59 (1), 54–60. 10.1046/j.1398-9995.2003.00364.x
48
Wen W. Zhu S. Ma R. Wang L. Shen X. Li Y. et al (2022). Correlation analysis of TGF-β1, MMP-9, TIMP-1, IL-1, IL-4, IL-6, IL-17, and TNF-α in refractory chronic rhinosinusitis: a retrospective study. Allergol. Immunopathol. Madr.50 (4), 137–142. 10.15586/aei.v50i4.527
49
Wu X. Peters-Hall J. R. Ghimbovschi S. Mimms R. Rose M. C. Peña M. T. (2011). Glandular gene expression of sinus mucosa in chronic rhinosinusitis with and without cystic fibrosis. Am. J. Respir. Cell Mol. Biol.45 (3), 525–533. 10.1165/rcmb.2010-0133OC
50
Xu Z. Luo X. Xu L. Deng J. Gao W. Jiang L. et al (2020). Effect of short-course glucocorticoid application on patients with chronic rhinosinusitis with nasal polyps. World Allergy Organ J.13 (6), 100131. 10.1016/j.waojou.2020.100131
51
Yang C. Jin J. Yang Y. Sun H. Wu L. Shen M. et al (2022). Androgen receptor-mediated CD8+ T cell stemness programs drive sex differences in antitumor immunity. Immunity55 (9), 1747. 10.1016/j.immuni.2022.07.016
Summary
Keywords
chronic rhinosinusitis with nasal polyps, anoikis-related genes, immune infiltration, molecular cluster, machine learning, immunotherapy
Citation
Chen Z, Qu L, Hao Q, Teng S, Liu S, Wu Q, Yi H, Shen X, Li L, Xu Z and Sun Y (2025) Identification of anoikis-related genes classification patterns and immune infiltration characterization in chronic rhinosinusitis with nasal polyps based on machine learning. Front. Mol. Biosci. 12:1624300. doi: 10.3389/fmolb.2025.1624300
Received
07 May 2025
Accepted
04 August 2025
Published
15 August 2025
Volume
12 - 2025
Edited by
Xin Wang, Shaanxi Provincial People’s Hospital, China
Reviewed by
Zhenlin Wang, Capital Medical University, China
Junpu Wang, Central South University, China
Jun Dai, Huai’an Second People’s Hospital, China
Updates
Copyright
© 2025 Chen, Qu, Hao, Teng, Liu, Wu, Yi, Shen, Li, Xu and Sun.
This is an open-access article distributed under the terms of the Creative Commons Attribution License (CC BY). The use, distribution or reproduction in other forums is permitted, provided the original author(s) and the copyright owner(s) are credited and that the original publication in this journal is cited, in accordance with accepted academic practice. No use, distribution or reproduction is permitted which does not comply with these terms.
*Correspondence: Yanan Sun, h04015@hrbmu.edu.cn; Zhaonan Xu, 202301361@hrbmu.edu.cn; Liang Li, 83105972@hrbmu.edu.cn
†These authors have contributed equally to this work
Disclaimer
All claims expressed in this article are solely those of the authors and do not necessarily represent those of their affiliated organizations, or those of the publisher, the editors and the reviewers. Any product that may be evaluated in this article or claim that may be made by its manufacturer is not guaranteed or endorsed by the publisher.