Abstract
Introduction:
This research explores the therapeutic potential of Arctigenin (AG) against triple-negative breast cancer (TNBC) and elucidates its underlying molecular mechanisms.
Methods:
Potential targets of AG and TNBC-related genes were identified through public databases. By intersecting drug-specific and disease-related targets, key genes were selected for further analysis. Differential gene expression profiling and Weighted Gene Co-expression Network Analysis (WGCNA) were performed. Functional enrichment analysis was conducted using Gene Ontology (GO) and Kyoto Encyclopedia of Genes and Genomes (KEGG). Machine learning algorithms were employed to identify hub genes, followed by validation through molecular docking, molecular dynamics (MD) simulations, and surface plasmon resonance (SPR) assays. In vitro experiments including cell viability assays, cell cycle analysis, apoptosis detection, and Western blotting were performed on MDA-MB-453 and MDA-MB-231 cell lines.
Results:
Our study identified 183 AG-related targets, 5,193 differentially expressed genes, and 6,173 co-expression module genes associated with TNBC. Machine learning algorithms pinpointed 4 hub genes from 28 intersecting targets. Molecular docking, Molecular dynamics (MD) and surface plasmon resonance (SPR) indicated a moderately strong interaction between AG and SRC kinase, where the oxygen atom of AG forms hydrogen bonds with the oxygen atom in M341 and the nitrogen atom in G344 of SRC. In vitro experiments confirmed that AG reduced the viability of MDA-MB-453 and MDA-MB-231 cells in a concentration-and time-dependent manner, leading S phase arrest and apoptosis. Western blotting indicated that AG significantly reduced the levels of Bcl-2, caspase-3, and caspase-9, as well as decreased SRC, p-PI3K-p85, p-AKT1, p-MEK1/2, and p-ERK1/2 expression in TNBC cells in a concentration dependent manner.
Conclusion:
AG exerts anti-TNBC effects by directly binding to SRC kinase, concurrently inhibiting both PI3K/AKT and MEK/ERK signaling pathways, ultimately leading to cell cycle arrest and apoptosis.
Introduction
Detection and intervention at the early stages have been identified as effective treatment options for breast cancer. However, recent reports indicate that the incidence and mortality rates of breast cancer remain high (Chlebowski et al., 2024). The International Agency for Research on Cancer reported that, in 2020, breast cancer emerged as the most prevalent type of malignant tumor, with 2.26 million new cases and an approximate mortality rate of 30% worldwide (Sung et al., 2021).
The difficulty in treating triple-negative breast cancer (TNBC) is derived from the high malignancy and recurrence rate, increasing risk of distant metastasis and mortality, as well as poor prognosis. TNBC accounts for 15%–20% of overall breast cancer incidence, commonly occurring in premenstrual women (Lin et al., 2023). Genetic profiles have demonstrated the negative expression of estrogen receptors (ERs), progesterone receptors (PRs), and human epidermal growth factor receptor 2 (HER-2) in TNBC. This molecular heterogeneity contributes to the scarcity of therapeutic targets and the insensitivity of TNBC to endocrine therapy (Karim et al., 2023). Current chemotherapies targeting TNBC are associated with a range of side effects, including cardiotoxicity, bone marrow suppression, and neurological and gastrointestinal damage, which can lead to poor patient compliance and diminished quality of life. Additionally, drug resistance often results in clinical failures, limiting the long-term use of chemotherapy (De Las Rivas et al., 2021). Hence, discovering potential inhibitors to block the proliferation and metastasis of tumor cells might shed light on TNBC treatment.
Arctigenin (AG) is one of the major bioactive ingredients extracted from the Chinese herbal medicine Arctium lappa L., a common spice belonging to the Asteraceae family, as identified by Japanese researchers. AG is pharmacologically functional in anti-inflammation, antiviral, anti-tumor, immunomodulation, and neuroprotection. In 1994, Hirano et al. (1994) reported the similar inhibiting bioaction of AG as classical anticancer agents on the proliferation of HL-60 cells in vitro, which present a relatively broad spectrum, including leukemia, prostate cancer, colon cancer, breast cancer, etc. AG exerts antitumor effects by blocking the cell cycle, inducing apoptosis and autophagy, yet low cytotoxic to normal cells, suggesting its potential as a therapeutic agent (Hyam et al., 2013; Tsai et al., 2011; Zhao et al., 2020). AG and its metabolites have garnered increasing attention in the treatment of breast cancer due to the high affinity of its phytohormone metabolites for ERs, which inhibit the bioactivity of estrogen. It could be combined with tamoxifen in the endocrine therapy of breast cancer, inducing apoptosis in tumor cells by down-regulating ERs and mTOR signaling pathways (Maxwell et al., 2018). Furthermore, studies conducted in 2020 suggested that AG induced DNA damage in HER-2 overexpressing breast cancer cells, indicating its potential efficacy against HER-2-positive breast cancer (Lee et al., 2021).
Network pharmacology has emerged as a robust approach to address these challenges by integrating gene expression data, molecular targets, and pathway analyses to predict compound-disease interactions across multiple biological targets (Nogales et al., 2022). This systems biology approach provides a holistic framework for identifying potential therapeutic targets and understanding the multifaceted actions of bioactive compounds. In this study, we utilized network pharmacology coupled with molecular docking to identify the key targets and mechanisms through which AG exerts its bioactivity, followed by experimental validation in human TNBC cell lines. Among the hub genes zidentified through machine learning, SRC emerged as a focal point of our investigation. SRC, plays a pivotal role in regulating key processes such as cell migration, invasion, and angiogenesis, which are critical for the aggressive nature of TNBC (Dehm and Bonham, 2004). The involvement of SRC in these processes, coupled with its established role in the progression of various malignancies, made it an ideal candidate for further exploration as a therapeutic target in the context of TNBC. The research process is shown in Figure 1.
FIGURE 1

Flowchart of overall methodology used to predict the anti-cancer effect of AG for TNBC.
Materials and methods
The databases
We have used public databases in this study and the details are listed as follows:
PubChem (https://pubchem.ncbi.nlm.nih.gov/, accessed on 10 April 2024; CID for AG: 64981).
SwissTargetPrediction (http://www.swisstargetprediction.ch/, accessed on 10 April 2024; version: 2023 release).
Pharmmapper (http://www.lilab-ecust.cn/pharmmapper/, accessed on 10 April 2024; pharmacophore model version: 2014 update).
Uniprot (https://www.uniprot.org/, accessed on 10 April 2024; database release: 2024.01).
TCGA (https://portal.gdc.cancer.gov/, accessed on 10 April 2024; project: TCGA-BRCA, data release: v36).
RCSB Protein Data Bank (PDB) (http://www.rcsb.org/, accessed on 14 April 2024; data retrieved from release archive version dated 10 April 2024).
Acquisition of relevant targets of AG
A PubChem search was conducted using “Arctigenin” to obtain its structural formula and retrieve the SMILES. Subsequently, the MOL2 file was imported into PharmMapper and the SMILES file into the SwissTargetPrediction database to predict the corresponding target proteins of AG. After that, the acquired drug targets were annotated using the UniProt databases.
Acquisition of AG-TNBC-related targets
Transcriptome and clinical data samples of breast cancer patients were sourced from the TCGA database, including 1,109 tumor and 113 normal breast tissue samples. After filtering samples with negative results for estrogen receptor (ER), progesterone receptor (PR), and human epidermal growth factor receptor 2 (HER2), a total of 124 TNBC samples and 113 normal samples were selected. Differentially expressed genes (DEGs) associated with TNBC were identified using the DESeq2 package in R software (version 4.1.3), applying the criteria of: |log2 fold change (FC)| ≥ 1 and adjusted p-value <0.05 (Zhu et al., 2024). The DEGs were visualized through a volcano plot and a heat map, created using the Pheatmap and ggplot2 packages, respectively.
Weighted gene co-expression network analysis (WGCNA) was performed to identify co-expression modules (Langfelder and Horvath, 2008). To enhance result robustness, the top 25% of the most significant DEGs were included in the WGCNA (Zeng et al., 2024). The expression data was first normalized through the normalizeBetweenArrays function, and genes with low variance, specifically those with a standard deviation below 0.5, were excluded (Bourgon et al., 2010). To enhance network reliability, hierarchical clustering and static tree cutting techniques were applied to remove outlier samples. The pickSoftThreshold function was then employed to assess the fit of the scale-free topology model (R2) and the average connectivity across various soft-thresholding powers. The ideal soft-thresholding power was determined using the criterion of R2 ≥ 0.9, which was applied to create a weighted adjacency matrix (Zhang and Horvath, 2005). Following this, both a weighted adjacency matrix and topological overlap matrix (TOM) were constructed, leading to hierarchical clustering and dynamic tree cutting to delineate gene modules. Modules were merged based on eigengene correlation threshold of 0.25. The correlation between module eigengenes and clinical traits was evaluated via Pearson correlation, and genes with high module membership (MM) and gene significance (GS) were retained for further analysis (Miller et al., 2011; Yip and Horvath, 2007). By using a Venn diagram to intersect DEGs, WGCNA-derived TNBC-related targets, and AG drug targets, several genes were identified as promising therapeutic candidates for TNBC treatment.
Functional enrichment analysis
To elucidate the biological functions and key signaling pathways implicated in AG-mediated treatment of TNBC, Gene Ontology (GO) and Kyoto Encyclopedia of Genes and Genomes (KEGG) pathway enrichment analyses were performed on the overlapping target genes using the clusterProfiler package (version 4.1.3) in R software (Ashburner et al., 2000; Kanehisa and Goto, 2000). Significantly enriched terms were selected by applying a threshold of p-value <0.05 and subsequently ranked in descending order based on their enrichment scores.
Determination of hub genes with machine learning
Three machine learning algorithms—least absolute shrinkage and selection operator (LASSO), support vector machine-recursive feature elimination (SVM-RFE), and random forest (RF)—were employed to identify hub genes among overlapping target genes (Bao et al., 2023; Sanz et al., 2018; Tang et al., 2023), aiming to selecting genes capable of distinguishing TNBC patients from healthy controls.
For SVM-RFE, a recursive feature elimination framework based on a linear kernel was executed using the e1071 package in R (Huang et al., 2018). The gene expression data underwent z-score normalization, and binary labels were assigned to the groups (Normal vs. TNBC). Feature ranking was conducted using linear SVMs, with the cost parameter set to 10 and the scaling turned off. The elimination process was directed by the squared weight coefficients. A 10-fold stratified cross-validation scheme was employed, batch elimination of 50% was applied when the number of remaining features exceeded 50. Hyperparameter optimization was performed via grid search across gamma = 2^ (−12:0) and cost = 2^ (−6:6) (Huang et al., 2017). The selection of the optimal feature subset was based on achieving the lowest classification error during cross-validation.
In our analysis using LASSO regression, we employed the glmnet package in R (v4.1.3) to construct a binomial logistic model featuring with L1 regularization (alpha = 1) (Friedman et al., 2010). Z-score normalization was applied to gene expression values, and sample groups were binarized. 10-fold cross-validation was used to identify the optimal regularization parameter (lambda.min), defined as the value yielding the lowest mean cross-validated deviance. Genes with non-zero coefficients at lambda. min were selected as potential biomarkers.
The randomForest package (Garge et al., 2013) was utilized to implement the RF model. The model was initially set up with 1,000 trees (ntree = 1,000) using the default parameters. To evaluate the model’s effectiveness, out-of-bag (OOB) error estimates were used, and the ideal number of trees was identified by finding the lowest OOB error. The significance of genes was assessed through the mean decrease in the Gini index, leading to the selection of the highest-ranked genes for further analysis.
Hub genes were identified through the intersection of results derived from three distinct machine learning algorithms. This was followed by an analysis using Receiver Operating Characteristic (ROC) curves to assess their predictive capabilities, along with correlation and differential expression studies to confirm their significance in AG interactions.
Molecular docking
The 2D structure of AG was drawn using ChemBioDraw 2014, and its energy minimization was optimized by Chem 3D 2014. The 3D structure of the human kinase proteins were downloaded from the RCSB Protein Data Bank (PDB IDs: 4MXO, 3OP3,8JG8 and 3DB6) (Elling et al., 2008; Levinson and Boxer, 2014; Tang et al., 2024; Tsytlonok et al., 2019). Ligand preparation was performed using the Schrödinger LigPrep module (Schrödinger, LLC, New York, NY, 2018) with the OPLS_2005 force field. The docking box center was defined as the centroid of the original ligand. For the docking task, the standard precision (SP) docking mode of Glide (Friesner et al., 2004; Friesner et al., 2006; Halgren et al., 2004; Yang et al., 2021) was used with the default docking parameters.
Molecular dynamics
Molecular dynamics (MD) was stimulated by AMBER 22 (Case et al., 2005) for the selected ligand-target complex. The AMBER14SB force field (Maier et al., 2015) was used for protein, and the force field parameters of AG were generated based on the general AMBER force field (Wang et al., 2004) by antechamber. The TIP3P water model was used in an octahedral model, with a minimum 12 Å distance between the protein surface and box boundary. Sodium were then added to neutralize the system. Each simulation system was initially energy-minimized to optimize unreasonable atomic contacts and stereochemical conflicts by applying position restraints (force constant of 5.0, 1.0, and 0 kcal·mol−1·Å−2, respectively) on the backbone atoms and AG. Subsequently, the solvent was heated to 300 K in 50 ps with all solute atoms restrained with a force constant of 10.0 kcal·mol−1·Å−2. Next, two 50 ps equilibration steps were done in the NPT ensemble with temperature and pressure (1 bar) control by the Langevin thermostat and Berendsen barostat method. Periodic boundary conditions were applied to eliminate boundary effects. All solute atoms were restrained with force constants of 1.0 and 0.5 kcal·mol−1·Å−2. The production run, with no restraints, was performed for 200 ns. Electrostatic interactions were calculated by the particle mesh Ewald (PME) (Poier et al., 2023). The cutoff distance for nonbonded interactions was 8 Å. The SHAKE algorithm was used to constrain bonds involving hydrogens. The integration time step was set to 2 fs, and conformations were sampled every 10 ps for subsequent analysis.
MM/GBSA calculations
To acquire more statistically significant results, the binding free energy between SRC and AG was calculated for the 50 ns of MD trajectories every 0.5 ns via the conventional MM/GBSA approach in AMBER tools according to procedures in our previous work (Guo et al., 2012). For each frame, the free energy was calculated for each molecular species (SRC-AG complex, SRC, and AG), and the binding free energy was computed as below (Chong et al., 2009; Kollman et al., 2000):where (Equations 1, 2) denotes the binding free energy, and it can be decomposed into two terms: (1) The free energy in a vacuum, is decomposed into the molecular mechanical energy () and the configurational entropy ( (Equation 3). is the summation of the intramolecular energy (, including bond, angle, and dihedral energies, which is 0 in this study), electrostatic energy (), and van der Waals energy () (Equation 4). The entropic contribution (), which is associated with the conformational entropy loss when a free-state ligand binds to the corresponding unbound-state receptor; (2) the solvation energy (), which is composed of the polar () and non-polar contributions () (Equation 5).
Surface plasmon resonance (SPR)
SRC protein (MedChemExpress, New Jersey, United States) was diluted to 2 μg/mL with acetate solutions at pH4.5, pH5.0, and pH5.5, respectively. The protein was immobilized on the chip with acetate solutions at pH4.5 and a concentration of 18 μg/mL. One channel of SRC was immobilized before coupling the ligand, the chip was activated for 420 s. The coupling was stopped when the amount reached 13800 RU. Ligand coupling was completed after blocking the chip for 420 s. The actual immobilized amount was 11700 RU. Analyte AG was prepared as the solution with concentrations of 800, 400, 200, 100, 50, 25, 12.5, 6.25, 3.125, and 1.5625 μM by gradient dilution. Multi-cycle kinetics runs were performed with a period of association of 120 s and dissociation of 240 s. The buffer contained 1xPBS (pH 7.4), 0.05% Tween-20, and 5% DMSO. The raw data was imported into BiacoreTM Insight Evaluation Software 4.0, and the multi-cycle kinetics evaluation method was selected for calculating kinetic rate constants. The curve was fitted by the 1:1 binding model with data from 5 chosen concentrations. The association rate constant (Ka), dissociation constant (Kd), and affinity constant (KD) were acquired.
Cell culture and treatment
MDA-MB-453 cell line and MDA-MB-231 cell line purchased from the National Infrastructure of Cell Line Resource (NICR, Beijing, P.R. China). The cells lines were cultured in RPMI-1640 medium, supplemented with 10% (v:v) of fetal bovine serum (FBS; Biological Industries, Kinneret, Israel) and 1% penicillin-streptomycin solution (Hyclone|Cytiva, Marlborough, United States) at 37 °C in a 5% CO2 incubator.
Cell viability assay
Cell viability was evaluated by Cell Counting Kit-8 (CCK8 assay; MedChemExpress, New Jersey, United States). MDA-MB-453 and MDA-MB-231 cells were seeded into 96-well plates (3 × 10⁴ per well) and pre-cultured for 24 h, then incubated in 200 μL complete medium containing AG (0, 100, 200, 300, 400, and 500 μM) for 24 h, 48 h or 72 h. Subsequently, CCK8 solution was added to each well and incubated in the dark at 37 °C for 1 h. The absorbance was measured at 450 nm on a microplate reader (Eon Microplate Spectrophotometer, BioTek, United States). All experiments were repeated thrice independently. Cell viability (%) = .
Cell cycle analysis
The cell cycle was assessed using a PI staining kit (KeyGEN BioTECH, Nanjing, P.R. China) following the manufacturer’s instructions via flow cytometry. After incubating with PI/RNase A for 45 min in the dark, the cells were conducted using a flow cytometer (Cytoflex, Beckman, United States). Software Modfit LT was employed for cell cycle distribution analysis. A total of 20,000 events from each cell sample were obtained. All experiments were repeated thrice independently.
Caspase-3 activity analysis
GreenNuc™ caspase-3 Assay Kit for Live Cells (Beyotime, Shanghai, P.R. China) was subjected to caspase-3 activity analysis following the manufacturer’s instructions. After incubation at room temperature for 30 min, a fluorescence microscope (OBSERVER D1/AX10 cam HRC, Zeiss, Germany) was used to observe green fluorescence.
Mitochondrial membrane potential (MMP) analysis
MMP assay kits with JC-1 (Beyotime, Shanghai, P.R. China) were purchased to detect MMP of MDA-MB-453. The fluorescence signals of AG-treated or untreated cells were detected via flow cytometry. All experiments were repeated thrice independently.
Apoptosis analysis
Apoptosis was assessed by an annexin V-FITC/PI staining kit (KeyGEN BioTECH, Nanjing, P.R. China) following the manufacturer’s instructions. After incubating with 5 μL Annexin V-FITC and 5 μL PI for 15 min in the dark, the cells were conducted using a flow cytometer (Cytoflex, Beckman, United States) and analyzed by software FlowJo V10. A total of 20,000 events from each cell sample were obtained. All experiments were repeated thrice independently.
Western blot analysis
Total proteins were lysed from AG-treated cells (100, 300, and 500 μM) or untreated cells in RIPA buffer with the protease inhibitor cocktail and PMSF (Beyotime, Shanghai, P.R. China). The concentration of proteins in each group was tested by the BCA Protein Assay Kit (Beyotime, Shanghai, P.R. China). Protein extracts were quantitated and loaded on 8%–12% sodium dodecyl sulfate-polyacrylamide gel, then electrophoresed and transferred onto a PVDF membrane (Beyotime, Shanghai, P.R. China), which was blocked in 5% skimmed milk for an hour. The membranes were incubated with primary antibody overnight at 4 °C. The primary antibodies used were anti-caspase-3, anti-caspase-9, anti-Bax, anti-Bcl-2, anti-CDK2, anti-cyclin A2, Anti-P27, anti-SRC, anti-AKT1, anti-pAKT1, anti-ERK1/2, anti-pERK1/2, anti-PI3K(p85), anti-p-PI3K(p85), anti-MEK1/2, anti-p-MEK1/2and anti-β-actin antibodies (human anti-rabbit, 1:1,000; CST, Massachusetts, United States). Then, the membranes were washed and incubated with horseradish peroxidase (HRP)-conjugated secondary antibody (Goat anti-rabbit, 1:100; ZSGB-BIO, Beijing, P.R.China) for 1 h. The positive signal on the membranes was detected by an enhanced chemiluminescence detection kit (Beyotime, Shanghai, P.R. China). Band intensities were scanned and quantified by NIH ImageJ software.
Statistical analysis
Data were presented as the mean ± SD. Differences between data groups were evaluated using the one-way analysis of variance followed by the Dunnett test, using GraphPad Prism 8 software. P < 0.05 was considered as a statistically significant result.
Result
Screening of target predictions
The molecular structure is depicted in Figure 2a, and a total of 183 potential targets for AG were identified on the PharmMapper and Swiss Target Prediction database (Supplementary Table S1). Differential expression analysis of the TCGA dataset revealed 5193 DEGs, which were visualized using a heatmap and a volcano plot (Figures 2b,c; Supplementary Table S1). To explore the molecular mechanisms underlying TNBC, we constructed a gene co-expression network via WGCNA. The scale-free topology fit index (R2) and mean connectivity were assessed with the pickSoftThreshold function across a range of powers (β = 1–20). As shown in Figure 2d, the R2 value surpassed the recommended threshold of 0.90 at a power of 3, while maintaining acceptable mean connectivity, justifying its selection as the ideal soft-threshold for network construction. Genes were clustered and partitioned into modules using the dynamic tree cut method (Figure 2e), resulting in 12 distinct gene modules, with the cluster dendrogram shown in Figure 2f. Additionally, a network heatmap was created to visualize the correlations among genes within each module (Figure 2g). Subsequently, the analysis of module-trait relationships indicated that the turquoise module had the strongest association with tumor/normal control phenotypes (Figure 2h), showing a significant positive correlation (cor = 0.997) between gene significance for TNBC and module membership (Figure 2i). These results suggest that the 6173 genes in the turquoise module are associated with TNBC and may serve as a reservoir of candidate genes for further prioritization (Supplementary Table S1). By intersecting the DEGs, WGCNA key module genes, and the predicted targets of AG, we identified 28 overlapping genes (Figure 2j; Supplementary Table S1), proposed as potential therapeutic targets for AG in TNBC treatment.
FIGURE 2
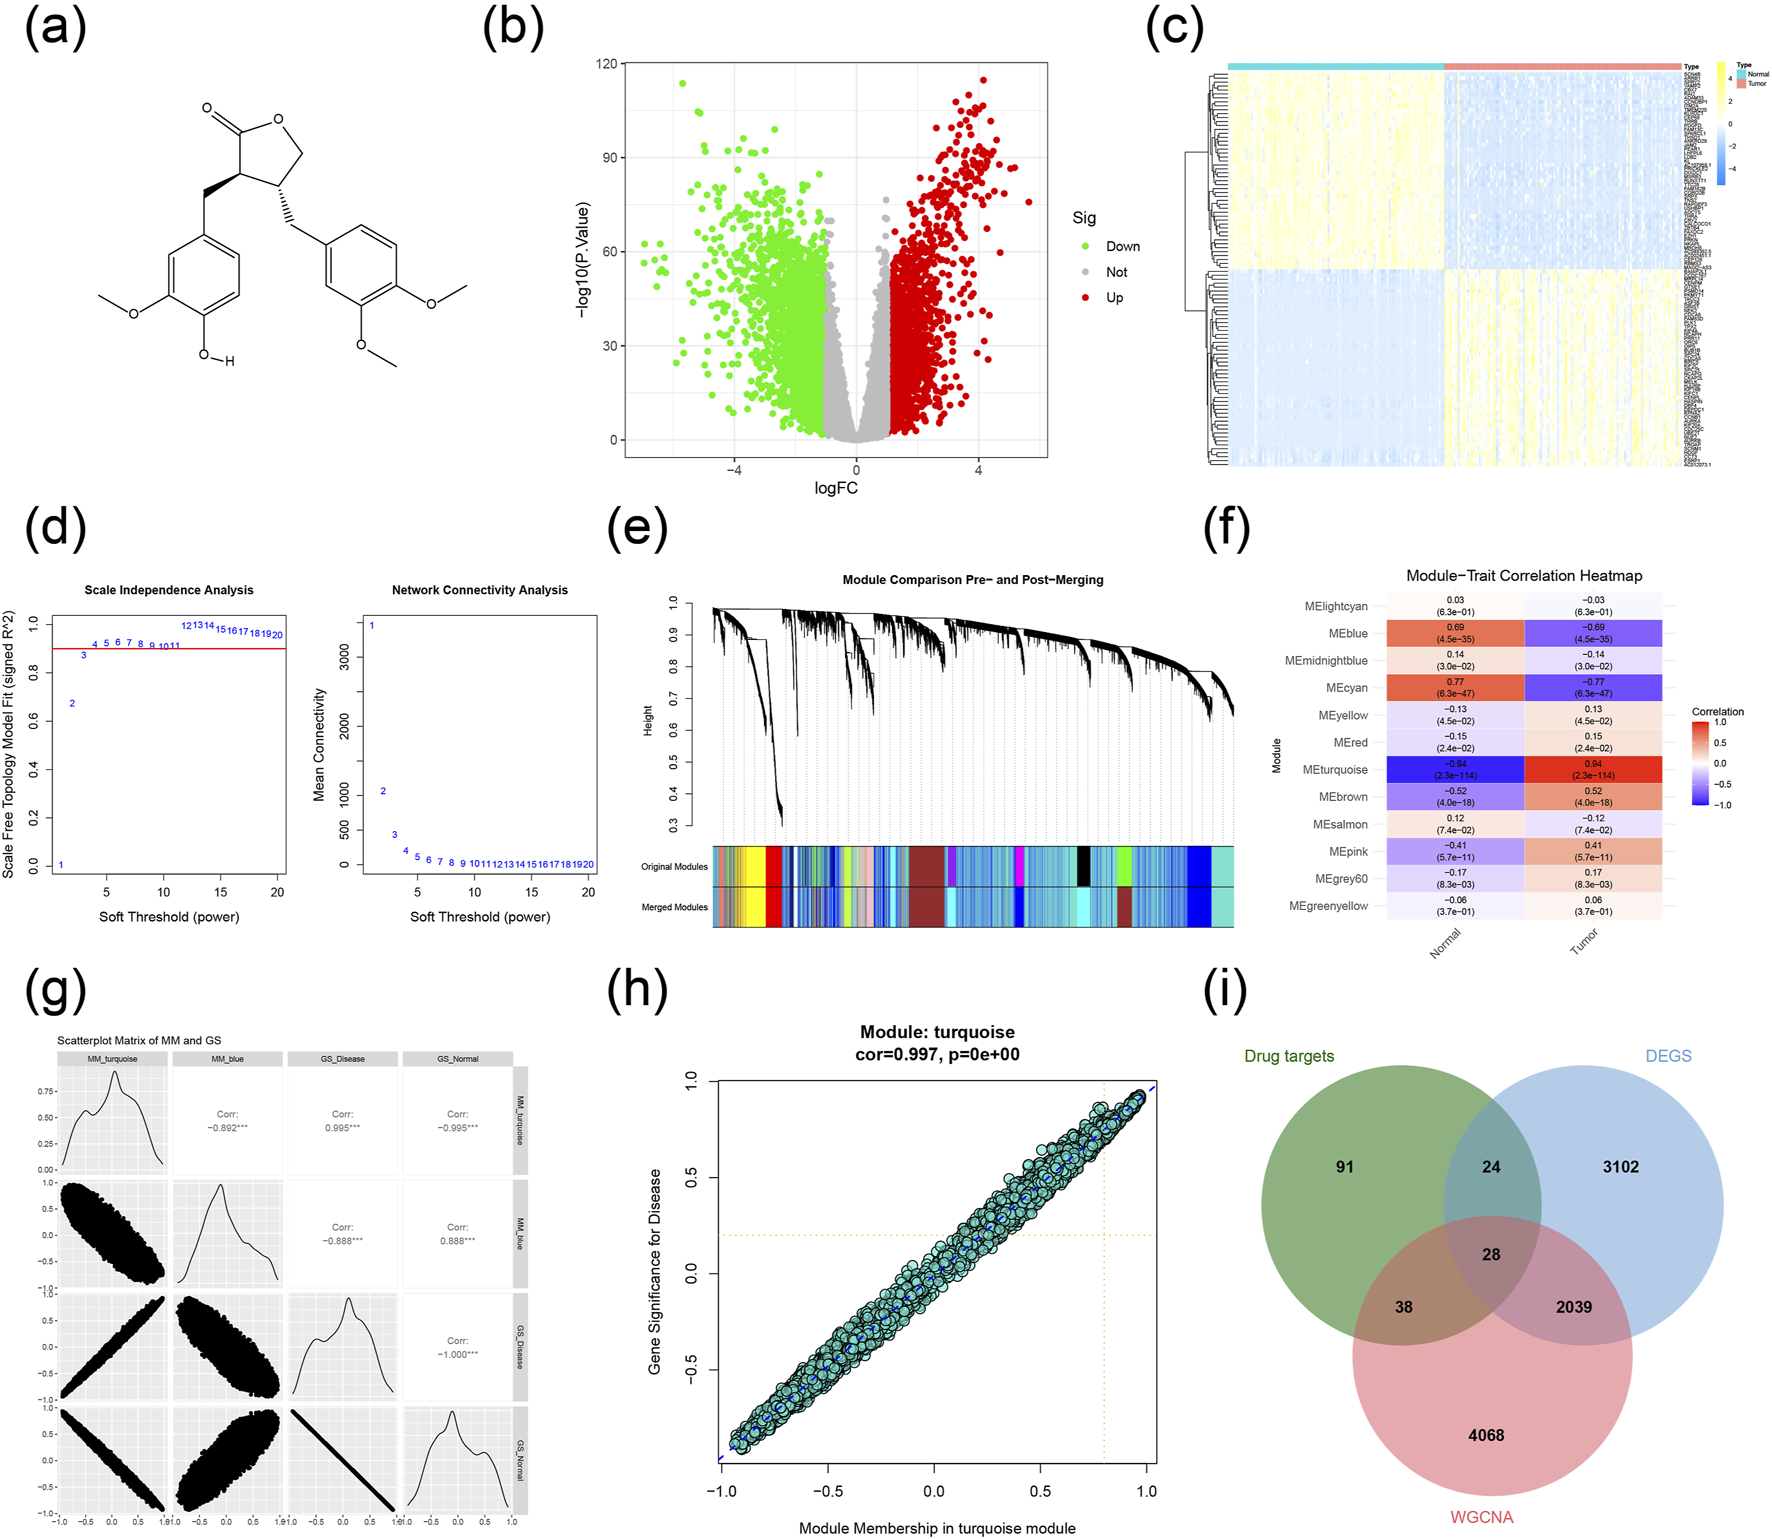
Construction of target network and acquisition of key genes. (a) Structural formula of AG. (b) Differential expression analysis of the TCGA dataset. (c) Heatmap of DEGs showing the top 50 genes. (d) Scale independence and mean connectivity of WGCNA. (e) Cluster dendrogram and separation of gene modules of WGCNA. (f) Diagram of module-trait relationship for the 12 modules. (g) Scatterplot matrix of MM and GS. (h) catterplot of GS for TNBC vs. MM of the turquoise module. (i) Key genes for the action of AG.
GO enrichment and KEGG pathway analysis
We performed GO and KEGG pathway enrichment analyses on these 28 intersecting target genes. The GO analysis results are presented in Figure 3a. The potential target genes were predominantly enriched in the following biological process (BP) terms: positive regulation of the cell cycle, G2/M transition of mitotic cell cycle, cell cycle G2/M phase transition, regulation of G2/M transition of mitotic cell cycle, regulation of nuclear division, and regulation of the cell cycle G2/M phase transition. Regarding cellular components (CC), the enriched entries included the spindle pole, spindle microtubule, spindle, spindle midzone, and mitotic spindle pole. For molecular functions (MF), the enriched terms included protein serine/threonine kinase activity, protein serine kinase activity, transmembrane receptor protein tyrosine kinase activity, histone kinase activity, and protein tyrosine kinase activity. In addition, based on the KEGG pathway enrichment analysis, these intersecting target genes were mainly enriched in signaling pathways such as the Cell cycle, Progesterone-mediated oocyte maturation, Oocyte meiosis, EGFR tyrosine kinase inhibitor resistance, and Gap junction (Figure 3b).
FIGURE 3
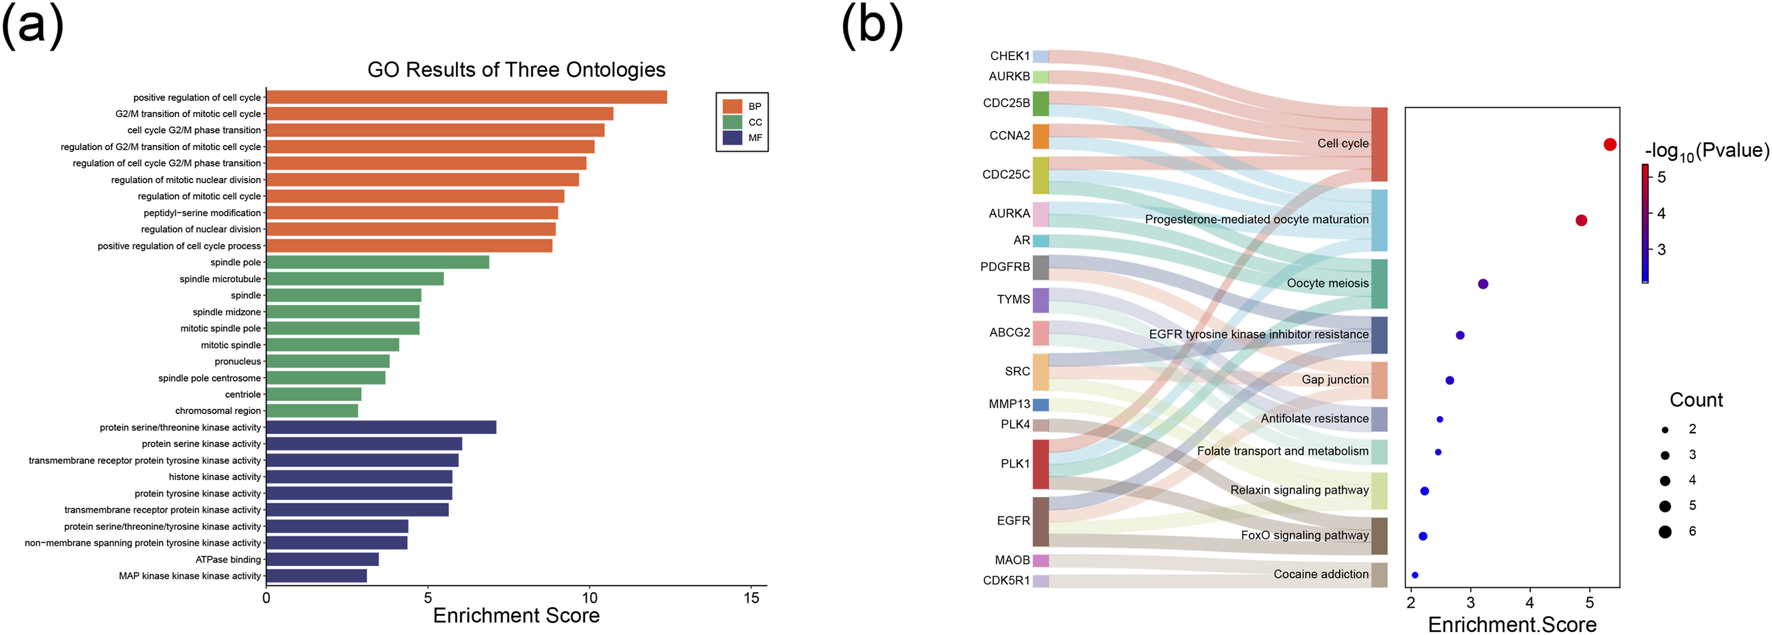
Functional enrichment analysis of key genes in TNBC. (a) Bar plot from the GO analysis. (b) Sankey-bubble plot from the KEGG analysis.
Determination of target hub genes with machine learning
To further determine the critical hub genes in TNBC treatment using AG, we set the capability to discriminate between TNBC samples and non-TNBC samples in the TCGA dataset as the evaluation criterion and filtered the 28 intersecting target genes using three machine learning algorithms. We narrowed down 28 overlapping target genes through the application of three machine learning techniques (Supplementary Table S2). The SVM-RFE method revealed 23 core target genes (Figures 4a,b). Meanwhile, LASSO analysis highlighted 13 of the 28 genes as significant core targets (Figures 4c,d). The RF algorithm provided variable importance scores for all potential target genes, leading to the identification of 10 core genes based on these scores (Figures 4e,f). By computing the intersection of these machine-learning-predicted core target genes, 4 genes (AURKA, SRC, PLK1, and CDC25C) were identified as the target hub genes for TNBC treatment with AG (Figure 4g). Subsequently, we conducted gene expression analyses on different samples for these five target hub genes (Figure 4h). The results showed that these genes are closely interrelated, with their expression levels significantly higher in TNBC tissues compared to non-TNBC tissues. To explore the diagnostic efficacy of the 4 hub genes, ROC curve analysis was performed, with hub genes exhibiting an AUC value >0.7 considered diagnostic markers. In the TCGA dataset, the AUC values were 0.833 for SRC, 0.994 for AURKA, 0.983 for CDC25C, and 0.989 for PLK1 (Figure 4i).
FIGURE 4
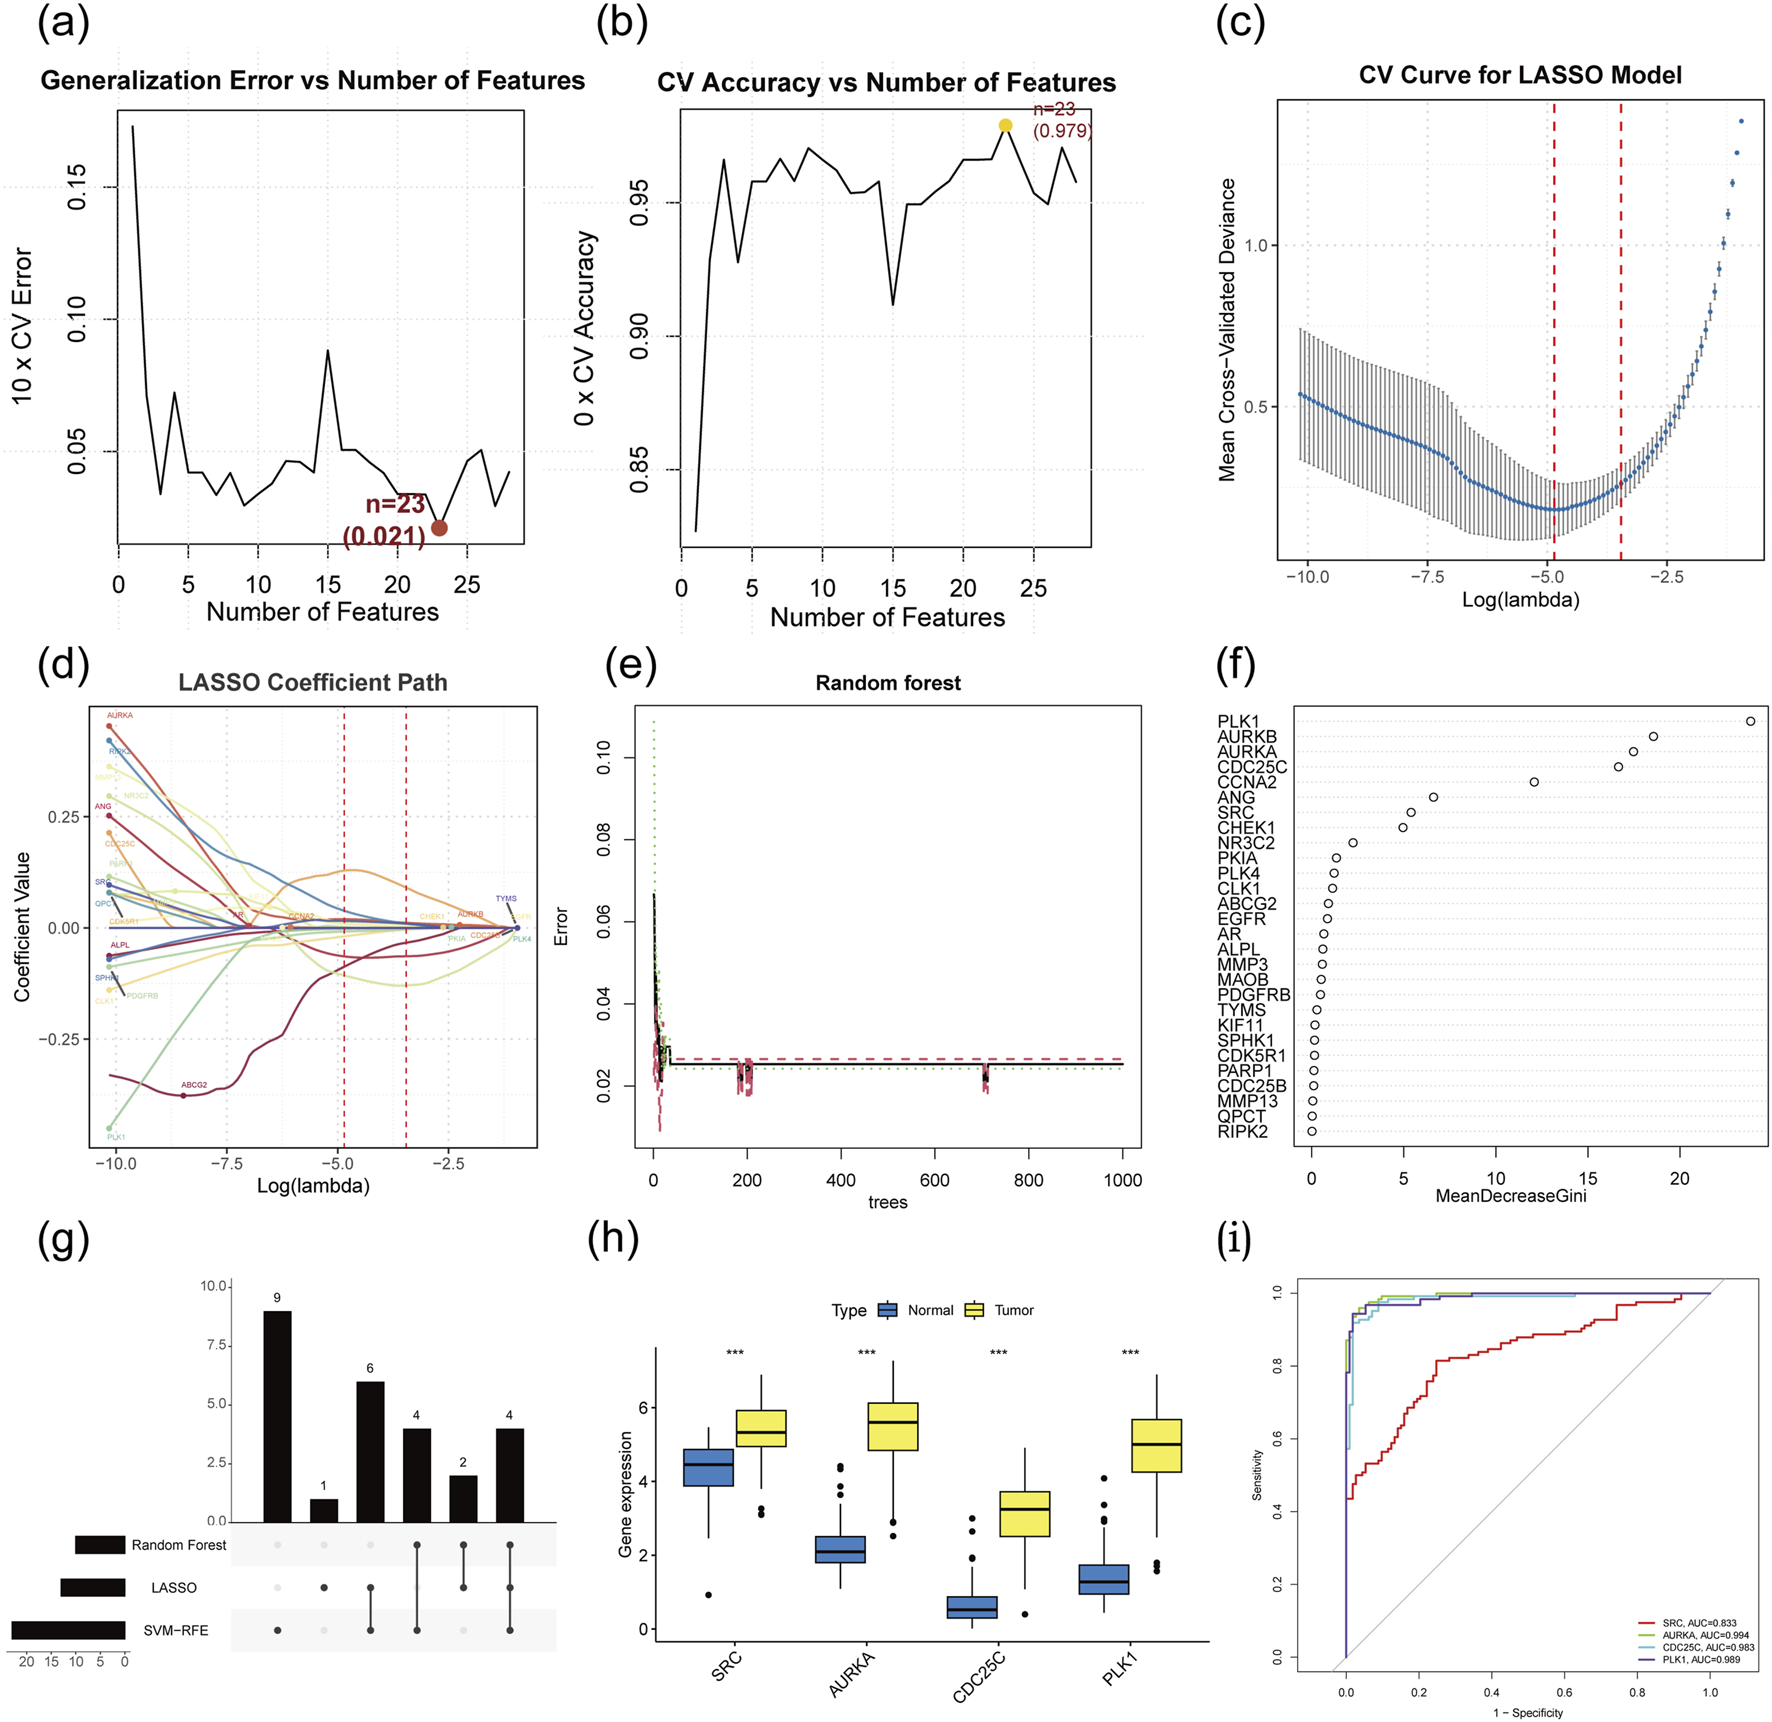
Determining target hub genes through machine learning algorithms. (a) Error rate curves of 5-fold cross-validation of SVM-RFE algorithm. (b) Accuracy rate curves of 5-fold cross-validation of SVM-RFE algorithm. (c) Coefficients diagrams of Lasso analysis. (d) Cross validation curve for Lasso. (e) Error rate curve of RF method. (f) Variable importance value of RF method. (g) Hub genes identification from three machine learning algorithms. (h) Expression analysis of the hub genes based on the TCGA dataset. (i) ROC curve of hub genes.
The keys targets of the AG-mediated
Molecular docking analysis was performed to validate the interaction between AG and the identified hub genes, with the most prominent binding interactions visualized in Figures 5a-d. According to established criteria, ligand-receptor binding affinities are considered biologically significant when the binding energy falls below −5 kcal/mol. Remarkably, AG demonstrated strong binding affinity with three critical targets: SRC (−7.777 kcal/mol), PLK1 (−7.690 kcal/mol), and AURKA (−7.685 kcal/mol), as detailed in Table 1. By integrating both docking scores and Glide emodel scores, SRC emerged as the most promising therapeutic target and was therefore prioritized for experimental validation. To validate the docking protocol, known SRC inhibitors were redocked, and the root mean square deviation (RMSD) values of the redocked structures compared to their original conformations in the protein data bank (PDB) were calculated. The RMSD values for PDB IDs: 1Y57, 2H8H, 3EL8, and 4MXO were found to be 1.94 Å, 1.08 Å, 0.80 Å, and 2.50 Å, respectively (Supplementary Table S3). These RMSD values can be used to assess the reliability of the docking method; generally, lower RMSD values (considered reliable when less than 2 Å, though it depends on the specific research system) indicate that the docking results are relatively credible, providing a methodological validation basis for subsequent molecular docking.
FIGURE 5
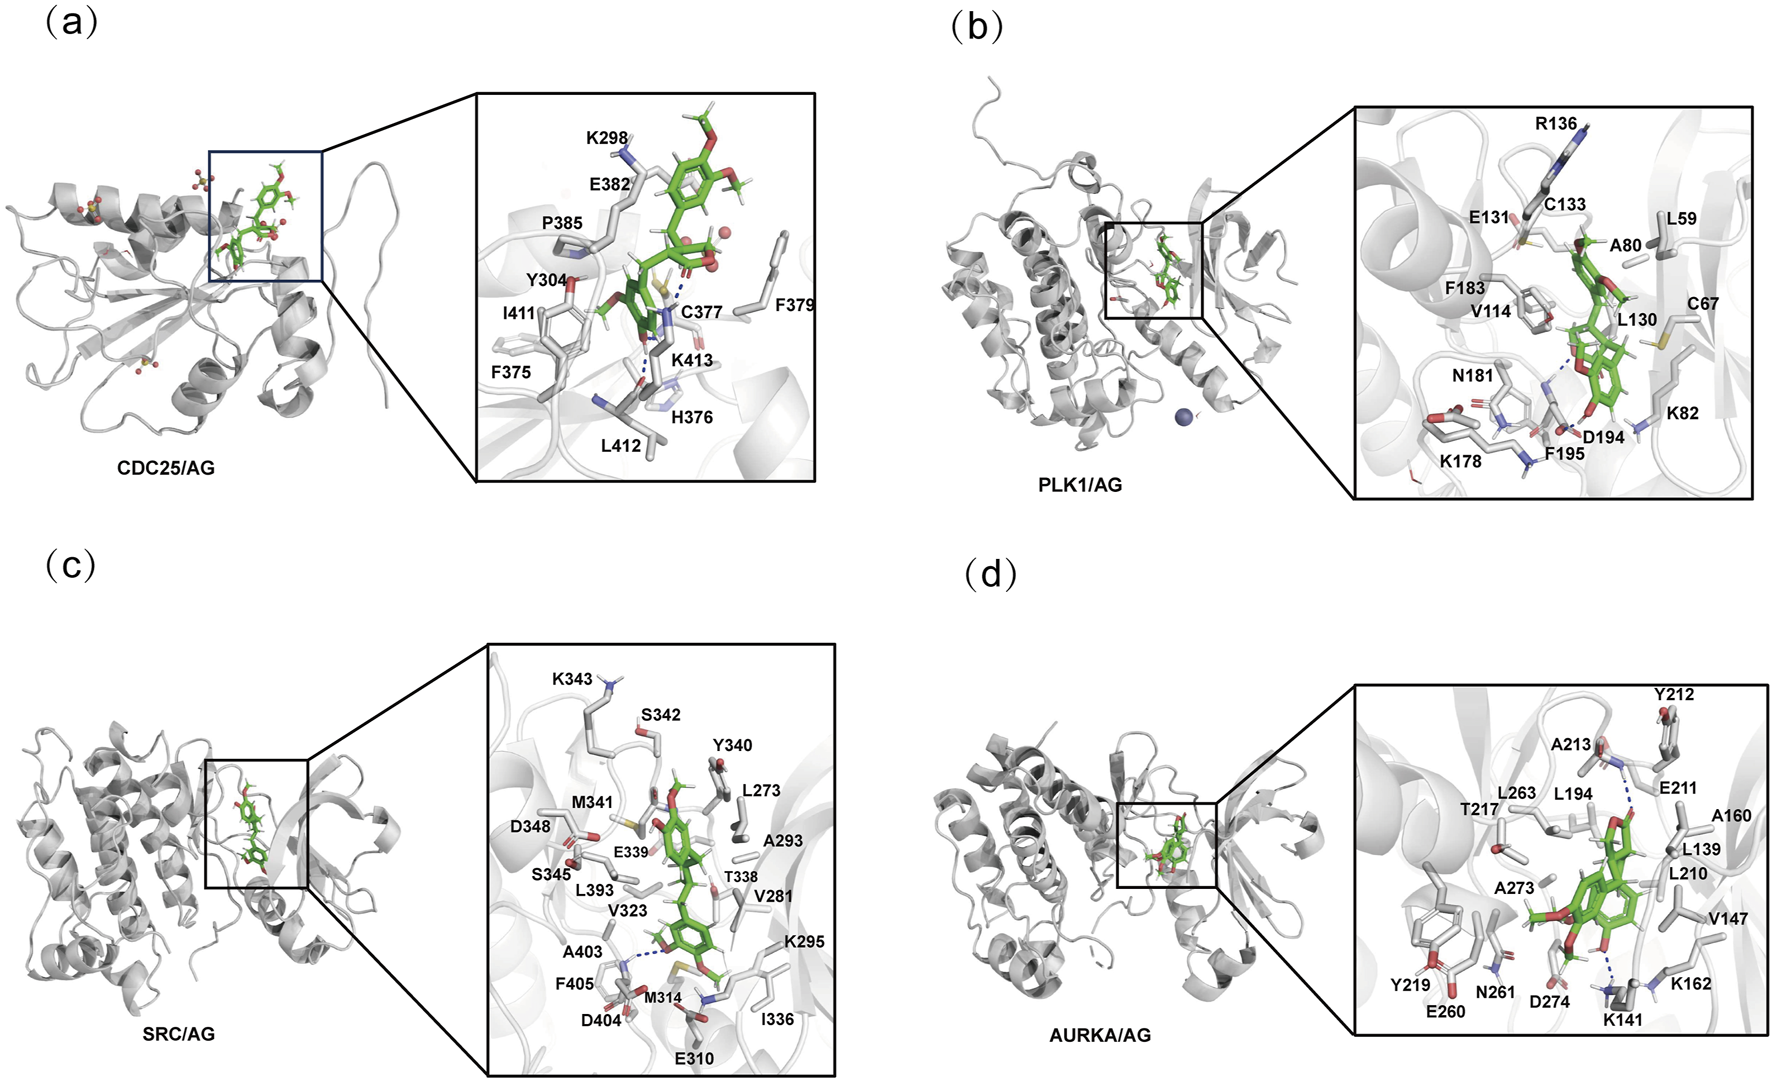
Molecular docking interactions of AG with hub genes. (a) Molecular docking interaction between AG and CDC25. (b) Molecular docking interaction between AG and PLK1. (c) Molecular docking interaction between AG and SRC. (d) Molecular docking interaction between AG and AURKA.
TABLE 1
| Proteins | Docking score | XP Gscore | Glide gscore | Glide emodel |
|---|---|---|---|---|
| CDC25 | −3.485 | −3.487 | −3.487 | −40.785 |
| SRC | −7.777 | −7.779 | −7.779 | −59.389 |
| PLK1 | −7.690 | −7.692 | −7.692 | −59.150 |
| AURKA | −7.685 | −7.686 | −7.686 | −57.497 |
Molecular docking results of AG with hub genes (kcal/mol).
To investigate the binding pattern of SRC and AG, MD simulations and SPR were conducted. The overall binding mode is shown in Figure 6a. The oxygen atom of AG forms hydrogen bonds with the oxygen atom in the M341 and the nitrogen atom in the G344 of SRC. The formation of these hydrogen bonds may influence the affinity of AG to SRC, thereby affecting its biological activity. The binding free energy provided showed the relative binding strengths of SRC-AG complex (Table 2). Using the MM/GBSA methods, the ΔEvdw was calculated to be −34.85 ± 5.19 kcal/mol for the SRC-AG complex, which contributed to the main part. On the other hand, the electrostatic energy was calculated to be −17.97 ± 5.35 kcal/mol. The total free binding energy was calculated to be −26.66 ± 3.75 kcal/mol for the complex. The binding free energy decomposition analysis identified key residues, as shown in Figures 6b,c. The analysis revealed specific key residues (per-residue contribution less than −1 kcal·mol−1) (7 residues), highlighting the role of amino acids such as G274, V281, M314, S345, G344, and L393 in recognizing AG.
FIGURE 6
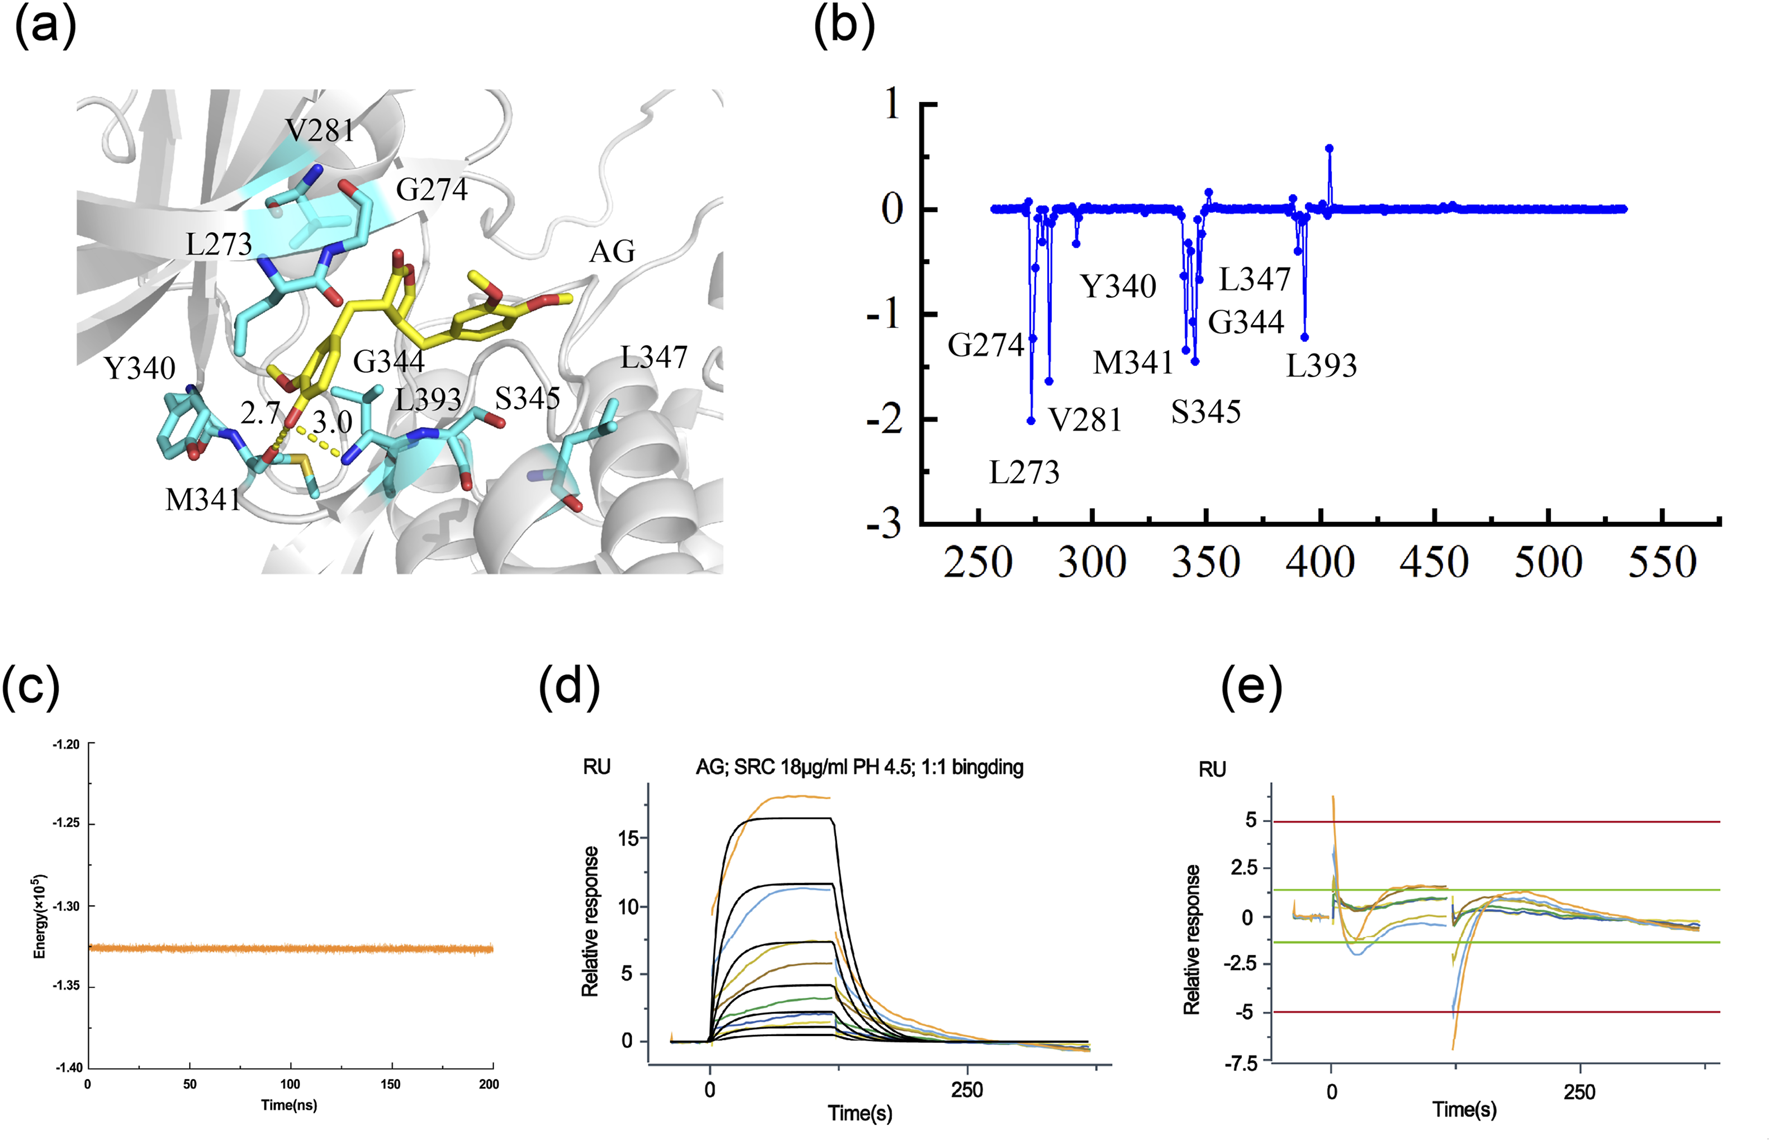
The binding mode of AG and SRC. (a) 3D binding mode of Arctigenin and 4MXO. (b) Analysis revealed specific key residues, per-residue contribution less than −1 kcal/mol. (c) RMSF analysis of AG with SRC. (d) Full SPR Sensorgrams of Src Protein Binding to AG. (e) Fitting Residuals of Src Protein Binding to AG.
TABLE 2
| Energy Component | ΔEvdw | ΔEele | ΔGpol,sol | ΔGnpol,sol | ΔGgas | ΔGsol | ΔGMM/GBSA |
|---|---|---|---|---|---|---|---|
| Contributions | −34.85 ± 5.19 | −17.97 ± 5.35 | 30.74 ± 2.90 | −4.58 ± 0.75 | −52.82 ± 0.75 | 26.16 ± 3.64 | −26.66 ± 3.75 |
The contributions of each energy term to the binding energy of AG with SRC (kcal/mol).
For a deeper investigation of the interaction between AG and SRC, SPR-based binding analysis was performed. The full SPR sensorgrams and corresponding fitting residuals are shown in Figures 6d,e, respectively. A 1:1 Langmuir binding model was employed for kinetic fitting, with a Chi-squared (χ2) value of 0.604 RU2 indicating a good fit. The kinetic parameters, detailed in Table 3, revealed that AG binds to SRC with an equilibrium dissociation constant (KD) of 71.8 μmol/L, an association rate constant (ka) of 6.95 × 10² M−1·s−1, and a dissociation rate constant (kd) of 4.99 × 10⁻² s−1. These values suggest a moderately strong binding affinity and validate the specific interaction between AG and SRC.
TABLE 3
| Immobilized ligand | Injection variables Analyte 1 solution | Quality kinetics Chi2 (RU2) | 1:1 binding ka (1/Ms) | kd (1/s) | KD (M) |
|---|---|---|---|---|---|
| SRC 18 μg/mL | AG | 6.04e−01 | 6.95e + 02 | 4.99e−02 | 7.18e−05 |
SPR kinetic parameters for the interaction between immobilized SRC and AG.
In vitro validation of AG treatment for TNBC
The cell viability of MDA-MB-453 cells incubated with a series of concentrations of AG for 12 h, 24 h, and 48 h was examined (Figure 7a). Compared with the control, the viability of AG-treated cells was negatively correlated with the concentrations of AG, as well as the duration of incubation. The AG-treated group showed a low G0/G1 ratio and an increased ratio of S-phase cells. No significant change was observed in the ratio of G2/M phase cells (Figure 7b), suggesting AG might induce cell cycle arrest to inhibit the proliferation of tumor cells by blocking the process of DNA replication. Similar inhibitory effects were noted in MDA-MB-231 cells as seen in MDA-MB-453. A marked decline in cell viability was observed with higher AG concentrations and extended treatment durations (Supplementary Figure S1a). Cell cycle analysis revealed that AG treatment led to a decrease in the G0/G1 phase cell population while increasing the S phase, with no significant changes in the G2/M phase (Supplementary Figure S1b). Expression of cyclins, CDK2, and Cyclin A2 decreased, while the level of P27 showed no significant change, suggesting AG-induced DNA replication arrest was CDK2/Cyclin A2-targeted (Figure 7c). Interestingly, we also found increased Cyclin E1 expression after AG treatment, which might have accounted for apoptosis (Figure 7d).
FIGURE 7
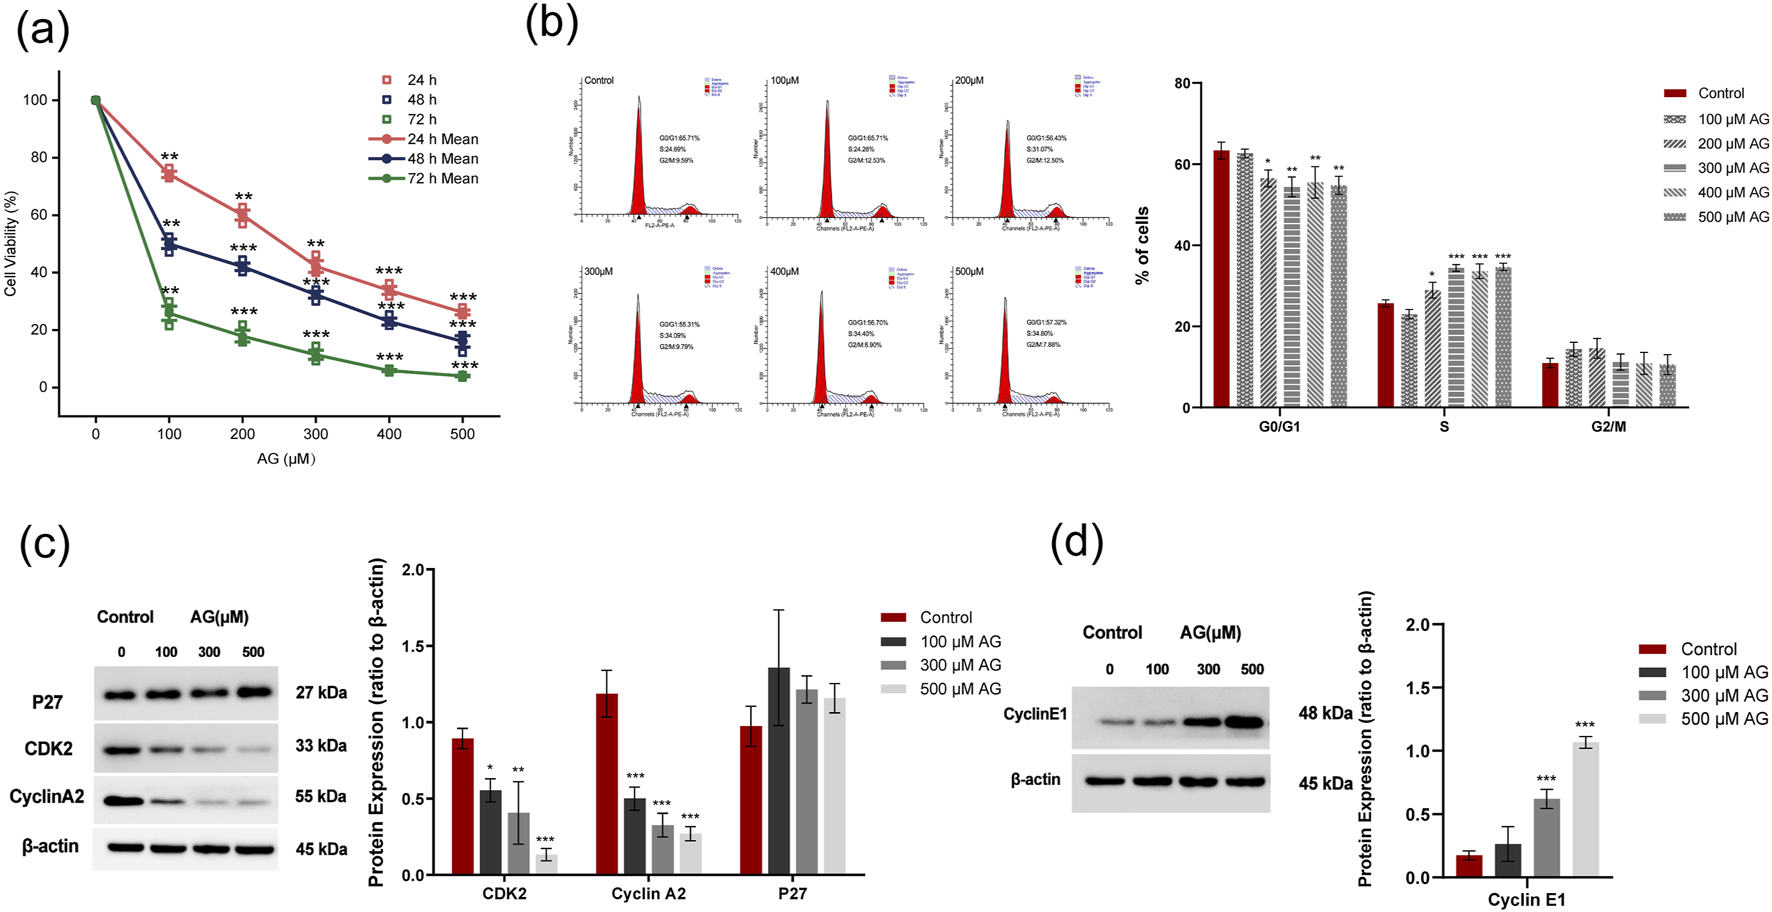
Effects of AG on the proliferation of MDA-MB-453 cells. (a) Cell viability was determined by CCK8 assay. (b) Cell cycle changes were analyzed by FACS based on PI staining. (c) Cells were incubated with various concentrations of Arctigenin for 48 h and tested the expression of CDK2, Cyclin A2, and P27 by Western blot. (d) Expression of Cyclin E1 examined by Western blot. ± s, n = 3, *, ** and *** indicate 0.01 < P < 0.05, P < 0.01 and P < 0.001 vs. untreated control.
To verify the AG-induced cytotoxicity, MDA-MB-453 cells were employed to apoptosis indications after AG incubation for 48 h. Detected MMP showed depolarization, andcaspase-3 activity was promoted, which both were AG concentration-dependent, suggesting the apoptosis event was AG-relevant (Figures 8a,b). The Annexin-FITC/PI-staining flow cytometry results showed that AG treatment increased death rate in a concentration-dependent manner (Figure 8c). It is worth noting that the number of cells treated with low concentrations of AG showed no significant differences in early apoptosis (100 and 200 μM) but mostly varied in late apoptosis or necrosis. Apoptosis-related protein indicators showed that Bcl-2, pro-caspase-9, and pro-caspase-3 were downregulated, yet cleaved caspase-9 and cleaved caspase-3 increased in a concentration-dependent manner (Figure 8d). In MDA-MB-231 cells, the evaluation of caspase-3 activity showed a positive correlation between the number of apoptotic cells and AG concentration (Supplementary Figure S1c). Further confirmation from Annexin V-FITC/PI staining flow cytometry indicated that AG treatment also increased apoptosis in a concentration-dependent manner (Supplementary Figure S1d). Apoptosis-related protein analysis showed significant downregulation of Bcl-2, pro-caspase-9, and pro-caspase-3 with increasing AG concentrations, while Bax expression remained unchanged between treatment and control groups (Supplementary Figure S1e). The results suggested AG might trigger intracellular caspase cascades. Combined with depolarized MMP, AG-induced apoptosis in TNBC cell lines might be achieved via a caspase-dependent mitochondrial apoptosis pathway.
FIGURE 8
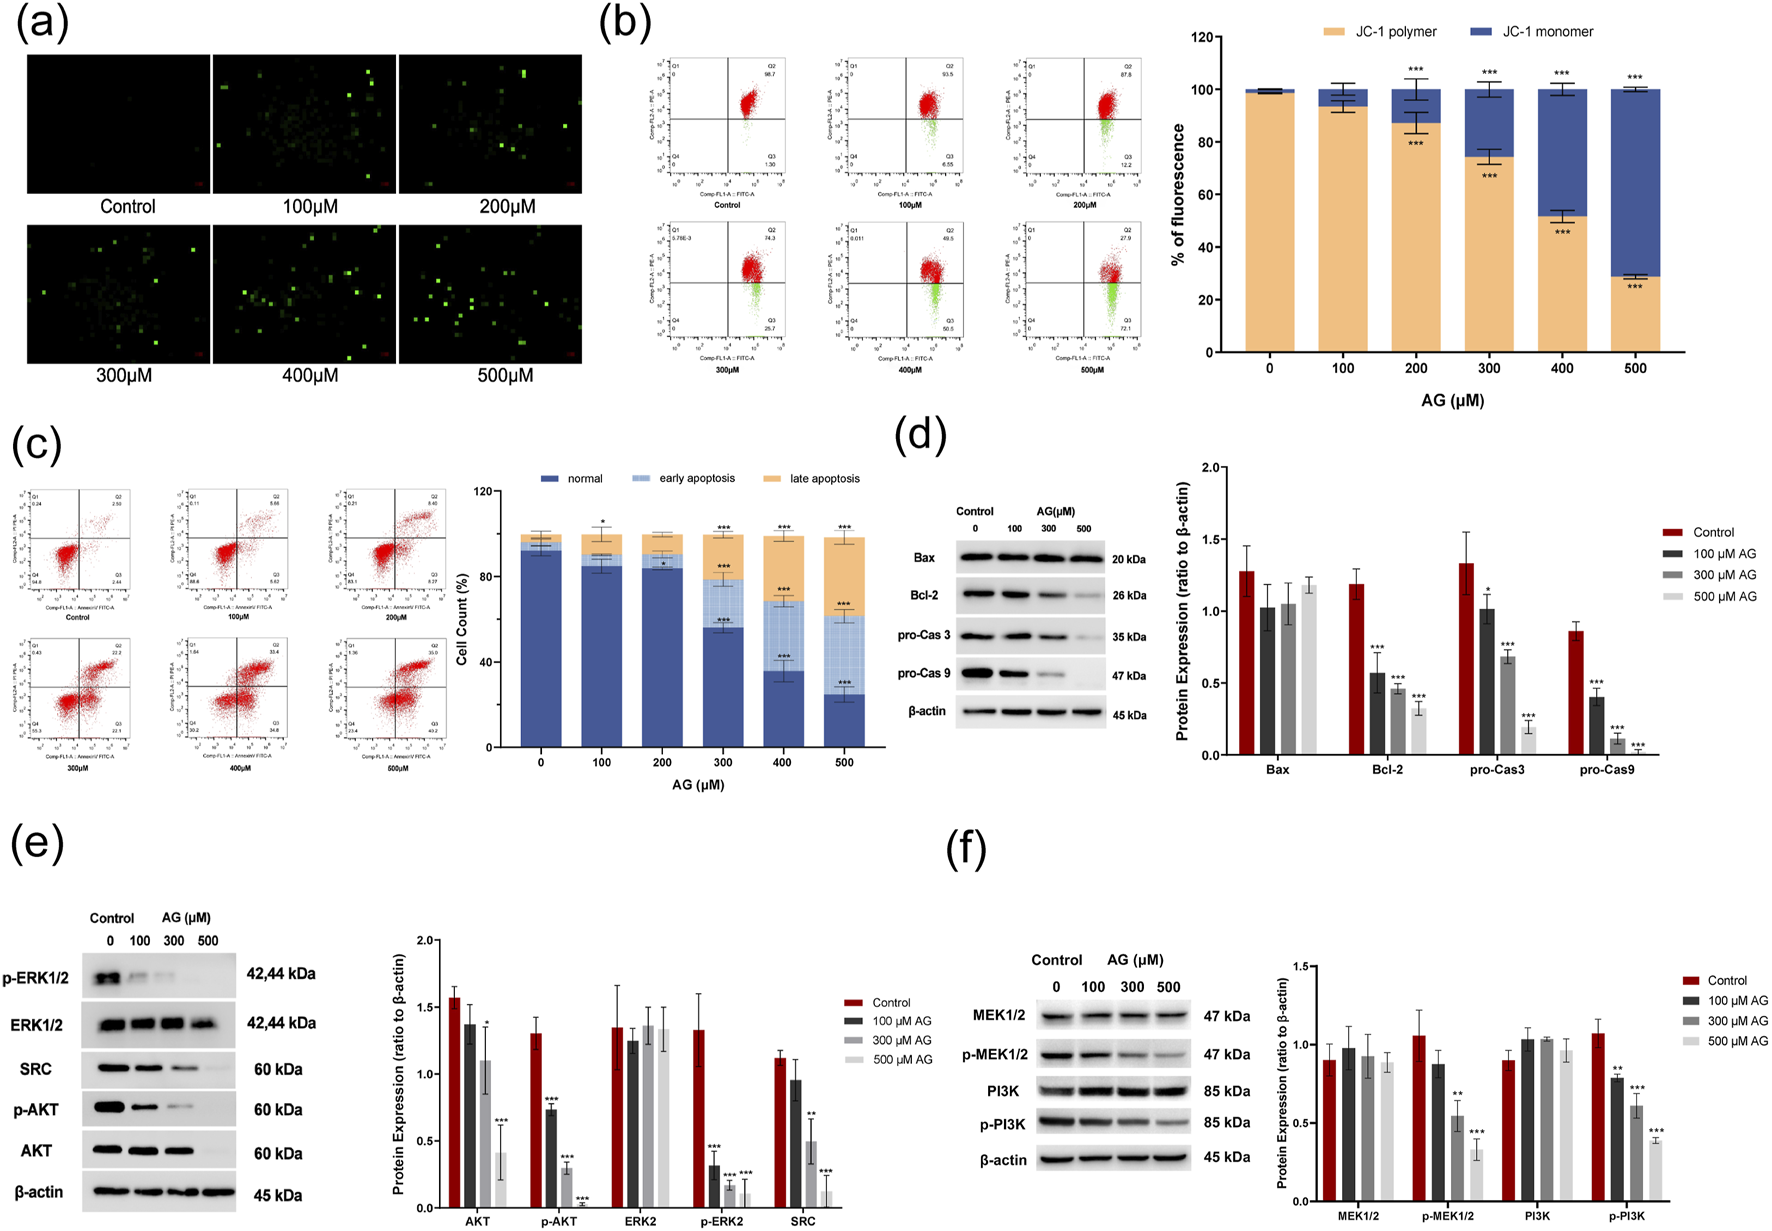
Effects of AG on the apoptosis of MDA-MB-453 cells. (a) Cells were incubated with various concentrations of AG for 48 h and stained with fluorescent dye. (b) MMP changes were analyzed by FACS based on JC-1 staining. (c) Apoptosis rate was analyzed by FACS based on Annexin-FITC/PI staining. (d) Expression of Bax, Bcl-2, caspase-3, and caspase-9 using western blot. (e) Impact of AG on the expression of ERK1/2, p-ERK1/2, AKT, p-AKT and SRC. (f) Impact of AG on the expression of PI3K, p-PI3K, MEK1/2 and p-MEK1/2. ± s, n = 3, *, ** and *** indicate 0.01 < P < 0.05, P < 0.01 and P < 0.001 vs. untreated control.
To investigate the AG-mediated SRC-related protein expression, MDA-MB-453 cells were incubated with AG for 48 h. The results showed that the levels of t-AKT and p-AKT decreased. The level of p-ERK1/2 attenuated, hence indicating an entirely decreased ERK1/2 phosphorylation in the cytosol and effective AG-evoked blockage on ERK1/2 activation (Figure 8e). Meanwhile, as shown in Figure 8f, there were no notable changes in the levels of PI3K and MEK1/2 following AG treatment compared to the control group, while p-PI3K and p-MEK1/2 levels were markedly lower. A decrease in SRC levels was also noted, suggesting that AG modulates the PI3K-AKT and MEK/ERK pathways by downregulating SRC expression. Furthermore, we assessed the expression of SRC, AKT, p-AKT, ERK1/2, p-ERK1/2, MEK1/2, p-MEK1/2, PI3K, and p-PI3K in MDA-MB-231 cells. The results were largely consistent with those observed in MDA-MB-453 cells, showing significant reductions in SRC, p-PI3K, p-AKT, p-MEK1/2, and p-ERK1/2 in the AG-treated groups (Supplementary Figures S1f,g).
Discussion
AG has garnered significant attention for its broad therapeutic potential in treating various human diseases, owing to its diverse pharmacological properties, including anti-inflammatory, antiviral, anti-tumor, neuroprotective, and immunomodulatory effects (Wu et al., 2022). Notably, AG exhibits remarkable inhibitory effects on breast cancer cells, inducing cell cycle arrest, apoptosis, or autophagy, and suppressing cancer cell metastasis (Feng et al., 2017; Shabgah et al., 2021; Zhu et al., 2020). Importantly, ER-negative breast cancer cells demonstrate greater sensitivity to AG compared to ER-positive cells (Hsieh et al., 2014), suggesting its potential utility in TNBC treatment. However, the precise molecular targets and binding mechanisms of AG in TNBC remain poorly understood. In this study, we utilized an integrative approach combining network pharmacology, molecular docking, molecular dynamics (MD) and surface plasmon resonance (SPR) to elucidate the effects of AG on TNBC, with experimental validation in MDA-MB-453 and MDA-MB-231 cells.
Through analysis of public databases, we identified 183 potential drug targets of AG. Further examination of tumor and adjacent non-tumor tissues from TNBC patients revealed 5193 DEGs and 6137 co-expressed module genes. The integration of these datasets led us to identify 28 significant genes, which were then analyzed through GO and KEGG enrichment assessments. These analyses highlighted the enrichment of AG’s mechanism of action in cell cycle regulation, underscoring its potential to disrupt TNBC progression. Using three machine-learning algorithms, we identified four hub genes-SRC, AURKA, PLK1, and CDC25-which exhibited high expression in tumor tissues and area under the receiver operating characteristic curve (AUC) values exceeding 0.8, suggesting their potential as therapeutic targets and prognostic markers for TNBC. AURKA and PLK1 are essential mitotic regulators that promote the G2/M transition and are often overexpressed in aggressive breast cancers (D'Assoro et al., 2015; Wang D. et al., 2017), while CDC25C facilitates CDK1 activation and has been associated with unchecked cell cycle progression in high-grade tumors (Topno et al., 2021). Additionally, SRC as a non-receptor tyrosine kinase involved in migration, proliferation, and chemoresistance, and its hyperactivation is characteristic of metastatic and drug-resistant TNBC phenotypes (Finn et al., 2011; Kohale et al., 2022). Collectively, these genes are involved in cell cycle and survival pathways, suggesting that this gene module forms a biologically relevant and therapeutically viable network, potentially mediating the effects of AG in TNBC.
Additionally, we investigated a group of genes identified by at least two of the three analytical models, which we will refer to as near miss candidates. These genes warrant particular focus due to their developing functional importance in triple-negative breast cancer (TNBC) and their possible connection to AG’s mechanism. Both SVM RFE and LASSO consistently highlighted CLK1 and PDGFRB. CLK1 is known to influence the alternative splicing of genes involved in the cell cycle and is often overexpressed in breast cancer; its pharmacological inhibition can disrupt splicing and hinder tumor growth (Liu et al., 2025; Zhu et al., 2018). PDGFRB signaling in the tumor microenvironment promotes epithelial-mesenchymal transition (EMT) and is inhibited by BRCA1, making it a significant therapeutic target, particularly in BRCA1-deficient TNBC (Bai et al., 2021). MMP13 and RIPK2 also appeared in the SVM RFE and LASSO intersection. MMP13 and RIPK2 were also found in the overlap of SVM RFE and LASSO. MMP13 is associated with bone metastasis and osteolytic processes in breast cancer, indicating its potential as a therapeutic target (Zhu et al., 2023). Increased levels of RIPK2 are linked to unfavorable outcomes in TNBC and facilitate tumor advancement through the activation of the NF-κB and JNK pathways (Jaafar et al., 2018; Singel et al., 2014). CHEK1, PKIA, and NR3C2 were identified by both SVM-RFE and Random Forest or by Random Forest and LASSO. Importantly, CHEK1 is involved in the DNA damage response and has been considered a target for TNBC treatment (Gatti-Mays et al., 2020). Although PKIA and NR3C2 are not well understood in the context of TNBC, emerging data from other cancer types indicate they may have important roles in kinase signaling and tumor biology, necessitating further functional studies (Liu et al., 2023; Steegmaier et al., 2007; Xu B. et al., 2023). ANG was identified by both LASSO and Random Forest; its expression increases under low oxygen conditions, aiding in angiogenesis and tumor survival, with studies showing that its inhibition can reduce breast cancer growth in vivo (Chintalapati et al., 2009). Collectively, these near-miss genes form a biologically significant group with potential functional implications for TNBC development and AG’s mechanism of action. Although they were not part of the final hub gene intersection, their repeated identification across various feature selection methods indicates their reliability, suggesting they could be important targets for subsequent functional validation.
To further investigate the drug targets of AG in the treatment of TNBC, molecular docking revealed strong binding affinities between AG and SRC, AURKA, and PLK1 (Glide scores < −7), while its interaction with CDC25 was weaker (Glide score > −5). Based on the Glide emodel score, we hypothesized that the AG-SRC interaction plays a pivotal role in TNBC regulation. MD simulations further elucidated the binding mode of AG to SRC, revealing a van der Waals energy (ΔEvdw) of −34.85 ± 5.19 kcal/mol for the SRC-AG complex. Critical amino acid residues, including G274, V281, M314, S345, and G344, were identified as key interaction sites.
The selection of a 200 ns simulation timescale in this study was primarily guided by our goal of elucidating ligand binding modes and characterizing key protein-ligand interactions, rather than determining precise kinetic parameters. Although enhanced sampling techniques, such as WESTPA or metadynamics, may offer advantages for sampling rare events, our approach, which uses multiple independent conventional MD trajectories, has proven effective for mapping binding sites and identifying interaction patterns in similar kinase systems. Previous studies have shown that simulation timescales ranging from 200 to 500 ns are effective for identifying ligand binding sites and characterizing interaction patterns (Alanzi et al., 2024; Sulaimani et al., 2025). Our approach compensates for the shorter timescale by employing multiple independent trajectories and ensuring comprehensive conformational sampling. The results exhibit good convergence of structural metrics and show excellent agreement with experimental binding modes. In our MM/GBSA calculations, we elected to exclude the entropy term (–TΔS) based on established limitations in obtaining accurate entropy estimates for complex biomolecular systems (Ruvinsky, 2007). While this results in reported ΔG values (−26.66 ± 3.75 kcal/mol) that strictly represent enthalpic contributions (ΔH), this methodological choice does not compromise our principal conclusions for several compelling reasons: (1) Entropic effects typically exhibit systematic behavior across structurally similar ligand, preserving the validity of relative binding affinity comparisons; (2) Our analytical focus centers on structural interaction patterns rather than absolute free energy quantification; and (3) Available literature provides well-characterized benchmarks for entropy contributions in small molecule-protein binding events (6–15 kcal/mol), enabling appropriate interpretation when required (Chang et al., 2007).
SRC, a non-receptor tyrosine kinase, is a critical regulator of cell proliferation, migration, and apoptosis (Chen et al., 2019; Patel et al., 2016; Ramadan et al., 2021). Under normal physiological conditions, SRC activity is tightly controlled to maintain cellular functions such as adhesion, survival, and angiogenesis (Le and Bast, 2011). However, SRC is overexpressed in various solid tumors, including breast, pancreatic, gastric, and bladder cancers, where it accelerates tumor cell growth and survival (Luo et al., 2022; Su et al., 2023; Wang et al., 2022; Xu et al., 2021). In this study, AG exhibited moderate binding affinity to SRC (KD = 71.8 μmol/L), a notable value for an unmodified natural compound (Wang X. et al., 2017), indicating a moderate binding affinity between AG and SRC. The relatively low association rate constant and reversible dissociation rate suggested that AG interacts with SRC in a specific yet dynamically regulated manner. This level of affinity allows AG to regulate SRC activity without causing permanent inhibition, a characteristic that is often beneficial in the modulation of signaling pathways (Csermely et al., 2005; Lu and Tonge, 2010).
Mechanistically, SRC influences cell cycle progression by phosphorylating cyclins and cyclin-dependent kinases (CDKs) (Zhang et al., 2006). CDK2, in complex with Cyclin A or Cyclin E, regulates distinct phases of the cell cycle. The CDK2/Cyclin A complex facilitates DNA synthesis during the S phase and prepares chromosomes for division in the G2 phase (Tsytlonok et al., 2019), while the CDK2/Cyclin E complex promotes the G1-to-S transition by initiating DNA synthesis-related gene expression and inhibiting the cell cycle inhibitor p27 (Lai et al., 2016). In our study, AG treatment downregulated CDK2 and Cyclin A2, leading to S-phase arrest in MDA-MB-453 cells, suggesting impaired DNA synthesis.
It has been reported that persistently phosphorylated or overexpressed SRC kinase leads to pathological modulation of several tumor cells proliferation-relevant signaling, namely PI3K/AKT pathway, MEK/ERK pathway, and JAK/STAT3 pathway (Ferguson et al., 2013; Rodriguez Torres et al., 2023; Xu R. et al., 2023). By enhancing PI3K activity and AKT phosphorylation, SRC promotes cell proliferation and survival while influencing the tumor microenvironment to support tumor growth and metastasis (Ye et al., 2025). In breast cancer cells, SRC-driven PI3K/AKT activation is a critical driver of cell apoptosis (Luo et al., 2020). Maxwell et al. identified that AKT, NF-κb, and MAPK pathways were involved in AG-relevant anti-cancer effects in (either ER-positive or ER-negative) breast cancer (Maxwell et al., 2017). Consistent with this, AG treatment reduced the phosphorylation of MEK, ERK1/2, PI3K and AKT in MDA-MB-453 and MDA-MB-231 cells, aligning with previous findings on AG’s anti-HIV effects (Kim et al., 2011). Additionally, AG induced apoptosis in MDA-MB-453 and MDA-MB-231 cells, the elevated Bax/Bcl-2 ratio and cleaved caspase-3 and caspase-9 levels indicated that AG-induced apoptosis is mediated through a caspase-dependent mitochondrial pathway. Therefore, the mechanism shows that AG binds to SRC and inhibits the downstream PI3K-AKT and MEK/ERK signaling pathways, thereby triggering a cascade involving Bax, Bcl-2, caspase-3, and caspase-9 to induce the TNBC cell apoptosis. These results suggest that suppressing SRC-mediated bioactivity is a promising strategy for TNBC therapy.
However, the current study has several limitations. To begin with, the primary pathways that explain the role of AG in TNBC have yet to be thoroughly confirmed and need additional exploration, such as through rescue experiments. Furthermore, in vivo research is essential to substantiate these results and assess the viability of AG in the clinical treatment of TNBC. These aspects will be further investigated in future studies.
Conclusion
In summary, our integrated network pharmacology approach systematically elucidated the molecular mechanisms underlying AG’s anti-TNBC activity. Mechanistic investigations revealed that AG specifically targets SRC kinase, thereby dually suppressing both PI3K/AKT and MAPK/ERK signaling cascades. This coordinated pathway inhibition mediated significant anti-tumor effects through two complementary mechanisms: (1) arresting proliferation via cell cycle blockade and (2) triggering mitochondrial-dependent apoptosis. Structural analysis of the stabilized AG-SRC complex not only provides a rational chemical framework for structure-based drug optimization but also offers mechanistic insights for developing combination therapies targeting SRC-mediated resistance pathways in clinical TNBC management.
Statements
Data availability statement
The raw data supporting the conclusions of this article will be made available by the authors, without undue reservation.
Ethics statement
Ethical approval was not required for the studies on humans in accordance with the local legislation and institutional requirements because only commercially available established cell lines were used.
Author contributions
YH: Conceptualization, Writing – original draft. QL: Data curation, Methodology, Software, Conceptualization, Formal Analysis, Writing – review and editing. LL: Data curation, Formal Analysis, Investigation, Visualization, Writing – review and editing. TL: Funding acquisition, Investigation, Validation, Writing – review and editing.
Funding
The author(s) declare that financial support was received for the research and/or publication of this article. The present study was supported by the Key project of Sichuan Provincial Department of Science and Technology (grant no. 2023YFS0133). This study was supported by National Key Clinical Specialties Construction Program.
Conflict of interest
Author LL was employed by Sichuan Kelun-Biotech Biopharmaceutical Co., Ltd.
The remaining authors declare that the research was conducted in the absence of any commercial or financial relationships that could be construed as a potential conflict of interest.
Generative AI statement
The author(s) declare that no Generative AI was used in the creation of this manuscript.
Any alternative text (alt text) provided alongside figures in this article has been generated by Frontiers with the support of artificial intelligence and reasonable efforts have been made to ensure accuracy, including review by the authors wherever possible. If you identify any issues, please contact us.
Publisher’s note
All claims expressed in this article are solely those of the authors and do not necessarily represent those of their affiliated organizations, or those of the publisher, the editors and the reviewers. Any product that may be evaluated in this article, or claim that may be made by its manufacturer, is not guaranteed or endorsed by the publisher.
Supplementary material
The Supplementary Material for this article can be found online at: https://www.frontiersin.org/articles/10.3389/fmolb.2025.1644169/full#supplementary-material
References
1
Alanzi A. R. Moussa A. Y. Alsalhi M. S. Nawaz T. Ali I. (2024). Integration of pharmacophore-based virtual screening, molecular docking, ADMET analysis, and MD simulation for targeting EGFR: a comprehensive drug discovery study using commercial databases. PLoS One19 (12), e0311527. 10.1371/journal.pone.0311527
2
Ashburner M. Ball C. A. Blake J. A. Botstein D. Butler H. Cherry J. M. et al (2000). Gene ontology: tool for the unification of biology. The gene ontology consortium. Nat. Genet.25 (1), 25–29. 10.1038/75556
3
Bai F. Liu S. Liu X. Hollern D. P. Scott A. Wang C. et al (2021). PDGFRβ is an essential therapeutic target for BRCA1-deficient mammary tumors. Breast Cancer Res.23 (1), 10. 10.1186/s13058-021-01387-x
4
Bao Y. Wang L. Yu F. Yang J. Huang D. (2023). Parkinson's disease gene biomarkers screened by the LASSO and SVM algorithms. Brain Sci.13 (2), 175. 10.3390/brainsci13020175
5
Bourgon R. Gentleman R. Huber W. (2010). Independent filtering increases detection power for high-throughput experiments. Proc. Natl. Acad. Sci. U. S. A.107 (21), 9546–9551. 10.1073/pnas.0914005107
6
Case D. A. Cheatham T. E. Darden T. Gohlke H. Luo R. Merz K. M. Jr. et al (2005). The amber biomolecular simulation programs. J. Comput. Chem.26 (16), 1668–1688. 10.1002/jcc.20290
7
Chang C. E. Chen W. Gilson M. K. (2007). Ligand configurational entropy and protein binding. Proc. Natl. Acad. Sci. U. S. A.104 (5), 1534–1539. 10.1073/pnas.0610494104
8
Chen D. Cao L. Wang X. (2019). MPZL1 promotes tumor cell proliferation and migration via activation of Src kinase in ovarian cancer. Oncol. Rep.42 (2), 679–687. 10.3892/or.2019.7199
9
Chintalapati M. Truax R. Stout R. Portier R. Losso J. N. (2009). In vitro and in vivo anti-angiogenic activities and inhibition of hormone-dependent and -independent breast cancer cells by ceramide methylaminoethylphosphonate. J. Agric. Food Chem.57 (12), 5201–5210. 10.1021/jf803818y
10
Chlebowski R. T. Aragaki A. K. Pan K. Simon M. S. Neuhouser M. L. Haque R. et al (2024). Breast cancer incidence and mortality by metabolic syndrome and obesity: the Women's health initiative. Cancer130 (18), 3147–3156. 10.1002/cncr.35318
11
Chong L. T. Pitera J. W. Swope W. C. Pande V. S. (2009). Comparison of computational approaches for predicting the effects of missense mutations on p53 function. J. Mol. Graph Model27 (8), 978–982. 10.1016/j.jmgm.2008.12.006
12
Csermely P. Agoston V. Pongor S. (2005). The efficiency of multi-target drugs: the network approach might help drug design. Trends Pharmacol. Sci.26 (4), 178–182. 10.1016/j.tips.2005.02.007
13
D'Assoro A. B. Haddad T. Galanis E. (2015). Aurora-A kinase as a promising therapeutic target in cancer. Front. Oncol.5, 295. 10.3389/fonc.2015.00295
14
De Las Rivas J. Brozovic A. Izraely S. Casas-Pais A. Witz I. P. Figueroa A. (2021). Cancer drug resistance induced by EMT: novel therapeutic strategies. Arch. Toxicol.95 (7), 2279–2297. 10.1007/s00204-021-03063-7
15
Dehm S. M. Bonham K. (2004). SRC gene expression in human cancer: the role of transcriptional activation. Biochem. Cell Biol.82 (2), 263–274. 10.1139/o03-077
16
Elling R. A. Fucini R. V. Hanan E. J. Barr K. J. Zhu J. Paulvannan K. et al (2008). Structure of the brachydanio rerio Polo-like kinase 1 (Plk1) catalytic domain in complex with an extended inhibitor targeting the adaptive pocket of the enzyme. Acta Crystallogr. Sect. F. Struct. Biol. Cryst. Commun.64 (Pt 8), 686–691. 10.1107/s1744309108019623
17
Feng T. Cao W. Shen W. Zhang L. Gu X. Guo Y. et al (2017). Arctigenin inhibits STAT3 and exhibits anticancer potential in human triple-negative breast cancer therapy. Oncotarget8 (1), 329–344. 10.18632/oncotarget.13393
18
Ferguson J. Arozarena I. Ehrhardt M. Wellbrock C. (2013). Combination of MEK and SRC inhibition suppresses melanoma cell growth and invasion. Oncogene32 (1), 86–96. 10.1038/onc.2012.25
19
Finn R. S. Bengala C. Ibrahim N. Roché H. Sparano J. Strauss L. C. et al (2011). Dasatinib as a single agent in triple-negative breast cancer: results of an open-label phase 2 study. Clin. Cancer Res.17 (21), 6905–6913. 10.1158/1078-0432.Ccr-11-0288
20
Friedman J. Hastie T. Tibshirani R. (2010). Regularization paths for generalized linear models via coordinate descent. J. Stat. Softw.33 (1), 1–22. 10.18637/jss.v033.i01
21
Friesner R. A. Banks J. L. Murphy R. B. Halgren T. A. Klicic J. J. Mainz D. T. et al (2004). Glide: a new approach for rapid, accurate docking and scoring. 1. Method and assessment of docking accuracy. J. Med. Chem.47 (7), 1739–1749. 10.1021/jm0306430
22
Friesner R. A. Murphy R. B. Repasky M. P. Frye L. L. Greenwood J. R. Halgren T. A. et al (2006). Extra precision glide: docking and scoring incorporating a model of hydrophobic enclosure for protein-ligand complexes. J. Med. Chem.49 (21), 6177–6196. 10.1021/jm051256o
23
Garge N. R. Bobashev G. Eggleston B. (2013). Random forest methodology for model-based recursive partitioning: the mobForest package for R. BMC Bioinforma.14, 125. 10.1186/1471-2105-14-125
24
Gatti-Mays M. E. Karzai F. H. Soltani S. N. Zimmer A. Green J. E. Lee M. J. et al (2020). A phase II single arm pilot study of the CHK1 inhibitor prexasertib (LY2606368) in BRCA wild-type, advanced triple-negative breast cancer. Oncologist25 (12), 1013–1824. 10.1634/theoncologist.2020-0491
25
Guo J. Wang X. Sun H. Liu H. Yao X. (2012). The molecular basis of IGF-II/IGF2R recognition: a combined molecular dynamics simulation, free-energy calculation and computational alanine scanning study. J. Mol. Model18 (4), 1421–1430. 10.1007/s00894-011-1159-4
26
Halgren T. A. Murphy R. B. Friesner R. A. Beard H. S. Frye L. L. Pollard W. T. et al (2004). Glide: a new approach for rapid, accurate docking and scoring. 2. Enrichment factors in database screening. J. Med. Chem.47 (7), 1750–1759. 10.1021/jm030644s
27
Hirano T. Gotoh M. Oka K. (1994). Natural flavonoids and lignans are potent cytostatic agents against human leukemic HL-60 cells. Life Sci.55 (13), 1061–1069. 10.1016/0024-3205(94)00641-5
28
Hsieh C. J. Kuo P. L. Hsu Y. C. Huang Y. F. Tsai E. M. Hsu Y. L. (2014). Arctigenin, a dietary phytoestrogen, induces apoptosis of estrogen receptor-negative breast cancer cells through the ROS/p38 MAPK pathway and epigenetic regulation. Free Radic. Biol. Med.67, 159–170. 10.1016/j.freeradbiomed.2013.10.004
29
Huang M. W. Chen C. W. Lin W. C. Ke S. W. Tsai C. F. (2017). SVM and SVM ensembles in breast cancer prediction. PLoS One12 (1), e0161501. 10.1371/journal.pone.0161501
30
Huang S. Cai N. Pacheco P. P. Narrandes S. Wang Y. Xu W. (2018). Applications of support vector machine (SVM) learning in cancer genomics. Cancer Genomics Proteomics15 (1), 41–51. 10.21873/cgp.20063
31
Hyam S. R. Lee I. A. Gu W. Kim K. A. Jeong J. J. Jang S. E. et al (2013). Arctigenin ameliorates inflammation in vitro and in vivo by inhibiting the PI3K/AKT pathway and polarizing M1 macrophages to M2-like macrophages. Eur. J. Pharmacol.708 (1-3), 21–29. 10.1016/j.ejphar.2013.01.014
32
Jaafar R. Mnich K. Dolan S. Hillis J. Almanza A. Logue S. E. et al (2018). RIP2 enhances cell survival by activation of NF-ĸB in triple negative breast cancer cells. Biochem. Biophys. Res. Commun.497 (1), 115–121. 10.1016/j.bbrc.2018.02.034
33
Kanehisa M. Goto S. (2000). KEGG: kyoto encyclopedia of genes and genomes. Nucleic Acids Res.28 (1), 27–30. 10.1093/nar/28.1.27
34
Karim A. M. Eun Kwon J. Ali T. Jang J. Ullah I. Lee Y. G. et al (2023). Triple-negative breast cancer: epidemiology, molecular mechanisms, and modern vaccine-based treatment strategies. Biochem. Pharmacol.212, 115545. 10.1016/j.bcp.2023.115545
35
Kim Y. Hollenbaugh J. A. Kim D. H. Kim B. (2011). Novel PI3K/Akt inhibitors screened by the cytoprotective function of human immunodeficiency virus type 1 Tat. PLoS One6 (7), e21781. 10.1371/journal.pone.0021781
36
Kohale I. N. Yu J. Zhuang Y. Fan X. Reddy R. J. Sinnwell J. et al (2022). Identification of src family kinases as potential therapeutic targets for chemotherapy-resistant triple negative breast cancer. Cancers (Basel)14 (17), 4220. 10.3390/cancers14174220
37
Kollman P. A. Massova I. Reyes C. Kuhn B. Huo S. Chong L. et al (2000). Calculating structures and free energies of complex molecules: combining molecular mechanics and continuum models. Acc. Chem. Res.33 (12), 889–897. 10.1021/ar000033j
38
Lai W. Tang Y. Huang X. R. Ming-Kuen Tang P. Xu A. Szalai A. J. et al (2016). C-reactive protein promotes acute kidney injury via Smad3-dependent inhibition of CDK2/cyclin E. Kidney Int.90 (3), 610–626. 10.1016/j.kint.2016.06.010
39
Langfelder P. Horvath S. (2008). WGCNA: an R package for weighted correlation network analysis. BMC Bioinforma.9, 559. 10.1186/1471-2105-9-559
40
Le X. F. Bast R. C. Jr. (2011). Src family kinases and paclitaxel sensitivity. Cancer Biol. Ther.12 (4), 260–269. 10.4161/cbt.12.4.16430
41
Lee M. G. Lee K. S. Nam K. S. (2021). Arctigenin-mediated cell death of SK-BR-3 cells is caused by HER2 inhibition and autophagy-linked apoptosis. Pharmacol. Rep.73 (2), 629–641. 10.1007/s43440-021-00223-5
42
Levinson N. M. Boxer S. G. (2014). A conserved water-mediated hydrogen bond network defines bosutinib's kinase selectivity. Nat. Chem. Biol.10 (2), 127–132. 10.1038/nchembio.1404
43
Lin C. H. Lin W. D. Huang Y. C. Chen Y. C. Loh Z. J. Ger L. P. et al (2023). Carboxyl-terminal modulator protein facilitates tumor metastasis in triple-negative breast cancer. Cancer Gene Ther.30 (3), 404–413. 10.1038/s41417-022-00559-x
44
Liu H. Lei W. Li Z. Wang X. Zhou L. (2023). NR3C2 inhibits the proliferation of colorectal cancer via regulating glucose metabolism and phosphorylating AMPK. J. Cell Mol. Med.27 (8), 1069–1082. 10.1111/jcmm.17706
45
Liu N. van der Velde J. J. S. Ramdjielal S. Koedoot E. van Overbeek N. K. Batenburg D. et al (2025). Pharmacological CLK inhibition disrupts SR protein function and RNA splicing blocking cell growth and migration in TNBC. Breast Cancer Res.27 (1), 140. 10.1186/s13058-025-02091-w
46
Lu H. Tonge P. J. (2010). Drug-target residence time: critical information for lead optimization. Curr. Opin. Chem. Biol.14 (4), 467–474. 10.1016/j.cbpa.2010.06.176
47
Luo J. Zeng B. Tao C. Lu M. Ren G. (2020). ClpP regulates breast cancer cell proliferation, invasion and apoptosis by modulating the Src/PI3K/Akt signaling pathway. PeerJ8, e8754. 10.7717/peerj.8754
48
Luo J. Zou H. Guo Y. Tong T. Ye L. Zhu C. et al (2022). SRC kinase-mediated signaling pathways and targeted therapies in breast cancer. Breast Cancer Res.24 (1), 99. 10.1186/s13058-022-01596-y
49
Maier J. A. Martinez C. Kasavajhala K. Wickstrom L. Hauser K. E. Simmerling C. (2015). ff14SB: improving the accuracy of protein side chain and backbone parameters from ff99SB. J. Chem. Theory Comput.11 (8), 3696–3713. 10.1021/acs.jctc.5b00255
50
Maxwell T. Chun S. Y. Lee K. S. Kim S. Nam K. S. (2017). The anti-metastatic effects of the phytoestrogen arctigenin on human breast cancer cell lines regardless of the status of ER expression. Int. J. Oncol.50 (2), 727–735. 10.3892/ijo.2016.3825
51
Maxwell T. Lee K. S. Kim S. Nam K. S. (2018). Arctigenin inhibits the activation of the mTOR pathway, resulting in autophagic cell death and decreased ER expression in ER-positive human breast cancer cells. Int. J. Oncol.52 (4), 1339–1349. 10.3892/ijo.2018.4271
52
Miller J. A. Cai C. Langfelder P. Geschwind D. H. Kurian S. M. Salomon D. R. et al (2011). Strategies for aggregating gene expression data: the collapseRows R function. BMC Bioinforma.12, 322. 10.1186/1471-2105-12-322
53
Nogales C. Mamdouh Z. M. List M. Kiel C. Casas A. I. Schmidt H. (2022). Network pharmacology: curing causal mechanisms instead of treating symptoms. Trends Pharmacol. Sci.43 (2), 136–150. 10.1016/j.tips.2021.11.004
54
Patel A. Sabbineni H. Clarke A. Somanath P. R. (2016). Novel roles of Src in cancer cell epithelial-to-mesenchymal transition, vascular permeability, microinvasion and metastasis. Life Sci.157, 52–61. 10.1016/j.lfs.2016.05.036
55
Poier P. P. Lagardère L. Piquemal J. P. (2023). Smooth particle mesh Ewald-integrated stochastic lanczos many-body dispersion algorithm. J. Chem. Phys.159 (15), 154109. 10.1063/5.0166476
56
Ramadan M. Elshaier Y. A. M. M. Aly A. A. Abdel-Aziz M. Fathy H. M. Brown A. B. et al (2021). Development of 2′-aminospiro [pyrano[3,2-c]quinoline]-3′-carbonitrile derivatives as non-ATP competitive Src kinase inhibitors that suppress breast cancer cell migration and proliferation. Bioorg Chem.116, 105344. 10.1016/j.bioorg.2021.105344
57
Rodriguez Torres S. Gresseau L. Benhamida M. Fernandez-Marrero Y. Annabi B. (2023). Epigallocatechin-3-Gallate prevents the acquisition of a cancer stem cell phenotype in ovarian cancer tumorspheres through the inhibition of Src/JAK/STAT3 signaling. Biomedicines11 (4), 1000. 10.3390/biomedicines11041000
58
Ruvinsky A. M. (2007). Calculations of protein-ligand binding entropy of relative and overall molecular motions. J. Comput. Aided Mol. Des.21 (7), 361–370. 10.1007/s10822-007-9116-0
59
Sanz H. Valim C. Vegas E. Oller J. M. Reverter F. (2018). SVM-RFE: selection and visualization of the most relevant features through non-linear kernels. BMC Bioinforma.19 (1), 432. 10.1186/s12859-018-2451-4
60
Shabgah A. G. Suksatan W. Achmad M. H. Bokov D. O. Abdelbasset W. K. Ezzatifar F. et al (2021). Arctigenin, an anti-tumor agent; a cutting-edge topic and up-to-the-minute approach in cancer treatment. Eur. J. Pharmacol.909, 174419. 10.1016/j.ejphar.2021.174419
61
Singel S. M. Batten K. Cornelius C. Jia G. Fasciani G. Barron S. L. et al (2014). Receptor-interacting protein kinase 2 promotes triple-negative breast cancer cell migration and invasion via activation of nuclear factor-kappaB and c-Jun N-terminal kinase pathways. Breast Cancer Res.16 (2), R28. 10.1186/bcr3629
62
Steegmaier M. Hoffmann M. Baum A. Lénárt P. Petronczki M. Krssák M. et al (2007). BI 2536, a potent and selective inhibitor of polo-like kinase 1, inhibits tumor growth in vivo. Curr. Biol.17 (4), 316–322. 10.1016/j.cub.2006.12.037
63
Su L. Chen Y. Huang C. Wu S. Wang X. Zhao X. et al (2023). Targeting Src reactivates pyroptosis to reverse chemoresistance in lung and pancreatic cancer models. Sci. Transl. Med.15 (678), eabl7895. 10.1126/scitranslmed.abl7895
64
Sulaimani M. N. Ahmed S. Anjum F. Mohammad T. Shamsi A. Dohare R. et al (2025). Structure-guided identification of mitogen-activated protein kinase-1 inhibitors towards anticancer therapeutics. PLoS One20 (1), e0311954. 10.1371/journal.pone.0311954
65
Sung H. Ferlay J. Siegel R. L. Laversanne M. Soerjomataram I. Jemal A. et al (2021). Global cancer statistics 2020: GLOBOCAN estimates of incidence and mortality worldwide for 36 cancers in 185 countries. CA Cancer J. Clin.71 (3), 209–249. 10.3322/caac.21660
66
Tang H. Ali A. Abdelazem E. Ottenhoff T. H. M. Heeren R. M. A. Mashaghi A. (2023). Random forest and live single-cell metabolomics reveal metabolic profiles of human macrophages upon polarization. Biotechnol. Bioeng.120 (8), 2314–2325. 10.1002/bit.28494
67
Tang G. Wang W. Zhu C. Huang H. Chen P. Wang X. et al (2024). Global reactivity profiling of the catalytic lysine in human kinome for covalent inhibitor development. Angew. Chem. Int. Ed. Engl.63 (12), e202316394. 10.1002/anie.202316394
68
Topno R. Nazam N. Kumari P. Kumar M. Agarwal P. (2021). Integrative genome wide analysis of protein tyrosine phosphatases identifies CDC25C as prognostic and predictive marker for chemoresistance in breast cancer. Cancer Biomark.32 (4), 491–504. 10.3233/cbm-200858
69
Tsai W. J. Chang C. T. Wang G. J. Lee T. H. Chang S. F. Lu S. C. et al (2011). Arctigenin from Arctium lappa inhibits interleukin-2 and interferon gene expression in primary human T lymphocytes. Chin. Med.6 (1), 12. 10.1186/1749-8546-6-12
70
Tsytlonok M. Sanabria H. Wang Y. Felekyan S. Hemmen K. Phillips A. H. et al (2019). Dynamic anticipation by Cdk2/Cyclin A-bound p27 mediates signal integration in cell cycle regulation. Nat. Commun.10 (1), 1676. 10.1038/s41467-019-09446-w
71
Wang D. Chang R. Wang G. Hu B. Qiang Y. Chen Z. (2017). Polo-like kinase 1-targeting chitosan nanoparticles suppress the progression of hepatocellular carcinoma. Anticancer Agents Med. Chem.17 (7), 948–954. 10.2174/1871520616666160926111911
72
Wang J. Wolf R. M. Caldwell J. W. Kollman P. A. Case D. A. (2004). Development and testing of a general amber force field. J. Comput. Chem.25 (9), 1157–1174. 10.1002/jcc.20035
73
Wang H. Lu Y. Wang M. Shen A. Wu Y. Xu X. et al (2022). Src inhibitor dasatinib sensitized gastric cancer cells to cisplatin. Med. Oncol.40 (1), 49. 10.1007/s12032-022-01879-6
74
Wang X. Zhang Y. Yang Y. Wu X. Fan H. Qiao Y. (2017). Identification of berberine as a direct thrombin inhibitor from traditional Chinese medicine through structural, functional and binding studies. Sci. Rep.7, 44040. 10.1038/srep44040
75
Wu D. Jin L. Huang X. Deng H. Shen Q. K. Quan Z. S. et al (2022). Arctigenin: pharmacology, total synthesis, and progress in structure modification. J. Enzyme Inhib. Med. Chem.37 (1), 2452–2477. 10.1080/14756366.2022.2115035
76
Xu B. Zhang J. Chen W. Cai W. (2023). Exploring the methylation status of CFTR and PKIA genes as potential biomarkers for lung adenocarcinoma. Orphanet J. Rare Dis.18 (1), 246. 10.1186/s13023-023-02807-1
77
Xu W. Anwaier A. Ma C. Liu W. Tian X. Palihati M. et al (2021). Multi-omics reveals novel prognostic implication of SRC protein expression in bladder cancer and its correlation with immunotherapy response. Ann. Med.53 (1), 596–610. 10.1080/07853890.2021.1908588
78
Xu R. Song J. Ruze R. Chen Y. Yin X. Wang C. et al (2023). SQLE promotes pancreatic cancer growth by attenuating ER stress and activating lipid rafts-regulated Src/PI3K/Akt signaling pathway. Cell Death Dis.14 (8), 497. 10.1038/s41419-023-05987-7
79
Yang Y. Yao K. Repasky M. P. Leswing K. Abel R. Shoichet B. K. et al (2021). Efficient exploration of chemical space with docking and deep learning. J. Chem. Theory Comput.17 (11), 7106–7119. 10.1021/acs.jctc.1c00810
80
Ye C. Li Y. Shi J. He L. Shi X. Yang W. et al (2025). Network pharmacology analysis revealed the mechanism and active compounds of jiao Tai wan in the treatment of type 2 diabetes mellitus via SRC/PI3K/AKT signaling. J. Ethnopharmacol.337 (Pt 2), 118898. 10.1016/j.jep.2024.118898
81
Yip A. M. Horvath S. (2007). Gene network interconnectedness and the generalized topological overlap measure. BMC Bioinforma.8, 22. 10.1186/1471-2105-8-22
82
Zeng Y. Nong B. Xia X. Zhang Z. Wang Y. Xu Y. et al (2024). Metabolome and transcriptome unveil the correlated metabolites and transcripts with 2-acetyl-1-pyrroline in fragrant rice. Int. J. Mol. Sci.25 (15), 8207. 10.3390/ijms25158207
83
Zhang B. Horvath S. (2005). A general framework for weighted gene co-expression network analysis. Stat. Appl. Genet. Mol. Biol.4, Article17. 10.2202/1544-6115.1128
84
Zhang X. Gureasko J. Shen K. Cole P. A. Kuriyan J. (2006). An allosteric mechanism for activation of the kinase domain of epidermal growth factor receptor. Cell125 (6), 1137–1149. 10.1016/j.cell.2006.05.013
85
Zhao J. Chen Y. Dong L. Li X. Dong R. Zhou D. et al (2020). Arctigenin protects mice from thioglycollate-induced acute peritonitis. Pharmacol. Res. Perspect.8 (5), e00660. 10.1002/prp2.660
86
Zhu D. Xu S. Deyanat-Yazdi G. Peng S. X. Barnes L. A. Narla R. K. et al (2018). Synthetic lethal strategy identifies a potent and selective TTK and CLK1/2 inhibitor for treatment of triple-negative breast cancer with a compromised G(1)-S checkpoint. Mol. Cancer Ther.17 (8), 1727–1738. 10.1158/1535-7163.Mct-17-1084
87
Zhu L. Shen X. B. Yuan P. C. Shao T. L. Wang G. D. Liu X. P. (2020). Arctigenin inhibits proliferation of ER-positive breast cancer cells through cell cycle arrest mediated by GSK3-dependent cyclin D1 degradation. Life Sci.256, 117983. 10.1016/j.lfs.2020.117983
88
Zhu Y. Yin W. F. Yu P. Zhang C. Sun M. H. Kong L. Y. et al (2023). Meso-hannokinol inhibits breast cancer bone metastasis via the ROS/JNK/ZEB1 axis. Phytother. Res.37 (6), 2262–2279. 10.1002/ptr.7732
89
Zhu Y. Pan Y. Fan L. Zou M. Liu Y. Hu J. et al (2024). Bioinformatics analysis-based mining of potential markers for inflammatory bowel disease and their immune relevance. Transl. Cancer Res.13 (8), 3960–3973. 10.21037/tcr-24-274
Summary
Keywords
Arctigenin, triple-negative breast cancer, SRC, molecular dynamics, SPR
Citation
Huang Y, Luo Q, Li L and Li T (2025) SRC is a potential target of Arctigenin in treating triple-negative breast cancer: based on machine learning algorithms, molecular modeling and in Vitro test. Front. Mol. Biosci. 12:1644169. doi: 10.3389/fmolb.2025.1644169
Received
10 June 2025
Accepted
26 August 2025
Published
11 September 2025
Volume
12 - 2025
Edited by
Frederico Severino Martins, Simulations Plus, United States
Reviewed by
Nikolaos Aristeides Papanikolaou, Aristotle University of Thessaloniki, Greece
Anupam Anand Ojha, Flatiron Institute, United States
Updates
Copyright
© 2025 Huang, Luo, Li and Li.
This is an open-access article distributed under the terms of the Creative Commons Attribution License (CC BY). The use, distribution or reproduction in other forums is permitted, provided the original author(s) and the copyright owner(s) are credited and that the original publication in this journal is cited, in accordance with accepted academic practice. No use, distribution or reproduction is permitted which does not comply with these terms.
*Correspondence: Tianping Li, litianping@scu.edu.cn
ORCID: Tianping Li, orcid.org/0000-0002-8516-7664
Disclaimer
All claims expressed in this article are solely those of the authors and do not necessarily represent those of their affiliated organizations, or those of the publisher, the editors and the reviewers. Any product that may be evaluated in this article or claim that may be made by its manufacturer is not guaranteed or endorsed by the publisher.