Abstract
Objective:
To compare the differences in lipid metabolites between patients with diabetes mellitus combined with hyperuricemia (DH) and diabetes mellitus (DM) and healthy controls, and to initially reveal the changes in lipid metabolic pathways in DH.
Methods:
Using a present study method, 17 patients each diagnosed with diabetes mellitus and diabetes mellitus combined with hyperuric acid among permanent residents aged 18 years and above in Fuzhou City, Fujian Province, China, from June 2019 to July 2020 were selected, matched 1:1 by sex and age, and 17 healthy controls were randomly selected and fasting blood samples were collected. The untargeted lipid histology analysis was performed using ultra performance liquid chromatography-tandem mass spectrometry (UHPLC-MS/MS) based technique, and the Student’s t-test and multiple of difference (FC) were used to initially screen the differential lipid molecules and determine their trends; principal component analysis (PCA) and orthogonal partial least squares discriminant analysis (OPLS-DA) were used to observe the overall distribution of the two groups of samples. Finally, we used Metabo Analyst 5.0 platform to analyze the differential lipid metabolism pathways.
Results:
We identified 1,361 lipid molecules across 30 subclasses. Multivariate analyses revealed a significant separation trend among the DH, DM, and NGT groups, confirming distinct lipidomic profiles. A total of 31 significantly altered lipid metabolites were pinpointed in the DH group compared to the NGT controls. Among the most relevant individual metabolites, 13 triglycerides (TGs), such as TG (16:0/18:1/18:2), 10 phosphatidylethanolamines (PEs), e.g., PE (18:0/20:4), and 7 phosphatidylcholines (PCs) including PC (36:1), were significantly upregulated, while one phosphatidylinositol (PI) was downregulated. The collective analysis of these metabolite groups revealed their enrichment in six major metabolic pathways. Crucially, glycerophospholipid metabolism with an impact value of 0.199 and glycerolipid metabolism with an impact value of 0.014 were identified as the most significantly perturbed pathways in DH patients. Furthermore, comparison of DH versus DM groups identified 12 differential lipids, which were also predominantly enriched in these same core pathways, underscoring their central role in the pathophysiology of hyperuricemia complicating diabetes.
Conclusion:
Patients with combined diabetes mellitus and hyperuricemia have significantly altered lipid metabolites compared to diabetic patients and healthy controls. A total of 31 significantly different lipid molecules were identified, and abnormalities in glycerophospholipid metabolism and glycerolipid metabolism pathways were found in DH patients.
1 Introduction
Diabetes mellitus (DM) is a group of chronic metabolic diseases caused by impaired insulin secretion, insulin resistance or both, with hyperglycemia as the main feature (Mozaffarian, 2016). According to the International Diabetes Federation’s (IDF) Diabetes Atlas 2021 (Sun et al., 2022),The global prevalence of diabetes in people aged 20–71 years is approximately 10.5% (536.6 million individuals), an increase of 12.9% from the 9.0% prevalence reported in the 2019 IDF. As the disease progresses, diabetic patients are prone to chronic lesions of the fundus, nerves, kidneys, cardiovascular and other tissues and organs, leading to the decompensation or failure of the patient’s organism, which in turn seriously affects the patient’s life and health (Garberg et al., 2025; Hu et al., 2024).
Blood uric acid is a metabolic product of the breakdown of purine nucleotides in the body, and disorders of purine metabolism and/or decreased uric acid excretion can lead to the development of hyperuricemia, which was originally seen in Europe and North America, but with the development of society, the disease has become prevalent in Eastern countries, and the number of cases is gradually increasing in China. In a recent cross-sectional study conducted in 31 provinces in mainland China, 17.7% of the study participants were diagnosed with hyperuricemia (J et al., 2022). Hyperuricemia, a common comorbidity of diabetes (Hyperuricemia, 2017), is inseparable from diabetes. Studies have shown that the incidence of hyperuricemia is higher in diabetic than in non-diabetic population (Anothaisintawee et al., 2017), and that the risk of diabetes increases by 17% for every 1 mL/dL increase in serum uric acid (Kodama et al., 2009), while elevated uric acid levels in diabetic patients are also closely associated with diabetic complications such as diabetic nephropathy, adverse cardiac events and peripheral vascular disease (Katsiki et al., 2013). Both diabetes mellitus and hyperuricemia are metabolic diseases and are often accompanied by lipid abnormalities in the development of the disease (Borges et al., 2010). It has been found that hyperuricemia can lead to lipid abnormalities (Xie et al., 2021), and at the same time, disorders of lipid metabolism are risk factors for diabetes mellitus (Petrenko et al., 2023). However, conventional clinical and blood biomarkers such as BMI, fasting glucose, HbA1c levels, and other conventional biochemical tests cannot capture all lipid molecules, making it necessary to detect early aspects of lipid disorders associated with the disease. In addition, gene expression profiling is limited in exploring the molecular mechanisms of diabetes combined with hyperuricemia given the environmental and genetic heterogeneity (Suomi et al., 2023). Therefore, new approaches are needed to advance the understanding of the mechanisms underlying the development of diabetes mellitus combined with hyperuricemia.
Metabolomics, a rapidly evolving technology, can provide a comprehensive picture of metabolic disorders throughout the body, and it can also provide a new avenue for identifying new biomarkers (Wang et al., 2020). Lipidomics, a branch of metabolomics, is an effective tool to study the changes in lipid metabolism in organisms and the role of lipid regulation in life activities, allowing the identification of many individual lipids and also the ability to characterize the specific biological role of lipid molecules, which is well suited to characterize the lipid perturbations that precede diabetes and can be used to develop specific disease biomarkers (Knebel et al., 2016). Studies have shown that diabetes can be effectively prevented or delayed by lifestyle and pharmacological interventions (Samocha-Bonet et al., 2018). Previous studies have reported the association between lipid alterations and diabetes (Lu et al., 2019; Drogan et al., 2015) and hyperuricemia (Liu et al., 2020; Liu et al., 2022). Alterations in plasma triglycerides (TGs), diglycerides (DAGs), phosphatidylethanolamines (PEs) and phosphatidylcholine (PC) have been associated with type 2 diabetes in different populations (Lu et al., 2019; Drogan et al., 2015). Significant alterations in plasma lipids such as TGs and PCs were identified in patients with hyperuricemia (Liu et al., 2020). However, most of the available studies measured only baseline lipids in patients with diabetes or hyperuricemia and did not reflect changes in the plasma lipidome in patients with diabetes or diabetes combined with hyperuricemia.
In this study, we used ultra-high liquid chromatography-mass spectrometry (UHPLC-MS/MS) to characterize lipid metabolic profiles in patients with diabetes mellitus and diabetes mellitus combined with hyperuricemia. In addition, we identified differentially expressed lipid molecules and enriched metabolic pathways in patients with diabetes mellitus, diabetes mellitus combined with hyperuricemia, and healthy subjects to elucidate the potential role of lipid molecules in detecting the development of diabetes mellitus, diabetes mellitus combined with hyperuricemia.
2 Materials & methods
2.1 Study population
Multi-stage proportional stratified whole-group sampling method was used to sample 17 patients each diagnosed with diabetes mellitus, diabetes mellitus combined with hyperuricemia, and healthy controls in Fuzhou City, Fujian Province, selected from 2019 to 2020, based on this present study, according to the 1:1 matched case-control study method. Inclusion criteria were (1) 18 years of age or older; (2) completion of questionnaires and blood collection; (3) signing of informed consent; and (4) meeting the American Diabetes Association’s diagnostic criteria (2018) WHO diagnostic criteria for diabetes (2, 2018), i.e., fasting blood glucose ≥7.0 mmol/L, or random blood glucose >11.0 mmol/L, and meeting in the survey Fasting blood uric acid levels were higher than 420 μmol/L in men and 360 μmol/L in women. exclusion criteria: (1) use of hypoglycemic agents; (2) recent use of drugs affecting uric acid metabolism, such as diuretics, lipid-lowering drugs, aspirin, benzbromarone, and allopurin; (3) gout, primary kidney disease, renal insufficiency, leukemia, and tumors; (4) combination of other psychiatric (4) combination of other psychiatric diseases or low cooperation; (5) pregnant and lactating women. This study was approved by the Ethics Committee of the Fuzhou Center for Disease Control and Prevention (approval number: 2,019,006).
2.2 Sample collection and pre-processing
5 mL of fasting morning blood was collected and centrifuged at 3,000 rmp for 10 min at room temperature. 0.2 mL of the upper layer of plasma was divided into 1.5 mL centrifuge tubes, and three equal groups of samples were mixed as quality control samples and stored at −80 °C in the refrigerator. The samples were thawed on ice and vortexed, 100 μL was taken into a 1.5 mL centrifuge tube, 200 μL of 4 °C water was added, 240 μL of pre-cooled methanol was added after mixing, 800 μL of methyl tert-butyl ether (MTBE) was added after mixing, 20 min of sonication in a low temperature water bath, 30 min of standing at room temperature, 14 000 g, and 15 min of centrifugation at 10 °C, take the upper organic phase, blow dry under nitrogen, and number for detection. The assay was repeated with 100 μL of isopropanol, and the quality control samples were randomly inserted into the assay sequence of the samples.
2.3 Test conditions
2.3.1 Chromatographic conditions
The samples were separated by ultra-high performance liquid chromatography (UHPLC) system. The analysis was performed on a Waters ACQUITY UPLC BEH C18 column (2.1 mm i. d. × 100 mm length, 1.7 μm particle size). The mobile phase consisted of A: 10 mM ammonium formate acetonitrile solution in water and B: 10 mM ammonium formate acetonitrile isopropanol solution. Elution procedure: B was maintained at 30% (0–2 min), B was varied linearly from 30% to 100% (2–25 min), and B was maintained at 30% (25–35 min). The samples were placed in the autosampler at 10 °C during the whole analysis. To avoid the effect caused by the fluctuation of the instrument detection signal, a random order was used and the samples were analyzed continuously.
2.3.2 Mass spectrometry conditions
Electrospray ionization (ESI) positive ion and negative ion modes were used for detection, respectively. Samples were separated by UHPLC and then analyzed by mass spectrometry using a Q Exactive plus mass spectrometer (Thermo Scientific™).
2.3.3 Mass-to-charge ratio (m/z) acquisition of lipid molecules and lipid fragments
The electrospray ionization source operates in positive and negative ion modes respectively. The spray voltage of the MS (primary mass spectrometer) is inferred to be 3.0–4.0 kV in positive mode and 2.5–3.5 kV in negative mode. The temperature of the transfer tube is approximately 300 °C–350 °C, and the full scanning range covers m/z 150-1,500. The resolution reaches 70,000 at m/z 200, the target value of automatic gain control (AGC) is inferred to be 1e6, and the maximum injection time may be 100 m. The MS/MS (secondary mass spectrometry) adopts a data-dependent acquisition mode, with the duty cycle optimized to within 1–2 s. The top 10 parent ions with the highest intensity are selected, and HCD fragmentation (collision energy 20–40 eV) is used. The quadrupole isolation window is m/z 1.0-2.0, and the dynamic exclusion time is set at 10–20 s. The resolution is 17,500 at m/z 200. This method ensures the precise identification and quantification of lipid molecules through high-resolution MS scanning and targeted MS/MS fragmentation.
2.4 Data processing
The basal peak profile (BPC) plots of the QC samples were compared for spectral overlap to examine the stability of the instrument and the reproducibility of the experiment. LipidSearch was used for peak identification, peak extraction, and lipid identification. Univariate and multivariate statistical analyses were performed on the extracted data, mainly including t-test, multiple of difference (FC) analysis, principal component analysis (PCA), orthogonal partial least squares discriminant analysis (OPLS-DA) and visualization of volcano and cluster plots. The strength of influence and explanatory power of each lipid molecule on the categorical discrimination of each group of samples was measured by the variable weight value (VIP). Lipid molecules with VIP>1 had significant contribution in the model interpretation. Finally, the metabolic pathway analysis of differential lipid molecules was carried out in combination with the Kyoto Encyclopedia of Genes and Genomes (KEGG) database and Metabo Analyst 5.0 online analysis platform. In this experiment, VIP>1, P < 0.05 and FC > 1.5 or <0.67 were used as criteria to screen for significant differential lipid molecules.
3 Results
3.1 Characteristics of the general population
There were no statistically significant differences (P > 0.05) between the three groups in terms of age, gender, marital status, education, occupation, history of diabetes, smoking, alcohol consumption, sleep duration and exercise, indicating that the three groups were balanced and comparable Table 1.
TABLE 1
| List | Total (n = 51) | NGT (n = 17) | DM (n = 17) | DH (n = 17) | χ 2 | P |
|---|---|---|---|---|---|---|
| Age | 0.605 | 0.962 | ||||
| <45 | 5 (9.8) | 2 (11.8) | 2 (11.8) | 1 (5.9) | ||
| 45–60 | 32 (62.7) | 10 (58.8) | 11 (64.7) | 11 (64.7) | ||
| ≥60 | 14 (27.5) | 5 (29.4) | 4 (23.5) | 5 (29.4) | ||
| Gender | 0.158 | 0.924 | ||||
| Male | 28 (54.9) | 9 (52.9) | 10 (58.8) | 9 (52.9) | ||
| Female | 23 (45.1) | 8 (47.1) | 7 (41.2) | 8 (47.1) | ||
| Marital | 1.041 | 0.594 | ||||
| Married | 49 (96.1) | 17 (100.0) | 16 (94.1) | 16 (94.1) | ||
| Other | 2 (3.9) | 0 (0.0) | 1 (5.9) | 1 (5.9) | ||
| Educational | 7.515 | 0.111 | ||||
| Primary school | 22 (43.1) | 4 (23.5) | 9 (52.9) | 9 (52.9) | ||
| High School | 18 (35.3) | 8 (47.1) | 3 (17.6) | 7 (41.2) | ||
| University | 11 (21.6) | 5 (29.4) | 5 (29.4) | 1 (5.9) | ||
| Occupation | 8.442 | 0.077 | ||||
| Brain worker | 7 (13.7) | 4 (23.5) | 3 (17.6) | 0 (0.0) | ||
| Manual worker | 33 (64.7) | 12 (70.6) | 8 (47.1) | 13 (76.5) | ||
| Retiree | 11 (21.6) | 1 (5.9) | 6 (35.3) | 4 (23.5) | ||
| Family diabetes | 3.4 | 0.183 | ||||
| Yes | 6 (11.8) | 0 (0.0) | 3 (17.6) | 3 (17.6) | ||
| No | 45 (88.2) | 17 (100.0) | 14 (82.4) | 14 (82.4) | ||
| Alcohol use | 4.577 | 0.101 | ||||
| Yes | 12 (23.5) | 3 (17.6) | 7 (41.2) | 2 (11.8) | ||
| No | 39 (76.5) | 14 (82.4) | 10 (58.8) | 15 (88.2) | ||
| Smoker | 0.197 | 0.906 | ||||
| Yes | 14 (27.5) | 5 (29.4) | 4 (23.5) | 5 (29.4) | ||
| No | 37 (72.5) | 12 (70.6) | 13 (76.5) | 12 (70.6) | ||
| Sleep (h/d) | 2.2 | 0.699 | ||||
| <7 | 18 (35.3) | 6 (35.3) | 6 (35.3) | 6 (35.3) | ||
| 7∼ | 30 (58.8) | 11 (64.7) | 10 (58.8) | 9 (52.9) | ||
| ≥9 | 3 (5.9) | 0 (0.0) | 1 (5.9) | 2 (11.8) | ||
| Exercise (times/week) | 1.417 | 0.492 | ||||
| <3 | 27 (52.9) | 7 (41.2) | 10 (58.8) | 10 (58.8) | ||
| ≥3 | 24 (47.1) | 10 (58.8) | 7 (41.2) | 7 (41.2) |
Comparison of baseline information for lipidomics study subjects, n (%).
The NGT (Normal Glucose Tolerance) group served as the healthy control population. The DM (Diabetes Mellitus) group comprised patients with diabetes alone, while the DH (Diabetes with Hyperuricemia) group included individuals suffering from both metabolic disorders simultaneously.
3.2 Experimental quality control
By overlaying the base peak chromatogram (BPC) spectra of quality control (QC) samples and analyzing their correlation maps, distinct separation among different categories of lipid metabolites in plasma was observed. The consistency in peak response intensities and retention times across all QC samples demonstrated high instrument stability, excellent experimental reproducibility, and reliable data quality (Figure 1).
3.3 Analysis of lipid components
Lipid Search software was used to analyze the data, and a total of 30 lipid subclasses and 1,361 lipid molecules were identified in this experiment. There were 621 glycerophospholipids, 388 glycerolipids, 314 sphingolipids, and 38 other lipids (Figure 2).
FIGURE 1

BPC overlay spectra of positive ions (A) and negative ions (B) from QC samples, and correlation map of QC samples (C). Note: The BPC is the base peak plot; the horizontal coordinates indicate the retention time of each peak, and the vertical coordinates indicate the intensity of the peak; the quality control samples were prepared by mixing equal amounts of case and control samples to be tested. The QC sample correlation map features QC samples on the x-axis and QC samples on the y-axis. Each point within a cell represents an ion peak (metabolite) extracted from the QC sample, with the x- and y-coordinates denoting the logarithmic values of the ion peak signal intensity.
FIGURE 2
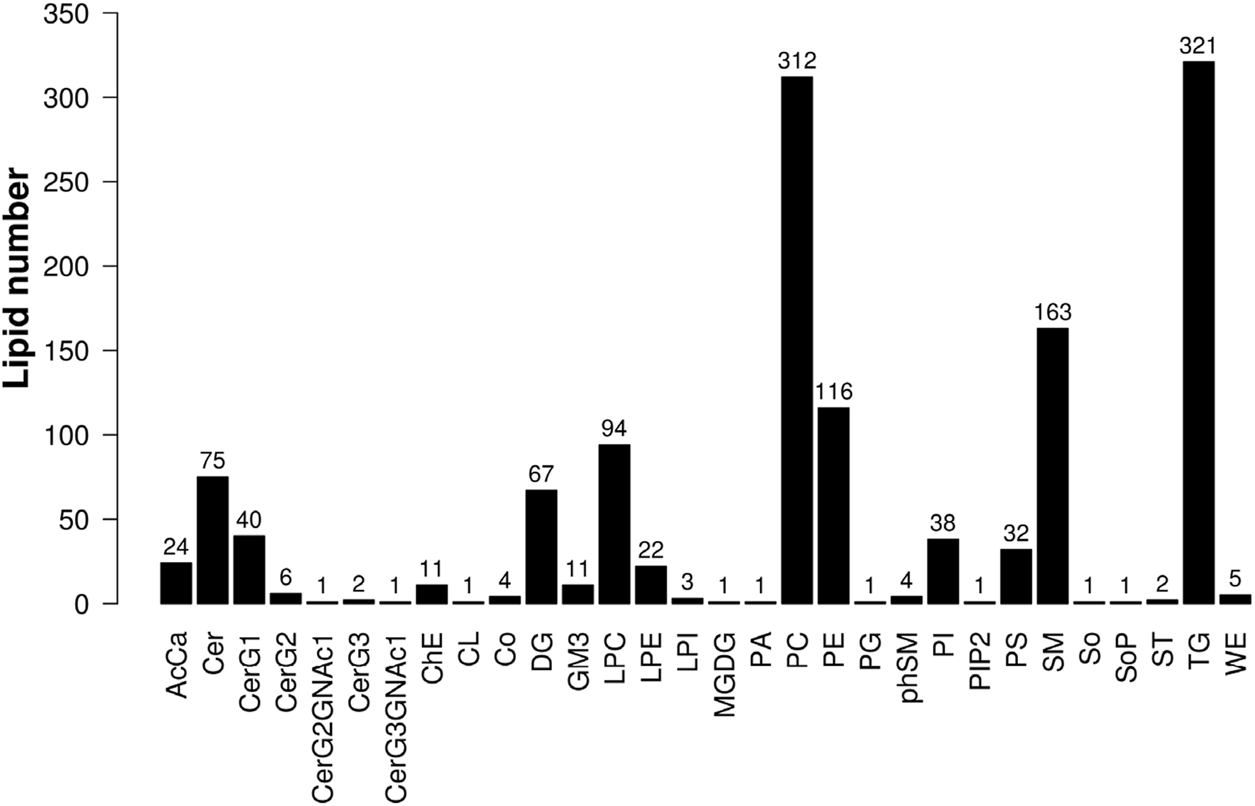
Histogram of lipid subclasses.
3.4 Multivariate statistical analysis of lipid molecules
3.4.1 Principal component analysis
The PCA method was used to observe the overall distribution trend of samples between groups and the degree of difference of samples between groups. The data were processed to obtain the distribution of metabolites and PCA scores of plasma samples from DH group vs. NGT control group and DM control group, and the results showed that the separation of DH and NGT and DH and DM groups was good. The main parameters of the PCA model model interpretation rate R2X = 0.552 (DH vs. NGT) and R2X = 0.509 (DH vs. DM), with R2X values greater than 0.5 indicating that the model is reliable (Figure 3).
FIGURE 3
![Two PCA scatter plots. Plot A compares DH versus NGT, with green squares representing DH and blue circles representing NGT. Plot B compares DH versus DM, with green squares for DH and blue circles for DM. Both plots show distributions along t[1] and t[2] axes, with 95% confidence ellipses.](https://www.frontiersin.org/files/Articles/1656458/xml-images/fmolb-12-1656458-g003.webp)
Principal Component Analysis (PCA) Plot. Note: (A) shows DH vs. NGT and (B) shows DH vs. DM. The horizontal coordinate t (Mozaffarian, 2016) represents principal component 1, the vertical coordinate t (Sun et al., 2022) represents principal component 2, and the ellipse represents the 95% confidence interval. DH, diabetes combined with high uric acid; DM, diabetes mellitus; NGT, normal glucose tolerance.
3.4.2 Orthogonal partial least squares discriminant analysis
The OPLS-DA method was applied to further validate the separation of plasma samples and to screen for differential metabolites associated with the subgroups. The results showed a significant trend of separation between DH and NGT and DH and DM samples, indicating a reliable model. After 7 cycles of cross-validation, the model interpretation rate of R2Y = 0.380 and the predictive power Q2 = 0.551 were obtained for the DH vs. NGT group, indicating a stable and reliable model (Figure 4A). The model interpretation rate of R2Y = 0.682 and the predictive power Q2 = 0.167 were obtained for the DH vs. DM group (Figure 4B), indicating a more stable model. The replacement results of both groups showed that the R2 and Q2 of the stochastic model gradually decreased as the replacement retention gradually decreased, indicating that there was no overfitting in the original model and that the model was robust (Figures 4C, D).
FIGURE 4
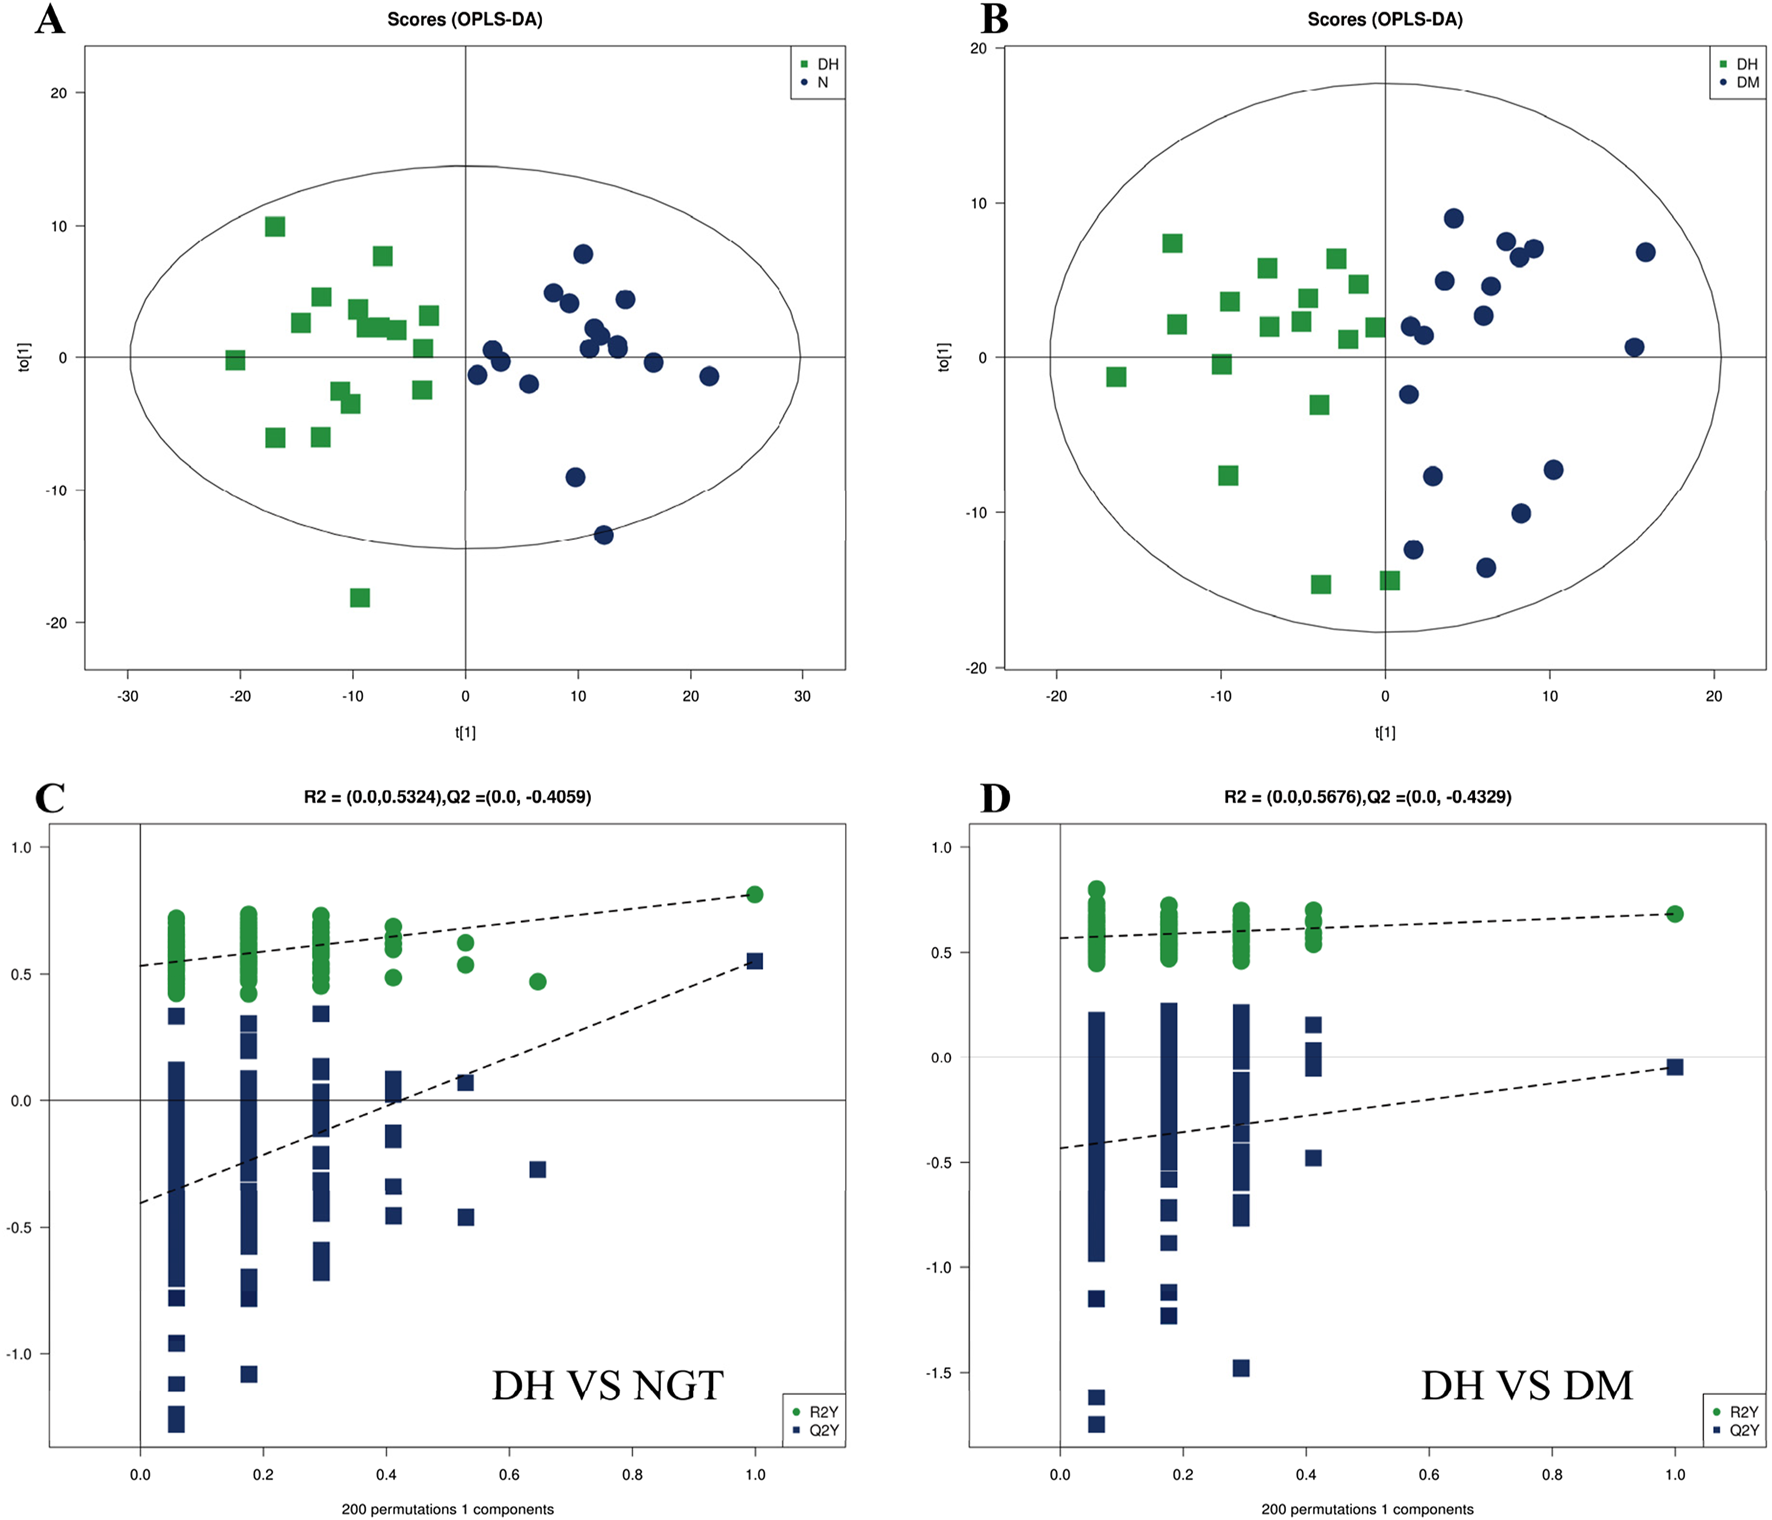
Multivariate analysis of plasma metabolites. Note: (A) shows the DH vs. NGT OPLS-DA and (B) shows the DH vs. DM OPLS-DA. Figure A/B horizontal coordinate t (Mozaffarian, 2016) represents principal component 1, vertical coordinate t (Sun et al., 2022) represents principal component 2, and the ellipse represents the 95% confidence interval; (C) shows the DH vs. NGT replacement results, and (D) shows the DH vs. DM replacement results. The horizontal axis of Figure C/D represents the replacement retention, the vertical axis represents the values of R2 (green) and Q2 (blue), and the two dashed lines represent the regression lines of R2 and Q2 respectively. OPLS-DA, Orthogonal Partial Least Squares Discriminant Analysis; DH, diabetes combined with high uric acid; DM, diabetes mellitus; NGT, normal glucose tolerance.
3.5 Analysis of plasma lipid molecular differences among the three groups
To analyze the significance of changes in plasma lipid molecules between DH vs. NGT and DH vs. DM groups and to screen for potential lipid biomarkers, this study visualized lipid molecule level by visualizing the overall differential level fold in the comparison groups with FC > 1.5 or FC < 0.67 and P < 0.05 as screening conditions. Compared with the NGT control group, 405 lipid molecules were upregulated and 15 levels were downregulated in the DH group, as shown in Figure 5A. Compared with the DM control group, the DH group exhibited upregulation of 118 lipid molecules and downregulation of 22., as shown in Figure 5B.
FIGURE 5
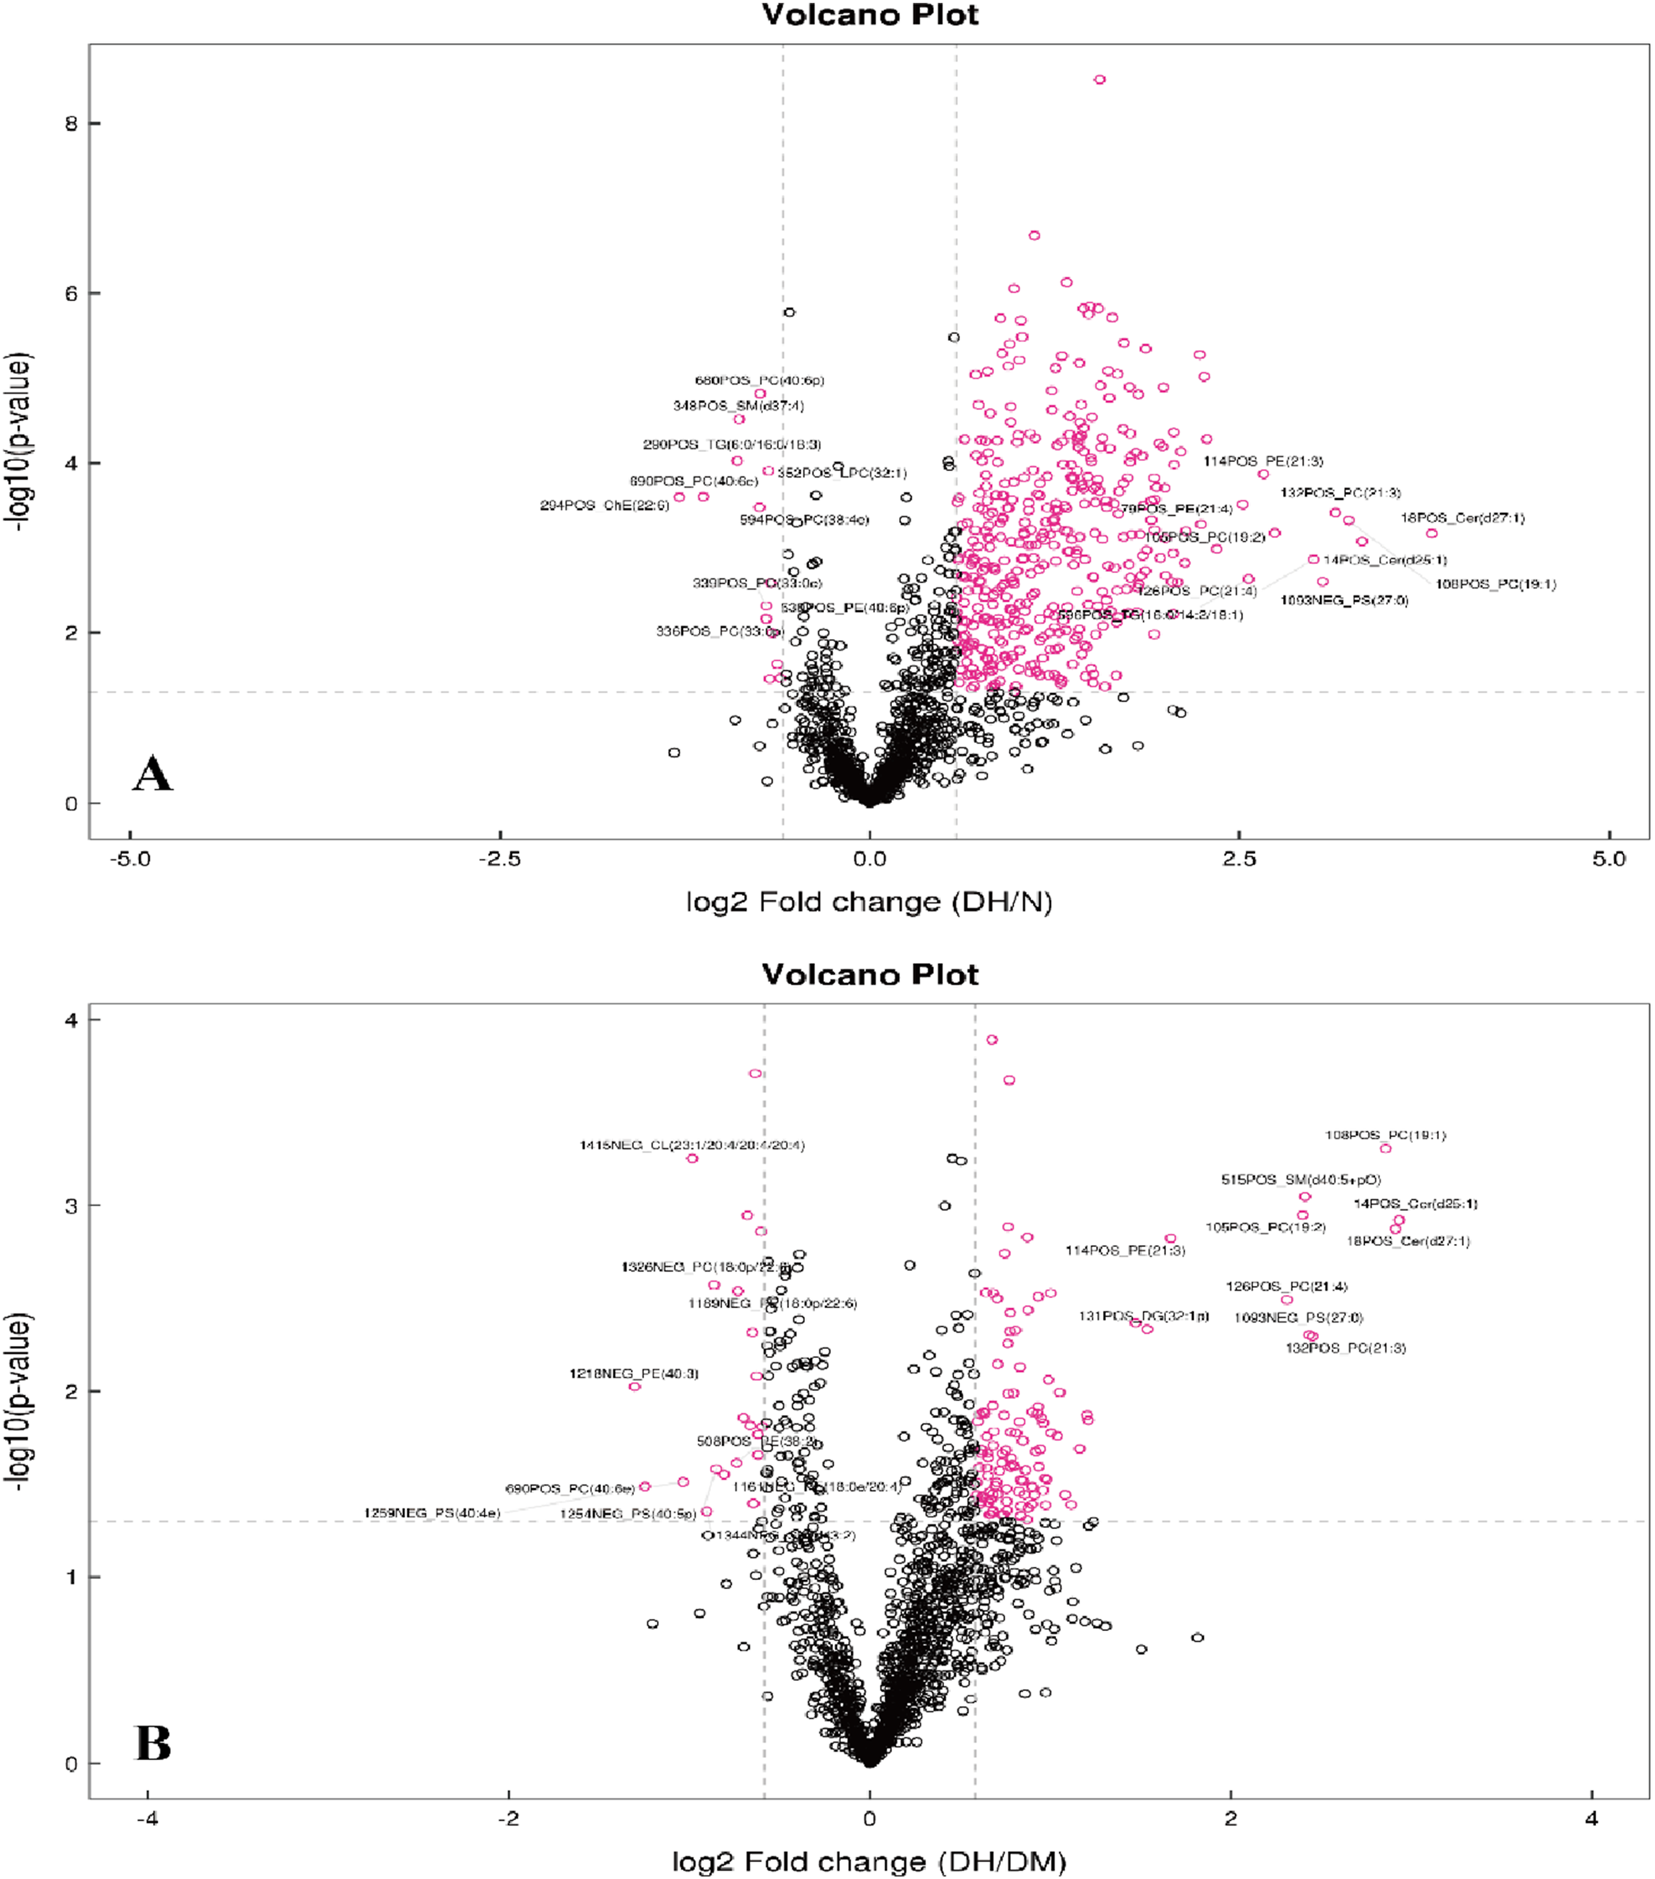
Volcano Plots of Differential Lipid Molecules in DH vs. NGT and DH vs. DM Groups. Note: (A) DH vs. NGT; (B) DH vs. DM; horizontal coordinates in the figure indicate log2-transformed differential level ploidy values, vertical coordinates indicate log10-transformed P value values, and dots indicate lipid molecules, where red dots are lipid molecules that meet the differential level ploidy screening criteria (FC > 1.5 or FC < 0.67, P value <0.05). DH, diabetes combined with high uric acid; DM, diabetes mellitus; NGT, normal glucose tolerance; FC fold change; VIP variable importance for the projection.
3.6 Clustering analysis of differential lipid molecules in the three populations
S-plot load plots were used in the OPLS-DA model to obtain the variance variables with high correlation and covariance, and further selected the variables that contributed more to the grouping in the model. The strength of influence and explanatory power of each lipid molecule on the categorical discrimination of each group of samples was measured by the variable weight value (VIP). Lipid molecules with VIP>1 had significant contribution in the model explanation. The information of the three dimensions of differential level multiple, P value and VIP value of lipid molecules were again visualized in the form of bubble plots by combining the FC > 1.5 or FC < 0.67 and P < 0.05 conditions, as shown in Figure 6.
FIGURE 6
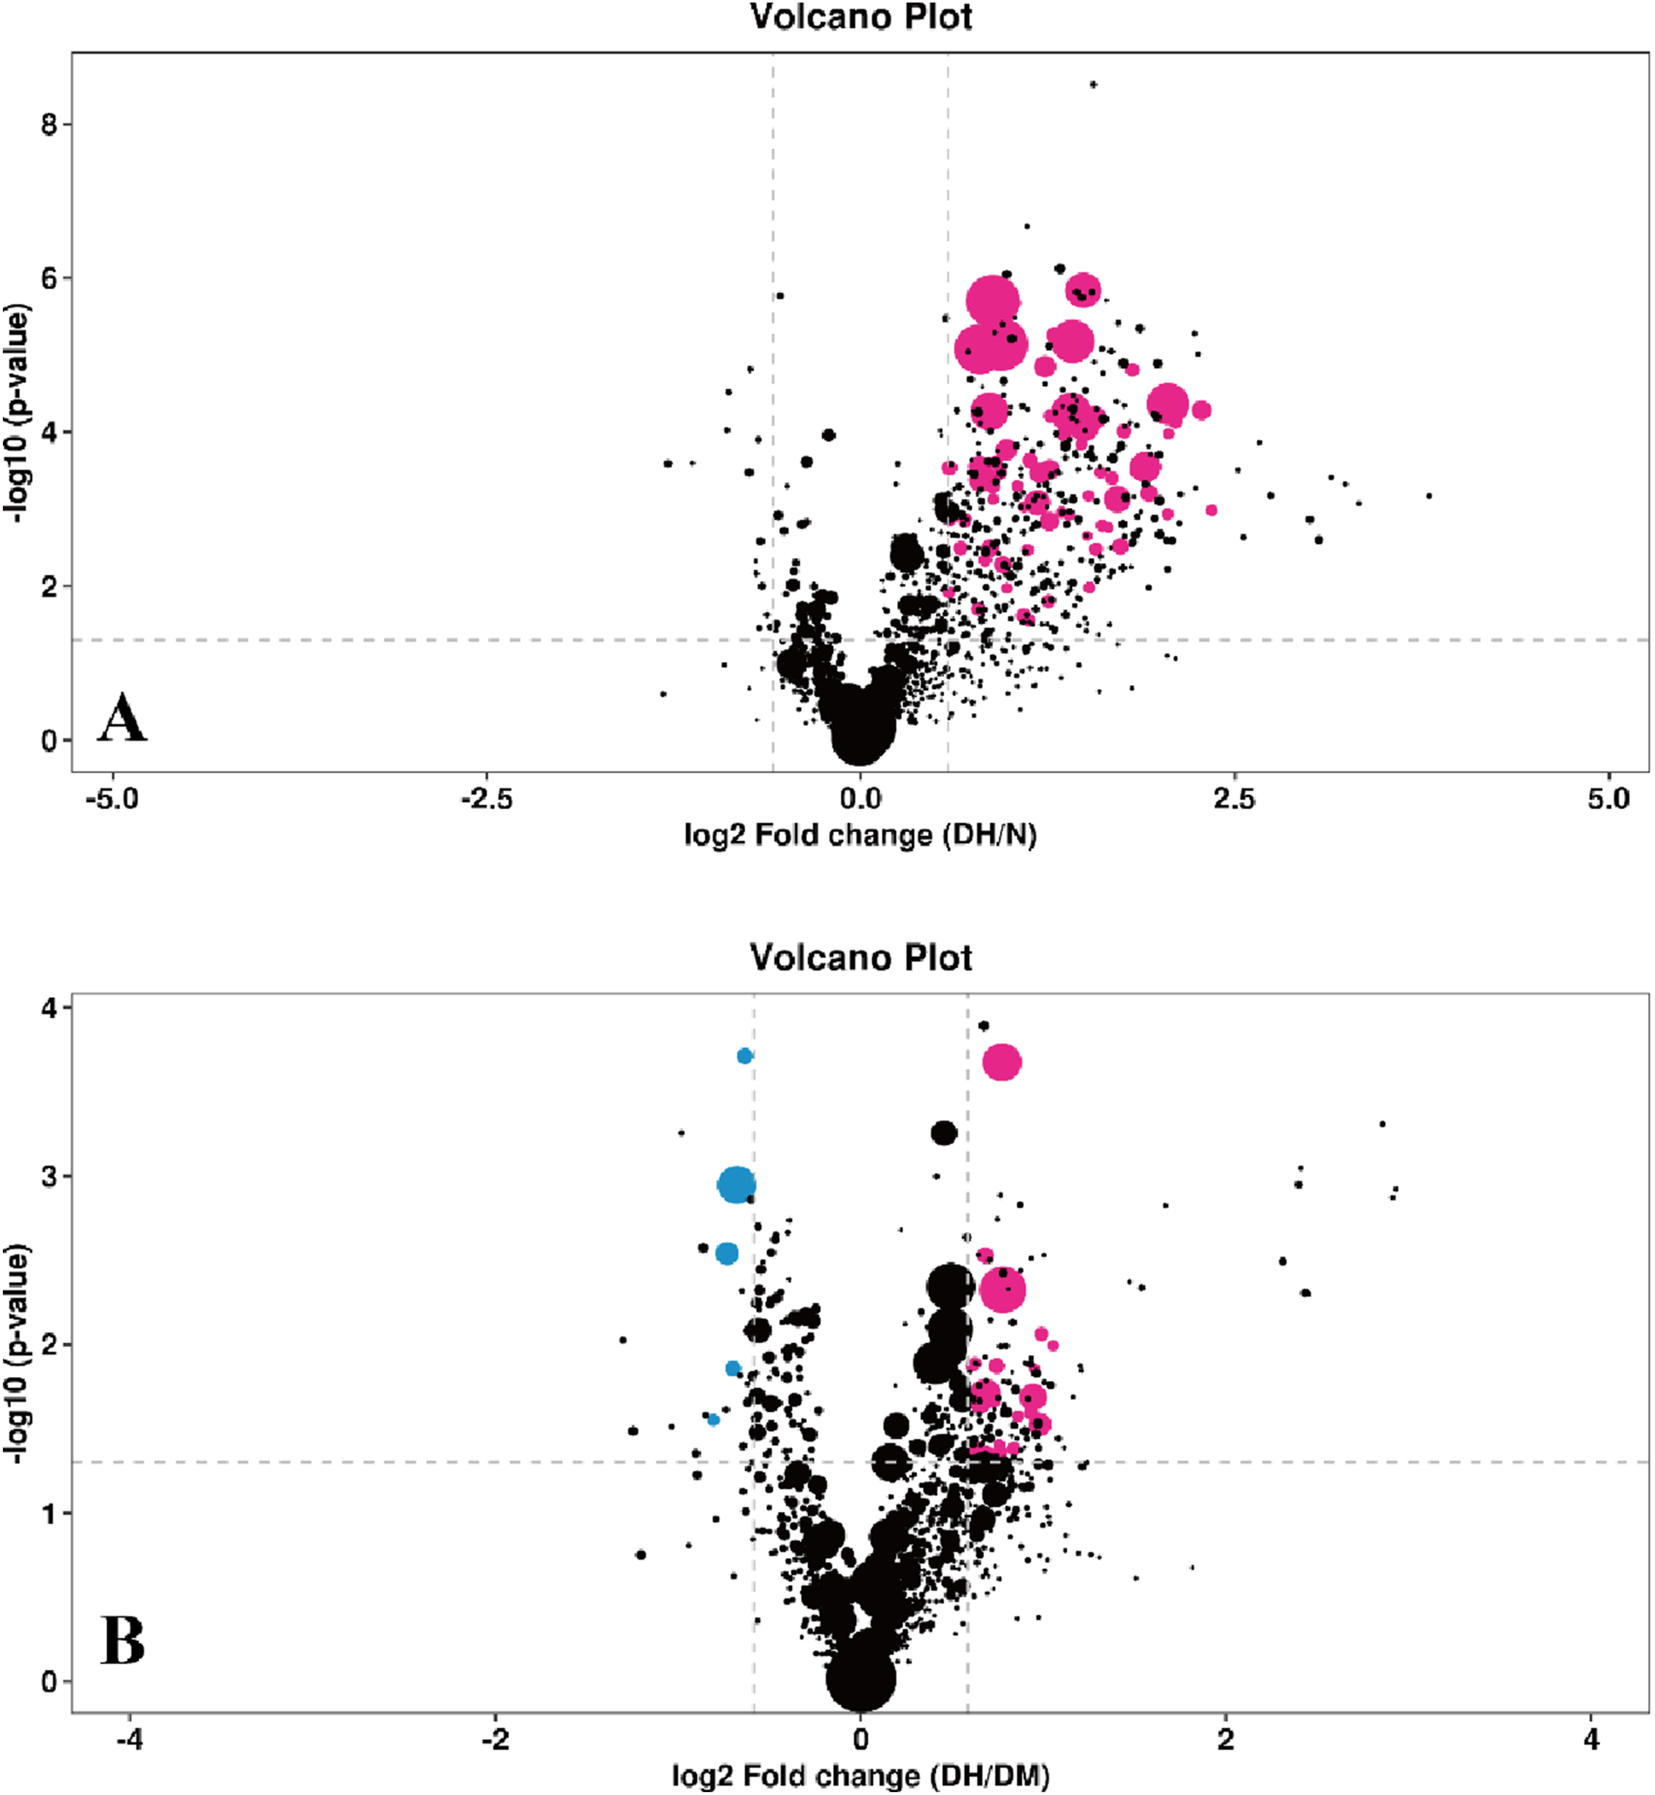
Bubble plot of differential lipid molecules. Note: (A) DH vs. NGT; (B) DH vs. DM; The horizontal coordinates indicate the log2-transformed difference level multiplier values, the vertical coordinates indicate the log10-transformed P value values, the purple dots indicate lipid molecules that satisfy both FC > 1.5, P value <0.05 and VIP >1, the blue dots indicate lipid molecules that satisfy both FC < 0.67, P value <0.05 and VIP >1. The larger the air bubble area, the larger the VIP value. DH, diabetes combined with high uric acid; DM, diabetes mellitus; NGT, normal glucose tolerance; FC fold change; VIP variable importance for the projection.
FC > 1.5 or FC < 0.67, P < 0.05 and VIP >1 were used to select significantly different lipid molecules between groups and to perform hierarchical clustering of samples from each group, thus assisting us to accurately screen for marker lipids and to investigate changes in related metabolic processes. A total of 73 significantly different lipid molecules were expressed upregulated in the DH group compared with the NGT control group. A total of 34 lipid molecules were significantly altered in the DH group compared to the DM control group, with 27 upregulated level and 7 downregulated level. Figure 7 shows the results of hierarchical clustering of significantly different lipid molecules in DH vs. NGT and the results of hierarchical clustering of significantly different lipid molecules in DH vs. DM. From the figure (Figure 7A), it can be learned that the identified differential lipid metabolites in the DH group compared with the NGT group all had higher level high in the DH group, and the grouping of differential lipid metabolites in both groups was obvious and reproducible. From Figure 7B, it can be learned that the DH group had significantly better reproducibility of differential lipid metabolite grouping compared to the DM group.
FIGURE 7
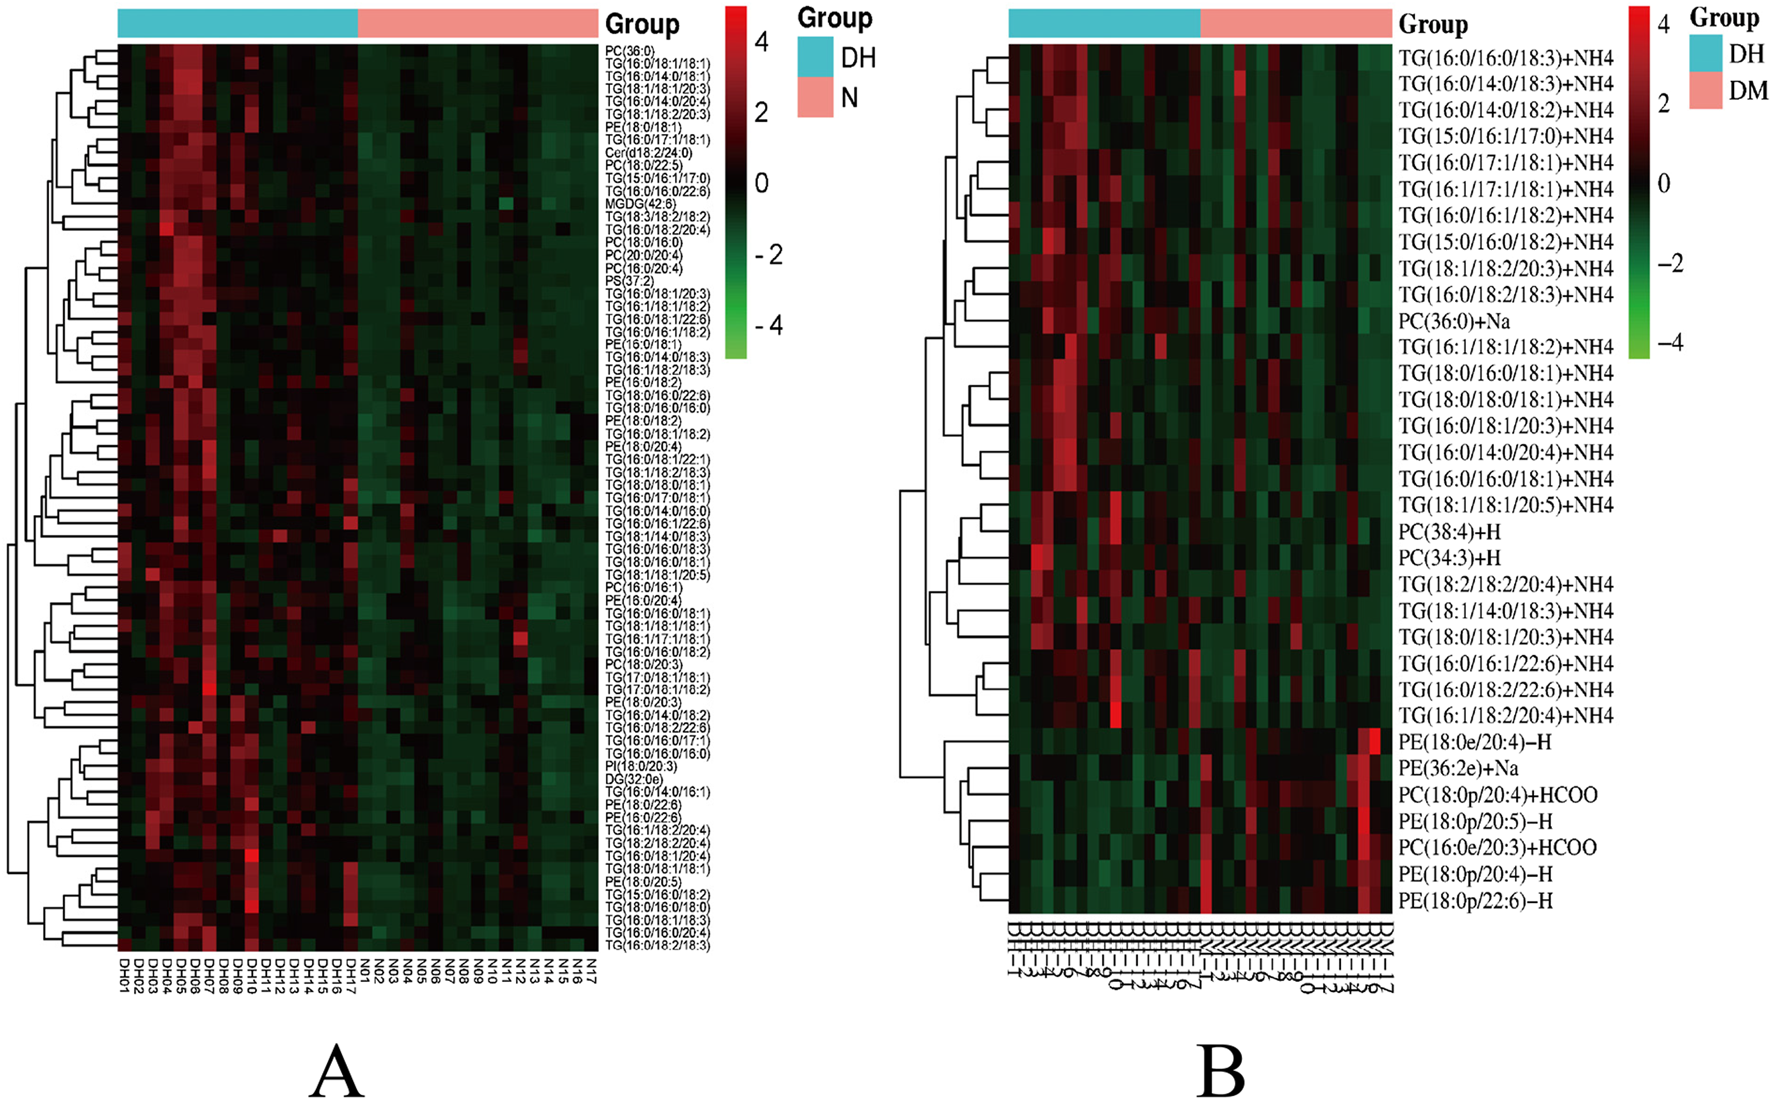
Heatmap of hierarchical clustering analysis for significantly altered plasma lipid molecules. Note: (A) DH vs. NGT; (B) DH vs. DM; Rows represent lipid molecules, and columns represent individual samples. The color intensity in each cell corresponds to the relative abundance of the lipid molecule (darker shades indicate higher level). Lipid molecules with similar level patterns are clustered together. Key lipid subclasses identified include: TG, triglyceride; PC, phosphatidylcholine; PE, phosphatidylethanolamine; PI, phosphatidylinositol.
Significantly different lipid molecules identified above with FC > 1.5 or FC < 0.67, P < 0.05 and VIP >1 were further designated by MetaboAnalyst 5.0 platform. There were 31 significantly different lipid molecules in the DH group compared to the NGT group, including 13 TGs, followed by 7 phosphatidylcholine (PC), 10 phosphatidylethanolamine (PE) and one phosphatidylinositol (PI) (Table 2). There were 12 significantly different lipid molecules in the DH group compared to the DM group, including 10 TGs and 2 PCs (Table 3).
TABLE 2
| Lipids | Lipid subclass | Molecular formula | Theoretical mass to charge ratio | Retention period (min) | FC | P | VIP |
|---|---|---|---|---|---|---|---|
| PC(16:0/16:1)+HCOO | PC | C41 H79 O10 N1 P1 | 776.5447 | 9.9531 | 1.8183 | 3.23 × 10⁻³ | 2.1227 |
| PC(16:0/20:4)+HCOO | PC | C45 H81 O10 N1 P1 | 826.5604 | 9.9588 | 1.7246 | 1.98 × 10⁻² | 1.5866 |
| PC(18:0/16:0)+Na | PC | C42 H84 O8 N1 P1 Na1 | 784.5827 | 10.3784 | 1.5080 | 2.92 × 10⁻⁴ | 1.7613 |
| PC(18:0/20:3)+HCOO | PC | C47 H87 O10 N1 P1 | 856.6073 | 11.3578 | 1.8167 | 5.41 × 10⁻⁵ | 5.2682 |
| PC(18:0/22:5)+HCOO | PC | C49 H87 O10 N1 P1 | 880.6073 | 11.3020 | 1.7770 | 4.60 × 10⁻³ | 1.3706 |
| PC(20:0/20:4)+HCOO | PC | C49 H89 O10 N1 P1 | 882.6230 | 11.6216 | 1.6171 | 1.45 × 10⁻³ | 1.3183 |
| PC(36:0)+Na | PC | C44 H88 O8 N1 P1 Na1 | 812.6140 | 11.3160 | 1.7442 | 4.16 × 10⁻⁴ | 3.1812 |
| PE (16:0/18:1)-H | PE | C39 H75 O8 N1 P1 | 716.5236 | 11.2232 | 2.1317 | 9.34 × 10⁻⁴ | 1.1945 |
| PE (16:0/18:2)-H | PE | C39 H73 O8 N1 P1 | 714.5079 | 10.4423 | 1.9056 | 3.39 × 10⁻⁴ | 1.4847 |
| PE (16:0/20:4)-H | PE | C41 H73 O8 N1 P1 | 738.5079 | 10.2525 | 1.8427 | 5.11 × 10⁻⁴ | 1.5114 |
| PE (16:0/22:6)-H | PE | C43 H73 O8 N1 P1 | 762.5079 | 9.9431 | 1.5883 | 3.20 × 10⁻³ | 1.5807 |
| PE (18:0/18:1)-H | PE | C41 H79 O8 N1 P1 | 744.5549 | 12.2351 | 2.0671 | 5.03 × 10⁻⁴ | 1.2186 |
| PE (18:0/18:2)-H | PE | C41 H77 O8 N1 P1 | 742.5392 | 11.4109 | 1.9647 | 1.69 × 10⁻⁴ | 2.6506 |
| PE (18:0/20:3)-H | PE | C43 H79 O8 N1 P1 | 768.5549 | 11.6504 | 2.3852 | 3.56 × 10⁻⁴ | 1.0843 |
| PE (18:0/20:4)-H | PE | C43 H77 O8 N1 P1 | 766.5392 | 11.2259 | 1.7332 | 2.81 × 10⁻⁴ | 2.8162 |
| PE (18:0/20:5)-H | PE | C43 H75 O8 N1 P1 | 764.5236 | 10.5966 | 2.2163 | 2.45 × 10⁻⁴ | 1.1841 |
| PE (18:0/22:6)-H | PE | C45 H77 O8 N1 P1 | 790.5392 | 10.9251 | 1.8742 | 2.47 × 10⁻⁴ | 1.6682 |
| PI(18:0/20:3)-H | PI | C47 H84 O13 N0 P1 | 887.5655 | 10.3162 | 1.5062 | 1.21 × 10⁻² | 1.2277 |
| TG (16:0/16:0/18:1)+NH4 | TG | C53 H104 O6 N1 | 850.7858 | 21.7533 | 2.6524 | 5.67 × 10⁻⁵ | 5.6638 |
| TG (16:0/16:0/18:2)+NH4 | TG | C53 H102 O6 N1 | 848.7702 | 20.8156 | 2.2687 | 8.21 × 10⁻⁴ | 3.3256 |
| TG (16:0/16:0/20:4)+NH4 | TG | C55 H102 O6 N1 | 872.7702 | 20.6176 | 3.7993 | 6.20 × 10⁻⁴ | 2.0225 |
| TG (16:0/16:1/18:2)+NH4 | TG | C53 H100 O6 N1 | 846.7545 | 18.6511 | 2.7763 | 1.46 × 10⁻⁴ | 1.1419 |
| TG (16:0/18:1/18:1)+NH4 | TG | C55 H106 O6 N1 | 876.8015 | 21.7168 | 1.9140 | 7.30 × 10⁻⁶ | 7.6742 |
| TG (16:0/18:1/18:2)+NH4 | TG | C55 H104 O6 N1 | 874.7858 | 20.9303 | 1.7354 | 8.35 × 10⁻⁶ | 7.1289 |
| TG (16:0/18:1/20:4)+NH4 | TG | C57 H104 O6 N1 | 898.7858 | 20.6030 | 2.8153 | 8.71 × 10⁻⁵ | 3.7601 |
| TG (16:0/18:2/20:4)+NH4 | TG | C57 H102 O6 N1 | 896.7702 | 19.5268 | 2.9567 | 6.51 × 10⁻⁵ | 2.9516 |
| TG (16:1/18:1/18:2)+NH4 | TG | C55 H102 O6 N1 | 872.7702 | 18.9597 | 2.1633 | 3.40 × 10⁻³ | 1.2901 |
| TG (16:1/18:2/20:4)+NH4 | TG | C57 H100 O6 N1 | 894.7545 | 18.5472 | 2.8838 | 1.05 × 10⁻² | 1.2103 |
| TG (18:0/18:0/18:1)+NH4 | TG | C57 H112 O6 N1 | 906.8484 | 23.0595 | 4.8503 | 5.22 × 10⁻⁵ | 2.4330 |
| TG (18:0/18:1/18:1)+NH4 | TG | C57 H110 O6 N1 | 904.8328 | 22.4446 | 2.8051 | 1.45 × 10⁻⁶ | 4.8965 |
| TG (18:2/18:2/20:4)+NH4 | TG | C59 H102 O6 N1 | 920.7702 | 18.4881 | 2.5356 | 1.11 × 10⁻³ | 1.2670 |
Significantly altered lipid metabolites in DH compared to NGT plasma.
The number before the ratio in parentheses is the length of the carbon chain, the number after the ratio is the number of double bonds on the carbon chain; three sets of numbers indicate that the compound consists of three longer carbon chains; p indicates a phosphorus-containing group on the carbon chain; +HCOO, +NH4 and -H, are lipid molecule change groups; PC, phosphatidylcholine; PE, phosphatidylethanolamine; PI, phosphatidylinositol; TG, triglyceride; FC, fold change; VIP, variable importance for the projection.
TABLE 3
| Lipids | Lipid subclass | Molecular formula | Theoretical mass to charge ratio | Retention period (min) | FC | P | VIP |
|---|---|---|---|---|---|---|---|
| PC(34:3)+H | PC | C42 H79 O8 N1 P1 | 7.5655 | 9.1739 | 1.5247 | 1.33 × 10⁻² | 1.3857 |
| PC(38:4)+H | PC | C46 H85 O8 N1 P1 | 8.1060 | 1.0418 | 1.5425 | 1.29 × 10⁻² | 1.3319 |
| TG (16:0/14:0/18:2)+NH4 | TG | C51 H98 O6 N1 | 8.2074 | 1.9748 | 1.9222 | 2.06 × 10⁻² | 3.5702 |
| TG (16:0/16:0/18:1)+NH4 | TG | C53 H104 O6 N1 | 8.5079 | 2.1753 | 1.6046 | 1.96 × 10⁻² | 4.0657 |
| TG (16:0/16:0/18:3)+NH4 | TG | C53 H100 O6 N1 | 8.4675 | 1.9769 | 1.7153 | 4.74 × 10⁻³ | 6.6316 |
| TG (16:0/16:1/18:2)+NH4 | TG | C53 H100 O6 N1 | 8.4675 | 1.8651 | 1.6625 | 2.17 × 10⁻² | 1.2037 |
| TG (16:1/18:1/18:2)+NH4 | TG | C55 H102 O6 N1 | 8.7277 | 1.8960 | 1.9847 | 8.66 × 10⁻³ | 1.5602 |
| TG (16:1/18:2/20:4)+NH4 | TG | C57 H100 O6 N1 | 8.9475 | 1.8547 | 1.9601 | 5.12 × 10⁻² | 1.1011 |
| TG (18:0/16:0/18:1)+NH4 | TG | C55 H108 O6 N1 | 8.7882 | 2.2469 | 1.5952 | 5.39 × 10⁻² | 4.3940 |
| TG (18:0/18:0/18:1)+NH4 | TG | C57 H112 O6 N1 | 9.0685 | 2.3060 | 1.6926 | 4.38 × 10⁻² | 1.7484 |
| TG (18:1/18:1/20:5)+NH4 | TG | C59 H104 O6 N1 | 9.2279 | 1.9505 | 1.5736 | 2.28 × 10⁻² | 2.2372 |
| TG (18:2/18:2/20:4)+NH4 | TG | C59 H102 O6 N1 | 9.2077 | 1.8488 | 1.9327 | 1.39 × 10⁻² | 1.0867 |
Significantly different lipid metabolites identified in plasma from the DH group compared to the DM group.
The number before the ratio in parentheses is the length of the carbon chain, the number after the ratio is the number of double bonds on the carbon chain, three sets of numbers indicate that the compound consists of three longer carbon chains, p indicates a phosphorus-containing group on the carbon chain; +NH4 and +H are lipid molecule change groups. PC, phosphatidylcholine; PE, phosphatidylethanolamine; PI, phosphatidylinositol; TG, triglyceride; FC, fold change; VIP, variable importance for the projection.
3.7 Analysis of plasma differential lipid molecule metabolic pathways
In this study, lipid molecule metabolic pathway analysis was conducted on 31 significantly differential lipid molecules identified by Metabo Analyst 5.0 platform. The results showed that six lipid metabolic pathways were perturbed in DH patients, namely, glycerophospholipid metabolism, linoleic acid metabolism, α-linolenic acid metabolism, glycosylphosphatidylinositol (GPI)-anchor biosynthesis, glycerolipid metabolism, and arachidonic acid metabolic pathway (Figure 8A). Among them, glycerophospholipid metabolic pathway (effect value 0.199) and glycerolipid metabolic pathway (effect value 0.014) were significantly changed (Figure 8B) and were mapped on the KEGG pathway map. Among them, PCs and PEs were mainly involved in glycerophospholipid metabolism (Figure 9A), and triglycerides (TGs) were mainly involved in glycerol ester metabolism (Figure 9B).
FIGURE 8
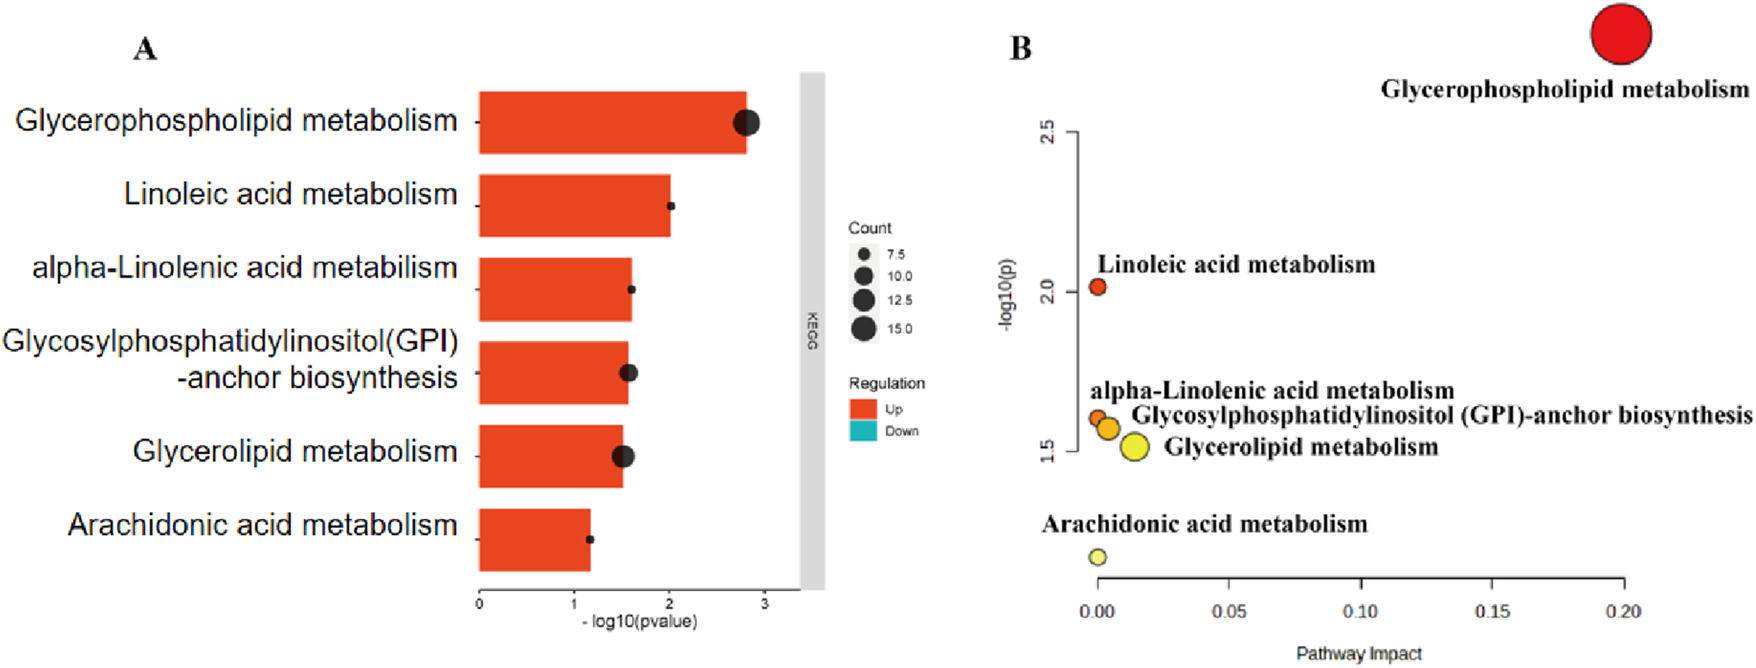
DH vs. NGT plasma significantly different lipid molecule metabolic pathways. Note: (A) Bars indicate the size of the P-value; longer bars indicate smaller P-values; dots indicate the number of lipid metabolites; larger dots indicate more lipid metabolites. (B) X-axis indicates pathway influence, Y-axis indicates -log(P); significance and statistical significance of pathways are proportional to the radius and colour of the nodes, respectively.
FIGURE 9
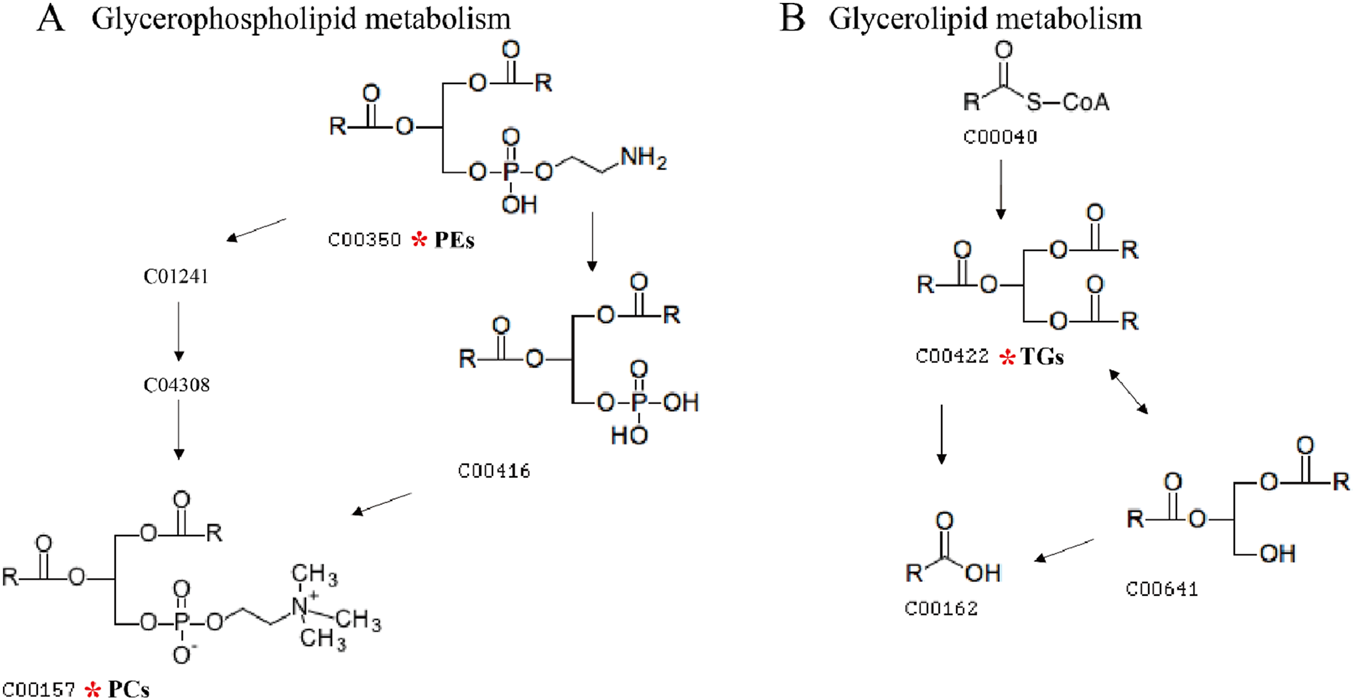
Diagram of glycerophospholipid metabolic pathway and glycerolipid metabolic pathway. Note: (A) shows the glycerophospholipid metabolic pathway map, and (B) shows the glycerol ester metabolic pathway map. The numbers in the diagrams represent the ID of each lipid subclass; the red * indicates the lipid molecule that is mapped on the KEGG pathway map.
KEGG enrichment analysis revealed 12 significantly altered lipid molecules in the DH group compared with DM, which were analyzed for significantly different lipid molecule metabolic pathways. The results showed that the 12 lipid molecules were mainly enriched in two lipid metabolic pathways, namely, glycerophospholipid metabolic pathway (effect value 0.094) and triglyceride metabolic pathway (effect value 0.014) (Figure 10A). Among them, the glycerophospholipid metabolic pathway was significantly changed, and PCs were found to be mainly involved in glycerophospholipid metabolism (Figure 10B).
FIGURE 10
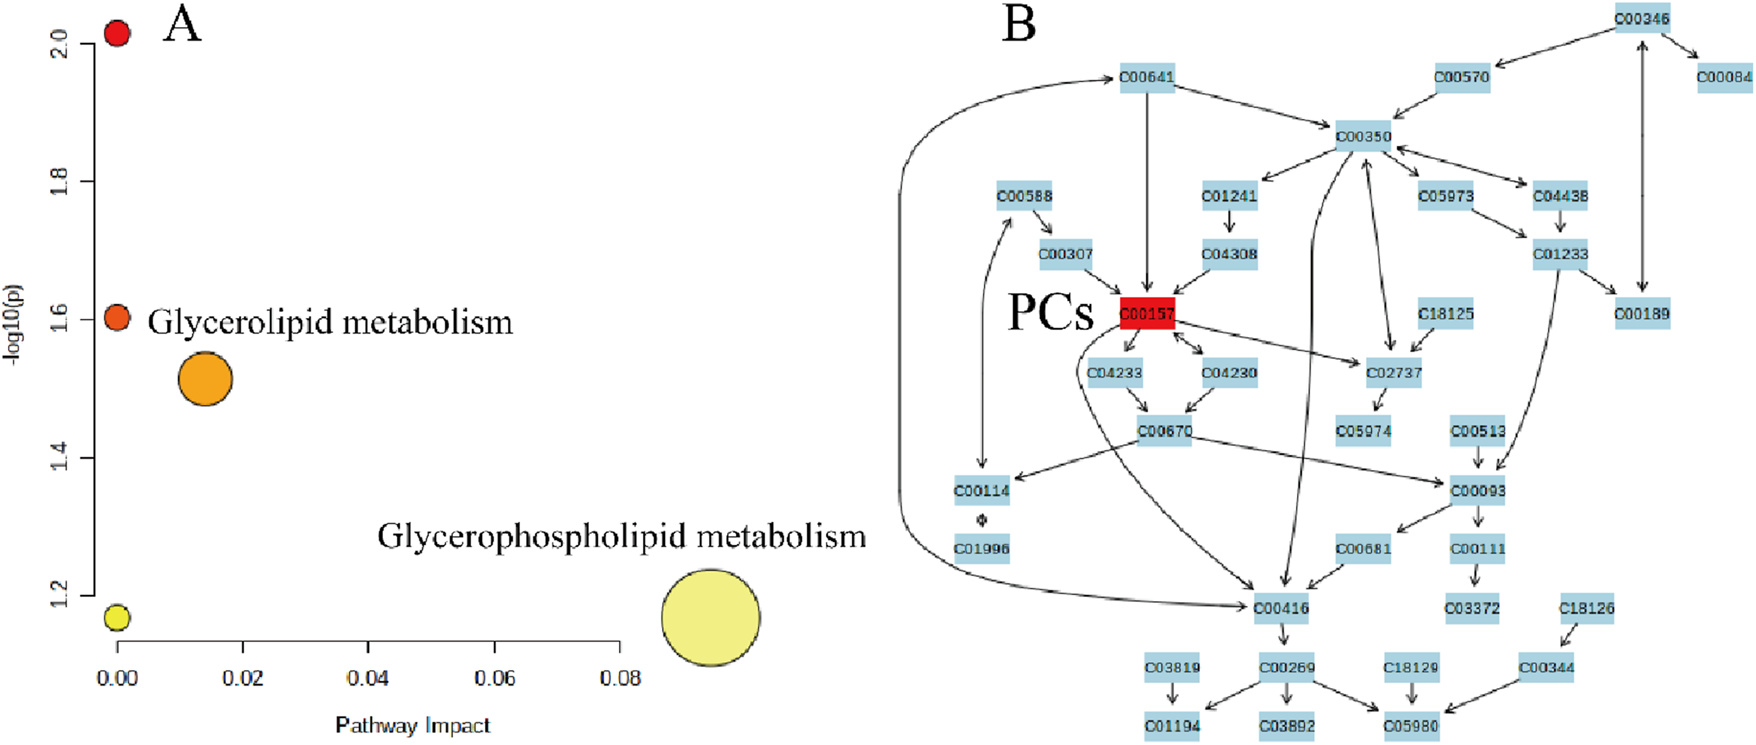
DH vs. DM plasma significantly different lipid molecule metabolic pathways. Note: (A) X-axis indicates pathway impact, Y-axis - log(P); pathway significance and statistical significance are proportional to the radius and colour of the node, respectively. (B) Numbers in the figure represent the ID of each lipid subclass; red * indicates the lipid molecule mapped on the KEGG pathway map.
4 Discussion
This study extensively explored the characteristics of lipid metabolites in patients with diabetes mellitus combined with hyperuricemia using non-targeted lipidomics techniques. The results of PCA and OPLS-DA analysis showed a clear trend of separation of the three groups of samples and a reliable model. A total of 73 differential lipid metabolites between diabetic patients, diabetic patients with combined hyperuricemia and healthy controls were identified by combining the conditions of VIP>1, FC > 1.5 or FC < 0.67 and P < 0.05. A total of 31 identifiable differential lipid metabolites were further compared in the Metabo Analyst 5.0 analysis platform. The results of differential lipid metabolic pathway analysis showed that patients with diabetes mellitus combined with high uric acid were significantly associated with glycerophospholipid and glycerolipid metabolic pathways. Among them, PCs and PEs were mainly involved in glycerophospholipid metabolism, and triglycerides (TGs) were mainly involved in glycerolipid metabolism, suggesting that they can be used as potential biomarkers for more in-depth study in patients with diabetes mellitus combined with hyperuricemia.
Glycerophospholipids are the major lipids of mammalian cell membranes and play a crucial role in cellular functions such as signal transduction, regulation of protein functions and transport processes (Ecker and Liebisch, 2014). Among them, phosphatidylcholine (PC) and phosphatidylethanolamine (PE) are the two most dominant phospholipids. In the liver, PC can be synthesized via the choline pathway or converted by PE through the action of phosphatidylethanolamine-N-methyltransferase (PEMT) (Vance, 2015). Phospholipid composition is closely related to hepatic insulin signaling. It was found that an elevated ratio of hepatocyte phosphatidylcholine to phosphatidylethanolamine (PC/PE) can directly affect insulin signaling (Van Der Veen et al., 2019). Conversely, a decrease in PC/PE improves lipid accumulation, inflammation and fibrosis in hepatocyte (Van Der Veen et al., 2016),and facilitates glucose homeostasis in obese mice (Fu et al., 2011). In this study, we found abnormally elevated 7 PCs and 10 PEs in patients with combined diabetes mellitus and hyperuricemia, suggesting abnormal glycerophospholipid metabolism in DH patients. Other studies have also found (Drogan et al., 2015),that alterations in glycerophospholipid classes in patients with type 2 diabetes suggest that PC (22:4/dm18:0), PC (38:4), PC (36:1) and PE (O-18:0/O-18:0) and PE (O-20:0/O-16:0) are positively associated with the risk of diabetes mellitus. In addition, serious disturbances in glycerophospholipid metabolic pathways have been identified in both in vivo/in vitro studies of hyperuricemia (Liu et al., 2020). It was also found that uric acid induces lipid metabolism disorders through lysophosphatidylcholine acyltransferase 3 (LPCAT3)-mediated activation of sterol regulatory element binding protein 1c (SREBP-1c) and inhibition of phosphorylation signaling transducer and activator of transcription 3 (p-STAT3 (Liu et al., 2020). It is suggested that LPCAT3 may be a key regulator linking hyperuricemia and disorders of lipid metabolism.
Triglycerides (TGs) are the major form of fatty acids stored and transported intracellularly and in the blood plasma. When the body exceeds the maximum storage capacity of adipocytes, lipids are released into the circulation as free fatty acids (FAs) and are transported to accumulate in lipid droplets in skeletal muscle and liver, ultimately leading to insulin resistance (Ritter et al., 2015). However, stored TGs in vivo are usually metabolically inert. Impaired insulin signaling in hepatocytes is not caused by the accumulation of triglycerides, but by direct damage to hepatocytes from intermediates produced during their metabolism (e.g., diglycerides, ceramides, and acylcarnitines) (Semova and Biddinger, 2021). In addition, the accumulation of excess lipids (especially saturated fatty acids) is closely associated with endoplasmic reticulum oxidative stress and mitochondrial dysfunction (Wymann and Schneiter, 2008). Also, elevated free fatty acids in plasma can cause a direct inflammatory response by binding to toll-like receptors (SONG et al., 2019). Lipid molecules can also be used as biomarkers of disease. It was found (Yang et al., 2019) that neurolipid dysregulation (especially of TGs) was significantly associated with peripheral neuropathy in a murine model of diabetes and that the disease was associated with the “fat digestion and absorption” pathway through the KEGG website. In addition, elevated serum uric acid is usually accompanied by elevated TG levels. It was found (Liu et al., 2022)that serum levels of all types of TG were higher in patients with hyperuricemia than in normal subjects, which may be related to the activation of phospholipases. The mechanism by which triglycerides (TGs) affect diabetes mellitus combined with hyperuricemia may be related to its role in inflammation (Van Dierendonck et al., 2022), oxidative stress (Sun et al., 2020) and insulin signaling (Smith et al., 2020), which may affect glucose metabolism and insulin resistance.
There are some limitations to this study. First, the relatively small number of participants in each group and the nature of the cross-sectional study methodology itself can limit the interpretation of the findings from a pathophysiological perspective. In addition, because blood samples were collected at multiple different sites, a batch effect may have occurred but could have been mitigated by a standardized sample collection, processing, and storage protocol. Second, other unmeasurable factors, including dietary habits, medications/supplements, and other unknown environmental factors may also have influenced the results of the study; however, we captured a portion of the potential confounders’ in the follow-up analysis to adjust for them. Finally, this study was conducted with a sample of the population in Fujian Province; therefore, the generalizability of our findings to other populations is limited.
5 Conclusion
In summary, a total of 31 significantly different lipid metabolites were identified as potential biomarkers of DH by UHPLC-MS/MS technique in this study, and they were enriched in glycerophospholipid metabolism, linoleic acid metabolism, α-linolenic acid metabolism, glycosylphosphatidylinositol (GPI)-anchor biosynthesis, glycerolipid metabolism, and arachidonic acid metabolism pathways. Among them, glycerophospholipid and glycerolipid metabolic pathways are the most important. PCs and PEs are mainly involved in glycerophospholipid metabolic pathway, and TGs are closely related to glycerolipid metabolic pathway.
Statements
Data availability statement
The raw data supporting the conclusions of this article will be made available by the authors, without undue reservation.
Ethics statement
The studies involving humans were approved by Ethics Committee of Fuzhou Center for Disease Control and Prevention. The studies were conducted in accordance with the local legislation and institutional requirements. The participants provided their written informed consent to participate in this study.
Author contributions
YX: Conceptualization, Writing – review and editing, Methodology. YZ: Writing – review and editing, Writing – original draft. QC: Writing – original draft. XZ: Writing – review and editing. JF: Writing – review and editing. WX: Validation, Writing – review and editing. XZ: Methodology, Writing – review and editing, Conceptualization.
Funding
The author(s) declare that financial support was received for the research and/or publication of this article. This research was financially supported by Fuzhou Science and Technology Major Project (2019-SZ-63, 2020-Z-5 and 2022-S-032), and Fujian Provincial Healthand Family Planning Commission, China (2021Z01001).
Conflict of interest
The authors declare that the research was conducted in the absence of any commercial or financial relationships that could be construed as a potential conflict of interest.
Generative AI statement
The author(s) declare that no Generative AI was used in the creation of this manuscript.
Any alternative text (alt text) provided alongside figures in this article has been generated by Frontiers with the support of artificial intelligence and reasonable efforts have been made to ensure accuracy, including review by the authors wherever possible. If you identify any issues, please contact us.
Publisher’s note
All claims expressed in this article are solely those of the authors and do not necessarily represent those of their affiliated organizations, or those of the publisher, the editors and the reviewers. Any product that may be evaluated in this article, or claim that may be made by its manufacturer, is not guaranteed or endorsed by the publisher.
References
1
Anothaisintawee T. Lertrattananon D. Thamakaison S. Reutrakul S. Ongphiphadhanakul B. Thakkinstian A. (2017). Direct and indirect effects of serum uric acid on blood sugar levels in patients with prediabetes: a mediation analysis. J. Diabetes Res.2017, 6830671. 10.1155/2017/6830671
2
Borges R. L. Ribeiro A. B. Zanella M. T. Batista M. C. (2010). Uric acid as a factor in the metabolic syndrome. Curr. Hypertens. Rep.12 (2), 113–119. 10.1007/s11906-010-0098-2
3
Classification and diagnosis of diabetes: standards of medical care in Diabetes-2018 . Diabetes care41 (Suppl. 1), S13–S27. 10.2337/dc18-S002
4
Drogan D. Dunn W. B. Lin W. Buijsse B. Schulze M. B. Langenberg C. et al (2015). Untargeted metabolic profiling identifies altered serum metabolites of type 2 diabetes mellitus in a prospective, nested case control study. Clin. Chem.61 (3), 487–497. 10.1373/clinchem.2014.228965
5
Ecker J. Liebisch G. (2014). Application of stable isotopes to investigate the metabolism of fatty acids, glycerophospholipid and sphingolipid species. Prog. Lipid Res.54, 14–31. 10.1016/j.plipres.2014.01.002
6
Fu S. Yang L. Li P. Hofmann O. Dicker L. Hide W. et al (2011). Aberrant lipid metabolism disrupts calcium homeostasis causing liver endoplasmic reticulum stress in obesity. Nature473 (7348), 528–531. 10.1038/nature09968
7
Garberg G. Bengtsson Boström K. Hjerpe P. Ayala M. Lövestam Adrian M. Andersson T. (2025). Progress of diabetic retinopathy up to 24 years in patients with type 2 diabetes in Sweden: a cohort study from the skaraborgs diabetes register. BMJ Open Diabetes Res. Care13 (5), e005356. 10.1136/bmjdrc-2025-005356
8
Hu H. Liang W. Ding G. (2024). Ion homeostasis in diabetic kidney disease. Trends Endocrinol. Metab.35 (2), 142–150. 10.1016/j.tem.2023.09.009
9
Hyperuricemia M. I. (2017). Hyperuricemia, type 2 diabetes mellitus, and hypertension: an emerging association. Curr. Hypertens. Rep.19 (9), 69. 10.1007/s11906-017-0770-x
10
J S. C J. Z S. Teng W. Li J. (2022). Prevalence and risk factors of hyperuricemia and gout: a cross-Sectional survey from 31 provinces in mainland China. J. Transl. Intern. Med.10 (2), 134–145. 10.2478/jtim-2022-0031
11
Katsiki N. Papanas N. Fonseca V. A. Maltezos E. Mikhailidis D. P. (2013). Uric acid and diabetes: is there a link?Curr. Pharm. Des.19 (27), 4930–4937. 10.2174/1381612811319270016
12
Knebel B. Strassburger K. Szendroedi J. Kotzka J. Scheer M. Nowotny B. et al (2016). Specific metabolic profiles and their relationship to insulin resistance in recent-onset type 1 and type 2 diabetes. J. Clin. Endocrinol. Metab.101 (5), 2130–2140. 10.1210/jc.2015-4133
13
Kodama S. Saito K. Yachi Y. Asumi M. Sugawara A. Totsuka K. et al (2009). Association between serum uric acid and development of type 2 diabetes. Diabetes Care32 (9), 1737–1742. 10.2337/dc09-0288
14
Liu N. Sun Q. Xu H. Yu X. Chen W. Wei H. et al (2020). Hyperuricemia induces lipid disturbances mediated by LPCAT3 upregulation in the liver. Faseb J.34 (10), 13474–13493. 10.1096/fj.202000950R
15
Liu S. Wang Y. Liu H. Xu T. Wang M. J. Lu J. et al (2022). Serum lipidomics reveals distinct metabolic profiles for asymptomatic hyperuricemic and gout patients. Rheumatol. Oxf.61 (6), 2644–2651. 10.1093/rheumatology/keab743
16
Lu J. Lam S. M. Wan Q. Shi L. Huo Y. Chen L. et al (2019). High-coverage targeted lipidomics reveals novel serum lipid predictors and lipid pathway dysregulation antecedent to type 2 diabetes onset in normoglycemic Chinese adults. Diabetes Care42 (11), 2117–2126. 10.2337/dc19-0100
17
Mozaffarian D. (2016). Dietary and policy priorities for cardiovascular disease, diabetes, and obesity: a comprehensive review. Circulation133 (2), 187–225. 10.1161/CIRCULATIONAHA.115.018585
18
Petrenko V. Sinturel F. Riezman H. Dibner C. (2023). Lipid metabolism around the body clocks. Prog. Lipid Res.91, 101235. 10.1016/j.plipres.2023.101235
19
Ritter O. Jelenik T. Roden M. (2015). Lipid-mediated muscle insulin resistance: different fat, different pathways?J. Mol. Med. Berlin, Ger.93 (8), 831–843. 10.1007/s00109-015-1310-2
20
Samocha-Bonet D. Debs S. Greenfield J. R. (2018). Prevention and treatment of type 2 diabetes: a pathophysiological-based approach. Trends Endocrinol. Metabolism TEM29 (6), 370–379. 10.1016/j.tem.2018.03.014
21
Semova I. Biddinger S. B. (2021). Triglycerides in nonalcoholic fatty liver disease: guilty until proven innocent. Trends Pharmacol. Sci.42 (3), 183–190. 10.1016/j.tips.2020.12.001
22
Smith G. I. Polidori D. C. Yoshino M. Kearney M. L. Patterson B. W. Mittendorfer B. et al (2020). Influence of adiposity, insulin resistance, and intrahepatic triglyceride content on insulin kinetics. J. Clin. Investigation130 (6), 3305–3314. 10.1172/JCI136756
23
Song Y. Liang Q. Sun L. (2019). Research progress on the role of TLR4 signaling pathway in diabetic complications. China Clin. Pract. Med.10 (3), 3. 10.3760/cma.j.issn.1673-8799.2019.03.021
24
Sun Y. Ge X. Li X. He J. Wei X. Du J. et al (2020). High-fat diet promotes renal injury by inducing oxidative stress and mitochondrial dysfunction. Cell Death & Dis.11 (10), 914. 10.1038/s41419-020-03122-4
25
Sun H. Saeedi P. Karuranga S. Pinkepank M. Ogurtsova K. Duncan B. B. et al (2022). IDF diabetes atlas: global, regional and country-level diabetes prevalence estimates for 2021 and projections for 2045. Diabetes Res. Clin. Pract.183, 109119. 10.1016/j.diabres.2021.109119
26
Suomi T. Starskaia I. Kalim U. U. Rasool O. Jaakkola M. K. Grönroos T. et al (2023). Gene expression signature predicts rate of type 1 diabetes progression. EBioMedicine92, 104625. 10.1016/j.ebiom.2023.104625
27
Van Der Veen J. N. Lingrell S. Gao X. Quiroga A. D. Takawale A. Armstrong E. A. et al (2016). Pioglitazone attenuates hepatic inflammation and fibrosis in phosphatidylethanolamine N-methyltransferase-deficient mice. Am. J. Physiology Gastrointest. Liver Physiology310 (7), G526–G538. 10.1152/ajpgi.00243.2015
28
Van Der Veen J. N. Lingrell S. Mccloskey N. LeBlond N. D. Galleguillos D. Zhao Y. Y. et al (2019). A role for phosphatidylcholine and phosphatidylethanolamine in hepatic insulin signaling. FASEB J.33 (4), 5045–5057. 10.1096/fj.201802117R
29
Van Dierendonck X. Vrieling F. Smeehuijzen L. Deng L. Boogaard J. P. Croes C. A. et al (2022). Triglyceride breakdown from lipid droplets regulates the inflammatory response in macrophages. Proc. Natl. Acad. Sci. U. S. A.119 (12), e2114739119. 10.1073/pnas.2114739119
30
Vance J. E. (2015). Phospholipid synthesis and transport in mammalian cells. Traffic16 (1), 1–18. 10.1111/tra.12230
31
Wang R. Li B. Lam S. M. Shui G. (2020). Integration of lipidomics and metabolomics for in-depth understanding of cellular mechanism and disease progression. J. Genet. Genomics47 (2), 69–83. 10.1016/j.jgg.2019.11.009
32
Wymann M. P. Schneiter R. (2008). Lipid signalling in disease. Nat. Rev. Mol. Cell Biol.9 (2), 162–176. 10.1038/nrm2335
33
Xie D. Zhao H. Lu J. He F. Liu W. Yu W. et al (2021). High uric acid induces liver fat accumulation via ROS/JNK/AP-1 signaling. Am. J. Physiology Endocrinol. metabolism320 (6), E1032–E1043. 10.1152/ajpendo.00518.2020
34
Yang F. Liu M. Qin N. Li S. Yu M. Wang C. et al (2019). Lipidomics coupled with pathway analysis characterizes serum metabolic changes in response to potassium oxonate induced hyperuricemic rats. Lipids Health Dis.18 (1), 112. 10.1186/s12944-019-1054-z
Summary
Keywords
diabetes mellitus, hyperuricemia, lipid metabolism, lipidomics, triglycerides, phosphatidylethanolamine
Citation
Xu Y, Zhu Y, Chen Q, Zhang X, Fang J, Xu W and Zhang X (2025) UHPLC-MS/MS-based plasma untargeted lipidomic analysis in patients with diabetes mellitus combined with hyperuricemia. Front. Mol. Biosci. 12:1656458. doi: 10.3389/fmolb.2025.1656458
Received
30 June 2025
Revised
20 October 2025
Accepted
27 October 2025
Published
13 November 2025
Volume
12 - 2025
Edited by
Jian Zhi Hu, Pacific Northwest National Laboratory (DOE), United States
Reviewed by
Cristian D. Gutierrez Reyes, Texas Tech University, United States
Laura Beth McIntire, NewYork-Presbyterian, United States
Updates
Copyright
© 2025 Xu, Zhu, Chen, Zhang, Fang, Xu and Zhang.
This is an open-access article distributed under the terms of the Creative Commons Attribution License (CC BY). The use, distribution or reproduction in other forums is permitted, provided the original author(s) and the copyright owner(s) are credited and that the original publication in this journal is cited, in accordance with accepted academic practice. No use, distribution or reproduction is permitted which does not comply with these terms.
*Correspondence: Xiaoyang Zhang, dawnsunz@126.com; Youqiong Xu, joancoco@126.com
†These authors have contributed equally to this work
Disclaimer
All claims expressed in this article are solely those of the authors and do not necessarily represent those of their affiliated organizations, or those of the publisher, the editors and the reviewers. Any product that may be evaluated in this article or claim that may be made by its manufacturer is not guaranteed or endorsed by the publisher.