Abstract
Preeclampsia is a leading cause of maternal and perinatal morbidity associated with systemic lipid metabolism disturbances, yet the underlying molecular mechanisms remain incompletely understood. In this study, we integrated single-cell RNA-seq data from preeclamptic placentas with an in vitro hypoxia model to analyze gene expression changes across distinct trophoblast subpopulations. While all trophoblast lineages exhibited hypoxia-driven metabolic reprogramming, the response was highly cell-type specific. In the syncytiotrophoblast (SCT), the primary maternal-fetal barrier, preeclampsia was associated with a significant downregulation of LDLR and cholesterol biosynthesis genes (OR = 4.991, p = 6.30e−04). Concurrently, we observed increased expression of genes governing transcytosis (SCARB1, CAV1). In contrast, the extravillous trophoblast (EVT) displayed a divergent adaptive response, characterized by elevated LDLR expression and downregulated cholesterol biosynthesis. In vitro hypoxia modeling in BeWo b30 cells recapitulated the SCT-specific phenotype and identified a potential regulatory mechanism: a fivefold increase in PCSK9 expression (padj = 3.53e−10) and a 1.5-fold decrease in SNX17 (padj = 1.76e−04)—key regulators that limit lipoprotein receptor recycling. This was accompanied by the suppression of lipid biosynthesis genes and the transcriptional activation of pathways associated with transcytosis and cholesterol efflux. Collectively, these results confirm the pivotal role of hypoxic stress in disrupting placental lipid metabolism and reveal a subpopulation-specific transcriptional program in preeclampsia—a shift from endocytosis to transcytosis—that likely serves as a compensatory mechanism to ensure fetal lipid supply under conditions of limited availability.
1 Introduction
Preeclampsia represents one of the most severe complications of pregnancy, affecting 2%–8% of women worldwide (Dimitriadis et al., 2023; Ives et al., 2020). It accounts for up to 15% of maternal deaths (Say et al., 2014) and approximately 500,000 cases of intrauterine and neonatal mortality annually (Ngene and Moodley, 2024; Rana et al., 2019). This complex multisystem disorder is characterized by abnormal placentation in early pregnancy due to insufficient invasion of extravillous trophoblast (EVT) cells into the endometrium and inadequate remodeling of spiral arteries (Matsubara, 2017; Mitranovici et al., 2024). These processes lead to placental ischemia and hypoxia, which are traditionally considered key pathophysiological mechanisms of preeclampsia (Ives et al., 2020; Matsubara, 2017). The early-onset form of the disease (before 34 weeks of gestation) is marked by more pronounced defects in placentation and activation of hypoxic signaling pathways, including a significant increase in HIF-1α–mediated mechanisms (Matsubara, 2017; He et al., 2023).
The risk of developing preeclampsia is closely associated with lipid metabolism disorders. It increases with a higher proportion of trans-unsaturated fatty acids (TFAs) (Williams et al., 1998) and polyunsaturated fatty acids (PUFAs) (Clausen et al., 2001), with reduced serum omega-3 PUFA levels (Williams et al., 1995), as well as in the presence of maternal dyslipidemia (Wojcik-Baszko et al., 2018; Poornima et al., 2022). Moreover, lipid peroxidation products are elevated in preeclampsia and can induce endothelial damage in the mother (Hubel et al., 1989; Negre-Salvayre et al., 2022). Lipoprotein(a) [Lp(a)], the main carrier of oxidized phospholipids (Bergmark et al., 2008), has also been found to be significantly elevated in the plasma of preeclamptic patients (Bayhan et al., 2005; Konrad et al., 2020), which appears to correlate with disease development (Arifin et al., 2017). Metabolomic studies indicate that sterol, phospholipid, and sphingolipid metabolism is among the downregulated biochemical pathways in preeclampsia (Odenkirk et al., 2020; Yang et al., 2022; Hart, 2024). According to meta-analyses, women who later develop preeclampsia exhibit persistently elevated levels of low-density lipoproteins (LDL) throughout all trimesters, while high-density lipoproteins (HDL) decrease in the third trimester (Spracklen et al., 2014). Another meta-analysis demonstrated a significant increase in very-low-density lipoproteins (VLDL) before and during the onset of preeclampsia, implicating their role in endothelial dysfunction (Yang S. et al., 2025). Furthermore, pregnant women with preeclampsia show elevated maternal serum triglycerides, whereas umbilical cord blood displays increased cholesterol but not triglyceride levels (Stadler et al., 2023). These findings collectively confirm that alterations in maternal lipid metabolism play a crucial role in the pathogenesis of preeclampsia.
Pregnancy is accompanied by a pronounced remodeling of lipid metabolism. In the third trimester, lipolysis in adipose tissue intensifies, leading to elevated levels of free fatty acids, their re-esterification in the liver, and the development of maternal physiological hypercholesterolemia (Herrera et al., 2006; Jayalekshmi and Ramachandran, 2021). This condition is characterized by a 30%–50% increase in plasma lipoprotein concentrations during the second and third trimesters, followed by normalization after delivery (Wild and Feingold, 2023). Since the fetus has a limited capacity for endogenous lipid synthesis, the primary source of lipids is their transport from the maternal circulation across the placenta (Horne et al., 2019). Lipoproteins are unable to directly cross the placental barrier; therefore, their delivery occurs mainly through hydrolysis into free fatty acids at the cell surface, endocytosis of lipoprotein particles, and transcytosis, which ensures their direct transfer into the fetal bloodstream (Fuchs and Ellinger, 2004). Lipid transport through the trophoblast is mediated by receptor-dependent mechanisms (Cooke et al., 2021). The key mediators of this process include LDLR and SR-BI, which are involved in the uptake of low- and high-density lipoproteins (Kakava et al., 2022; Bolanle et al., 2025), as well as the ATP-binding cassette transporters ABCA1 and ABCG1, which regulate cholesterol efflux (Fuenzalida et al., 2020; Kallol and Albrecht, 2020). Collectively, these systems ensure both lipid uptake and transfer required for normal fetal development.
To investigate the mechanisms of nutrient transport and its regulation under hypoxic conditions, in vitro trophoblast cell models are commonly used (Knyazev et al., 2025). The BeWo b30 cell line is widely applied and is typically exposed to chemical hypoxia inducers such as oxyquinoline derivatives (OD), which act as inhibitors of HIF prolyl hydroxylases (Fuenzalida et al., 2022; Knyazev et al., 2019). These compounds mimic hypoxic conditions by stabilizing HIF-1α and activating the corresponding signaling cascades (Albers et al., 2019). However, the impact of hypoxia on lipid metabolism in such models and its correspondence to the alterations observed in preeclampsia in vivo remain insufficiently studied.
Cell lines provide a convenient means for modeling hypoxic conditions but fail to reproduce the heterogeneity of the trophoblast in vivo. The trophoblast is subdivided into villous cytotrophoblast (VCT), syncytiotrophoblast (SCT), and extravillous trophoblast (EVT), each subpopulation performing unique functions in placentation (Matsubara, 2017). Notably, the SCT serves as the main barrier and transport interface of the placenta (Cooke et al., 2021; Fan et al., 2024). Modern single-cell sequencing techniques allow for detailed analysis of molecular changes within these trophoblast subpopulations in preeclampsia, enabling the identification of specific gene expression patterns (Turco et al., 2018; Varberg et al., 2023).
The aim of this study was to compare the changes in the expression of lipid metabolism genes across three trophoblast subpopulations in vivo in preeclampsia with those observed in the BeWo b30 cell line in vitro under chemically induced hypoxia. The study design is presented in the Supplementary Figure S1. The obtained data made it possible to identify differences in lipid metabolism among distinct trophoblast subpopulations and to characterize the alterations occurring in preeclampsia and under induced hypoxia in vitro, which is essential for the validation and application of existing cellular models of the disease.
2 Materials and methods
2.1 Single-cell mRNA-seq analysis
Single-cell mRNA-seq analysis was performed using previously published data by Admati et al. (2023). Briefly, the dataset included samples from early-onset preeclampsia, with a total of 10 preeclampsia cases compared to three non-preeclamptic controls, all from primiparous singleton pregnancies. All donors were diagnosed according to the American College of Obstetricians and Gynecologists criteria (Gynecologists, 2020). Exclusion criteria included chronic maternal diseases and fetal malformations.
Cell clusters were visualized using principal component analysis (PCA) and UMAP based on scRNA-seq data preprocessed according to standard procedures using the Scanpy package, version 1.11.4 (Wolf et al., 2018; McInnes et al., 2025). Differential gene expression analysis within the main trophoblast cell clusters (VCT, SCT, EVT) was conducted using the non-parametric Mann–Whitney U test with multiple-testing correction according to the Benjamini–Hochberg method.
Additionally, normalized counts per million (CPM) were calculated from the raw data. For each cluster–experimental group combination, the fraction of cells with detectable expression, the median, and the 95th percentile of expression levels were computed. For further analysis of gene expression intensity, a subset of cells with expression above the global 95th percentile CPM within each cluster was selected, and expression values were compared between groups using analysis of variance (ANOVA) from the SciPy package, version 1.16.2 (Virtanen et al., 2020).
2.2 Differential gene expression analysis in trophoblast populations
To further assess differential gene expression (DEGs), a pseudobulk analysis was performed. For this, raw counts were aggregated within each biological sample and cell type, followed by differential expression analysis using the DESeq2 package, version 1.48.2 (Love et al., 2014). Based on the resulting data, pathway enrichment analysis (GSEA) was conducted using the fgsea package, version 1.34.2, against the Hallmark and Gene Ontology: Biological Process (GO:BP) collections, with Wald test statistics from DESeq2 used as the ranking metric (Subramanian et al., 2005; Korotkevich et al., 2016; Liberzon et al., 2015; Ashburner et al., 2000). Statistical significance of overlaps between DEG sets was evaluated using Fisher’s exact test.
2.3 Cell culture
BeWo b30 choriocarcinoma cells, used as a model of trophoblasts, were kindly provided by Prof. Dr. Christiane Albrecht (University of Bern, Switzerland) with permission from Prof. Dr. Alan Schwartz (Washington University in St. Louis, United States). BeWo b30 cells were cultured in 25 cm2 flasks with ventilated caps (Costar, Corning) at 37 °C and 5% CO2 in an MCO-18AC incubator (Sanyo), in DMEM medium (4.5 g/L glucose) supplemented with 10% FBS (Capricorn, United States), 1% MEM Non-Essential Amino Acids (100×), 2 mM L-glutamine, and 1% Penicillin–Streptomycin solution (10,000 U/mL) (all reagents from Gibco, Thermo Fisher Scientific, United States). Cells were passaged every 2–3 days using 0.25% trypsin–EDTA solution (PanEco, Cat. No. P034). Cell count, viability, and size were assessed by trypan blue staining using a LUNA-II Automated Cell Counter (Logos Biosystems).
2.4 Hypoxia induction in BeWo b30 cells
For hypoxia induction experiments, once BeWo b30 cells reached approximately 80% confluence, the culture medium was replaced either with fresh medium (control) or with medium containing 5 µM of the 8-hydroxyquinoline derivative 4,896–3,212 (ChemRar, Russia), a chemical activator of the HIF-1 signaling pathway (Knyazev et al., 2021). In all experimental conditions, the medium contained 0.05% DMSO. After 24 h of incubation, cells were lysed in 700 µL of QIAzol Lysis Reagent (QIAGEN, Germany).
2.5 mRNA sequencing
RNA preparation was performed as previously described (Knyazev et al., 2025). Briefly, total RNA was extracted using the miRNeasy Mini Kit (QIAGEN, Germany). RNA concentration was determined using a NanoDrop 1,000 spectrophotometer (Thermo Fisher Scientific, United States), and RNA quality was assessed with an Agilent 2,100 Bioanalyzer (Agilent Technologies, United States). The RNA integrity number (RIN) was at least nine for all analyzed samples.
Next-generation sequencing (NGS) libraries were prepared using the Illumina Stranded mRNA Library Prep Kit (Illumina, United States) to generate 75-bp single-end reads. Sequencing was performed on a NextSeq 550 system (Illumina, United States).
2.6 mRNA sequencing data analysis
Quality assessment of the obtained FASTQ files was performed using FastQC v0.11.9 (Simon, 2010). Adapter sequences and low-quality bases were trimmed with cutadapt v2.10 (Martin, 2011). The processed reads were mapped to the human reference genome (GENCODE GRCh38. p13) using the STAR v2.7.5b aligner (Dobin et al., 2013).
Library size normalization was carried out using the trimmed mean of M-values (TMM) method implemented in the edgeR v3.30.3 package (Chen et al., 2025), with default filtering of lowly expressed genes. Normalized FPKM (fragments per kilobase of transcript per million mapped reads) values were calculated using the same package and log-transformed. For subsequent analyses, only highly expressed genes were retained, excluding the 25% of genes with the lowest median FPKM values in each experimental group. The obtained results have been deposited in the Gene Expression Omnibus (GEO) under accession number GSE308908.
To evaluate changes in cellular signaling pathway activity after hypoxia induction in BeWo b30 cells, Gene Set Enrichment Analysis (GSEA) was performed using the MSigDB Hallmark gene set collection. Genes were ranked according to the Wald statistic obtained from differential expression analysis using DESeq2 (Love et al., 2014). Enrichment significance was determined based on the normalized enrichment score (NES) and FDR q-value (<0.05).
2.7 Bioinformatic analysis of transcription factor activity
To assess the statistical significance of transcription factor activation changes, a one-sided Fisher’s exact test (fisher_exact, SciPy library v1.13.1) was applied. The test was conducted on a list of known transcription factor targets obtained from the TRRUST v.2 database (https://www.grnpedia.org/trrust/) (Han et al., 2018), which also provided the direction of regulation. Transcription factor activation was determined based on changes in the expression of target genes consistent with the direction of regulation. For Activation, an increase in expression with log2FC greater than 0.6 (FDR <0.05) was considered. For Repression, a decrease in expression with log2FC less than −0.6 (FDR <0.05) was taken into account, compared to the control cell line. Transcription factors were considered significantly enriched in activated targets if the Fisher’s exact test FDR value, adjusted by the Benjamini–Hochberg method, was <0.05.
2.8 Real-time PCR analysis
Cells were lysed using QIAzol Lysis Reagent (Qiagen, Cat. No. 79306), and total RNA was extracted with the miRNeasy Mini Kit (Qiagen, Cat. No. 74104) according to the manufacturer’s protocol. RNA concentration was measured using a NanoDrop ND-1000 spectrophotometer (Thermo Fisher Scientific, United States). Reverse transcription was performed using the MMLV Reverse Transcriptase Kit (Eurogene, Cat. No. SK021) following the manufacturer’s instructions, and the resulting complementary DNA (cDNA) was stored at −20 °C. Quantitative PCR (qPCR) was carried out on a DT-96 thermocycler (DNA-Technology, Russia) using the qPCRmix-HS SYBR reagent (Eurogene, Cat. No. PK147L) according to the manufacturer’s recommendations. Oligonucleotide primers for qPCR were designed based on mRNA sequences obtained from the UCSC Genome Browser database (Karolchik et al., 2003) using the Primer-BLAST tool (Ye et al., 2012). Potential secondary structure formation and homo-/heterodimerization were evaluated using OligoAnalyzer 3.1 (https://www.idtdna.com/pages/tools/oligoanalyzer). The reference genes ACTB and GUSB were used for normalization. Primer sequences are provided in Supplementary Table S1.
2.9 Lipid droplet staining
BeWo b30 cells were seeded into 96-well plates at a density of 3 × 10⁴ cells per well (in five replicates) and incubated overnight. The next day, cells were treated with 5 µM of the 8-hydroxyquinoline derivative 4,896–3,212 for 24 h. Control cells were cultured in parallel wells with the addition of 0.05% DMSO to the culture medium. For Oil Red O staining of lipid droplets, cells were washed twice with PBS, fixed in 10% formalin for 30 min, washed twice with distilled water (1 min each), and incubated for 5 min in 60% isopropanol. Cells were then stained with Oil Red O solution (1.8 mg/mL in 60% isopropanol) for 20 min, followed by five washes with deionized water to remove excess dye. Stained cells were visualized using a ZOE Fluorescent Cell Imager (Bio-Rad, United States). For quantitative analysis of lipid accumulation, the retained Oil Red O dye was extracted with 100% isopropanol under gentle shaking at room temperature for 5 min. The extracts were transferred to a new 96-well plate, and optical density was measured at 492 nm using a SpectraMax i3x microplate reader (Molecular Devices, United States). Statistical analysis was performed using the Mann–Whitney U test.
2.10 Exosome isolation and nanoparticle tracking analysis (NTA)
For hypoxia induction, BeWo b30 cells were incubated either in the presence of the 8-hydroxyquinoline derivative 4,896–3,212 (OD) or, under control conditions, with the addition of 0.05% DMSO. After 24 h, the culture medium was replaced with serum-free medium, and the cells were incubated for an additional 24 h. The collected conditioned medium was filtered through a 0.22 µm syringe filter (Pall Life Sciences, Port Washington, United States). A PEG 6000 solution (Sigma-Aldrich, St. Louis, United States) was added to the filtrate to a final concentration of 8% (w/v), and the mixture was incubated at 4 °C for 16 h. Samples were then centrifuged at 16,000 × g for 1 h at 4 °C. The resulting small extracellular vesicle (sEV) pellet was washed with PBS, resuspended in 0.2 mL of filtered PBS, and immediately analyzed by Nanoparticle Tracking Analysis (NTA).
Particle size distribution and concentration of isolated vesicles were determined using Nanoparticle Tracking Analysis (NTA) on a NanoSight NS300 instrument (NanoSight Ltd., Amesbury, UK). All measurements were performed in accordance with ASTM E2834-12R18 guidelines. Samples were diluted with filtered PBS to a final concentration of approximately 1.5 × 10⁸ particles/mL. Videos of Brownian motion were recorded at room temperature with passive temperature sensing under the following settings optimized for EV analysis: camera level 12, shutter 850, gain 450, low threshold 715, high threshold 10,725. Video processing was performed using NTA software version 3.4 build 0,033 (NanoSight Ltd.) with a detection threshold of 5%. For reliable quantification, at least five 60-s videos were recorded and analyzed at 25 frames per second. Data from multiple videos were combined to generate a particle size distribution histogram and to calculate the mean total particle concentration, accounting for the dilution factor. Statistical analysis of differences between the control group and the group treated with the 8-hydroxyquinoline derivative was performed using one-way ANOVA.
3 Results
3.1 Identification and characterization of trophoblast subpopulations
Previously published single-cell RNA-sequencing data were used for analysis. From the complete dataset, trophoblast cells were extracted and subdivided into three subpopulations: syncytiotrophoblast (SCT, n = 2,104), extravillous trophoblast (EVT, n = 1,238), and villous cytotrophoblast (VCT, n = 9,967) (Figure 1A).
FIGURE 1

Identification and Characterization of Trophoblast Subpopulations. (A) UMAP clustering of trophoblast cells based on single-cell RNA-seq data. VCT (cytotrophoblast) cells are shown in gray, SCT (syncytiotrophoblast) in blue, and EVT (extravillous trophoblast) in red; (B) Heatmap showing the top 10 most differentially expressed genes characteristic of each trophoblast population.
The thirty most significant differentially expressed genes among trophoblast subtypes are shown in the heatmap (Figure 1B). Several of these correspond to well-established markers of specific trophoblast lineages: PRG2 and EBI3 for EVT; CGA and CYP19A1 for SCT; PAGE4 and ITGA6 for VCT (Zhou et al., 2022; Hoshiyama et al., 2025; Zhang et al., 2025).
3.2 Differential expression and gene signature changes in trophoblast populations
Analysis of differential gene expression between trophoblast populations in preeclampsia and control samples revealed that the highest number of genes with |log2FC| > 0.6 and padj < 0.05 was detected in SCT (440 genes), while the lowest number was observed in EVT (75 genes) (Figures 2A–C).
FIGURE 2

Differential gene expression in trophoblast populations in preeclampsia compared to controls (|Log2FC| > 0.6, padj < 0.05). (A) Volcano plot for SCT; (B) Volcano plot for VCT; (C) Volcano plot for EVT; (D) Venn diagram of upregulated genes shared between trophoblast populations; (E) Venn diagram of downregulated genes.
Eight genes were upregulated in preeclampsia across all trophoblast populations (Figure 2D). Among them, fibronectin 1 (FN1), a marker of vascular injury previously reported to be elevated in preeclamptic patients (Wu et al., 2021), and lactate dehydrogenase A (LDHA), whose serum levels have been suggested as a marker of preeclampsia and disease severity (Nasir et al., 2025).
Conversely, six genes were downregulated across all clusters (Figure 2E), including CGA (Glycoprotein Hormones, Alpha Polypeptide), which encodes the α-subunit of several glycoprotein hormones, including chorionic gonadotropin (hCG), luteinizing hormone (LH), follicle-stimulating hormone (FSH), and thyroid-stimulating hormone (TSH). During pregnancy, its role in hCG synthesis is crucial, as hCG maintains corpus luteum function and stimulates progesterone production. Previous studies have shown that reduced hCG expression may be associated with impaired placental function in early pregnancy (Tóth et al., 2024), including in preeclampsia (Mohammed et al., 2022).
Gene set enrichment analysis (GSEA) using the MSigDB HALLMARK collection revealed differences between trophoblast populations: EVT showed 22 upregulated and nine downregulated pathways, SCT had nine upregulated and six downregulated, and VCT displayed six upregulated and five downregulated pathways (see Supplementary Figure S2). Among the pathways significantly upregulated across all clusters were HALLMARK_HYPOXIA, HALLMARK_ESTROGEN_RESPONSE_EARLY, HALLMARK_INTERFERON_ALPHA_RESPONSE, HALLMARK_TNFA_SIGNALING_VIA_NFKB, and HALLMARK_INTERFERON_GAMMA_RESPONSE. Downregulated pathways common to all populations included HALLMARK_G2M_CHECKPOINT, HALLMARK_OXIDATIVE_PHOSPHORYLATION, HALLMARK_ADIPOGENESIS, and HALLMARK_E2F_TARGETS. Notably, HYPOXIA was among the most strongly activated pathways in all populations: EVT–NES = 2.34 (padj = 6.30e-11); SCT–NES = 2.16 (padj = 2.17e-9); VCT–NES = 1.87 (padj = 1.40e-5).
Analysis of MSigDB GO: Biological Process pathways indicated that preeclampsia affects multiple lipid metabolism-related pathways. In EVT, the GOBP_MEMBRANE_LIPID_CATABOLIC_PROCESS pathway was upregulated (NES = 1.98, padj = 0.011), suggesting increased demand for energy or membrane components. In SCT, GOBP_FATTY_ACYL_COA_METABOLIC_PROCESS was significantly downregulated (NES = −2.08, padj = 0.035), indicating reduced fatty acid (CoA-derivative) metabolism, which may decrease fatty acid oxidation and lipid-based energy production. In VCT, GOBP_MEMBRANE_LIPID_METABOLIC_PROCESS was also downregulated (NES = −1.56, padj = 0.024). Collectively, these results suggest that preeclampsia activates lipid catabolic processes in EVT, whereas SCT and VCT exhibit suppressed lipid metabolism, reflecting differences in metabolic demands and functional states among trophoblast subpopulations.
3.3 Analysis of metabolic gene expression in trophoblast populations
Lipoproteins are internalized into trophoblast cells via both clathrin- and caveolin-dependent endocytic pathways (Cooke et al., 2021). For LDL, the primary mechanism is clathrin-mediated endocytosis through the LDL receptor (LDLR), in which the adaptor protein ARH (LDLRAP1) links the receptor to the clathrin complex (Maxfield and van Meer, 2010; Go and Mani, 2012; Palinski, 2009; He et al., 2002). After internalization, LDLR is recycled back to the cell surface with the involvement of Sorting nexin 17 (SNX17) (Farfán et al., 2013; Burden et al., 2004). Proprotein convertase subtilisin/kexin type 9 (PCSK9) plays a key regulatory role by directing LDLR to lysosomal degradation (Zhang et al., 2008). In addition to LDLR, SR-BI (SCARB1) participates in lipoprotein endocytosis; it can bind both LDL and HDL (Wittmaack et al., 1995; Wadsack et al., 2003). Unlike LDLR, SR-BI undergoes caveolin-mediated internalization (Kakava et al., 2022) and facilitates transcytosis of captured lipoproteins (Bolanle et al., 2025).
Analysis of single-cell sequencing data from trophoblast subpopulations revealed that genes involved in exogenous cholesterol uptake showed the most pronounced changes for LDLR and clathrin light chains (CLTA, CLTB) (Figure 3). Among trophoblast populations, LDLR expression was highest in the SCT cluster (Figure 3), consistent with the role of SCT in maternal lipoprotein uptake (Bolanle et al., 2025). In preeclampsia, LDLR expression decreased in VCT and SCT, with the most pronounced reduction observed in SCT (95th percentile CPM: Ctrl = 608.6; PE = 462.1, p = 0.025) (Supplementary Figure S3A). Conversely, in EVT, a trophoblast population with initially low LDLR expression, its levels increased, both in the 95th percentile CPM (Ctrl = 181.6; PE = 380.6, p = 0.037) and in median CPM and the percentage of positive cells (Supplementary Figure S3).
FIGURE 3

Dot plot of gene expression changes in trophoblast populations (VCT, SCT, EVT) in preeclampsia relative to control. (A) Genes involved in exogenous lipid uptake. (B) Cholesterol biosynthesis genes. (C) Genes involved in lipid transcytosis and efflux. Dot color indicates log2 fold change of the 95th percentile CPM (red–upregulated, blue–downregulated, white–unchanged). Dot size reflects the relative expression level of each gene in the control group (95th percentile CPM).
Additionally, CLTA expression decreased across all clusters, whereas CLTB expression increased in SCT (95th percentile CPM: Ctrl = 627; PE = 946, p = 3.55e-06). Considering that clathrin heavy chain (CLTC) is initially expressed at a lower level, it may act as a limiting factor in clathrin-mediated endocytosis. CLTC expression remained stable in VCT and SCT and showed a non-significant increase in EVT (95th percentile CPM: Ctrl = 276.9; PE = 363.3; p = 0.79).
De novo cholesterol biosynthesis is a series of sequential reactions predominantly occurring on the endoplasmic reticulum membrane (Ikonen, 2008). Analysis of gene expression involved in cholesterol biosynthesis across trophoblast populations showed higher expression in VCT and SCT compared to EVT (Figure 3B; Supplementary Figure S4).
Preeclampsia led to reduced expression of most cholesterol biosynthesis genes in all trophoblast populations. In VCT, 16 out of 19 genes were downregulated, including the rate-limiting enzyme HMGCR (p = 7.82e-07) (Ridgway and McLeod, 2008). In SCT, 11 out of 19 genes exhibited decreased expression, also including HMGCR (95th percentile CPM: Ctrl = 383.8; PE = 291.6, p = 0.0036). In EVT, 10 out of 19 cholesterol biosynthesis genes showed reduced expression in preeclampsia (Figure 3B).
To assess the statistical significance of these changes in the context of global transcriptomic alterations, we tested the hypothesis that cholesterol biosynthesis gene downregulation is significant. In VCT, 7,323 out of 24,859 genes showed lower expression in preeclampsia compared to control, confirming the significance of cholesterol biosynthesis gene downregulation (odds ratio, OR = 12.8; p = 1.17e-06). Statistically significant results were also observed in SCT (4,536 out of 20,970 genes downregulated; OR = 4.991; p = 6.30e-04) and EVT (5,181 out of 20,459 genes downregulated; OR = 4.061; p = 2.55e-03).
SCARB1, encoding the main receptor mediating lipoprotein particle transcytosis, showed increased expression in preeclampsia in SCT (95th percentile CPM: Ctrl = 176.7; PE = 271.5, p = 3.00e-07) and EVT (95th percentile CPM: Ctrl = 265.1; PE = 389.2, p = 0.037) clusters. In addition, CAV1, required for SCARB1-mediated caveolin-dependent endocytosis, was upregulated in all clusters (p < 0.01) (Figure 3C).
Interestingly, SOAT1, encoding the enzyme catalyzing cholesterol esterification and subsequent storage in lipid droplets, was not expressed in SCT. The absence of SOAT1 may reflect a barrier function of this cell population rather than a storage role.
In EVT, preeclampsia induced pronounced changes in cholesterol transporter expression: ABCG1 was significantly downregulated (95th percentile CPM: Ctrl = 335.2; PE = 146.0, p = 3.60e-07), while ABCA1 showed a trend toward upregulation (95th percentile CPM: Ctrl = 261.4; PE = 528.2, p = 0.11) (Figure 3C; Supplementary Figure S5).
3.4 Analysis of differentially expressed genes in BeWo b30 cells following hypoxia induction
Hypoxia induction using the oxoquinoline derivative in BeWo b30 cells resulted in changes in the expression of 4,879 genes, of which 2,562 were upregulated and 2,317 were downregulated (see Figure 4). The full list of genes is provided in Supplementary Table S2.
FIGURE 4

Volcano plots illustrating differential gene expression in BeWo b30 cells following hypoxia induction by OD treatment. Thresholds: |log2FC| > 0.6, FDR-adjusted p-value <0.05, baseMean >1.
Among the most significantly altered genes following OD treatment were LOXL2 (log2FC = 6.51, padj = 6.79e-232), BIRC7 (log2FC = 7.22, padj = 1.29e-214), KPNA2, and BHLHE40. These genes are associated with hypoxic signal transduction, epithelial–mesenchymal transition (EMT), and cellular adaptation to stress. LOXL2, a known HIF target, participates in extracellular matrix remodeling under hypoxic conditions (Schietke et al., 2010), whereas BHLHE40 (DEC1), induced by HIF-1α, acts as a transcriptional repressor of angiogenesis and proliferation (Acosta-Iborra et al., 2024). In addition, a pronounced upregulation of SLC2A3 (GLUT3, log2FC = 3.08, padj = 2.03e-198) — a glucose transporter—is consistent with its well-established role as a hypoxia marker in trophoblast cells (Hu et al., 2022).
Analysis of overlapping differentially expressed genes (DEGs) in BeWo b30 cells revealed the strongest concordance with syncytiotrophoblasts (SCT) after preeclampsia: 171 shared genes, including 119 unique to the BeWo b30 Oxy–SCT intersection. The number of overlapping genes with villous cytotrophoblasts (VCT) and extravillous trophoblasts (EVT) was 124 and 26, respectively (see Supplementary Figure S6A). Comparison with OD-treated cells demonstrated a pronounced concordance of DEGs between BeWo b30 and SCT (OR = 4.46; n = 391; padj = 5.4e-12). In VCT, the effect was weak and not statistically significant (OR = 1.18; n = 935; padj = 0.17), while in EVT, the odds ratio was high but did not reach significance due to the small overlap (OR = 5.00; n = 32; padj = 0.065).
Furthermore, OD treatment in BeWo b30 cells led to increased expression of FN1 (FC = 1.45, padj = 0.045) and LDHA (FC = 1.64, padj = 1.04e-08), along with decreased expression of CGA (FC = −1.41, padj = 0.0018), which mirrors the expression changes observed across all trophoblast subpopulations in preeclampsia. These findings highlight the similarity between OD-induced hypoxia in BeWo cells and syncytiotrophoblasts in preeclampsia (Zhao et al., 2021), further supported by the expression of CGA and CYP19A1 markers (see Supplementary Figure S6B).
3.5 Changes in signaling pathways during the hypoxic response in BeWo b30 cells
To evaluate the biological processes involved in the BeWo b30 cell response to hypoxia induction, a GSEA enrichment analysis was performed using the HALLMARK gene set collection. A total of 32 significantly enriched signatures were identified, including 16 upregulated and 16 downregulated pathways (Supplementary Table S3). Pathways that showed consistent upregulation both in trophoblast populations affected by preeclampsia and in BeWo b30 cells under OD-induced hypoxia included HALLMARK_HYPOXIA (NES = 2.73, padj = 2.31e-30), HALLMARK_TNFA_SIGNALING_VIA_NFKB (NES = 2.21, padj = 1.47e-11), and HALLMARK_ESTROGEN_RESPONSE_EARLY (NES = 1.57, padj = 0.0008). In contrast, pathways exhibiting decreased activity included HALLMARK_G2M_CHECKPOINT (NES = −2.54, padj = 4.35e-26), HALLMARK_OXIDATIVE_PHOSPHORYLATION (NES = −2.52, padj = 7.61e-25), HALLMARK_E2F_TARGETS (NES = −2.58, padj = 4.86e-29), and HALLMARK_ADIPOGENESIS (NES = −1.55, padj = 0.0017).
To assess independent activation or repression of pathways, overlap analysis of genes from the GSEA leading edges was performed and visualized as interaction graphs. Among the upregulated gene sets, a single major cluster was formed, centered around Hypoxia, Glycolysis, and TNFα signaling via NFκB. For example, within the Glycolysis pathway, 58 out of 189 genes were part of the leading edge, 36 of which (62%) overlapped with Hypoxia (Supplementary Figure S7). The high degree of clustering, reflecting a substantial overlap of activated genes, indicates partial dependence of these pathways on the hypoxic response, which appears to serve as a central regulatory core.
Among the downregulated gene sets in BeWo b30 cells after OD treatment, two major clusters were identified (Supplementary Figure S8). The first cluster comprised G2M checkpoint and E2F targets (with 57/133 (43%) and 136/324 (42%) leading-edge gene overlap, respectively). The second cluster was centered around Oxidative phosphorylation, showing overlap with Fatty acid metabolism (15/42, 36%) and Adipogenesis (26/70, 37%). These findings suggest partially independent suppression of these pathways, reflecting a simultaneous inhibition of metabolism and cell proliferation.
A hypergeometric analysis of transcription factor activity revealed two functional groups of significantly activated regulators (Supplementary Table S4). The first group (HIF1A, NFKB1, TP53) was associated with hypoxic and cellular stress responses, reflecting the activation of oxygen deprivation–related mechanisms. The second group (WT1, JUN, KLF4) was linked to vascular differentiation and trophoblast function, indicating an influence on placental development and vascular processes. Among the downregulated transcription factors were E2F1 (padj = 0.0036), which controls the cell cycle and proliferation, and MYC (padj = 0.0094), a key regulator of cell growth and metabolism, including lipid metabolism. Together with the inactivation of the corresponding signaling pathways (Supplementary Table S2), these results indicate a global suppression of metabolic and proliferative activity in BeWo b30 cells under OD-induced hypoxia.
3.6 Changes in the expression of lipid metabolism genes induced by hypoxia in BeWo b30 cells
Based on transcriptomic analysis, LDLR expression did not change significantly (FC = −1.05, padj = 6.86e-01) (Figure 5A), which was consistent with the qPCR results (FC = 1.469, p = 0.18). In contrast, OD treatment caused a significant downregulation of CLTA (FC = −1.27, padj = 2.83e-02), CLTB (FC = −1.56, padj = 2.55e-05), and CLTC (FC = −1.35, padj = 1.99e-03; qPCR: FC = −2.27, p = 0.0071). At the same time, OD induced a marked increase in PCSK9 expression by 5.41-fold (padj = 3.53e-10) and a 1.5-fold decrease in SNX17 expression (padj = 1.76e-04), further reducing the efficiency of exogenous cholesterol uptake. Collectively, these findings indicate that exogenous cholesterol uptake is impaired under OD-induced hypoxia in BeWo b30 cells.
FIGURE 5
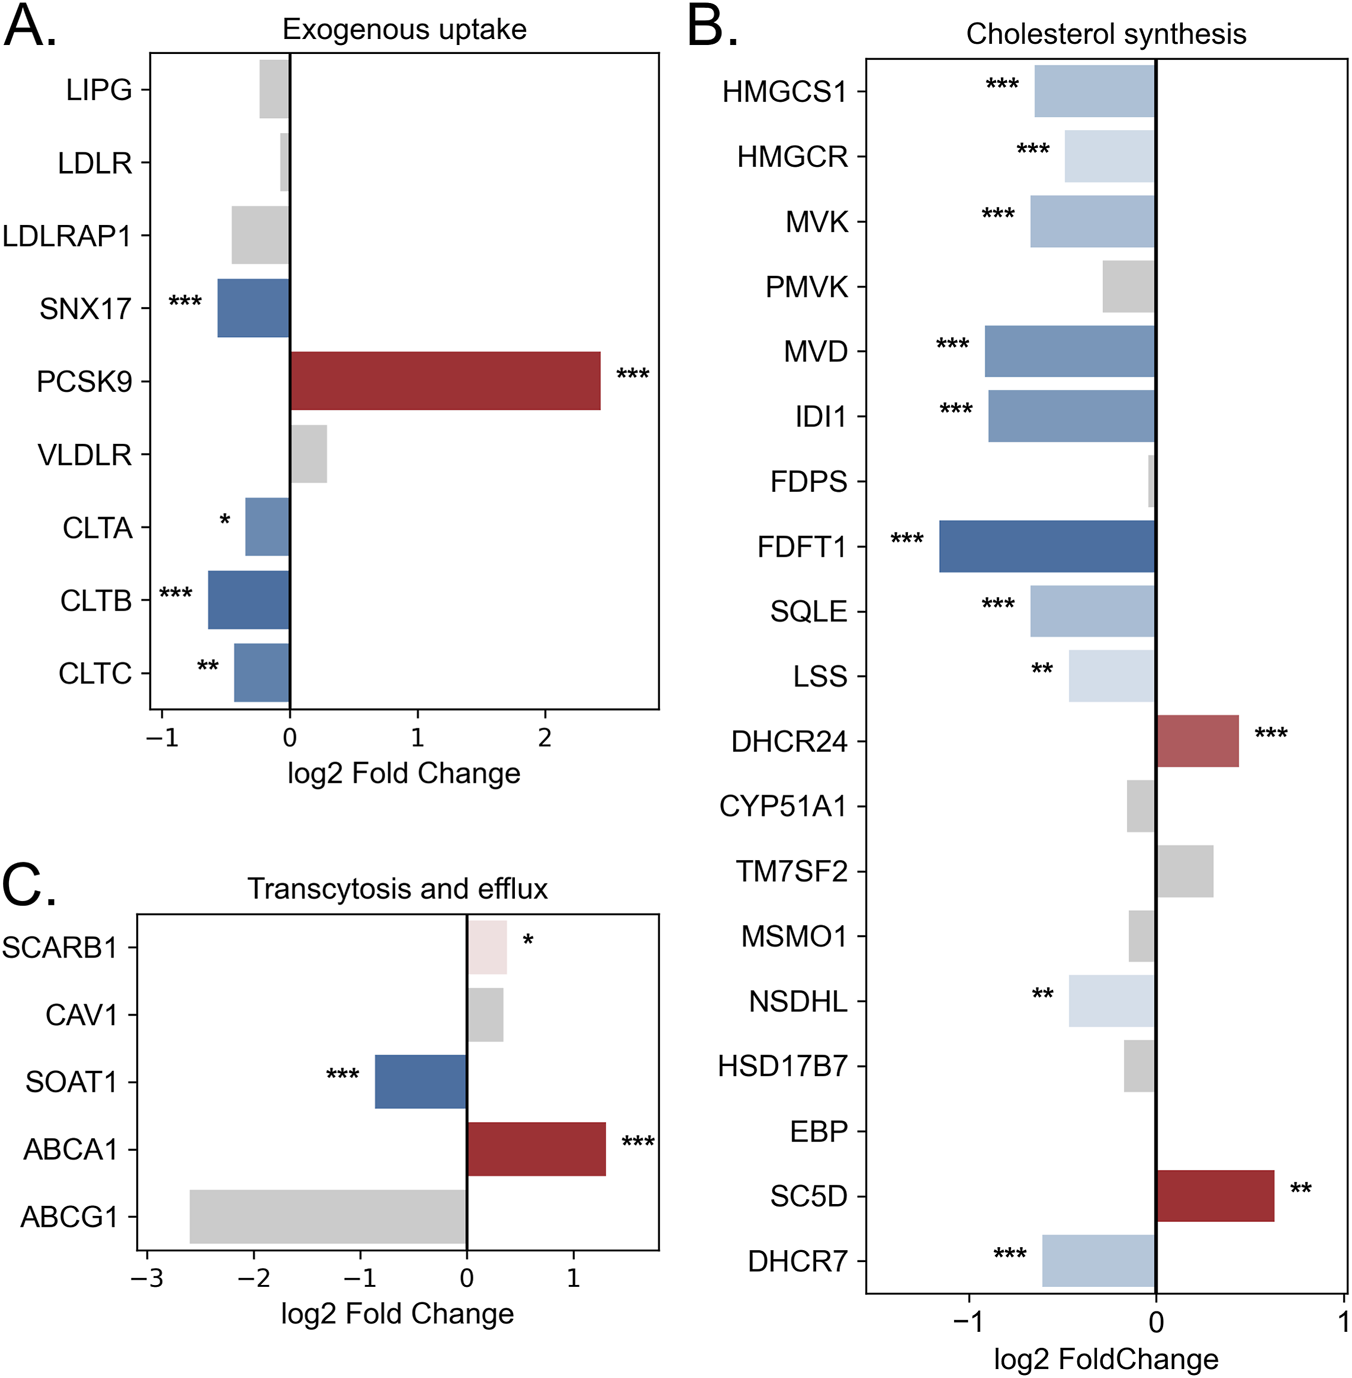
Changes in the expression of lipid metabolism genes in BeWo b30 cells following OD treatment. (A) Genes involved in exogenous lipid uptake. (B) Genes of cholesterol biosynthesis. (C) Genes involved in lipid transcytosis and efflux. Bar color represents log2 fold change (blue—downregulation, red—upregulation, gray—non-significant changes). Asterisks indicate statistical significance (padj: p < 0.05 — *, p < 0.01 — **, p < 0.001 — ***).
Hypoxia induction in BeWo b30 cells led to a decrease in the expression of genes involved in cholesterol biosynthesis. OD treatment reduced the expression of 10 out of 19 genes in this pathway, including HMGCS1, which catalyzes the first step of cholesterol synthesis (FC = −1.57, padj = 2.85e-06; qPCR: FC = −2.30, p = 0.036), and the rate-limiting enzyme HMGCR (FC = −1.40, padj = 3.76e-04; qPCR: FC = −2.54, p = 0.030) (Figure 5B). At the same time, expression of SC5D and DHCR24 increased. Fisher’s exact test indicated that OD-induced hypoxia caused a statistically significant suppression of the cholesterol biosynthesis pathway compared with global transcriptomic changes (OR = 4.22, p = 2.21e-03).
Changes were also observed in genes related to lipid transport to the fetus. A trend toward increased SCARB1 expression was noted (FC = 1.30, padj = 1.39e-02; qPCR: FC = 2.24, p = 0.13), along with a significant upregulation of the cholesterol exporter ABCA1 (2.5-fold; padj = 2.64e-06) (Figure 5C). Concurrently, SOAT1 expression decreased (FC = −1.82, padj = 1.03e-09; qPCR: FC = −2.61, p = 0.025), indicating reduced cholesterol esterification and lipid droplet formation.
Additionally, the diacylglycerol O-acyltransferases DGAT1 and DGAT2, which catalyze the final steps of triglyceride synthesis (covalent attachment of acyl-CoA to diacylglycerol) and contribute to lipid droplet formation (Zadoorian et al., 2023), were affected. OD treatment reduced DGAT1 expression by 1.65-fold (p = 0.00016) and DGAT2 by 1.64-fold (p = 0.63; not statistically significant). Lipid droplet accumulation was further assessed using Oil Red O staining (Supplementary Figure S7). Quantitative extraction revealed a significant decrease in lipid droplet content following OD treatment (p = 0.008).
3.7 Changes in extracellular vesicle numbers
Extracellular vesicles (EVs) are a heterogeneous population of membrane-bound structures secreted by cells into the extracellular space, playing key roles in intercellular communication, modulation of signaling pathways, and redistribution of biomolecules (Yu et al., 2024). Among the most relevant EV subtypes in the context of cell–cell communication are exosomes, which are formed through the exocytosis of multivesicular bodies (Arya et al., 2024). Their membranes differ from the plasma membrane in composition, being enriched in cholesterol [up to ∼80% of total lipids (Nishida-Aoki et al., 2020)] and sphingomyelin, reflecting their biogenesis and contributing to vesicle stabilization (Skotland et al., 2019). Although exosomes constitute only a small fraction of intracellular lipids, multivesicular bodies from which they originate contain up to 80% of cytosolic cholesterol (Möbius et al., 2003). Moreover, previous studies have shown that alterations in cellular lipid metabolism can directly influence EV secretion (Shkurnikov et al., 2024; Abdullah et al., 2021). Therefore, quantitative characteristics of EVs can be considered an indirect indicator of cellular metabolic status.
To assess the impact of hypoxia on EV secretion, a hypoxic environment was modeled using OD treatment. The EVs isolated in this study corresponded to the size range typical of exosomes (50–120 nm) (Supplementary Figures S8A,S8B) and exhibited a modal diameter of approximately 110 nm (Supplementary Figure S8C). Quantitative analysis revealed that OD treatment induced a statistically significant 2.8-fold increase in the number of secreted EVs compared with the control (p = 0.048) (Supplementary Figure S8D).
4 Discussion
Physiological oxygen tension in the placenta is approximately 2%–3% during the first trimester and 6%–8% during the second and third trimesters (Tuuli et al., 2011), with HIFα stabilization occurring already at 8% oxygen (Tache et al., 2013). Low oxygen levels play a key role in trophoblast development and differentiation: activation of the HIF signaling pathway promotes EVT lineage formation and supports progenitor cell survival (Chang et al., 2018). In preeclampsia, hypoxia is further exacerbated, likely due to impaired maternal blood flow and dysregulation of vasoconstriction by extravillous trophoblasts (Kumar et al., 2018). In our study, hypoxia pathway activation was observed across all trophoblast subpopulations and was accompanied by changes in the expression of genes involved in lipid metabolism. Single-cell RNA-seq data indicate that trophoblast populations—SCT, VCT, and EVT—differ both in baseline expression of lipid metabolism genes and in their response to pathological conditions such as preeclampsia.
The syncytiotrophoblast (SCT), which serves as the main interface between maternal blood and the fetus, shows the highest expression of genes involved in lipid transport, including LDLR and components of the clathrin complex (CLTA, CLTB). In preeclampsia, SCT exhibits reduced LDLR expression and alterations in clathrin-mediated endocytosis genes, accompanied by increased levels of SCARB1 and CAV1. This may indicate a shift in lipid transport mechanisms, with reduced LDL uptake via LDLR and enhanced transcytosis via SR-BI (see Supplementary Figure S11). Such remodeling likely represents an adaptive mechanism to limit the uptake of oxidized LDL and Lp(a), which are elevated more than twofold in preeclampsia (Konrad et al., 2020; Wang et al., 1998). In our study, ABCA1 mRNA expression was increased in all trophoblast subpopulations and in BeWo b30 cells under hypoxia, whereas previous reports have described decreased apical ABCA1 protein expression in SCT during preeclampsia (Baumann et al., 2013). This discrepancy may reflect differences between transcriptomic and proteomic regulation and warrants further validation using additional single-cell datasets.
All trophoblast subpopulations showed decreased expression of cholesterol biosynthesis genes, most pronounced in VCT and SCT. Systemically, preeclampsia is associated with elevated cellular cholesterol levels (Lee et al., 2019)however, cholesterol-dependent signaling cascades (Wnt/β-catenin, Hedgehog, eNOS) are suppressed, consistent with a deficit of bioavailable cholesterol despite compensatory activation of its synthesis and efflux (Hart, 2024). Downregulation of cholesterol biosynthesis may have adaptive value, considering the high energy cost of this pathway (>11 O2 molecules and >100 ATP equivalents per product molecule (Ridgway and McLeod, 2008)) and the fact that cholesterol enrichment of membranes limits oxygen diffusion (Zuniga-Hertz and Patel, 2019). Thus, the combination of reduced synthesis, decreased endocytosis, and enhanced cholesterol efflux can be considered a cellular remodeling mechanism aimed at alleviating hypoxic stress. Increased SCARB1 expression likely serves as a compensatory mechanism to maintain lipid transport to the fetus via transcytosis. These mechanisms may represent potential targets for interventions aimed at improving fetal lipid delivery in preeclampsia.
Interestingly, in EVT, where baseline LDLR expression is lower than in other trophoblast populations, preeclampsia was associated with an increase in LDLR expression. Concurrently, SCARB1 and ABCA1 expression increased, while ABCG1 decreased, suggesting activation of mechanisms aimed at maintaining cholesterol transcytosis. However, it is known that preeclampsia is accompanied by a reduction in the number of EVT cells lining maternal vessels and directly contacting maternal blood, limiting nutrient and lipid delivery to the fetus and contributing to fetal growth restriction (Kumar et al., 2018; Meakin et al., 2022). The observed expression changes likely reflect a shortage of exogenous lipids, which is also consistent with the upregulation of the GOBP_MEMBRANE_LIPID_CATABOLIC_PROCESS pathway identified in our analysis.
Experiments with the BeWo b30 cell line treated with OD confirmed the key role of hypoxia in lipid metabolic remodeling. Under hypoxia, BeWo b30 cells exhibited an expression pattern most similar to SCT under preeclampsia. Specifically, genes involved in exogenous cholesterol uptake and lipid biosynthesis were downregulated, accompanied by increased expression of SCARB1, CAV1, and ABCA1. Simultaneously, expression of SOAT1 and CHP1 (FC = −1.53, padj = 1.03e-05), a recently identified regulator of lipid droplet size (Yang G. et al., 2025), was decreased, indicating reduced lipid storage. Single-cell data show that SOAT1 expression in SCT is below detectable levels, consistent with previous reports of absent lipid droplet accumulation in this population (Kolahi et al., 2016). Thus, hypoxia acts as an inducer of metabolic remodeling, enhancing cholesterol transcytosis and efflux while reducing its storage, reproducing the alterations characteristic of SCT and EVT in preeclampsia. These results further support the applicability of BeWo b30 under hypoxic conditions as a model of SCT for studying lipid metabolism disruptions in preeclampsia (Zhao et al., 2021).
Recent data highlight the key role of SNX17 and PCSK9 in regulating lipoprotein transport in trophoblasts. In women with maternal supraphysiological hypercholesterolemia (MSPH), characterized by markedly elevated maternal cholesterol levels (Barrett et al., 2014; Fuenzalida et al., 2018), neonatal cholesterol concentrations remain within physiological ranges (Morales et al., 2025). This phenomenon has been linked to reduced LDLR recycling due to decreased PCSK9 and SNX17 expression in the presence of cholesterol excess (Morales et al., 2025). In preeclampsia, PCSK9 expression has also been reported to decrease relative to controls, most prominently in early-onset disease (PE vs. CTRL, median: 0.2 vs. 0.9, p = 0.010; PE vs. LP, median: 0.2 vs. 1.2, p = 0.012) (Mennitti et al., 2024). Together with data showing higher PCSK9 concentrations in fetal compared with maternal circulation (Vaught et al., 2023), this suggests that restriction of receptor recycling, rather than decreased expression, may be the primary mechanism protecting the fetus from excessive lipid uptake.
In the BeWo b30 preeclampsia model, LDLR expression remained unchanged, whereas PCSK9 increased fivefold and SNX17 decreased. Single-cell RNA-seq did not detect PCSK9 expression, likely due to methodological limitations and low sequencing depth. Data on the role of hypoxia in regulating PCSK9 remain limited. For instance, in patients with obstructive sleep apnea, which involves chronic intermittent hypoxia, PCSK9 levels were higher than in control subjects (Reveyaz et al., 2025). Mechanistically, HIF-1α is known to activate SREBF (Liu et al., 2014), a transcription factor regulating lipid metabolism, including PCSK9. However, our transcriptomic analysis did not reveal statistically significant activation of factors regulating PCSK9 expression. Thus, the mechanisms controlling PCSK9 and SNX17 under hypoxia and preeclampsia remain insufficiently understood and may have practical relevance for preventing fetal lipid imbalance and developing new therapeutic strategies in preeclampsia.
Currently, therapeutic options for preeclampsia remain limited, with low-dose aspirin being the only widely recommended prophylactic intervention, underscoring the urgent need for new mechanistically grounded approaches (Magee et al., 2022). At present, clinically approved therapeutics exist only for a subset of the lipid-regulatory proteins highlighted in our analysis. PCSK9 is the best-established target, with monoclonal antibodies and siRNA-based agents used to lower LDL cholesterol in hypercholesterolemia. However, several independent studies report that placental PCSK9 expression is reduced in preeclampsia (Mennitti et al., 2024; Vaught et al., 2023). These works suggest that PCSK9 may exert a protective role in trophoblasts by limiting cholesterol overload under conditions of increased maternal lipid levels during pregnancy. Indeed, lowering LDL cholesterol with statins has been shown to enhance angiogenesis, mitigate endothelial dysfunction characteristic of preeclampsia, and reduce inflammation, collectively ameliorating disease manifestations (Smith and Costantine, 2022). Thus, further suppression of PCSK9 through targeted therapies may have a dual effect: on the one hand reducing circulating cholesterol, but on the other potentially diminishing a trophoblast-protective mechanism. For ABCA1, pharmacological agonists such as CS-6253 have demonstrated preclinical efficacy in enhancing cholesterol efflux, although no agents targeting this transporter are approved for cardiovascular or obstetric use (Noveir et al., 2022). SCARB1 and SOAT1, despite evidence from metabolic disease models indicating that modulation of transcytosis or cholesterol esterification can alter intracellular lipid handling, currently lack any marketed therapeutics. Thus, while existing drugs targeting PCSK9 and ABCA1 show that components of these pathways are pharmacologically tractable, their potential utility in preeclampsia would differ from current symptom-oriented approaches by directly modulating placental lipid transport and metabolic adaptation to hypoxia. Nevertheless, translational applicability requires careful evaluation of safety, off-target effects and trophoblast-specific responses.
Exosomes secreted by the placenta and embryonic cells suppress the maternal immune system and promote pregnancy establishment, as well as fetal development and survival (de Lima Kaminski et al., 2019). Placental EVs also play a key role in regulating fetal lipid metabolism (Luo et al., 2025). However, in pregnancy pathologies such as preeclampsia, this process is disrupted. Patients with preeclampsia exhibit a significant increase in the number of exosomes released by the syncytiotrophoblast (Goswam et al., 2006). Hypoxia induction enhances exosome release from cytotrophoblasts and increases their bioactivity (Salomon et al., 2013). Our results show that, despite the downregulation of genes involved in cholesterol synthesis and transport, a key lipid in exosome biogenesis, hypoxia induced by the oxiquinoline derivative also increases vesicle exocytosis. This is particularly interesting, as previous studies demonstrated that exosomes from umbilical cord plasma can suppress HMGCS1, thereby inhibiting cholesterol synthesis and ultimately inducing endothelial dysfunction (Ying et al., 2021). In a recent study, placental hypoxia was shown to promote the release of EVs enriched in lipid peroxidation products, and their exposure similarly leads to endothelial dysfunction characteristic of preeclampsia (Park et al., 2025). Another study demonstrated that hypoxia increases expression of Hepatocyte Growth Factor-regulated Tyrosine Kinase Substrate (HGS), which appears to regulate vesicle secretion and markedly alter their cargo (Wang et al., 2025). However, in our BeWo cell model, HGS expression did not change significantly under OD treatment (p = 0.54).
A key constraint of our study is the reliance on a single publicly available single-cell RNA-seq dataset and the lack of detailed clinical information regarding patient therapies. Additionally, we employed only one trophoblast cell model, BeWo b30; while this line is widely used in hypoxia-related trophoblast research, future studies would benefit from including additional trophoblast cell lines to validate the observed effects more broadly. A limitation of our study is the lack of analysis of exosome cargo composition, which warrants further investigation. The data suggest that the relationship between HIF1A-mediated hypoxia and exosome secretion in trophoblasts may be regulated by an alternative, yet unidentified mechanism. In light of the recently demonstrated role of exosomes in lipid delivery (Palmulli et al., 2024), hypoxia-induced enhancement of their secretion likely impacts trophoblast lipid metabolism and may contribute to disease pathogenesis. Finally, although our transcriptomic analyses provide insight into the regulation of cholesterol uptake, transcytosis, and efflux pathways, functional lipid secretion was not directly assessed. Future studies incorporating targeted lipidomic profiling and direct evaluation of lipoprotein secretion will be essential to clarify how hypoxia and preeclampsia alter trophoblast lipid homeostasis at the metabolic level.
5 Conclusion
Our data demonstrate that under preeclampsia and hypoxic stress, trophoblast cells exhibit substantial changes in the expression of genes involved in lipid metabolism. Distinct trophoblast subpopulations (SCT, VCT, EVT) show transcriptional alterations consistent with reduced LDL-mediated endocytosis, enhanced cholesterol transcytosis via SCARB1, increased cholesterol efflux, and remodeling of cholesterol biosynthesis pathways. It should be noted that these observations are limited to gene expression changes and do not directly assess functional activity. Nevertheless, the coordinated transcriptional patterns suggest a potential reprogramming of lipid handling that may contribute to maintaining fetal lipid supply and responding to hypoxic stress.
Importantly, our findings provide insight into the molecular basis of lipid metabolism dysregulation in preeclampsia and highlight potential targets for intervention. By identifying key regulators of lipid delivery to the fetus and cellular responses to hypoxic stress—such as PCSK9, SNX17, SCARB1, ABCA1, and SOAT1—this study may inform the development of novel preventive and therapeutic strategies to mitigate pregnancy complications associated with abnormal lipid homeostasis. Furthermore, the observed effects in the BeWo b30 hypoxia model support its relevance as a tool for studying placental lipid metabolism under pathological conditions.
Statements
Data availability statement
The datasets presented in this study can be found in online repositories. The names of the repository/repositories and accession number(s) can be found in the article/Supplementary Material.
Ethics statement
Ethical approval was not required for the studies on humans in accordance with the local legislation and institutional requirements because only commercially available established cell lines were used.
Author contributions
IA: Writing – original draft, Formal Analysis, Investigation, Conceptualization. EK: Writing – review and editing, Investigation. TK: Writing – review and editing, Formal Analysis. AT: Conceptualization, Supervision, Writing – review and editing.
Funding
The authors declare that financial support was received for the research and/or publication of this article. The study for the sections concerning analysis of single-cell sequencing data was performed within the framework of the Basic Research Program at HSE University. The study for the sections concerning BeWo b30 cell model was funded by the Russian Science Foundation grant No. 24-14-00382, https://rscf.ru/en/project/24-14-00382/.
Conflict of interest
The authors declare that the research was conducted in the absence of any commercial or financial relationships that could be construed as a potential conflict of interest.
Generative AI statement
The authors declare that no Generative AI was used in the creation of this manuscript.
Any alternative text (alt text) provided alongside figures in this article has been generated by Frontiers with the support of artificial intelligence and reasonable efforts have been made to ensure accuracy, including review by the authors wherever possible. If you identify any issues, please contact us.
Publisher’s note
All claims expressed in this article are solely those of the authors and do not necessarily represent those of their affiliated organizations, or those of the publisher, the editors and the reviewers. Any product that may be evaluated in this article, or claim that may be made by its manufacturer, is not guaranteed or endorsed by the publisher.
Supplementary material
The Supplementary Material for this article can be found online at: https://www.frontiersin.org/articles/10.3389/fmolb.2025.1731126/full#supplementary-material
References
1
Abdullah M. Nakamura T. Ferdous T. Gao Y. Chen Y. Zou K. et al (2021). Cholesterol regulates exosome release in cultured astrocytes. Front. Immunol.12, 722581. 10.3389/fimmu.2021.722581
2
Acosta-Iborra B. Gil-Acero A. I. Sanz-Gómez M. Berrouayel Y. Puente-Santamaría L. Alieva M. et al (2024). Bhlhe40 regulates proliferation and angiogenesis in mouse embryoid bodies under hypoxia. Int. J. Mol. Sci.25, 7669. 10.3390/ijms25147669
3
Admati I. Skarbianskis N. Hochgerner H. Ophir O. Weiner Z. Yagel S. et al (2023). Two distinct molecular faces of preeclampsia revealed by single-cell transcriptomics. Med4, 687–709.e7. 10.1016/j.medj.2023.07.005
4
Albers R. E. Kaufman M. R. Natale B. V. Keoni C. Kulkarni-Datar K. Min S. et al (2019). Trophoblast-specific expression of Hif-1α results in preeclampsia-like symptoms and fetal growth restriction. Sci. Rep.9, 2742. 10.1038/s41598-019-39426-5
5
Arifin R. Kyi W. M. Che Yaakob C. A. Yaacob N. M. (2017). Increased circulating oxidised low-density lipoprotein and antibodies to oxidised low-density lipoprotein in preeclampsia. J. Obstet. Gynaecol. (Lahore)37, 580–584. 10.1080/01443615.2016.1269227
6
Arya S. B. Collie S. P. Parent C. A. (2024). The ins-and-outs of exosome biogenesis, secretion, and internalization. Trends Cell Biol.34, 90–108. 10.1016/j.tcb.2023.06.006
7
Ashburner M. Ball C. A. Blake J. A. Botstein D. Butler H Cherry J. M. et al (2000). Gene ontology: tool for the unification of biology. The Gene Ontology Consortium. Nat Genet.25 (1), 25–9. 10.1038/75556
8
Barrett H. L. Dekker Nitert M. McIntyre H. D. Callaway L. K. (2014). Normalizing metabolism in diabetic pregnancy: is it time to target lipids?Diabetes Care37, 1484–1493. 10.2337/dc13-1934
9
Baumann M. Körner M. Huang X. Wenger F. Surbek D. Albrecht C. (2013). Placental ABCA1 and ABCG1 expression in gestational disease: Pre-eclampsia affects ABCA1 levels in syncytiotrophoblasts. Placenta.34:1079–1086. 10.1016/j.placenta.2013.06.309
10
Bayhan G. Koçyigit Y. Atamer A. Atamer Y. Akkus Z. (2005). Potential atherogenic roles of lipids, lipoprotein (a) and lipid peroxidation in preeclampsia. Gynecol. Endocrinol.21, 1–6. 10.1080/09513590500097382
11
Bergmark C. Dewan A. Orsoni A. Merki E. Miller E. R. Shin M.-J. et al (2008). A novel function of lipoprotein [a] as a preferential carrier of oxidized phospholipids in human plasma. J. Lipid Res.49, 2230–2239. 10.1194/jlr.M800174-JLR200
12
Bolanle I. O. de Liedekerke Beaufort G. C. Weinberg P. D. (2025). Transcytosis of LDL across arterial endothelium: mechanisms and therapeutic targets. Arterioscler. Thromb. Vasc. Biol.45, 468–480. 10.1161/ATVBAHA.124.321549
13
Burden J. J. Sun X.-M. García A. B. G. Soutar A. K. (2004). Sorting motifs in the intracellular domain of the low density lipoprotein receptor interact with a novel domain of sorting nexin-17. J. Biol. Chem.279, 16237–16245. 10.1074/jbc.M313689200
14
Chang C.-W. Wakeland A. K. Parast M. M. (2018). Trophoblast lineage specification, differentiation and their regulation by oxygen tension. J. Endocrinol.236, R43–R56. 10.1530/JOE-17-0402
15
Chen Y. Chen L. Lun A. T. L. Baldoni P. L. Smyth GK (2025). EdgeR v4: powerful differential analysis of sequencing data with expanded functionality and improved support for small counts and larger datasets. Nucleic Acids Res.53 (2), gkaf018. 10.1093/nar/gkaf018
16
Clausen T. Slott M. Solvoll K. Drevon C. A. Vollset S. E. Henriksen T. (2001). High intake of energy, sucrose, and polyunsaturated fatty acids is associated with increased risk of preeclampsia. Am. J. Obstet. Gynecol.185, 451–458. 10.1067/mob.2001.116687
17
Cooke L. D. F. Tumbarello D. A. Harvey N. C. Sethi J. K. Lewis R. M. Cleal J. K. (2021). Endocytosis in the placenta: an undervalued mediator of placental transfer. Placenta113, 67–73. 10.1016/j.placenta.2021.04.014
18
de Lima Kaminski V. Ellwanger J. H. Chies J. A. B. (2019). Extracellular vesicles in host-pathogen interactions and immune Regulation—exosomes as emerging actors in the immunological theater of pregnancy. Heliyon5, e02355. 10.1016/j.heliyon.2019.e02355
19
Dimitriadis E. Rolnik D. L. Zhou W. Estrada-Gutierrez G. Koga K. Francisco R. P. V. et al (2023). Pre-eclampsia. Nat. Rev. Dis. Prim.9, 8. 10.1038/s41572-023-00417-6
20
Dobin A. Davis C. A. Schlesinger F. Drenkow J. Zaleski C. Jha S. et al (2013 Jan 1). STAR: ultrafast universal RNA-seq aligner. Bioinformatics [Internet]29 (1), 15–21. 10.1093/bioinformatics/bts635
21
Fan M. Wu H. Sferruzzi-Perri A. N. Wang Y.-L. Shao X. (2024). Endocytosis at the maternal-fetal interface: balancing nutrient transport and pathogen defense. Front. Immunol.15, 1415794. 10.3389/fimmu.2024.1415794
22
Farfán P. Lee J. Larios J. Sotelo P. Bu G. Marzolo M. (2013). A sorting nexin 17‐Binding domain within the LRP1 cytoplasmic tail mediates receptor recycling through the basolateral sorting endosome. Traffic14, 823–838. 10.1111/tra.12076
23
Fuchs R. Ellinger I. (2004). Endocytic and transcytotic processes in villous syncytiotrophoblast: role in nutrient transport to the human fetus. Traffic5, 725–738. 10.1111/j.1600-0854.2004.00221.x
24
Fuenzalida B. Sobrevia B. Cantin C. Carvajal L. Salsoso R. Gutiérrez J. et al (2018). Maternal supraphysiological hypercholesterolemia associates with endothelial dysfunction of the placental microvasculature. Sci. Rep.8, 7690. 10.1038/s41598-018-25985-6
25
Fuenzalida B. Cantin C. Kallol S. Carvajal L. Pastén V. Contreras-Duarte S. et al (2020). Cholesterol uptake and efflux are impaired in human trophoblast cells from pregnancies with maternal supraphysiological hypercholesterolemia. Sci. Rep.10, 5264. 10.1038/s41598-020-61629-4
26
Fuenzalida B. Kallol S. Zaugg J. Mueller M. Mistry H. D. Gutierrez J. et al (2022). Primary human trophoblasts mimic the preeclampsia phenotype after acute hypoxia–reoxygenation insult. Cells11, 1898. 10.3390/cells11121898
27
Go G. Mani A. (2012). Low-density lipoprotein receptor (LDLR) family orchestrates cholesterol homeostasis. Yale J. Biol. Med.85, 19–28. Available online at: https://pubmed.ncbi.nlm.nih.gov/22461740/
28
Goswami D. Tannetta D. S. Magee L. A. Fuchisawa A. Redman C. W. G. Sargent I. L. et al (2006). Excess syncytiotrophoblast microparticle shedding is a feature of early-onset pre-eclampsia, but not normotensive intrauterine growth restriction. Placenta27, 56–61. 10.1016/j.placenta.2004.11.007
29
Gynecologists A. C. of O. (2020). Gestational hypertension and preeclampsia: ACOG practice bulletin, number 222. Obstet. Gynecol.135, e237–e260. 10.1097/AOG.0000000000003891
30
Han H. Cho J. W. Lee S Yun A. Kim H. Bae D. et al (2018). TRRUST v2: an expanded reference database of human and mouse transcriptional regulatory interactions. Nucleic Acids Res.46 (D1), D380–6. 10.1093/nar/gkx1013
31
Hart N. R. (2024). Paradoxes: cholesterol and hypoxia in preeclampsia. Biomolecules14, 691. 10.3390/biom14060691
32
He G. Gupta S. Yi M. Michaely P. Hobbs H. H. Cohen J. C. (2002). ARH is a modular adaptor protein that interacts with the LDL receptor, clathrin, and AP-2. J. Biol. Chem.277, 44044–44049. 10.1074/jbc.M208539200
33
He J. Yang H. Liu Z. Chen M. Ye Y. Tao Y. et al (2023). Elevated expression of glycolytic genes as a prominent feature of early-onset preeclampsia: insights from integrative transcriptomic analysis. Front. Mol. Biosci.10–2023. 10.3389/fmolb.2023.1248771
34
Herrera E. Amusquivar E. Lopez-Soldado I. Ortega H. (2006). Maternal lipid metabolism and placental lipid transfer. Horm. Res.65, 59–64. 10.1159/000091507
35
Horne H. Holme A. M. Roland M. C. P. Holm M. B. Haugen G. Henriksen T. et al (2019). Maternal-fetal cholesterol transfer in human term pregnancies. Placenta87, 23–29. 10.1016/j.placenta.2019.09.001
36
Hoshiyama T. Muto M. Matsumoto S. Okamura E. Jargalsaikhan B.-E. Murakami T. et al (2025). Establishment of human trophoblast stem cells from term smooth chorion. Placenta169, 114–122. 10.1016/j.placenta.2025.07.090
37
Hu M. Li J. Baker P. N. Tong C. (2022). Revisiting preeclampsia: a metabolic disorder of the placenta. FEBS J.289:336–354. 10.1111/febs.15745
38
Hubel C. A. Roberts J. M. Taylor R. N. Musci T. J. Rogers G. M. McLaughlin M. K. (1989). Lipid peroxidation in pregnancy: new perspectives on preeclampsia. Am. J. Obstet. Gynecol.161, 1025–1034. 10.1016/0002-9378(89)90778-3
39
Ikonen E. (2008). Cellular cholesterol trafficking and compartmentalization. Nat. Rev. Mol. Cell Biol.9, 125–138. 10.1038/nrm2336
40
Ives CW Rachel S. Indranee R. N T. A. T. Suzanne O. (2020). Preeclampsia—pathophysiology and clinical presentations. JACC76, 1690–1702. 10.1016/j.jacc.2020.08.014
41
Jayalekshmi V. S. Ramachandran S. (2021). Maternal cholesterol levels during gestation: boon or bane for the offspring?Mol. Cell Biochem.476, 401–416. 10.1007/s11010-020-03916-2
42
Kakava S. Schlumpf E. Panteloglou G. Tellenbach F. von Eckardstein A. Robert J. (2022). Brain endothelial cells in contrary to the aortic do not transport but degrade low-density lipoproteins via both LDLR and ALK1. Cells11, 3044. 10.3390/cells11193044
43
Kallol S. Albrecht C. (2020). Materno-fetal cholesterol transport during pregnancy. Biochem. Soc. Trans.48, 775–786. 10.1042/BST20190129
44
Karolchik D. Baertsch R. Diekhans M. Furey T. S. Hinrichs A. Lu Y. T. et al (2003). The UCSC genome browser database. Nucleic Acids Res.31 (1), 51–4. 10.1093/nar/gkg129
45
Knyazev E. N. Zakharova G. S. Astakhova L. A. Tsypina I. M. Tonevitsky A. G. Sukhikh G. T. (2019). Metabolic reprogramming of trophoblast cells in response to hypoxia. Bull. Exp. Biol. Med.166, 321–325. 10.1007/s10517-019-04342-1
46
Knyazev E. Kulagin T. Antipenko I. Tonevitsky A. (2025). Single-cell sequencing of trophoblasts in preeclampsia and chemical hypoxia in BeWo b30 cells reveals EBI3, COL17A1, miR-27a-5p, and miR-193b-5p as hypoxia-response markers. bioRxiv, 2025–9. 10.48550/arXiv.2510.01935
47
Knyazev E. Vishnyakova P. Lazareva O. Tonevitsky A. (2025). Modeling preeclampsia: from 2D cultures to Placenta-on-a-Chip technologies. Biochip J.19, 1–21. 10.1007/s13206-024-00184-w
48
Kolahi K. Louey S. Varlamov O. Thornburg K. (2016). Real-time tracking of BODIPY-C12 long-chain fatty acid in human term placenta reveals unique lipid dynamics in cytotrophoblast cells. PLoS One11, e0153522. 10.1371/journal.pone.0153522
49
Konrad E. Güralp O. Shaalan W. Elzarkaa A. A. Moftah R. Alemam D. et al (2020). Correlation of elevated levels of lipoprotein (a), high-density lipoprotein and low-density lipoprotein with severity of preeclampsia: a prospective longitudinal study. J. Obstet. Gynaecol. (Lahore)40, 53–58. 10.1080/01443615.2019.1603214
50
Korotkevich G. Sukhov V. Budin N. Shpak B Artyomov M. N. Sergushichev A. (2016). Fast gene set enrichment analysis. biorxiv, 060012. 10.1101/060012
51
Kumar S. Gordon G. H. Abbott D. H. Mishra J. S. (2018). Androgens in maternal vascular and placental function: implications for preeclampsia pathogenesis. Reproduction156, R155–R167. 10.1530/REP-18-0278
52
Lee S. M. Moon J.-Y. Lim B.-Y. Kim S. M. Park C.-W. Kim B. J. et al (2019). Increased biosynthesis and accumulation of cholesterol in maternal plasma, but not amniotic fluid in pre-eclampsia. Sci. Rep.9, 1550. 10.1038/s41598-018-37757-3
53
Liberzon A. Birger C. Thorvaldsdóttir H. Ghandi M. Mesirov J. P. Tamayo P. (2015). The molecular signatures database hallmark gene set collection. Cell Syst1 (6), 417–25. 10.1016/j.cels.2015.12.004
54
Liu Y. Ma Z. Zhao C. Wang Y. Wu G. Xiao J. et al (2014). HIF-1α and HIF-2α are critically involved in hypoxia-induced lipid accumulation in hepatocytes through reducing PGC-1α-mediated fatty acid β-oxidation. Toxicol. Lett.226, 117–123. 10.1016/j.toxlet.2014.01.033
55
Love M. I. Huber W. Anders S. (2014). Moderated estimation of fold change and dispersion for RNA-seq data with DESeq2. Genome Biol [Internet]15 (12), 550. Available from. 10.1186/s13059-014-0550-8
56
Luo X. Huang B. Xu P. Wang H. Zhang B. Lin L. et al (2025). The placenta regulates intrauterine fetal growth via exosomal PPARγ. Adv. Sci.12, 2404983. 10.1002/advs.202404983
57
Magee L. A. Brown M. A. Hall D. R. Gupte S. Hennessy A. Karumanchi S. A. et al (2022). The 2021 International society for the study of hypertension in pregnancy classification, diagnosis and management recommendations for international practice. Pregnancy Hypertens.27, 148–169. 10.1016/j.preghy.2021.09.008
58
Knyazev E. Maltseva D. Raygorodskaya M. Shkurnikov M. (2021). HIF-dependent NFATC1 activation upregulates ITGA5 and PLAUR in intestinal epithelium in inflammatory bowel disease. Front Genet12, 791640. 10.3389/fgene.2021.791640
59
Martin M. (2011). Cutadapt removes adapter sequences from high-throughput sequencing reads. EMBnet journal17 (1), 10–2. 10.14806/ej.17.1.200
60
Matsubara K. (2017). Hypoxia in the pathogenesis of preeclampsia. Hypertens. Res. Pregnancy5, 46–51. 10.14390/jsshp.HRP2017-014
61
Maxfield F. R. van Meer G. (2010). Cholesterol, the central lipid of Mammalian cells. Curr. Opin. Cell Biol.22, 422–429. 10.1016/j.ceb.2010.05.004
62
McInnes L. Healy J. Melville J. (2025). Umap: uniform manifold approximation and projection for dimension reduction.
63
Meakin C. Barrett E. S. Aleksunes L. M. (2022). Extravillous trophoblast migration and invasion: impact of environmental chemicals and pharmaceuticals. Reprod. Toxicol.107:60–68. 10.1016/j.reprotox.2021.11.008
64
Mennitti C. Sarno L. Calvanese M. Gentile A. Esposito G. Fulgione C. et al (2024). Preliminary study on the role of human defensins, interleukins and PCSK9 in early and late preeclampsia. Reprod. Biol.24:100947. 10.1016/j.repbio.2024.100947
65
Mitranovici M.-I. Chiorean D. M. Moraru R. Moraru L. Caravia L. Tiron A. T. et al (2024). Understanding the pathophysiology of preeclampsia: exploring the role of antiphospholipid antibodies and future directions. J. Clin. Med.13, 2668. 10.3390/jcm13092668
66
Möbius W. Van Donselaar E. Ohno-Iwashita Y. Shimada Y. Heijnen H. F. G. Slot J. W. et al (2003). Recycling compartments and the internal vesicles of multivesicular bodies harbor Most of the cholesterol found in the endocytic pathway. Traffic.4:222–231. 10.1034/j.1600-0854.2003.00072.x
67
Mohammed O. Magdy A. Askalany A. Salem S. Abdel-Rasheed M. Ghobary H. et al (2022). Role of maternal uterine artery doppler versus serum β-hCG during the first trimester in the prediction of preeclampsia and IUGR. J. Diagnostic Med. Sonogr.38, 111–118. 10.1177/87564793211051986
68
Morales A. Riquelme N. Illanes S. E. Leiva A. (2025). Disruption of LDL receptor trafficking in placentas from maternal supraphysiological hypercholesterolemia: a study of key endocytosis and recycling proteins. Placenta168, 67–73. 10.1016/j.placenta.2025.05.028
69
Nasir S. K. Khalil R. Y. Mahmood M. B. Dawd A. S. (2025). Serum lactate dehydrogenase level in preeclampsia and its correlation with disease severity, maternal and perinatal outcomes. BMC Womens Health25, 108. 10.1186/s12905-025-03622-5
70
Negre-Salvayre A. Swiader A. Salvayre R. Guerby P. (2022). Oxidative stress, lipid peroxidation and premature placental senescence in preeclampsia. Arch. Biochem. Biophys.730, 109416. 10.1016/j.abb.2022.109416
71
Ngene N. C. Moodley J. (2024). Preventing maternal morbidity and mortality from preeclampsia and eclampsia particularly in low- and middle-income countries. Best. Pract. Res. Clin. Obstet. Gynaecol.94:102473. 10.1016/j.bpobgyn.2024.102473
72
Nishida-Aoki N. Izumi Y. Takeda H. Takahashi M. Ochiya T. Bamba T. (2020). Lipidomic analysis of cells and extracellular vesicles from high-and low-metastatic triple-negative breast cancer. Metabolites10, 67. 10.3390/metabo10020067
73
Noveir S. D. Kerman B. E. Xian H. Meuret C. Smadi S. Martinez A. E. et al (2022). Effect of the ABCA1 agonist CS-6253 on amyloid-β and lipoprotein metabolism in cynomolgus monkeys. Alzheimers Res. Ther.14, 87. 10.1186/s13195-022-01028-1
74
Odenkirk M. T. Stratton K. G. Gritsenko M. A. Bramer L. M. Webb-Robertson B.-J. M. Bloodsworth K. J. et al (2020). Unveiling molecular signatures of preeclampsia and gestational diabetes mellitus with multi-omics and innovative cheminformatics visualization tools. Mol. Omics16, 521–532. 10.1039/d0mo00074d
75
Palinski W. (2009). Maternal–fetal cholesterol transport in the placenta: good, bad, and target for modulation. Circ. Res.104, 569–571. 10.1161/CIRCRESAHA.109.194191
76
Palmulli R. Couty M. Piontek M. C. Ponnaiah M. Dingli F. Verweij F. J. et al (2024). CD63 sorts cholesterol into endosomes for storage and distribution via exosomes. Nat. Cell Biol.26, 1093–1109. 10.1038/s41556-024-01432-9
77
Park C. Alahari S. Ausman J. Liu R. Nguyen F. Sallais J. et al (2025). Placental hypoxia-induced ferroptosis drives vascular damage in preeclampsia. Circ. Res.136, 361–378. 10.1161/CIRCRESAHA.124.325119
78
Poornima I. G. Indaram M. Ross J. D. Agarwala A. Wild R. A. (2022). Hyperlipidemia and risk for preclampsia. J. Clin. Lipidol.16, 253–260. 10.1016/j.jacl.2022.02.005
79
Rana S. Lemoine E. Granger J. P. Karumanchi S. A. (2019). Preeclampsia: pathophysiology, challenges, and perspectives. Circ. Res.124, 1094–1112. 10.1161/CIRCRESAHA.118.313276
80
Reveyaz M.-A. Hierves A. A. Boutin-Paradis A. Tamisier R. Bailly S. Ngo V. et al (2025). PCSK9 as a new player in intermittent hypoxia-induced vascular alterations. Arch. Cardiovasc Dis.118:S173–S174. 10.1016/j.acvd.2025.03.007
81
Ridgway N. McLeod R. (2008). Biochemistry of lipids, lipoproteins and membranes. Elsevier.
82
Salomon C. Kobayashi M. Ashman K. Sobrevia L. Mitchell M. D. Rice G. E. (2013). Hypoxia-induced changes in the bioactivity of cytotrophoblast-derived exosomes. PLoS One8, e79636-. 10.1371/journal.pone.0079636
83
Say L. Chou D. Gemmill A. Tunçalp Ö. Moller A.-B. Daniels J. et al (2014). Global causes of maternal death: a WHO systematic analysis. Lancet Glob. Health2, e323–e333. 10.1016/S2214-109X(14)70227-X
84
Schietke R. Warnecke C. Wacker I. Schödel J. Mole D. R. Campean V. et al (2010). The lysyl oxidases LOX and LOXL2 are necessary and sufficient to repress E-cadherin in hypoxia: insights into cellular transformation processes mediated by HIF-1. J. Biol. Chem.285, 6658–6669. 10.1074/jbc.M109.042424
85
Shkurnikov M. Averinskaya D. Stekolshchikova E. Serkina A. Razumovskaya A. Silkina M. et al (2024). IGFBP6 regulates extracellular vesicles formation via cholesterol abundance in MDA-MB-231 cells. Biochimie227, 77–85. 10.1016/j.biochi.2024.06.011
86
Simon A. (2010). FastQC: a quality control tool for high throughput sequence data. Version 010 https://www.bioinformatics.babraham.ac.uk/projects/fastqc/.1
87
Skotland T. Hessvik N. P. Sandvig K. Llorente A. (2019). Exosomal lipid composition and the role of ether lipids and phosphoinositides in exosome biology. J. Lipid Res.60, 9–18. 10.1194/jlr.R084343
88
Smith D. D. Costantine M. M. (2022). The role of statins in the prevention of preeclampsia. Am. J. Obstet. Gynecol.226, S1171–S1181. 10.1016/j.ajog.2020.08.040
89
Spracklen C. N. Smith C. J. Saftlas A. F. Robinson J. G. Ryckman K. K. (2014). Maternal hyperlipidemia and the risk of preeclampsia: a meta-analysis. Am. J. Epidemiol.180, 346–358. 10.1093/aje/kwu145
90
Stadler J. T. Scharnagl H. Wadsack C. Marsche G. (2023). Preeclampsia affects lipid metabolism and HDL function in mothers and their offspring. Antioxidants12, 795. 10.3390/antiox12040795
91
Subramanian A. Tamayo P. Mootha V. K. Mukherjee S. Ebert B. L. Gillette M. A. et al (2005). Gene set enrichment analysis: a knowledge-based approach for interpreting genome-wide expression profiles. Proceedings of the National Academy of Sciences102 (43), 15545–50. 10.1073/pnas.0506580102
92
Tache V. Ciric A. Moretto-Zita M. Li Y. Peng J. Maltepe E. et al (2013). Hypoxia and trophoblast differentiation: a key role for PPARγ. Stem Cells Dev.22, 2815–2824. 10.1089/scd.2012.0596
93
Tóth E. Györffy D. Posta M. Hupuczi P. Balogh A. Szalai G. et al (2024). Decreased expression of placental proteins in recurrent pregnancy loss: functional relevance and diagnostic value. Int. J. Mol. Sci.25, 1865. 10.3390/ijms25031865
94
Turco M. Y. Gardner L. Kay R. G. Hamilton R. S. Prater M. Hollinshead M. S. et al (2018). Trophoblast organoids as a model for maternal–fetal interactions during human placentation. Nature564, 263–267. 10.1038/s41586-018-0753-3
95
Tuuli M. G. Longtine M. S. Nelson D. M. (2011). Oxygen and trophoblast Biology–A source of controversy. Placenta32, S109–S118. 10.1016/j.placenta.2010.12.013
96
Varberg K. M. Dominguez E. M. Koseva B. Varberg J. M. McNally R. P. Moreno-Irusta A. et al (2023). Extravillous trophoblast cell lineage development is associated with active remodeling of the chromatin landscape. Nat. Commun.14, 4826. 10.1038/s41467-023-40424-5
97
Vaught A. J. Boyer T. Ziogos E. Amat-Codina N. Minhas A. Darwin K. et al (2023). The role of proprotein convertase subtillisin/kexin type 9 in placental salvage and lipid metabolism in women with preeclampsia. Placenta132:1–6. 10.1016/j.placenta.2022.12.008
98
Virtanen P. Gommers R. Oliphant T. E. Haberland M. Reddy T. Cournapeau D. et al (2020). SciPy 1.0: fundamental algorithms for scientific computing in python. Nat. Methods17, 261–272. 10.1038/s41592-019-0686-2
99
Wadsack C. Hammer A. Levak-Frank S. Desoye G. Kozarsky K. F. Hirschmugl B. et al (2003). Selective cholesteryl ester uptake from high density lipoprotein by human first trimester and term villous trophoblast cells. Placenta24, 131–143. 10.1053/plac.2002.0912
100
Wang J. Mimuro S. Lahoud R. Trudingera B. Wang X. L. (1998). Elevated levels of lipoprotein (a) in women with preeclampsia. Am. J. Obstet. Gynecol.178, 146–149. 10.1016/s0002-9378(98)70642-8
101
Wang Y. Xiao B. Li J. Zhang M. Zhang L. Chen L. et al (2025). Hypoxia regulates small extracellular vesicle biogenesis and cargo sorting through HIF-1α/HRS signaling pathway in head and neck squamous cell carcinoma. Cell Signal127, 111546. 10.1016/j.cellsig.2024.111546
102
Wild R. Feingold K. R. (2023). Effect of pregnancy on lipid metabolism and lipoprotein levels. Editors FeingoldK. R.AnawaltB.BlackmanM. R.(South Dartmouth, MA: MDText.com, Inc.). Available online at: https://www.ncbi.nlm.nih.gov/books/NBK498654/ (Accessed October 21, 2025)
103
Williams M. A. Zingheim R. W. King I. B. Zebelman A. M. (1995). Omega-3 fatty acids in maternal erythrocytes and risk of preeclampsia. Epidemiology6, 232–237. 10.1097/00001648-199505000-00007
104
Williams M. A. King I. B. Sorensen T. K. Zingheim R. W. Troyer B. L. Zebelman A. M. et al (1998). Risk of preeclampsia in relation to elaidic acid (trans fatty acid) in maternal erythrocytes. Gynecol. Obstet. Invest46, 84–87. 10.1159/000010007
105
Wittmaack F. M. Gåfvels M. E. Bronner M. Matsuo H. McCrae K. R. Tomaszewski J. E. et al (1995). Localization and regulation of the human very low density lipoprotein/apolipoprotein-E receptor: trophoblast expression predicts a role for the receptor in placental lipid transport. Endocrinology136, 340–348. 10.1210/endo.136.1.7828550
106
Wojcik-Baszko D. Charkiewicz K. Laudanski P. (2018). Role of dyslipidemia in preeclampsia—A review of lipidomic analysis of blood, placenta, syncytiotrophoblast microvesicles and umbilical cord artery from women with preeclampsia. Prostagl. Other Lipid Mediat139, 19–23. 10.1016/j.prostaglandins.2018.09.006
107
Wolf F. A. Angerer P. Theis F. J. (2018). SCANPY: large-scale single-cell gene expression data analysis. Genome Biol.19, 15. 10.1186/s13059-017-1382-0
108
Wu H. Liu K. Zhang J. (2021). Excess fibronectin 1 participates in pathogenesis of pre-eclampsia by promoting apoptosis and autophagy in vascular endothelial cells. Mol. Hum. Reprod.27, gaab030. 10.1093/molehr/gaab030
109
Yang Y. Wang Y. Lv Y. Ding H. (2022). Dissecting the roles of lipids in preeclampsia. Metabolites12, 590. 10.3390/metabo12070590
110
Yang S. Zhou W. Dimitriadis E. Menkhorst E. (2025a). Maternal blood lipoprotein cholesterol prior to and at the time of diagnosis of preeclampsia: a systematic review. Am. J. Obstet. Gynecol. MFM7:101654. 10.1016/j.ajogmf.2025.101654
111
Yang G. Du X. Norris D. Zadoorian A. Zheng Y. Gao M. et al (2025b). CHP1 promotes lipid droplet growth and regulates the localization of key enzymes for triacylglycerol synthesis. Proc. Natl. Acad. Sci.122, e2508912122. 10.1073/pnas.2508912122
112
Ying X. Zhu Y. Jin X. Chang X. (2021). Umbilical cord plasma-derived exosomes from preeclamptic women induce vascular dysfunction by targeting HMGCS1 in endothelial cells. Placenta103, 86–93. 10.1016/j.placenta.2020.10.022
113
Ye J. Coulouris G. Zaretskaya I. Cutcutache I. Rozen S. Madden T. L. (2012). Primer-BLAST: A tool to design target-specific primers for polymerase chain reaction. BMC Bioinformatics13, 134. 10.1186/1471-2105-13-134
114
Yu J. Sane S. Kim J.-E. Yun S. Kim H.-J. Jo K. B. et al (2024). Biogenesis and delivery of extracellular vesicles: harnessing the power of EVs for diagnostics and therapeutics. Front. Mol. Biosci.10, 1330400. 10.3389/fmolb.2023.1330400
115
Zadoorian A. Du X. Yang H. (2023). Lipid droplet biogenesis and functions in health and disease. Nat. Rev. Endocrinol.19, 443–459. 10.1038/s41574-023-00845-0
116
Zhang D.-W. Garuti R. Tang W.-J. Cohen J. C. Hobbs H. H. (2008). Structural requirements for PCSK9-mediated degradation of the low-density lipoprotein receptor, Proc. Natl. Acad. Sci. U. S. A., 105:13045–13050. 10.1073/pnas.0806312105
117
Zhang W. Wang Q. Sun S. Liu Y. Zhao Y. Luo H. et al (2025). Derivation and genetic-screening of human haploid trophoblast stem cells. Sci. Bull. (Beijing)70, 1219–1223. 10.1016/j.scib.2025.01.063
118
Zhao J. Chow R. P. McLeese R. H. Hookham M. B. Lyons T. J. Yu J. Y. (2021). Modelling preeclampsia: a comparative analysis of the common human trophoblast cell lines. FASEB Bioadv3, 23–35. 10.1096/fba.2020-00057
119
Zhou W. Wang H. Yang Y. Guo F. Yu B. Su Z. (2022). Trophoblast cell subtypes and dysfunction in the placenta of individuals with preeclampsia revealed by single-cell RNA sequencing. Mol. Cells45:317–328. 10.14348/molcells.2021.0211
120
Zuniga-Hertz J. P. Patel H. H. (2019). The evolution of cholesterol-rich membrane in oxygen adaption: the respiratory system as a model. Front. Physiol.10, 1340. 10.3389/fphys.2019.01340
Summary
Keywords
preeclampsia, trophoblast, lipid metabolism, hypoxia, single-cell RNA-seq, SCARB1, PCSK9
Citation
Antipenko I, Knyazev E, Kulagin T and Tonevitsky A (2025) Comparative analysis of lipid metabolism in trophoblast subpopulations in preeclampsia and in vitro hypoxia model. Front. Mol. Biosci. 12:1731126. doi: 10.3389/fmolb.2025.1731126
Received
23 October 2025
Revised
17 November 2025
Accepted
18 November 2025
Published
09 December 2025
Volume
12 - 2025
Edited by
Chunheng Mo, Sichuan University, China
Reviewed by
Elena Grossini, University of Eastern Piedmont, Italy
Timur R. Samatov, Evotec, Germany
Updates
Copyright
© 2025 Antipenko, Knyazev, Kulagin and Tonevitsky.
This is an open-access article distributed under the terms of the Creative Commons Attribution License (CC BY). The use, distribution or reproduction in other forums is permitted, provided the original author(s) and the copyright owner(s) are credited and that the original publication in this journal is cited, in accordance with accepted academic practice. No use, distribution or reproduction is permitted which does not comply with these terms.
*Correspondence: Ivan Antipenko, iantipenko@hse.ru; Alexander Tonevitsky, atonevitsky@hse.ru
Disclaimer
All claims expressed in this article are solely those of the authors and do not necessarily represent those of their affiliated organizations, or those of the publisher, the editors and the reviewers. Any product that may be evaluated in this article or claim that may be made by its manufacturer is not guaranteed or endorsed by the publisher.