 Domenico Del Turco1*
 Mandy H. Paul1
 Jessica Schlaudraff1
 Meike Hick1,2
 Kristina Endres3
 Ulrike C. Müller2
 Thomas Deller1
- 1Institute of Clinical Neuroanatomy, Neuroscience Center, Goethe-University, Frankfurt, Germany
- 2Institute of Pharmacy and Molecular Biotechnology (IPMB), Heidelberg University, Heidelberg, Germany
- 3Clinic for Psychiatry and Psychotherapy, University Medical Center Mainz, Mainz, Germany
The physiological role of amyloid precursor protein (APP) has been extensively investigated in the rodent hippocampus. Evidence suggests that APP plays a role in synaptic plasticity, dendritic and spine morphogenesis, neuroprotection and—at the behavioral level—hippocampus-dependent forms of learning and memory. Intriguingly, however, studies focusing on the role of APP in synaptic plasticity have reported diverging results and considerable differences in effect size between the dentate gyrus (DG) and area CA1 of the mouse hippocampus. We speculated that regional differences in APP expression could underlie these discrepancies and studied the expression of APP in both regions using immunostaining, in situ hybridization (ISH), and laser microdissection (LMD) in combination with quantitative reverse transcription polymerase chain reaction (RT-qPCR) and western blotting. In sum, our results show that APP is approximately 1.7-fold higher expressed in pyramidal cells of Ammon’s horn than in granule cells of the DG. This regional difference in APP expression may explain why loss-of-function approaches using APP-deficient mice revealed a role for APP in Hebbian plasticity in area CA1, whereas this could not be shown in the DG of the same APP mutants.
Introduction
Amyloid precursor protein (APP) is an integral membrane protein involved in the pathogenesis of Alzheimer’s disease (AD). It is processed by proteases and cleaved into several biologically active fragments (e.g., Turner et al., 2003; Müller and Zheng, 2012; Zhang et al., 2012). Of note, proteolysis of APP by beta- and gamma-secretases generates the amyloid-ß (Aß) peptide, which oligomerizes, interferes with synaptic functions, and eventually aggregates into extracellular amyloid plaques, one of the neuropathological hallmarks of AD (Selkoe and Hardy, 2016). In contrast, proteolysis of APP by α-secretases (e.g., Postina et al., 2004; Yang et al., 2006; Fahrenholz, 2007; Prinzen et al., 2009; Saftig and Reiss, 2011; Kuhn et al., 2016), generates soluble APP-α (sAPPα), which is neuroprotective and important for neuronal plasticity (Turner et al., 2003; Ring et al., 2007; Aydin et al., 2012; Kögel et al., 2012). In the latter case, the Aß-peptide is not formed because α-secretases cleave APP within the Aß region of the protein. In AD the balance of this processing by secretases shifts towards the amyloidogenic pathway, which increases Aß production and leads to a lack of sAPPα (Endres and Fahrenholz, 2012) resulting in an impairment of cognition.
A region of the brain which is of particular interest in the context of AD is the hippocampus. Since the hippocampal formation and hippocampus-dependent learning and memory are affected early during the course of the disease (Braak and Braak, 1991) the hippocampus has been used as a model brain region to study the role of APP and its cleavage products in synaptic plasticity, learning and memory and neuroprotection (e.g., Turner et al., 2003; Ring et al., 2007). Interestingly, our physiological investigations of APP−/− mice revealed remarkable differences between the subregions of the hippocampus: whereas APP was necessary for long-term potentiation (LTP) at the CA3–CA1 synapse (Ring et al., 2007; Weyer et al., 2011; Hick et al., 2015) it was not essential for LTP at the entorhinal cortex-granule cell (EC-GC) synapse in the dentate gyrus (DG; Jedlicka et al., 2012). We speculated that regional differences in basal APP expression or APP processing could explain these phenotypic differences. This interpretation would be in line with a recent publication, which reported APP to be predominantly expressed by interneurons in the DG (Wang et al., 2014).
To provide first evidence for this hypothesis and to reliably quantify differences in APP expression between granule cells of the DG and pyramidal cells of area CA1, we studied layer-specific expression levels of APP in the principal cell layers using laser microdissection (LMD) in combination with quantitative polymerase chain reaction (qPCR) and western blot analysis (e.g., Burbach et al., 2003; Del Turco et al., 2014). Since APP is alternatively spliced into three major isoforms (Kang et al., 1987; Tanzi et al., 1988; Sisodia et al., 1993; Rohan de Silva et al., 1997), i.e., APP-770, APP-695 and APP-751, assays detecting all major isoforms were employed. Furthermore, we used an antibody for western blotting, which is highly specific for APP and does not show staining on APP−/− brain tissue (Guo et al., 2012) to quantify APP levels and to study its cellular distribution. The selection of the antibody appeared to be especially important, since some antibodies show unspecific background staining on tissue sections and may cross-react with APP-related proteins, such as the APP-like-proteins 1 or 2 (Anliker and Müller, 2006; Kaden et al., 2012; Müller and Zheng, 2012). Together with in situ hybridization (ISH) data for APP, our results show that APP is expressed exclusively by hippocampal neurons under physiological conditions. It is ~1.7 fold higher expressed by CA1 pyramidal cells compared to dentate granule cells, which may contribute to the regional differences seen in electrophysiological studies of APP−/− mice (Ring et al., 2007; Jedlicka et al., 2012).
Materials and Methods
Animals
Adult (3–5 months old) male C57BL/6J mice (Janvier, France) and APP-deficient mice obtained from the colony at Heidelberg University (e.g., Li et al., 1996; Jedlicka et al., 2012) were used for experimental analysis. Animal care and experimental procedures were performed in agreement with the German law on the use of laboratory animals (animal welfare act; TierSchG). Animal welfare was supervised and approved by the Institutional Animal Welfare Officer.
Immunofluorescence
Mice were deeply anesthetized with an overdose of pentobarbital (300 mg/kg body weight) and transcardially perfused with 0.9% sodium chloride (NaCl) followed by 4% paraformaldehyde (PFA) in phosphate-buffered saline (pH 7.4). Brains were removed, post-fixed for 4–24 h in 4% PFA and sectioned in the coronal plane (40 μm) using a vibratome (VT1000 S, Leica Microsystems). Free-floating sections were incubated in a blocking buffer containing 0.5% Triton X-100 and 5% bovine serum albumin (BSA) in 0.05 M Tris-buffered saline (TBS) for 30 min at room temperature followed by incubation in the primary antibody (diluted in 0.1% Triton X-100 and 1% BSA in 0.05 M TBS) overnight at 4°C. The following primary antibodies were used: mouse anti-APP (22C11, immunogen: 66–81 amino acids (aa) of purified recombinant Alzheimer precursor A4 fusion protein (N-terminus); MAB348, Chemicon), rabbit anti-APP (CT20, immunogen: synthetic peptide corresponding to 751–770 aa of human APP (C-terminus); 171610, Calbiochem), rabbit anti-APP (Y188, immunogen: synthetic peptide corresponding to C-terminus of human APP (YENPTY motif); ab32136, Epitomics), mouse anti-NeuN (A60, immunogen: purified cell nuclei from mouse brain; MAB377, Chemicon) and rabbit anti-GFAP (immunogen: GFAP isolated from cow spinal cord; Z0334, Dako). After several washes, sections were incubated with the appropriate secondary Alexa-conjugated antibodies (1:2000, Invitrogen, Waltham, MA USA) for several hours at room temperature, counterstained with Hoechst 33242 (Invitrogen) or DRAQ5 (Thermo Fisher Scientific, Waltham, MA, USA), and finally mounted in DAKO Fluorescent Mounting Medium (Dako).
Western Blotting
For protein extraction, 10× volume of homogenization buffer (20 mM Tris, 500 mM NaCl, 0.5% CHAPS, 5 mM EDTA) was added to freshly dissected tissue samples, i.e., whole hippocampus as well as microdissected CA1 pyramidal cell layer (pcl) and dentate granule cell layer (gcl). Homogenization was performed with a pestle (Wheaton, Montgomery, MD, USA). After centrifugation at 4°C for 30 min (22,000 rpm, Sorvall WX Ultra Series, Thermo Electron Corporation), protein concentration was quantified with a Qubit® 2.0 Fluorometer (Life Technologies, Carlsbad, CA, USA) using Qubit® Protein Assay Kit (Life Technologies, Carlsbad, CA, USA). Samples were denatured for 5 min at 95°C and immediately cooled down on ice. For gel electrophoresis, protein amounts (approx. 30 μg for hippocampal tissue, 5–6 μg for microdissected tissue) were loaded onto 8% SDS–polyacrylamide gels and were separated at 120 V for 15 min followed by 160–180 V for 45 min. Subsequently, gels were blotted to nitrocellulose membranes at 15 V for 75 min. Blots were then washed twice in TBS and incubated with Odyssey Blocking Buffer (LI-COR Biosciences) at room temperature for 60–120 min. Blots were washed again in TBS and incubated overnight at 4°C with the appropriate primary antibody diluted in 1:1 Odyssey Blocking Buffer with TBS and 0.1% Tween20. Blots were washed in TBS with 0.1% Tween20 and incubated with an IRDye800CW conjugated secondary antibody (LI-COR Biosciences) at room temperature for 45 min. For normalization mouse anti-GAPDH antibody (Calbiochem) in combination with an IRDye680 conjugated goat anti-mouse antibody (LI-COR Biosciences) was used. Two-color imaging was performed using Odyssey® Infrared Imaging System (LI-COR Biosciences). Densitometric analysis for each protein band was done using the Image Studio Software (LI-COR Biosciences). Each protein quantification was first normalized against GAPDH (loading control) from the same gel (intra-blot analysis), before comparisons for changes were made (inter-blot comparisons). The results (x-fold) are presented as means and standard deviations (SD) of three independent experiments. Statistics were analyzed using Student’s t-test. P values of ≤ 0.05 were considered statistically significant.
In situ Hybridization
An ISH probe specific for all major App isoforms was designed to detect the juxtamembrane region of APP. To this end, a cDNA fragment encoding aa 492–623 of APP695 was cloned into the pcDNA3 vector. Prior to in vitro transcription, the plasmid was linearized and gel-purified using a gel extraction kit (Qiagen). in vitro transcription of DIG-labeled antisense RNA probe from the SP6 promoter was performed using the Roche DIG RNA labeling kit (SP6/T7), following the manufacturer’s instructions. Probes were subsequently purified using RNase-free ChromaSpin 100 columns (Clontech). The quantity of labeled and purified probe was estimated by Dot blot as described in the DIG RNA labeling kit manual.
Whole mouse brains were dissected and immediately placed on dry ice until they were thoroughly frozen. Brain slices (14 μm) were cut on a cryostat (Zeiss Hyrax C50), collected on Superfrost plus slides (Thermo Scientific) and dried at 56°C for 30 min. Sections were fixed for 10 min in 4% PFA in PBS, washed thrice in diethyl pyrocarbonate (DEPC)—treated PBS, and then permeabilized and acidified in triethanolamine hydrochloride (TEA-HCl)—acetic anhydride for 10 min. After three washing steps with DEPC-PBS, slices were dehydrated in an ethanol series (50%, 75%, 95%, 100%; 5 min each) and dried for at least 2 h at 56°C. Anti-sense probe was diluted in hybridization buffer to the final concentration of approx. 400 pg/μl and heated to 80°C for 10 min. After cooling down on ice, 100 μl of hybridization solution were applied to each slide, which was then covered with parafilm. Hybridization was done overnight at 56°C. On the next day, slides were placed in 4× SSC for 10 min to wash off excess probe. Stringent washing steps were 30 min in 0.2× SSC at 60°C, followed by another 90 min in fresh 0.2× SSC at 60°C, followed by 10 min in 0.2× SSC at room temperature. For probe detection, slides were equilibrated in P1DIG (100 mM Tris-HCl; 150 mM NaCl) for 10 min and blocked in blocking solution (P1DIG + 0.5% BSA + 1% Blocking reagent, Roche) for 30 min. Brain slices were encircled with PAP PEN and anti-DIG-AP antibody (80 μl, diluted 1:500 in blocking solution) was pipetted on every brain slice. Antibody incubation was done overnight at 4°C in a humidified chamber. The next day, all slides were washed twice for 15 min in P1DIG, then equilibrated in P3DIG (100 mM Tris-HCl; 100 mM NaCl; 50 mM MgCl2, pH 9.5) for 2 min. Slides were incubated in substrate solution (NBT/BCIP, diluted 1:50 in P3DIG) overnight at room temperature until color development was sufficient. Slides were then washed in PBS, fixed for 10 min in 4% PFA in PBS, washed in P4DIG (10 mM Tris-HCl; 1 mM EDTA, pH 8.0) for 10 min, then air dried for 2 h and finally mounted in Mowiol (Polysciences).
Digital Illustrations
Figures were prepared digitally using commercially available graphics software (Photoshop, Adobe Inc., San Jose, CA, USA). Fluorescent images were acquired using a digital camera (Digital Sight DS-M5c, Nikon, Germany) or confocal microscopy (Eclipse C1 Plus, Nikon). Single fluorescent images of the same section were digitally superimposed. The contrast, brightness and sharpness of images were adjusted as needed for each section. No additional image alteration was performed.
Laser Microdissection
Mice were killed by an overdose of isoflurane (Abbott). Brains were rapidly removed from the cranium, embedded in tissue freezing medium and immediately flash-frozen in −70°C isopentane cooled by dry ice. Cryostat sections (8 μm for RNA analysis, 20 μm for western blotting) were mounted on polyethylene naphthalene (PEN) or polyester (POL) slides (Leica Microsystems). For RNA analysis, sections were fixed shortly in −20°C cold acetone, stained with 1% cresyl violet staining solution and dehydrated in 75% and 100% ethanol. Using a Leica LMD6500 system (Leica Microsystems), defined tissue samples of the dentate gcl and of CA1 pcl were collected separately from the same brain sections and transferred to −80°C until further processing.
RNA Isolation and Reverse Transcription
Total RNA was isolated using the RNeasy Plus Micro Kit (Qiagen) according to the manufacturer’s recommendations. RNA integrity was assessed using the Agilent 2100 Bioanalyzer system and Agilent RNA 6000 Pico Kit (Agilent Technologies), and then reverse transcribed using High Capacity cDNA Reverse Transcription Reagents Kit (Applied Biosystems) following the manufacturer’s recommendations.
Quantitative Polymerase Chain Reaction (qPCR)
cDNA was amplified using TaqMan® Fast Universal PCR Master Mix (Applied Biosystems) and the StepOnePlus Real-Time PCR System (Applied Biosystems). PCR products were checked on Agilent DNA 1000 Chips (Agilent Technologies) with the Agilent 2100 Bioanalyzer system to verify product specificity and amplicon size. Quantification of the gene expression of candidate reference genes was carried out using SYBR® GreenERTM qPCR Supermix Universal (Invitrogen, Waltham, MA, USA) following the manufacturer’s recommendations. Primer efficiencies and quantification cycle (Cq) values were calculated using LinRegPCR Software (Tuomi et al., 2010). To determine the most stable reference genes and the minimum number for accurate normalization, NormFinder (Andersen et al., 2004) and geNorm (Vandesompele et al., 2002) were used according to the developer’s manuals. qPCR data were tested for statistical significance using one-way ANOVA followed by Bonferroni post hoc test to correct for multiple comparisons, *p ≤ 0.05.
Results
APP is Differentially Expressed in the Principal Cell Layers of the Hippocampus
For immunohistochemical detection of APP protein in the adult mouse hippocampus, widely used antibodies against APP were selected which recognize the major isoforms of APP in the rodent brain, i.e., APP-770, APP-695 and APP-751. To address the specificity of these antibodies, we tested the antibodies on wild type (APP+/+) and APP deficient (APP−/−) brain tissue sections. Two of the antibodies, i.e., Y188 and CT20, that both recognize C-terminal APP epitopes showed immunoreactivity only in APP+/+ brain sections but virtually no staining in APP−/− hippocampal tissue (Figures 1A–J). Using these antibodies, a considerably stronger fluorescence signal was observed in the principal layers of the Ammon’s horn compared to the dentate gcl (Figures 1A,B,D,F,G,I). Non-specific immunoreactivity was moderately higher in APP−/− sections using CT20 compared to the Y188 antibody (Figures 1C,E,H,J). In contrast, the 22C11 antibody did not show specific staining (Figures 1K–O).
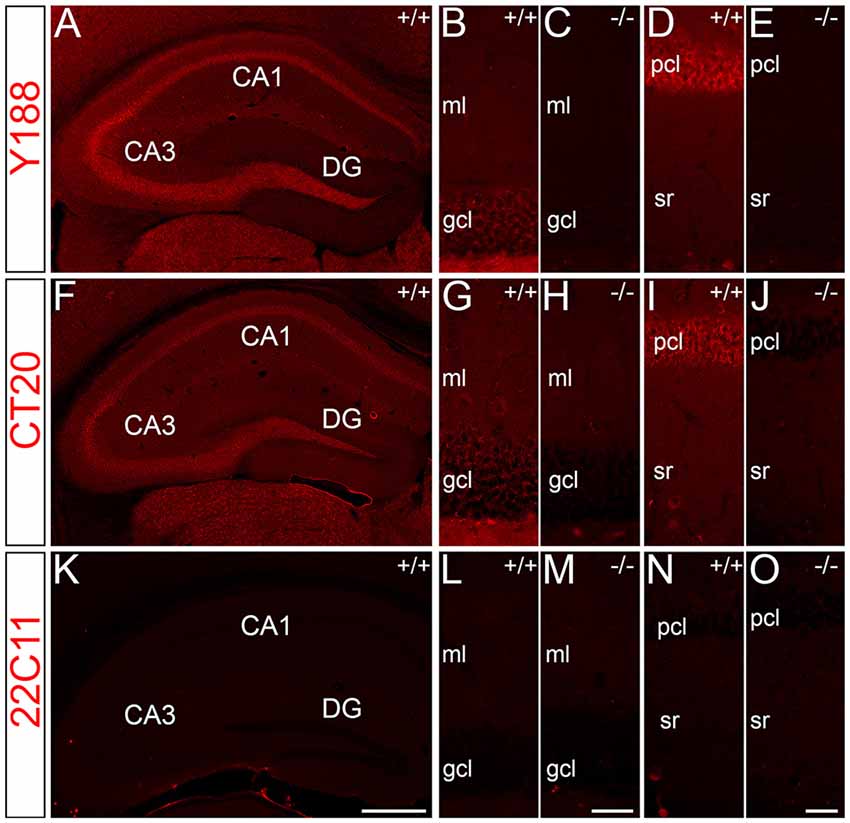
Figure 1. Specificity of amyloid precursor protein (APP) antibodies tested on hippocampal sections of adult wild type and APP deficient mice. (A) Immunofluorescence of the dorsal hippocampus of wild type (+/+) mice using the Y188 antibody. The dentate gyrus (DG) shows only a weak signal, whereas a more intense labeling is seen in Ammon’s horn (CA1–3). (B,C) Immunofluorescence is detectable in the granule cell layer (gcl) and molecular layer (ml) of the DG in wild type but not in brain sections of APP deficient mice using the Y188 antibody. (D,E) Principal cell layer (pcl) of CA1 shows a strong signal in wild type mice. Some immunofluorescence is also seen in stratum radiatum (sr). In contrast, staining is absent in APP-deficient hippocampal tissue. (F–J) Immunofluorescence of the hippocampus of wild type and APP deficient mice using the CT20 antibody. (F,G,I) Similar to the results with Y188 a stronger signal can be seen in Ammon’s horn (CA1–3) of wild type mice compared to the DG. (H,J) Background staining is slightly higher in APP-deficient tissue sections compared to the background seen with the Y188 antibody (in C,E). (K–O) Immunostaining using the 22C11 antibody shows similar staining in wild type and APP-deficient tissue, suggesting that this antibody is not sufficiently specific to identify APP in tissue sections (K), DG (L,M) and CA1 (N,O). Scale bars: (K) 500 μm; (M,O) 25 μm.
To quantify protein levels and to corroborate our immunofluorescence data, we performed double-fluorescence western blot analysis using whole hippocampal homogenates as well as laser microdissected tissue samples of CA1 pcl and DG gcl. Holo-APP (~95–100 kDa) was recognized by all three APP antibodies in wild type but not in APP deficient tissue samples (Figure 2). CT20 and 22C11 demonstrated additional fragments of smaller size in both genotypes (Figure 2). The Y188 antibody appeared to be the most specific of the three, which was in line with our recent western blot results using this antibody indicating that it primarily detects full-length APP whereas the relative abundance of C-terminal stubs that are detected by this antibody is much lower (Fol et al., 2016). Based on these results, we chose Y188 to quantitatively determine APP in laser microdissected samples of hippocampal subregions (Figure 3).
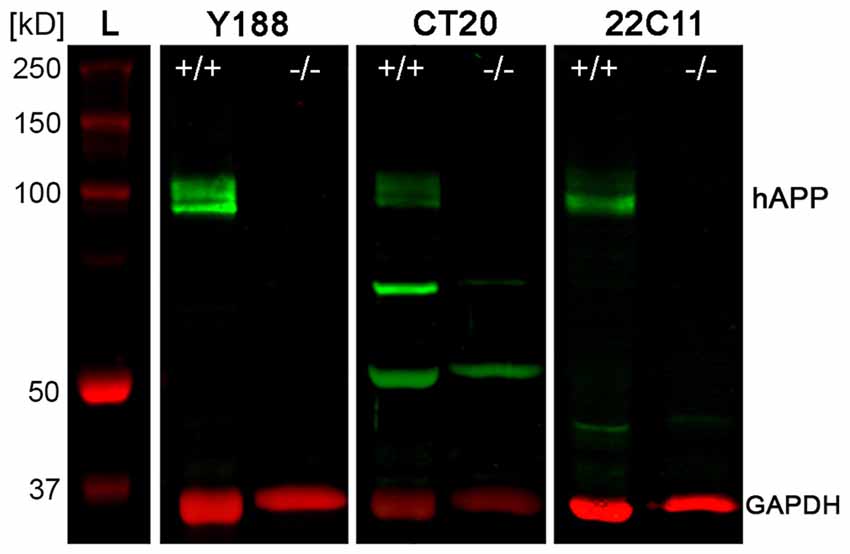
Figure 2. Western blot analysis of APP protein in adult mouse hippocampus. Western blotting of the three antibodies used for detecting APP, i.e., Y188, CT20 and 22C11, shows the typical set of bands corresponding to holoAPP (hAPP) protein (~95–100 kDa) in hippocampal homogenates of adult wild type (APP+/+) mice but not in APP deficient (APP−/−) tissue. Additional bands of smaller sizes seen with both CT20 and 22C11 antibodies are not specific for APP, as they are also seen in the APP KO control. GAPDH (~35–38 kDa) was used as loading control. L: Ladder (Precision Plus Protein™ Dual Color Standards, BIO-RAD).
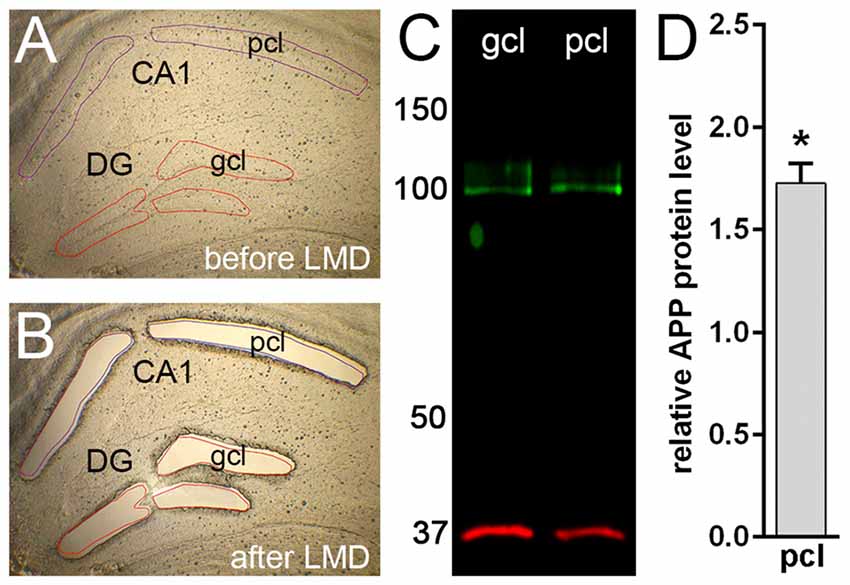
Figure 3. Western blot analysis of APP protein in microdissected hippocampal subregions of adult mouse. (A,B) Laser microdissection (LMD) of hippocampal subregions, i.e., CA1 pyramidal cell layer (pcl) and the gcl of the DG. (C) Western blotting using the Y188 antibody shows a specific signal corresponding to APP protein (~95–100 kDa) in DG gcl and CA1 pcl. GAPDH (~35–38 kDa) was used as loading control. (D) Quantitative western blot analysis reveals higher APP protein levels (~1.7-fold) in CA1 pcl relative to DG gcl samples. Data (N = 3 mice, n = 3 for each region) were tested for statistical significance using t-test (two-tailed), *p ≤ 0.05. Values are represented as mean ± standard deviations (SD).
In line with our immunofluorescence labeling, quantitative western blot analysis of microdissected tissue revealed a significantly higher APP protein level (approximately 1.7 fold) in the pcl of CA1 compared to the gcl of the DG (Figure 3). These data confirmed our initial impression that APP is differentially expressed in these two hippocampal subregions.
APP is Predominantly Expressed by Neurons in the Adult Mouse Hippocampus
To elucidate, which hippocampal cell types produce relevant amounts of APP protein, we performed confocal double-immunofluorescence analysis using Y188 in combination with the neuron-specific marker NeuN (neuronal nuclear antigen) or the astrocytic marker GFAP (glial fibrillary acidic protein; Figure 4). We performed this staining since earlier publications, which were in part performed in tissue cultures, had also suggested an astroglial expression of APP (Golde et al., 1990; Haass et al., 1991; LeBlanc et al., 1991). In our preparations, we found that APP is predominantly expressed by hippocampal neurons (Figures 4A–D). In contrast, we did not detect an astroglial APP expression (Figures 4F–J). Of note, APP-positive neurons were not only found in the principal cell layers of the hippocampus, i.e., in pcl of Ammon’s horn and, to some weaker extent, in the dentate gcl, but also in adjacent layers, e.g., hilus, stratum radiatum (sr) or stratum lacunosum-moleculare (slm; Figures 4A,C).
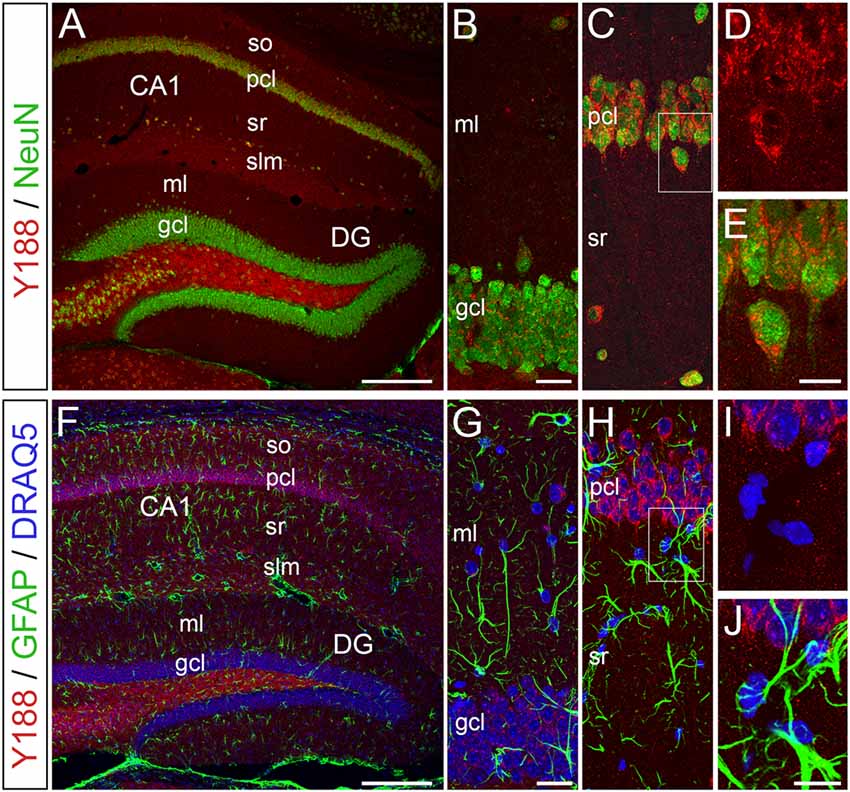
Figure 4. APP immunoreactivity is predominantly detected in neurons of the adult mouse hippocampus. (A–E) Confocal double-immunofluorescence staining for APP using Y188 (red) in combination with the neuron-specific marker NeuN (green) in wild type brain sections shows a strong neuronal APP expression in the pcl of area CA1 compared to the DG gcl. of note, Y188 and NeuN double positive cells were also found in adjacent layers (e.g., hilus and stratum radiatum, sr). (F–J) Double-immunofluorescence staining for APP (Y188, red) and the astrocytic marker GFAP (green) revealed no APP expression by this glial cell population in the adult mouse hippocampus. DRAQ5 was used to visualize cell nuclei (blue). Scale bar: (A,F) 200 μm; (B,G) 25 μm; (E,J) 12.5 μm.
To also identify App mRNA-expressing cells in the hippocampus, we next performed non-radioactive ISH using a digoxygenin-labeled riboprobe. This probe detects an mRNA sequence corresponding to the juxtamembrane region of APP, which is present in all major APP isoforms, i.e., APP-770, APP-751 and APP-695, but not conserved in the related APLPs. Strongly App mRNA-expressing cells were detected in the pcl of Ammon’s horn and in the hilus of the DG, whereas only a comparatively weak ISH signal was observed in the dentate gcl (Figures 5A,C). Outside the principal cell layers, only few App mRNA-expressing cells could be found in the adjacent layers, e.g., sr or slm (Figure 5D), which is an expression pattern that corresponds to the expression of APP by interneurons (Wang et al., 2014) but not by astroglia. Hippocampal tissue of APP deficient mice served as negative control and was stained using the same anti-sense riboprobe. This experiment revealed only weak non-specific background (Figure 5B).
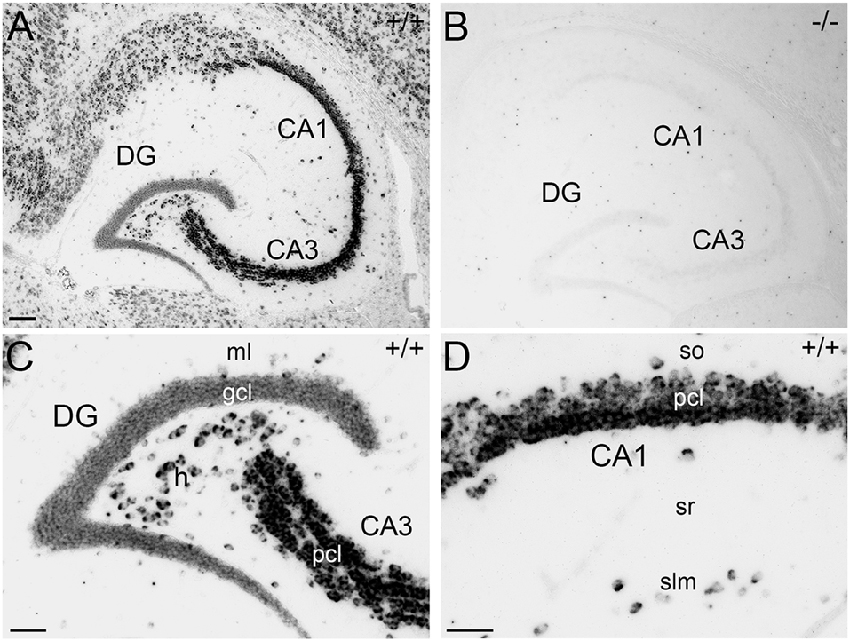
Figure 5. Non-radioactive in situ hybridization (ISH) for App mRNA in the adult mouse hippocampus. (A) ISH using a digoxygenin-labeled anti-sense riboprobe demonstrates App mRNA expression in the hippocampus of an adult wild type (APP+/+) mouse. Principal layers of Ammon’s horn show a strong expression for App mRNA. (B) Hippocampal tissue of APP deficient (APP−/−) mice served as negative control and was stained with the same anti-sense riboprobe. This showed only non-specific signals. (C) App mRNA expression is strong in the pcl of area CA3 and in the dentate hilus (h). In contrast, the mRNA-signal is much weaker in the gcl of the DG. Molecular layer (ml). (D) App mRNA is strongly expressed in pcl of CA1. In addition, a small number of App mRNA—positive cells are found in the adjacent layers, e.g., stratum oriens (so), stratum radiatum (sr), or stratum lacunosum-moleculare (slm). Scale bars: (A) 100 μm; (C,D) 50 μm.
Together, the results obtained by ISH, immunofluorescence and western blot analysis suggest that App mRNA as well as APP protein are predominantly expressed by principal neurons but not by astroglial cells in the adult mouse hippocampus.
Quantitative Analysis of App mRNA Expression in Hippocampal Subregions
By using qPCR in combination with LMD, we aimed to compare App mRNA expression levels in the pcl of CA1 compared to the gcl of the DG. For this purpose, only high quality RNA samples (RIN-values: ~9) of laser microdissected cell layers were used (Figures 6A–C). To more reliably analyze possible differences in gene expression, we first validated a panel of suitable reference genes (see Table 1 for details) for both hippocampal subregions in order to achieve robust qPCR data. Two established and widely accepted algorithms, i.e., geNorm and NormFinder, were used for the expression stability ranking of reference genes for CA1 and DG (Table 2). As determined by pairwise variation using geNorm and accumulated SD analysis according to NormFinder, the most stable reference genes as well as the minimal number necessary for accurate normalization were determined (Figures 6D,E,G,H). Of note, both algorithms showed a comparable ranking for all of the candidate reference genes tested (Table 2; Figures 6D,G).
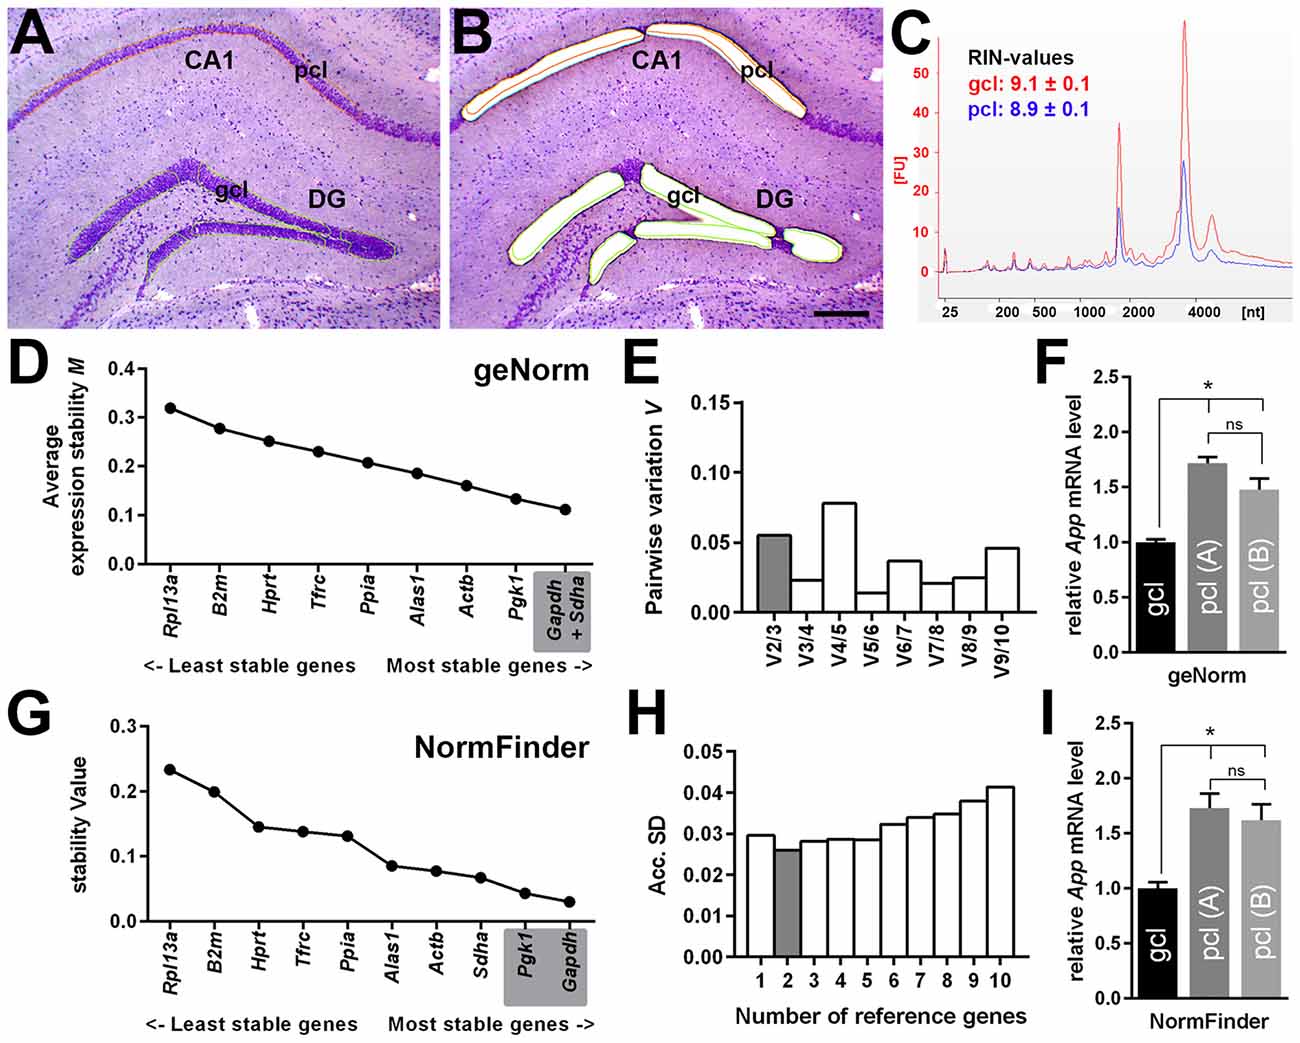
Figure 6. Quantitative App mRNA expression in hippocampal subregions. (A,B) LMD of hippocampal subregions, i.e., CA1 pcl and gcl of the DG. Representative section of the dorsal hippocampus (coronal plane, cresyl violet staining) before (A) and after (B) LMD is shown. Scale bar: 250 μm. (C) RNA integrity analysis of total RNA isolated from the dissected gcl (red) and from pcl (blue) demonstrating highly intact RNA (RIN-values: ~9; Agilent 2100 Bioanalyzer). (D,E) Average expression stability values (M) and evaluation of the optimum number of candidate reference genes for CA1 pcl and for DG gcl according to geNorm software. Pairwise variation (V) of candidate reference genes indicates that the use of the two most stable genes is sufficient to obtain an accurate normalization index for quantitative PCR (qPCR) analysis. (F) A significantly higher gene expression for App (1.5- to 1.7-fold) was detected in CA1 pcl relative to DG gcl using two different App-specific TaqMan assays (A: Mm_01344172_m1, B: Mm_00431830_m1) after normalization to a reference gene index calculated by geNorm. (G,H) Gene expression stability values (S) and accumulated SD analysis using NormFinder. The minimal number of reference genes required for effective normalization is highlighted. (I) Comparable to the results obtained by geNorm algorithm, a significantly higher App expression (1.6- to 1.7-fold) was detected in CA1 pcl relative to DG gcl after normalization to the reference gene index estimated by NormFinder. Data (N = 5–6 mice) were tested for statistical significance using one-way ANOVA followed by Bonferroni post hoc test to correct for multiple comparisons, *p ≤ 0.05.
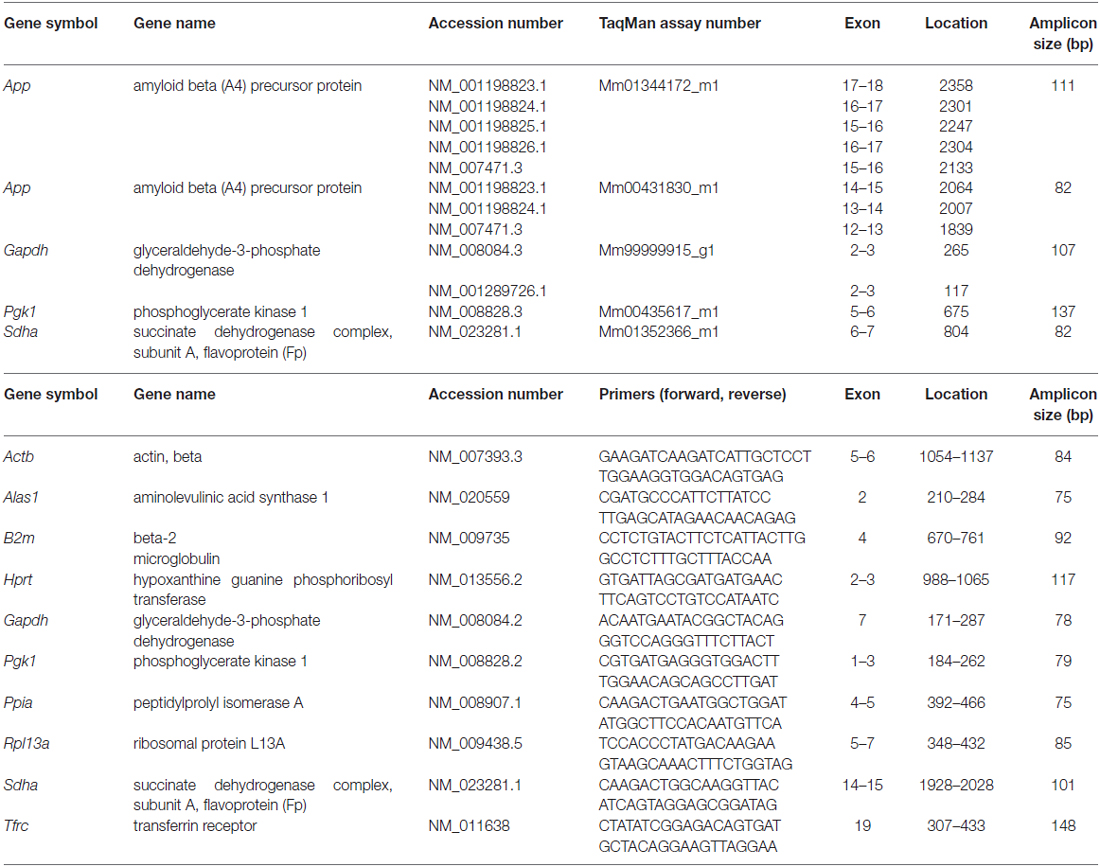
Table 1. Details of qPCR assays used in this study.
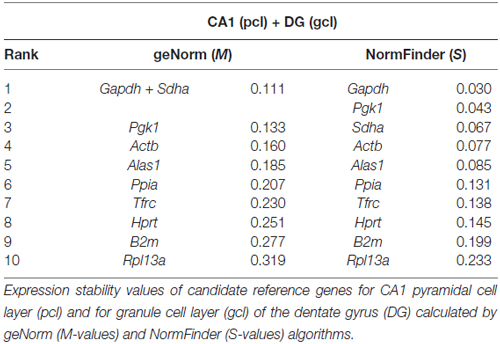
Table 2. Ranking of candidate reference genes by geNorm and NormFinder.
Based on this data set, we used a normalization index out of the two most stable reference genes as well as the best combination of suitable genes, i.e., Gapdh and Sdha for geNorm, and Gapdh and Pgk1 for NormFinder, respectively. For App gene expression analysis, two different qPCR assays specific for all major App isoforms were selected, which detected almost identical gene expression levels. Using this strategy, we determined a significantly higher expression of App mRNA (1.5- to 1.7-fold) in CA1 pyramidal cells compared to granule cells of the DG using either of the reference gene indices for accurate normalization of qPCR data (Figures 6F,I).
Discussion
In the present study, we analyzed the expression of APP at the protein and mRNA level in the gcl and CA1 pcl of the adult mouse hippocampus using confocal immunofluorescence, ISH and LMD in combination with qPCR or western blot analysis. Our main findings can be summarized as follows: full-length APP is expressed by neurons under physiological conditions. APP expression is ~1.7× stronger at both mRNA and protein level in CA1 pyramidal cells compared to dentate granule cells. We propose that these differences in basal APP expression may contribute to the regional differences in APP function we reported in earlier studies using APP−/− animals (Ring et al., 2007; Jedlicka et al., 2012).
Endogenous Full-Length APP Levels in the Mouse Hippocampus—Methodological Considerations
Quantification of endogenous APP levels in the brain is confounded by the fact that some commercially available antibodies recognize not only full-length APP but also APP cleavage products and/or other protein fragments (Guo et al., 2012). In addition, antibodies may cross-react with the highly homologous APLPs, which further limits antibody specificity (Slunt et al., 1994). Thus, we ensured using tissue of APP−/− mice that the antibodies we used for immunohistochemistry and western blot analysis in this study are highly specific and can be employed to detect holo-APP in the mouse hippocampus with high reliability. Furthermore, since APP is expressed in different isoforms in the nervous system and the brain (Kang and Müller-Hill, 1990; Sisodia et al., 1993), we designed probes for ISH and primers for qPCR which detect the three major isoforms of APP. Choice of these tools for our quantitative analysis make us confident that we predominantly measured total full-length APP mRNA and protein in our study.
Furthermore, since we were specifically interested in the neuronal expression of APP in these two regions and since our immunohistochemistry revealed a neuron-specific expression pattern of APP in the hippocampus (see below) we used LMD to selectively harvest the neuronal cell layers, i.e., the gcl of the DG and the CA1 pcl, respectively. This approach makes our quantification quite specific for granule cells and CA1 pyramidal cells, since the number of principal cells by far exceeds the number of cells of other cell types in these layers. Thus, we are confident that we here report robust and reliable data on the relative expression of APP mRNA and protein in the principal neurons of two major subfields of the hippocampus.
Full-Length APP is Expressed by Neurons in the Mouse Hippocampus
In the adult rodent CNS, three major APP isoforms encoded by alternatively spliced transcripts have been described. In line with Guo et al. (2012), our data indicate that in tissue of intact and otherwise untreated mouse brain endogenous APP is expressed selectively by neurons but not astroglia: neither immunostaining with the APP-specific antibody Y188 nor ISH with App-specific riboprobes revealed a glial expression pattern. Similarly, double-labeling for neuronal and astroglial markers revealed a highly selective neuronal expression. In culture, however, previous studies reported that both astrocytes and microglia express APP (Haass et al., 1991; LeBlanc et al., 1991; Forloni et al., 1992; Mönning et al., 1995) and during aging Aß production has also been reported from non-neuronal sources in transgenic APP overexpressing mice. Thus, the possibility exists that glial cells express APP under reactive conditions in vivo. This issue was previously addressed by Guo et al. (2012), who used a traumatic brain injury model and an AD mouse model and failed to detect APP-positive astrocytes using APP-specific antibodies. They concluded that in vivo APP levels in astrocytes may be too low for detection even under reactive conditions (Guo et al., 2012). In our own investigations, in which we used entorhinal cortex lesions (Lynch et al., 1978; Steward, 1994; Deller and Frotscher, 1997) to denervate the DG, we also failed to see an increase in App mRNA in the denervated outer molecular layer (Del Turco et al., 2014). In this layer, reactive glia are particularly abundant (Deller et al., 2000, 2007; Del Turco et al., 2014). Although these two reports cannot rule out the possibility that under some other conditions APP is expressed in vivo by glial cells, they certainly suggest that glial APP is not the primary source of APP in the intact or injured brain.
Endogenous Neuronal App mRNA Levels are Tightly Controlled
It has been pointed out by others that App is regulated very much like a housekeeping gene (Dawkins and Small, 2014). The fact that the App promoter lacks TATA and CAAT boxes but contains sites for several transcription factors regulating the expression of proteins associated with cell proliferation and differentiation suggests that App mRNA levels are primarily regulated during development (Izumi et al., 1992; Clarris et al., 1995; for review see Dawkins and Small, 2014). In the adult brain App mRNA levels may be much more tightly controlled to supply neural tissue with a constant level of APP protein for further processing.
However, a certain degree of transcriptional regulation has been reported for APP and App mRNA in adult neurons following brain injury (Murakami et al., 1998; Van Den Heuvel et al., 1999, 2007; Itoh et al., 2009). This appears to be of relevance, since head trauma is considered a risk factor for AD (e.g., Mortimer et al., 1991; Szczygielski et al., 2005). Concerning this lesion-induced regulation, the experimental literature is somewhat controversial (Szczygielski et al., 2005). By hindsight this is not surprising since many different antibodies and probes were used and some of them may not have been tested for specificity. In our own investigations using the entorhinal cortex lesion model we initially failed to observe an increase in App mRNA using screening methods. Only after using the sensitive LMD/qPCR approach (Burbach et al., 2003), which made it possible to measure App mRNA within microdissected cell and fiber layers did we detect a ~1.3-fold increase of App mRNA in denervated granule cells at 7 days post lesion (Del Turco et al., 2014). We conclude that neuronal App expression is tightly regulated and even under extreme conditions, e.g., brain injury, App gene expression changes range between 1- to 2-fold. If translated 1:1 into protein, as our present study suggests, such an increase in App mRNA may, however, be biologically and pathophysiologically relevant.
Finally, it should be kept in mind that transcriptional regulation of App is only one regulatory step under physiological and pathophysiological conditions, likely limiting the amount of full-length APP protein available for downstream processing. Post-transcriptional regulation by miRNAs has also been recently described (Schonrock et al., 2012). Most importantly, however, the amount, availability and activity of the secretases eventually decide the “biological fate” of the full-length protein by liberating its biologically active fragments. In contrast to the levels of App mRNA, which appear to be tightly controlled and provide neurons with a basal supply of APP, the activity and/or expression of secretases is regulated by neuronal activity and many other conditions, which have been reviewed elsewhere (Endres and Fahrenholz, 2012; Sun et al., 2012; Vassar et al., 2014; Vincent, 2016).
Basal Expression of APP is Higher in CA1 Pyramidal Neurons Compared to Dentate Granule Cells
ISH against endogenous App mRNA revealed a weaker labeling of dentate granule cells compared to the pyramidal cells of Ammon’s horn. This made us wonder whether this reflected a true regional difference between the DG and the other hippocampal subfields. Since non-radioactive ISH cannot be reliably used for quantitative analysis, we quantified App mRNA using qPCR. Using LMD, the principal cell layers were harvested, which reduced dilution effects. The careful selection of reference genes using current recommendations for qPCR (Vandesompele et al., 2002; Andersen et al., 2004) ensured a very robust reference for the subregional comparison. In sum, this revealed a 1.5- to 1.7-fold difference in App mRNA expression between the DG and area CA1. The difference in App mRNA level translates into protein, since we used the same LMD approach to obtain the tissue for western blot analysis and found a comparable difference for APP protein, i.e., ~1.7-fold more protein in area CA1 compared to the DG.
Regional Differences in APP Expression May Contribute to Regional Differences in Synaptic Plasticity
The physiological role of APP has been investigated in the hippocampus using APP−/− mice. This loss-of-function approach revealed a robust role for APP in synaptic plasticity at the CA3-CA1 synapse (Dawson et al., 1999; Ring et al., 2007). Animals lacking APP showed an impaired LTP, which went hand-in-hand with memory dysfunctions. In contrast, using similar stimulation protocols for synaptic strengthening, the same line of APP−/− mice did not show an LTP-defect at the EC-GC synapse in vivo (Jedlicka et al., 2012). This was a somewhat surprising result and we suggest—based on the data reported in this article—that differences in APP expression level between the two regions might contribute to the functional differences seen in our recordings.
How could different APP levels in neurons contribute to differences in synaptic function? Although the physiological role of APP is not yet fully understood several recent publications have suggested important functions for APP and its cleavage products at central synapses. With regard to full-length APP, it has been shown that it can act as a cell-adhesion molecule in trans, i.e., linking pre- and postsynapse, thus affecting the stability of synapses (Soba et al., 2005; Stahl et al., 2014). On the presynaptic side, APP regulates the abundance of synaptic vesicle proteins and may impact on synaptic transmission (Laßek et al., 2013, 2014, Laßek et al., 2016a,b; Fanutza et al., 2015). This presynaptic effect is in line with our own findings, which indicate that lack of APP causes presynaptic changes at the EC-GC (Jedlicka et al., 2012) as well as the CA3-CA1 synapses (Hick et al., 2015). On the postsynaptic side, sAPPα, which is generated from APP by α-secretase cleavage, appears to be required for synaptic strengthening. Experiments using sAPPα-binding antibodies and recombinant sAPPα (Turner et al., 2003; Taylor et al., 2008) as well as our own approaches using mouse genetics (Ring et al., 2007; Hick et al., 2015) revealed an essential function of this fragment in Hebbian-plasticity at both synapses. Most likely, the APP effect on synaptic plasticity is caused by an increased delivery of NMDAR to synapses (Cousins et al., 2009; Hoe et al., 2009), resulting in increased NMDAR currents (Taylor et al., 2008). In conclusion, APP and its cleavage products influence synaptic function at both pre- and postsynapse. It is thus highly likely that regional differences in APP levels could impact on the effect size experimenters can observe using APP-KO mice.
Unraveling and understanding the role of APP at central synapses is non-trivial and may ultimately require synapse-specific answers. In addition to the above discussed differences in APP levels, differences in APP processing and thus the abundance of specific fragments such as sAPPα between brain regions may also play an important role. Likewise, regional differences in the expression of APP-like proteins, i.e., APLP1 or APLP2, which can partially compensate for a loss of APP could affect the interpretation of loss-of-function experiments (von Koch et al., 1997; Heber et al., 2000; Weyer et al., 2011; Hick et al., 2015; Vnencak et al., 2015). Regardless of all these considerations, however, APP can only play a role in synaptic plasticity of a synapse if it is present. If not, other factors will predominate. Thus, we feel confident to conclude that APP plays a greater role for synaptic plasticity in area CA1 compared to the DG in mice. This finding, which implies that some effects of APP are region-specific, may be of relevance for future studies on APP and may also affect the design and analysis of APP-related animal models of AD.
Author Contributions
DDT, MHP, JS, and MH performed experiments. DDT and TD conceived the study. All authors were involved in data interpretation. DDT and TD wrote the manuscript with contributions from all other authors.
Funding
This research was funded by the Deutsche Forschungsgemeinschaft (DFG FOR 1332 to TD and UCM).
Conflict of Interest Statement
The authors declare that the research was conducted in the absence of any commercial or financial relationships that could be construed as a potential conflict of interest.
References
Andersen, C. L., Jensen, J. L., and Ørntoft, T. F. (2004). Normalization of real-time quantitative reverse transcription-PCR data: a model-based variance estimation approach to identify genes suited for normalization, applied to bladder and colon cancer data sets. Cancer Res. 64, 5245–5250. doi: 10.1158/0008-5472.can-04-0496
Anliker, B., and Müller, U. (2006). The functions of mammalian amyloid precursor protein and related amyloid precursor-like proteins. Neurodegener. Dis. 3, 239–246. doi: 10.1159/000095262
Aydin, D., Weyer, S. W., and Müller, U. C. (2012). Functions of the APP gene family in the nervous system: insights from mouse models. Exp. Brain Res. 217, 423–434. doi: 10.1007/s00221-011-2861-2
Braak, H., and Braak, E. (1991). Neuropathological stageing of Alzheimer-related changes. Acta Neuropathol. 82, 239–259. doi: 0.1007/bf00308809
Burbach, G. J., Dehn, D., Del Turco, D., and Deller, T. (2003). Quantification of layer-specific gene expression in the hippocampus: effective use of laser microdissection in combination with quantitative RT-PCR. J. Neurosci. Methods 131, 83–91. doi: 10.1016/s0165-0270(03)00232-2
Clarris, H. J., Key, B., Beyreuther, K., Masters, C. L., and Small, D. H. (1995). Expression of the amyloid protein precursor of Alzheimer’s disease in the developing rat olfactory system. Dev. Brain Res. 88, 87–95. doi: 10.1016/0165-3806(95)00083-p
Cousins, S. L., Hoey, S. E., Anne Stephenson, F., and Perkinton, M. S. (2009). Amyloid precursor protein 695 associates with assembled NR2A- and NR2B-containing NMDA receptors to result in the enhancement of their cell surface delivery. J. Neurochem. 111, 1501–1513. doi: 10.1111/j.1471-4159.2009.06424.x
Dawkins, E., and Small, D. H. (2014). Insights into the physiological function of the β-amyloid precursor protein: beyond Alzheimer’s disease. J. Neurochem. 129, 756–769. doi: 10.1111/jnc.12675
Dawson, G. R., Seabrook, G. R., Zheng, H., Smith, D. W., Graham, S., O’Dowd, G., et al. (1999). Age-related cognitive deficits, impaired long-term potentiation and reduction in synaptic marker density in mice lacking the β-amyloid precursor protein. Neuroscience 90, 1–13. doi: 10.1016/s0306-4522(98)00410-2
Del Turco, D., Schlaudraff, J., Bonin, M., and Deller, T. (2014). Upregulation of APP, ADAM10 and ADAM17 in the denervated mouse dentate gyrus. PLoS One 9:e84962. doi: 10.1371/journal.pone.0084962
Deller, T., Del Turco, D., Rappert, A., and Bechmann, I. (2007). Structural reorganization of the dentate gyrus following entorhinal denervation: species differences between rat and mouse. Prog. Brain Res. 163, 501–528. doi: 10.1016/s0079-6123(07)63027-1
Deller, T., and Frotscher, M. (1997). Lesion-induced plasticity of central neurons: sprouting of single fibres in the rat hippocampus after unilateral entorhinal cortex lesion. Prog. Neurobiol. 53, 687–727. doi: 10.1016/s0301-0082(97)00044-0
Deller, T., Haas, C. A., and Frotscher, M. (2000). Reorganization of the rat fascia dentata after a unilateral entorhinal cortex lesion. Role of the extracellular matrix. Ann. N Y Acad. Sci. 911, 207–220. doi: 10.1111/j.1749-6632.2000.tb06728.x
Endres, K., and Fahrenholz, F. (2012). Regulation of alpha-secretase ADAM10 expression and activity. Exp. Brain Res. 217, 343–352. doi: 10.1007/s00221-011-2885-7
Fahrenholz, F. (2007). Alpha-secretase as a therapeutic target. Curr. Alzheimer Res. 4, 412–417. doi: 10.2174/156720507781788837
Fanutza, T., Del Prete, D., Ford, M. J., Castillo, P. E., and D’Adamio, L. (2015). APP and APLP2 interact with the synaptic release machinery and facilitate transmitter release at hippocampal synapses. Elife 4:e09743. doi: 10.7554/eLife.09743
Fol, R., Braudeau, J., Ludewig, S., Abel, T., Weyer, S. W., Roederer, J. P., et al. (2016). Viral gene transfer of APPsα rescues synaptic failure in an Alzheimer’s disease mouse model. Acta Neuropathol. 131, 247–266. doi: 10.1007/s00401-015-1498-9
Forloni, G., Demicheli, F., Giorgi, S., Bendotti, C., and Angeretti, N. (1992). Expression of amyloid precursor protein mRNAs in endothelial, neuronal and glial cells: modulation by interleukin-1. Mol. Brain Res. 16, 128–134. doi: 10.1016/0169-328x(92)90202-m
Golde, T. E., Estus, S., Usiak, M., Younkin, L. H., and Younkin, S. G. (1990). Expression of β amyloid protein precursor mRNAs: recognition of a novel alternatively spliced form and quantitation in Alzheimer’s disease using PCR. Neuron 4, 253–267. doi: 10.1016/0896-6273(90)90100-t
Guo, Q., Li, H., Gaddam, S. S., Justice, N. J., Robertson, C. S., and Zheng, H. (2012). Amyloid precursor protein revisited: neuron-specific expression and highly stable nature of soluble derivatives. J. Biol. Chem. 287, 2437–2445. doi: 10.1074/jbc.M111.315051
Haass, C., Hung, A. Y., and Selkoe, D. J. (1991). Processing of beta-amyloid precursor protein in microglia and astrocytes favors an internal localization over constitutive secretion. J. Neurosci. 11, 3783–3793.
Heber, S., Herms, J., Gajic, V., Hainfellner, J., Aguzzi, A., Rülicke, T., et al. (2000). Mice with combined gene knock-outs reveal essential and partially redundant functions of amyloid precursor protein family members. J. Neurosci. 20, 7951–7963.
Hick, M., Herrmann, U., Weyer, S. W., Mallm, J.-P., Tschäpe, J.-A., Borgers, M., et al. (2015). Acute function of secreted amyloid precursor protein fragment APPsα in synaptic plasticity. Acta Neuropathol. 129, 21–37. doi: 10.1007/s00401-014-1368-x
Hoe, H.-S., Fu, Z., Makarova, A., Lee, J.-Y., Lu, C., Feng, L., et al. (2009). The effects of amyloid precursor protein on postsynaptic composition and activity. J. Biol. Chem. 284, 8495–8506. doi: 10.1074/jbc.m900141200
Itoh, T., Satou, T., Nishida, S., Tsubaki, M., Hashimoto, S., and Ito, H. (2009). Expression of amyloid precursor protein after rat traumatic brain injury. Neurol. Res. 31, 103–109. doi: 10.1179/016164108X323771
Izumi, R., Yamada, T., Yoshikai, S.-I., Sasaki, H., Hattori, M., and Sakaki, Y. (1992). Positive and negative regulatory elements for the expression of the Alzheimer’s disease amyloid precursor-encoding gene in mouse. Gene 112, 189–195. doi: 10.1016/0378-1119(92)90375-y
Jedlicka, P., Owen, M., Vnencak, M., Tschäpe, J. A., Hick, M., Müller, U. C., et al. (2012). Functional consequences of the lack of amyloid precursor protein in the mouse dentate gyrus in vivo. Exp. Brain Res. 217, 441–447. doi: 10.1007/s00221-011-2911-9
Kaden, D., Munter, L. M., Reif, B., and Multhaup, G. (2012). The amyloid precursor protein and its homologues: structural and functional aspects of native and pathogenic oligomerization. Eur. J. Cell Biol. 91, 234–239. doi: 10.1016/j.ejcb.2011.01.017
Kang, J., Lemaire, H.-G., Unterbeck, A., Salbaum, J. M., Masters, C. L., Grzeschik, K.-H., et al. (1987). The precursor of Alzheimer’s disease amyloid A4 protein resembles a cell-surface receptor. Nature 325, 733–736. doi: 10.1038/325733a0
Kang, J., and Müller-Hill, B. (1990). Differential splicing of Alzheimer’s disease amyloid A4 precursor RNA in rat tissues: PreA4695 mRNA is predominantly produced in rat and human brain. Biochem. Biophys. Res. Commun. 166, 1192–1200. doi: 10.1016/0006-291x(90)90992-v
Kögel, D., Deller, T., and Behl, C. (2012). Roles of amyloid precursor protein family members in neuroprotection, stress signaling and aging. Exp. Brain Res. 217, 471–479. doi: 10.1007/s00221-011-2932-4
Kuhn, P. H., Colombo, A. V., Schusser, B., Dreymueller, D., Wetzel, S., Schepers, U., et al. (2016). Systematic substrate identification indicates a central role for the metalloprotease ADAM10 in axon targeting and synapse function. Elife 5:e12748. doi: 10.7554/eLife.12748
Laßek, M., Weingarten, J., Acker-Palmer, A., Bajjalieh, S. M., Muller, U., and Volknandt, W. (2014). Amyloid precursor protein knockout diminishes synaptic vesicle proteins at the presynaptic active zone in mouse brain. Curr. Alzheimer Res. 11, 971–980. doi: 10.2174/1567205011666141107152458
Laßek, M., Weingarten, J., Einsfelder, U., Brendel, P., Müller, U., and Volknandt, W. (2013). Amyloid precursor proteins are constituents of the presynaptic active zone. J. Neurochem. 127, 48–56. doi: 10.1111/jnc.12358
Laßek, M., Weingarten, J., Wegner, M., Mueller, B. F., Rohmer, M., Baeumlisberger, D., et al. (2016a). APP is a context-sensitive regulator of the hippocampal presynaptic active zone. PLoS Comput. Biol. 12:e1004832. doi: 10.1371/journal.pcbi.1004832
Laßek, M., Weingarten, J., Wegner, M., and Volknandt, W. (2016b). The amyloid precursor protein-A novel player within the molecular array of presynaptic nanomachines. Front. Synaptic Neurosci. 7:21. doi: 10.3389/fnsyn.2015.00021
LeBlanc, A. C., Chen, H. Y., Autilio-Gambetti, L., and Gambetti, P. (1991). Differential APP gene expression in rat cerebral cortex, meninges and primary astroglial, microglial and neuronal cultures. FEBS Lett. 292, 171–178. doi: 10.1016/0014-5793(91)80861-v
Li, Z. W., Stark, G., Götz, J., Rülicke, T., Gschwind, M., Huber, G., et al. (1996). Generation of mice with a 200-kb amyloid precursor protein gene deletion by Cre recombinase-mediated site-specific recombination in embryonic stem cells. Proc. Natl. Acad. Sci. U S A 93, 6158–6162. doi: 10.1073/pnas.93.12.6158
Lynch, G., Gall, C., and Dunwiddie, T. V. (1978). Neuroplasticity in the hippocampal formation. Prog. Brain Res. 48, 113–130. doi: 10.1016/s0079-6123(08)61019-5
Mönning, U., Sandbrink, R., Weidemann, A., Banati, R. B., Masters, C. L., and Beyreuther, K. (1995). Extracellular matrix influences the biogenesis of amyloid precursor protein in microglial cells. J. Biol. Chem. 270, 7104–7110. doi: 10.1074/jbc.270.13.7104
Mortimer, J. A., van Duijn, C. M., Chandra, V., Fratiglioni, L., Graves, A. B., Heyman, A., et al. (1991). Head trauma as a risk factor for Alzheimer’s disease: a collaborative re-analysis of case-control studies. Int. J. Epidemiol. 20, S28–S35. doi: 10.1093/ije/20.supplement_2.s28
Müller, U. C., and Zheng, H. (2012). Physiological functions of APP family proteins. Cold Spring Harb Perspect. Med. 2:a006288. doi: 10.1101/cshperspect.a006288
Murakami, N., Yamaki, T., Iwamoto, Y., Sakakibara, T., Kobori, N., Fushiki, S., et al. (1998). Experimental brain injury induces expression of amyloid precursor protein, which may be related to neuronal loss in the hippocampus. J. Neurotrauma 15, 993–1003. doi: 10.1089/neu.1998.15.993
Postina, R., Schroeder, A., Dewachter, I., Bohl, J., Schmitt, U., Kojro, E., et al. (2004). A disintegrin-metalloproteinase prevents amyloid plaque formation and hippocampal defects in an Alzheimer disease mouse model. J Clin. Invest. 113, 1456–1464. doi: 10.1172/jci200420864e1
Prinzen, C., Trumbach, D., Wurst, W., Endres, K., Postina, R., and Fahrenholz, F. (2009). Differential gene expression in ADAM10 and mutant ADAM10 transgenic mice. BMC Genomics 10:66. doi: 10.1186/1471-2164-10-66
Ring, S., Weyer, S. W., Kilian, S. B., Waldron, E., Pietrzik, C. U., Filippov, M. A., et al. (2007). The secreted β-amyloid precursor protein ectodomain APPs alpha is sufficient to rescue the anatomical, behavioral and electrophysiological abnormalities of APP-deficient mice. J. Neurosci. 27, 7817–7826. doi: 10.1523/jneurosci.1026-07.2007
Rohan de Silva, H. A., Jen, A., Wickenden, C., Jen, L.-S., Wilkinson, S. L., and Patel, A. J. (1997). Cell-specific expression of β-amyloid precursor protein isoform mRNAs and proteins in neurons and astrocytes. Mol. Brain Res. 47, 147–156. doi: 10.1016/s0169-328x(97)00045-4
Saftig, P., and Reiss, K. (2011). The “A Disintegrin And Metalloproteases” ADAM10 and ADAM17: novel drug targets with therapeutic potential? Eur. J. Cell Biol. 90, 527–535. doi: 10.1016/j.ejcb.2010.11.005
Schonrock, N., Matamales, M., Ittner, L. M., and Götz, J. (2012). MicroRNA networks surrounding APP and amyloid-β metabolism–implications for Alzheimer’s disease. Exp. Neurol. 235, 447–454. doi: 10.1016/j.expneurol.2011.11.013
Selkoe, D. J., and Hardy, J. (2016). The amyloid hypothesis of Alzheimer’s disease at 25 years. EMBO Mol. Med. 8, 595–608. doi: 10.15252/emmm.201606210
Sisodia, S. S., Koo, E. H., Hoffman, P. N., Perry, G., and Price, D. L. (1993). Identification and transport of full-length amyloid precursor proteins in rat peripheral nervous system. J. Neurosci. 13, 3136–3142.
Slunt, H. H., Thinakaran, G., Von Koch, C., Lo, A. C., Tanzi, R. E., and Sisodia, S. S. (1994). Expression of a ubiquitous, cross-reactive homologue of the mouse β-amyloid precursor protein (APP). J. Biol. Chem. 269, 2637–2644.
Soba, P., Eggert, S., Wagner, K., Zentgraf, H., Siehl, K., Kreger, S., et al. (2005). Homo- and heterodimerization of APP family members promotes intercellular adhesion. EMBO J. 24, 3624–3634. doi: 10.1038/sj.emboj.7600824
Stahl, R., Schilling, S., Soba, P., Rupp, C., Hartmann, T., Wagner, K., et al. (2014). Shedding of APP limits its synaptogenic activity and cell adhesion properties. Front. Cell. Neurosci. 8:410. doi: 10.3389/fncel.2014.00410
Steward, O. (1994). “Reorganization of neuronal circuitry following central nervous system trauma: naturally occurring processes and opportunities for therapeutic intervention,” in Neurobiology of Central Nervous System Trauma, eds S. Salzman and A. Faden (New York, NY: Oxford University Press), 266–287.
Sun, X., Bromley-Brits, K., and Song, W. (2012). Regulation of β-site APP-cleaving enzyme 1 gene expression and its role in Alzheimer’s disease. J Neurochem. 120, 62–70. doi: 10.1111/j.1471-4159.2011.07515.x
Szczygielski, J., Mautes, A., Steudel, W. I., Falkai, P., Bayer, T. A., and Wirths, O. (2005). Traumatic brain injury: cause or risk of Alzheimer’s disease? A review of experimental studies. J. Neural Transm. (Vienna) 112, 1547–1564. doi: 10.1007/s00702-005-0326-0
Tanzi, R. E., McClatchey, A. I., Lamperti, E. D., Villa-Komaroff, L., Gusella, J. F., and Neve, R. L. (1988). Protease inhibitor domain encoded by an amyloid protein precursor mRNA associated with Alzheimer’s disease. Nature 331, 528–530. doi: 10.1038/331528a0
Taylor, C. J., Ireland, D. R., Ballagh, I., Bourne, K., Marechal, N. M., Turner, P. R., et al. (2008). Endogenous secreted amyloid precursor protein-alpha regulates hippocampal NMDA receptor function, long-term potentiation and spatial memory. Neurobiol. Dis. 31, 250–260. doi: 10.1016/j.nbd.2008.04.011
Tuomi, J. M., Voorbraak, F., Jones, D. L., and Ruijter, J. M. (2010). Bias in the Cq value observed with hydrolysis probe based quantitative PCR can be corrected with the estimated PCR efficiency value. Methods 50, 313–322. doi: 10.1016/j.ymeth.2010.02.003
Turner, P. R., O’Connor, K., Tate, W. P., and Abraham, W. C. (2003). Roles of amyloid precursor protein and its fragments in regulating neural activity, plasticity and memory. Prog. Neurobiol. 70, 1–32. doi: 10.1016/s0301-0082(03)00089-3
Van Den Heuvel, C., Blumbergs, P. C., Finnie, J. W., Manavis, J., Jones, N. R., Reilly, P. L., et al. (1999). Upregulation of amyloid precursor protein messenger RNA in response to traumatic brain injury: an ovine head impact model. Exp. Neurol. 159, 441–450. doi: 10.1006/exnr.1999.7150
Van Den Heuvel, C., Thornton, E., and Vink, R. (2007). Traumatic brain injury and Alzheimer’s disease: a review. Prog. Brain Res. 161, 303–316. doi: 10.1016/S0079-6123(06)61021-2
Vandesompele, J., De Preter, K., Pattyn, F., Poppe, B., Van Roy, N., De Paepe, A., et al. (2002). Accurate normalization of real-time quantitative RT-PCR data by geometric averaging of multiple internal control genes. Genome Biol. 3:RESEARCH0034. doi: 10.1186/gb-2002-3-7-research0034
Vassar, R., Kuhn, P. H., Haass, C., Kennedy, M. E., Rajendran, L., Wong, P. C., et al. (2014). Function, therapeutic potential and cell biology of BACE proteases: current status and future prospects. J. Neurochem. 130, 4–28. doi: 10.1111/jnc.12715
Vincent, B. (2016). Regulation of the alpha-secretase ADAM10 at transcriptional, translational and post-translational levels. Brain Res. Bull. 126, 154–169. doi: 10.1016/j.brainresbull.2016.03.020
Vnencak, M., Paul, M. H., Hick, M., Schwarzacher, S. W., Del Turco, D., Müller, U. C., et al. (2015). Deletion of the amyloid precursor-like protein 1 (APLP1) enhances excitatory synaptic transmission, reduces network inhibition but does not impair synaptic plasticity in the mouse dentate gyrus. J. Comp. Neurol. 523, 1717–1729. doi: 10.1002/cne.23766
von Koch, C. S., Zheng, H., Chen, H., Trumbauer, M., Thinakaran, G., van der Ploeg, L. H. T., et al. (1997). Generation of APLP2 KO mice and early postnatal lethality in APLP2/APP double KO mice. Neurobiol. Aging 18, 661–669. doi: 10.1016/s0197-4580(97)00151-6
Wang, B., Wang, Z., Sun, L., Yang, L., Li, H., Cole, A. L., et al. (2014). The amyloid precursor protein controls adult hippocampal neurogenesis through GABAergic interneurons. J. Neurosci. 34, 13314–13325. doi: 10.1523/JNEUROSCI.2848-14.2014
Weyer, S. W., Klevanski, M., Delekate, A., Voikar, V., Aydin, D., Hick, M., et al. (2011). APP and APLP2 are essential at PNS and CNS synapses for transmission, spatial learning and LTP. EMBO J. 30, 2266–2280. doi: 10.1038/emboj.2011.119
Yang, P., Baker, K. A., and Hagg, T. (2006). The ADAMs family: coordinators of nervous system development, plasticity and repair. Prog. Neurobiol. 79, 73–94. doi: 10.1016/j.pneurobio.2006.05.001
Zhang, H., Ma, Q., Zhang, Y. W., and Xu, H. (2012). Proteolytic processing of Alzheimer’s β-amyloid precursor protein. J. Neurochem. 120, 9–21. doi: 10.1111/j.1471-4159.2011.07519.x
Keywords: APP, dentate gyrus, CA1, immunostaining, western blotting, laser microdissection, in situ hybridization, RT-qPCR
Citation: Del Turco D, Paul MH, Schlaudraff J, Hick M, Endres K, Müller UC and Deller T (2016) Region-Specific Differences in Amyloid Precursor Protein Expression in the Mouse Hippocampus. Front. Mol. Neurosci. 9:134. doi: 10.3389/fnmol.2016.00134
Received: 04 August 2016; Accepted: 15 November 2016;
Published: 29 November 2016.
Edited by:
Nicola Maggio, The Chaim Sheba Medical Center, IsraelReviewed by:
Alessandro Vercelli, University of Turin, ItalyMichael R. Kreutz, Leibniz-Institute for Neurobiology, Germany
Copyright © 2016 Del Turco, Paul, Schlaudraff, Hick, Endres, Müller and Deller. This is an open-access article distributed under the terms of the Creative Commons Attribution License (CC BY). The use, distribution and reproduction in other forums is permitted, provided the original author(s) or licensor are credited and that the original publication in this journal is cited, in accordance with accepted academic practice. No use, distribution or reproduction is permitted which does not comply with these terms.
*Correspondence: Domenico Del Turco, ZGVsdHVyY29AZW0udW5pLWZyYW5rZnVydC5kZQ==