Abstract
Accumulating evidence suggests that the epigenetic alterations induced by antipsychotics contribute to the therapeutic efficacy. However, global and site-specific epigenetic changes by antipsychotics and those shared by different classes of antipsychotics remain poorly understood. We conducted a comprehensive DNA methylation analysis of human neuroblastoma cells cultured with antipsychotics. The cells were cultured with low and high concentrations of haloperidol or risperidone for 8 days. DNA methylation assay was performed with the Illumina HumanMethylation450 BeadChip. We found that both haloperidol and risperidone tended to cause hypermethylation changes and showed similar DNA methylation changes closely related to neuronal functions. A total of 294 differentially methylated probes (DMPs), including 197 hypermethylated and 97 hypomethylated DMPs, were identified with both haloperidol and risperidone treatment. Gene ontology analysis of the hypermethylated probe-associated genes showed enrichment of genes related to the regulation of neurotransmitter receptor activity and lipoprotein lipase activity. Pathway analysis identified that among the DMP-associated genes, SHANK1 and SHANK2 were the major genes in the neuropsychiatric disorder-related pathways. Our data would be valuable for understanding the mechanisms of action of antipsychotics from an epigenetic viewpoint.
Introduction
Schizophrenia is a major psychiatric disorder characterized by positive and negative symptoms as well as cognitive impairments. Schizophrenia affects approximately 1% of the population and has become a worldwide public health concern with a considerable financial burden on individuals, families and society (Insel, 2010). Although genetic factors are involved in the etiology of schizophrenia, genes with large effect sizes have not been identified. In addition to the complex gene–environment interactions, recent genetic studies suggest that multiple genetic factors with small effect sizes are involved in its etiology (Purcell et al., 2009, 2014; Schizophrenia Working Group of the Psychiatric Genomics Consortium, 2014).
Epigenetics is the study of heritable and stable changes in gene expression that are not caused by changes in DNA sequences, and it involves DNA methylation and histone modifications as the major molecular mechanisms (Bird, 2002). Altered epigenetic status has been proposed to be involved in the pathophysiology of major psychiatric disorders, including schizophrenia (Nishioka et al., 2012; Nestler et al., 2016; Richetto and Meyer, 2020; Bundo et al., 2021; Ueda et al., 2021).
In addition, accumulating evidence also suggests that antipsychotics affect epigenetic status in the brain (Kurita et al., 2013; Swathy and Banerjee, 2017; de la Fuente Revenga et al., 2019). However, previous studies have mainly examined their effects on histone modification activities, and the global and site-specific effects of antipsychotics on DNA methylation are poorly understood.
We previously performed comprehensive DNA methylation analyses of the antipsychotics blonanserin and perospirone using human neuroblastoma cells (Murata et al., 2014, 2019). Blonanserin and perospirone are classified as atypical antipsychotics that block both dopaminergic and serotonergic signaling pathways. Both antipsychotics generally increase the DNA methylation levels of CpG sites far from the promoter regions in a dose-dependent manner and affect the epigenetic status of their pharmacological targets, such as dopamine receptor 2 (DRD2) and serotonin receptor 2A (HTR2A).
To further understand the epigenetic effects of antipsychotics, we conducted a comprehensive DNA methylation analysis of haloperidol, a typical antipsychotic, and risperidone, an atypical antipsychotic, using the same cell culture model with a HumanMethylation450 BeadChip.
Materials and Methods
Cell Culture
Human neuroblastoma SK-N-SH cells (American Type Culture Collection, Manassas, VA, United States) were cultured as previously described (Asai et al., 2013; Sugawara et al., 2015). In brief, the cells were cultured with Eagle’s minimal essential medium with 10% fetal bovine serum (FBS) containing antipsychotics for 8 days. In this study, we used low and high concentrations of haloperidol (1 and 10 μM; Sigma-Aldrich, St Louis, MO, United States) and risperidone (3 and 30 μM; Sigma-Aldrich) based on their effective blood concentrations. The antipsychotics were dissolved in dimethyl sulfoxide (DMSO). Final concentrations of DMSO were 0.001–0.06%, depending on the dose of antipsychotics. The cells were cultured with or without 0.06% of DMSO for 8 days as a control. Three independent samples were prepared for each experimental group (n = 18 in total).
DNA Methylation Assay
From each sample, genomic DNA was extracted via standard phenol:chloroform methods. The DNA samples were subjected to bisulfite modification by the EZ DNA Methylation Kit D500 (Zymo Research, Irvine, CA, United States). A comprehensive DNA methylation assay was performed with the HumanMethylation450 BeadChip (Illumina, Inc., San Diego, CA, United States) according to the manufacturer’s instructions. The DNA methylation level of each probe was represented by a β value. It was calculated according to the ratio of intensities between methylated and unmethylated alleles, as in the following formula: β value = methylated intensity/(methylated intensity + unmethylated intensity + 100).
Data Analysis
Among the 485,512 probes on the chip, we excluded unreliable probes whose detection p values ≥0.01 in at least one experimental sample. The remaining data were analyzed using ChAMP (Tian et al., 2017) and minfi (Aryee et al., 2014) packages in R software (version 4.0.2).1 Probes for CpG sites on the sex chromosomes or associated with single nucleotide polymorphisms and those for non-CpG sites were removed, resulting in 411,750 probes for further analysis. Data analysis including annotation was based on the HumanMethylation450 v1.2 Manifest provided from the manufacture (Illumina). Principal component analysis (PCA) was performed using the FactoMineR (Lê et al., 2008) and factoextra2 packages in R. Unsupervised hierarchical clustering was performed on probes using the Euclidean distance metric and complete linkage methods using the stats package1. Heatmap visualizations were created using pheatmap (Kolde, 2019). Probes that showed Benjamini-Hochberg (BH) adjusted P-value <0.05 in moderated t test in ChAMP and that absolute difference in β value (|Δβ|) ≥ 0.1 were considered to have significant methylation alterations. Gene Ontology (GO) term enrichment analysis and visualization were performed using Cytoscape v3.6.1 (Shannon et al., 2003) and the ClueGO plugin v2.5.7 (Bindea et al., 2009) with a two-sided hypergeometric test, Bonferroni step-down corrected p-value cutoff = 0.05, medium specificity, and a Kappa score of >0.4. The Venn diagram was created using the Draw Venn Diagram tool.3
Results
Cluster Analysis and Principal Component Analysis
We cultured human neuroblastoma SK-N-SH cells with two doses of haloperidol or risperidone for 8 days. Doses were determined based on their minimum and maximum effective blood concentrations. After culture, we obtained DNA methylation profiles with the Illumina HumanMethylation450K BeadChip. After removing the unreliable probes, we obtained 411,750 probes for data analysis. Unsupervised hierarchical clustering of all β values, which are proxies of DNA methylation levels, showed that the antipsychotic groups and the two control groups, including the no treatment (NT) and DMSO group, were separated (Figure 1A). PCA also revealed the separation of the antipsychotic and control groups (Figure 1B). We examined the correlation of β values between the NT and DMSO groups and found a strong correlation (R = 0.999, Supplementary Figure 1). Based on this result, we concluded that DMSO has a negligible effect on the DNA methylation status of cell culture in our study. We compared the β values of the antipsychotic groups with that of the DMSO group and defined differentially methylated probes (DMPs) as probes showing a BH-adjusted P-value below 0.05 in the moderated t test in ChAMP (Tian et al., 2017) and an absolute β value difference ≥0.1. We first examined the genomic distribution and direction of changes of DMPs in each dose of antipsychotics and then examined the characteristics of DMPs between two doses. Finally, we examined the characteristics of common DMPs between the two antipsychotics.
FIGURE 1
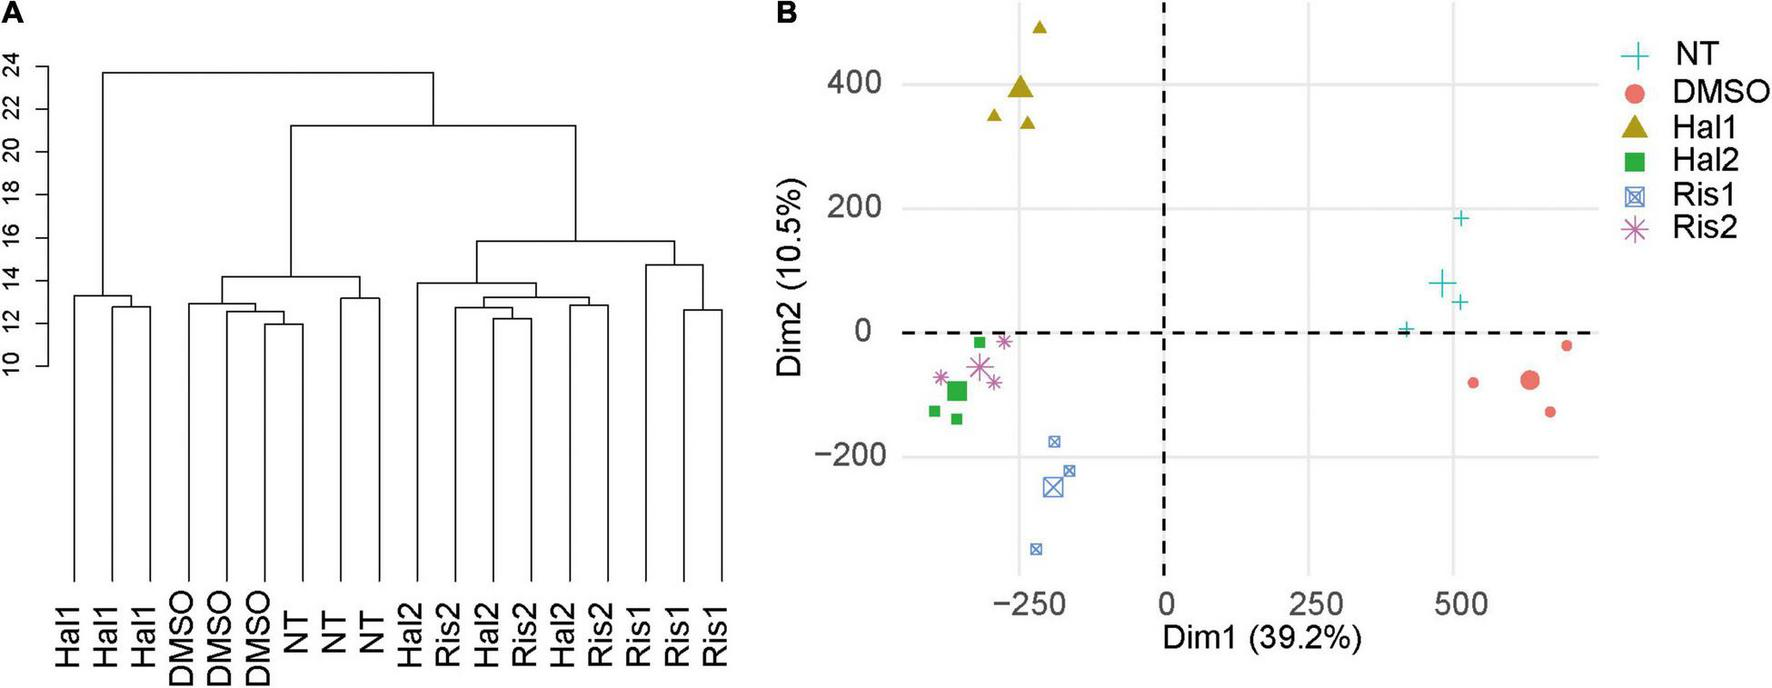
Cluster analysis and PCA. (A) Unsupervised hierarchical cluster analysis of all samples. Scale indicates Euclidean distance. (B) PCA of all samples. The large symbol indicates the average value of three experiments. NT, no treatment control group; DMSO, dimethyl sulfoxide control group; Hal1, high dose haloperidol group; Hal2, low dose haloperidol group; Ris1: high dose risperidone group, Ris2: low dose risperidone group. PCA, principal component analysis.
Comprehensive DNA Methylation Analysis of Haloperidol
We identified 3,028 and 1,320 DMPs in the high and low concentration groups for haloperidol, respectively. The average β values of DMPs in the high-dose group was significantly increased compared to those in the control group (Table 1). Probes located much farther from the promoter regions showed significant increases in β values, including the 5′-UTR, gene body and intergenic regions. In the low-dose group, although there was no significant alteration in the β value among all DMPs, DMPs in the gene body showed a significant increase similar to the high-dose group (Table 1). Concordantly, 72% of DMPs showed an increase in the DNA methylation level in the high-dose group, and this rate was only 55% in the low-dose group (Supplementary Figure 2). However, 76 and 69% of DMPs showed increased methylation in the high- and low-dose groups, respectively, when looking at the gene body. With regard to the context of CpG islands, hypermethylated probes were enriched in the shelves and open seas at both doses (Table 1 and Supplementary Figure 2).
TABLE 1
| Dose | Context | # of probes | β value (haloperidol)* | β value (control)* | P value |
| High | All DMPs | 3028 | 0.520 ± 0.189 | 0.468 ± 0.169 | 2.20E-16 |
| Gene body | 1148 (38%) | 0.549 ± 0.173 | 0.486 ± 0.168 | 2.20E-16 | |
| TSS1500 | 273 (9%) | 0.479 ± 0.215 | 0.469 ± 0.172 | ns | |
| TSS200 | 113 (4%) | 0.429 ± 0.248 | 0.426 ± 0.184 | ns | |
| 5′UTR | 218 (7%) | 0.481 ± 0.192 | 0.441 ± 0.171 | 0.02244 | |
| 3′UTR | 105 (3%) | 0.565 ± 0.193 | 0.529 ± 0.193 | ns | |
| 1st exon | 54 (2%) | 0.359 ± 0.238 | 0.381 ± 0.173 | ns | |
| Intergenic region | 1117 (37%) | 0.521 ± 0.176 | 0.457 ± 0.159 | 2.20E-16 | |
| CpG island | 300 (10%) | 0.432 ± 0.294 | 0.444 ± 0.204 | ns | |
| CpG island shore | 488 (16%) | 0.5111 ± 0.215 | 0.478 ± 0.172 | 0.009 | |
| CpG island shelves | 316 (10%) | 0.556 ± 0.175 | 0.495 ± 0.175 | 1.65E-05 | |
| Open sea | 1924 (64%) | 0.531 ± 0.156 | 0.465 ± 0.160 | 2.20E-16 | |
| Low | All DMPs | 1320 | 0.511 ± 0.340 | 0.497 ± 0.240 | ns |
| Gene body | 431 (33%) | 0.633 ± 0.302 | 0.580 ± 0.222 | 0.00395 | |
| TSS1500 | 183 (14%) | 0.379 ± 0.332 | 0.406 ± 0.229 | ns | |
| TSS200 | 111 (8%) | 0.277 ± 0.296 | 0.330 ± 0.196 | ns | |
| 5′UTR | 85 (6%) | 0.401 ± 0.341 | 0.433 ± 0.252 | ns | |
| 3′UTR | 48 (4%) | 0.666 ± 0.278 | 0.607 ± 0.213 | ns | |
| 1st exon | 45 (3%) | 0.247 ± 0.289 | 0.328 ± 0.208 | ns | |
| Intergenic region | 417 (32%) | 0.537 ± 0.330 | 0.512 ± 0.229 | ns | |
| CpG island | 379 (29%) | 0.346 ± 0.335 | 0.380 ± 0.228 | ns | |
| CpG island shore | 316 (24%) | 0.478 ± 0.338 | 0.470 ± 0.236 | ns | |
| CpG island shelves | 130 (10%) | 0.685 ± 0.269 | 0.626 ± 0.197 | 0.0441 | |
| Open sea | 495 (38%) | 0.612 ± 0.303 | 0.569 ± 0.219 | 0.0124 |
Average β values of DMPs in the haloperidol treatment group according to the genomic positions.
*Average ± SD. TSS1500 and TSS200 mean the regions 1,500 and 200 bp upstream, respectively, of the transcription start site. CpG island shore indicates the region 2 kb away from the CpG island. CpG island shelf indicates the region 2 kb away from the CpG island shore. Open sea indicates the inter-CpG island region. DMP, differentially methylated probe; UTR, untranslated region; ns, not significant.
We then identified 616 DMPs (386 hypermethylated and 230 hypomethylated DMPs) shared by both haloperidol dose groups (Supplementary Table 1). None showed inverse changes between the two doses. GO analysis of the hypermethylated DMP-associated genes showed that the genes were mostly enriched in the transmembrane transporter complex- and ion channel-related GO terms (Supplementary Table 2). Interestingly, GO terms such as NMDA selective glutamate receptor complex, social behavior, memory and learning were also listed. On the other hand, the hypomethylated CpG-associated genes were enriched in GO terms such as nephric duct formation, respiratory system development, and lung development (Supplementary Table 3).
Comprehensive DNA Methylation Analysis of Risperidone
We identified 476 and 1,025 DMPs in the high- and low-dose risperidone groups, respectively. Similar to haloperidol, DMPs in both risperidone groups showed hypermethylation and were mainly located much farther from the promoter regions, including the gene body, 3′ UTR, and intergenic region (Table 2). In total, over 60% of DMPs showed an increase in DNA methylation level, and the rate was increased to approximately 80% or more in the gene body and 3′-UTR at both doses (Supplementary Figure 2). In the context of CpG islands, significant differences were found in the open seas, and hypermethylated probes were enriched in the shelves and open seas at both doses (Table 2 and Supplementary Figure 2).
TABLE 2
| Dose | Context | # of probes | β value (risperidone)* | β value (control)* | P value |
| High | All DMPs | 476 (100%) | 0.558 ± 0.317 | 0.518 ± 0.224 | 0.0221 |
| Gene body | 157 (33%) | 0.674 ± 0.266 | 0.593 ± 0.195 | 0.002389 | |
| TSS1500 | 62 (13%) | 0.438 ± 0.333 | 0.429 ± 0.228 | ns | |
| TSS200 | 40 (8%) | 0.387 ± 0.323 | 0.385 ± 0.221 | ns | |
| 5′UTR | 25 (5%) | 0.541 ± 0.324 | 0.525 ± 0.229 | ns | |
| 3′UTR | 15 (3%) | 0.750 ± 0.118 | 0.621 ± 0.111 | 0.004727 | |
| 1st exon | 16 (3%) | 0.252 ± 0.260 | 0.314 ± 0.166 | ns | |
| Intergenic region | 161 (34%) | 0.549 ± 0.317 | 0.519 ± 0.225 | ns | |
| CpG island | 130 (27%) | 0.430 ± 0.340 | 0.425 ± 0.225 | ns | |
| CpG island shore | 116 (24%) | 0.520 ± 0.324 | 0.480 ± 0.228 | ns | |
| CpG island shelves | 41 (9%) | 0.673 ± 0.273 | 0.619 ± 0.199 | ns | |
| Open sea | 189 (40%) | 0.646 ± 0.269 | 0.582 ± 0.197 | 0.009143 | |
| Low | All DMPs | 1025 (100%) | 0.538 ± 0.329 | 0.508 ± 0.228 | 0.016 |
| Gene body | 330 (32%) | 0.673 ± 0.269 | 0.599 ± 0.195 | 5.95E-05 | |
| TSS1500 | 129 (13%) | 0.387 ± 0.326 | 0.411 ± 0.221 | ns | |
| TSS200 | 82 (8%) | 0.320 ± 0.320 | 0.360 ± 0.214 | ns | |
| 5′UTR | 68 (7%) | 0.408 ± 0.331 | 0.417 ± 0.225 | ns | |
| 3′UTR | 32 (3%) | 0.718 ± 0.242 | 0.623 ± 0.177 | ns | |
| 1st exon | 42 (4%) | 0.227 ± 0.258 | 0.312 ± 0.175 | ns | |
| Intergenic region | 342 (33%) | 0.564 ± 0.318 | 0.522 ± 0.222 | 0.04743 | |
| CpG island | 292 (28%) | 0.362 ± 0.330 | 0.389 ± 0.217 | ns | |
| CpG island shore | 232 (23%) | 0.504 ± 0.332 | 0.479 ± 0.229 | ns | |
| CpG island shelves | 107 (10%) | 0.719 ± 0.245 | 0.639 ± 0.180 | 0.007554 | |
| Open sea | 394 (38%) | 0.639 ± 0.281 | 0.577 ± 0.202 | 0.0004007 |
Average β values of DMPs in the risperidone treatment group according to the genomic positions.
*Average ± SD. TSS1500 and TSS200 mean the regions 1,500 and 200 bp upstream, respectively, of the transcription start site. CpG island shore indicates the region 2 kb away from the CpG island. CpG island shelf indicates the region 2 kb away from the CpG island shore. Open sea indicates the inter-CpG island region. DMP, differentially methylated probe; UTR, untranslated region; ns, not significant.
We identified 377 DMPs shared by both doses of risperidone, which consisted of 254 hypermethylated and 123 hypomethylated DMPs (Supplementary Table 1). GO analysis of the hypermethylated DMP-associated genes showed enrichment in the regulation of neurotransmitter receptor activity, lipoprotein lipase activity, and ionotropic glutamate receptor complex (Supplementary Table 4). GO analysis of hypomethylated DMP-associated genes showed enrichment in dorsal/ventral pattern formation and odontogenesis of the dentin-containing tooth (Supplementary Table 5).
Common Differentially Methylated Probes Between Haloperidol and Risperidone
We then examined the common DMPs shared by haloperidol and risperidone. There were 294 common DMPs, consisting of 197 hypermethylated and 97 hypomethylated DMPs (Figure 2 and Supplementary Table 1). All DMPs showed DNA methylation changes in the same direction and were associated with a total of 189 genes. We listed the 13 DMPs showing robust DNA methylation changes (|Δβ| > 0.2) as representative (Table 3). GO analysis of the hypermethylated DMP-associated genes showed that genes related to the regulation of neurotransmitter receptor activity and lipoprotein lipase activity were enriched (Table 4). Interestingly, most of the neuronal function-related terms include SHANK1 and SHANK2 (Figure 3). In contrast, we did not find significant enrichment of GO terms in the hypomethylated DMP-associated genes.
FIGURE 2
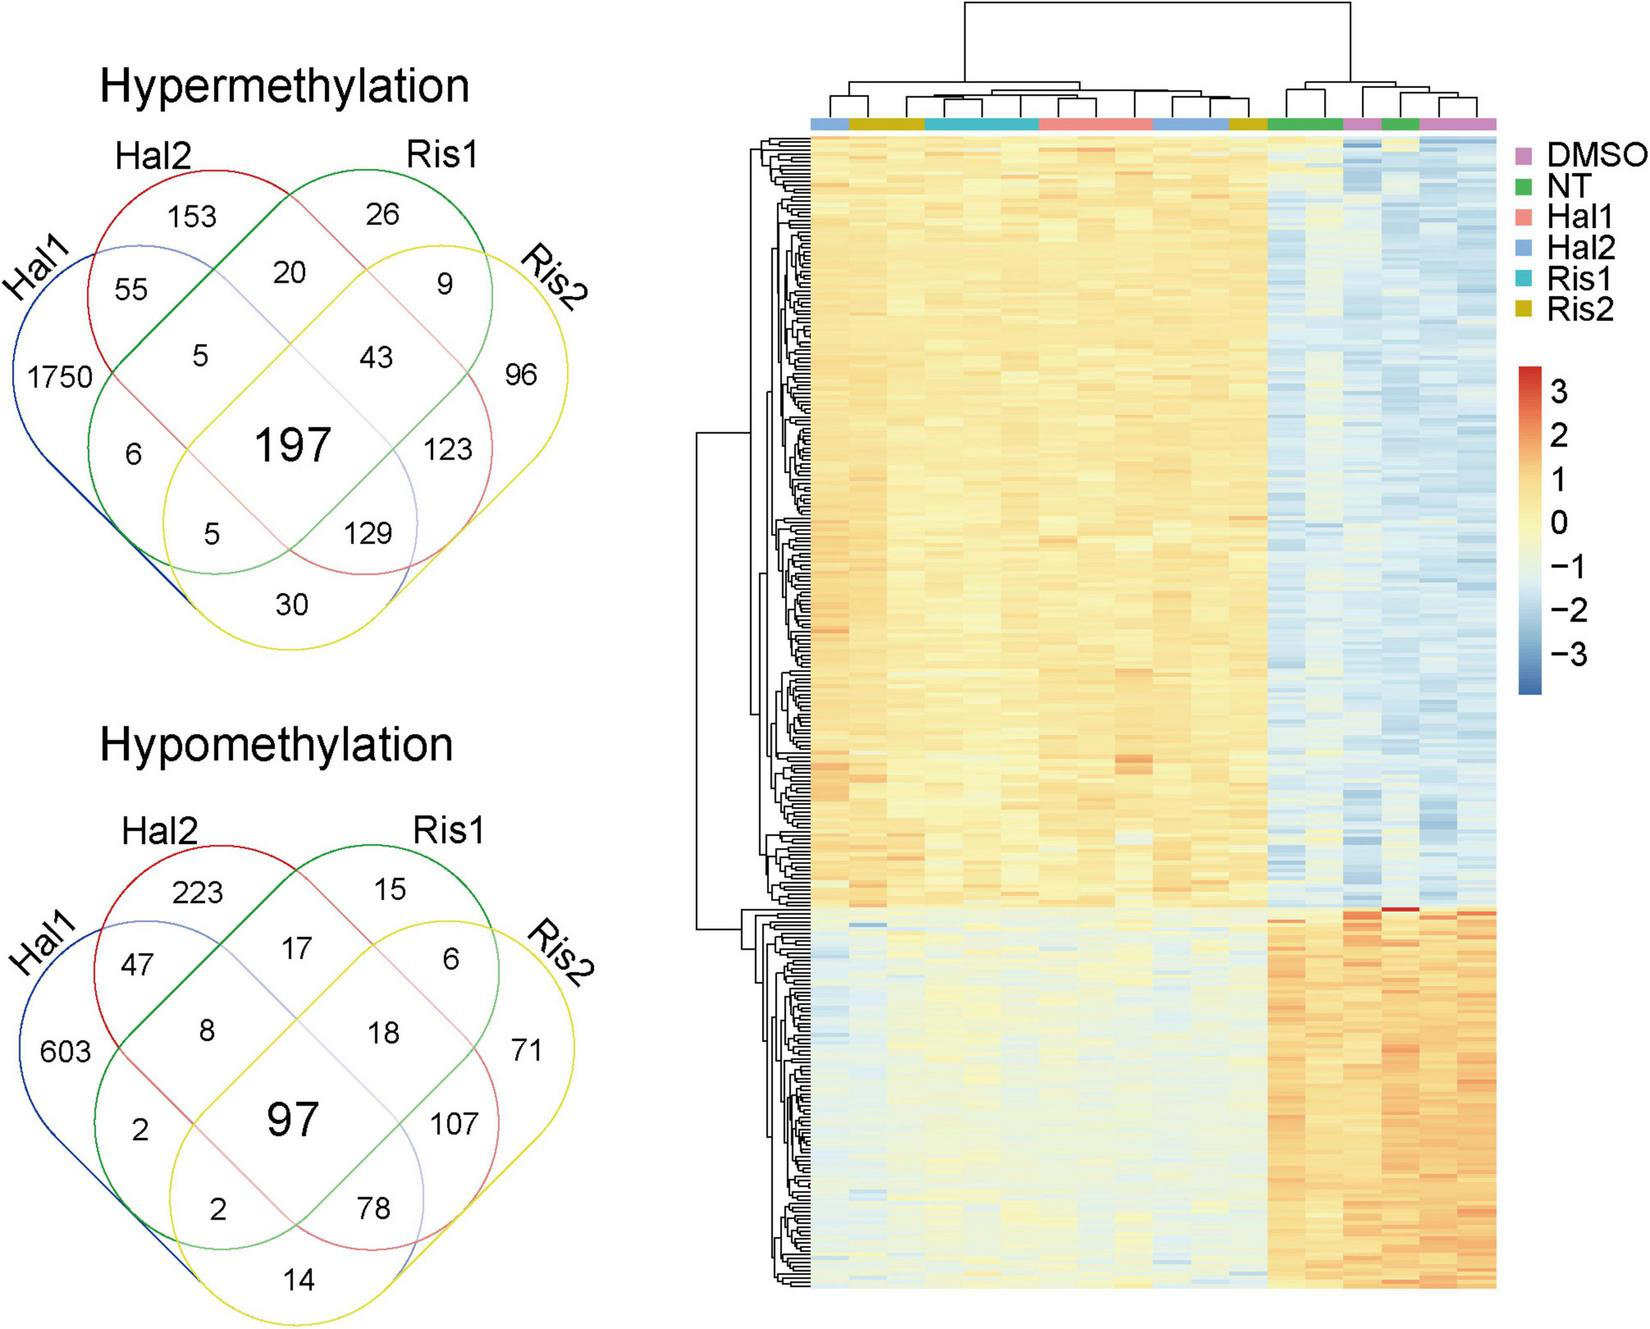
Venn diagram and cluster analysis of common DMPs. Left, Venn diagram of common DMPs between haloperidol and risperidone. Right, Two-way clustering of the 294 common DMPs. Data was centered mean to zero and scaled by dividing with standard deviations. DMP, differentially methylated probe.
TABLE 3
| Probe | Gene | Genomic context | CpG island | Hal1 | Hal2 | Ris1 | Ris2 | ||||
|
|
|
|
|
||||||||
| Δβ | P | Δβ | P | Δβ | P | Δβ | P | ||||
| cg17030628 | IL20 | TSS200 | Open sea | 0.92 | 2.48E-12 | 0.93 | 7.61E-11 | 0.94 | 1.59E-12 | 0.91 | 1.32E-11 |
| cg14333542 | Intergenic region | Open sea | −0.79 | 9.61E-11 | −0.82 | 3.73E-11 | −0.82 | 7.05E-11 | −0.81 | 6.76E-11 | |
| cg04124606 | Intergenic region | Open sea | −0.48 | 5.32E-10 | −0.48 | 5.96E-10 | −0.48 | 5.48E-10 | −0.48 | 5.37E-10 | |
| cg19605788 | CNTD2 | Gene body | CpG island | 0.37 | 1.83E-09 | 0.36 | 2.39E-09 | 0.37 | 1.89E-09 | 0.37 | 1.89E-09 |
| cg20168823 | BRUNOL4 | Gene body | CpG island | 0.36 | 2.98E-09 | 0.36 | 2.15E-09 | 0.36 | 1.96E-09 | 0.36 | 2.85E-09 |
| cg17301379 | Intergenic region | CpG island | 0.40 | 1.42E-08 | 0.39 | 9.24E-09 | 0.40 | 7.84E-09 | 0.40 | 1.59E-08 | |
| cg21093807 | C3orf63 | TSS1500 | CpG island | 0.27 | 7.66E-08 | 0.28 | 4.57E-07 | 0.26 | 1.09E-06 | 0.26 | 2.16E-07 |
| cg08052546 | Intergenic region | CpG island shore | 0.27 | 1.03E-07 | 0.22 | 5.31E-07 | 0.24 | 1.62E-07 | 0.23 | 1.34E-07 | |
| cg05545910 | TTLL1 | Gene body | Open sea | 0.28 | 3.17E-06 | 0.31 | 1.05E-07 | 0.27 | 4.24E-08 | 0.29 | 5.11E-05 |
| cg10442913 | ATP1A1 | TSS1500 | CpG island | 0.22 | 7.87E-06 | 0.23 | 7.65E-06 | 0.24 | 6.21E-06 | 0.22 | 7.89E-06 |
| cg07369507 | ZNF323 | TSS1500 | Open sea | −0.27 | 3.76E-05 | −0.31 | 2.55E-05 | −0.24 | 3.80E-06 | −0.29 | 1.71E-07 |
| cg21581312 | LOC723972 | TSS200 | Open sea | 0.31 | 6.19E-05 | 0.41 | 2.33E-05 | 0.32 | 3.58E-06 | 0.34 | 5.52E-06 |
| cg11057824 | C14orf182 | Gene body | CpG island shore | 0.23 | 0.000282 | 0.27 | 1.04E-05 | 0.25 | 2.12E-05 | 0.29 | 6.04E-06 |
Common DMPs showing robust DNA methylation changes.
Hal1, high dose haloperidol group; Hal2, low dose haloperidol group; Ris1: high dose risperidone group, Ris2: low dose risperidone group. Δβ indicates average β (antipsychotics) – average β (control). TSS1500 and TSS200 mean the regions 1,500 and 200 bp upstream, respectively, of the transcription start site. CpG island shore indicates the region 2 kb away from the CpG island. Open sea indicates the inter-CpG island region. DMP, differentially methylated probe.
TABLE 4
| GO ID | GO term | Category | Corrected P value | # of genes | Gene |
| GO:0099601 | Regulation of neurotransmitter receptor activity | BP | 0.00345 | 5 | DLG2, GRIN2A, SHANK1, SHANK2, SLURP1 |
| GO:0004465 | Lipoprotein lipase activity | MF | 0.00585 | 3 | ANGPTL4, APOA4, LMF1 |
| GO:0051004 | Regulation of lipoprotein lipase activity | BP | 0.00586 | 3 | ANGPTL4, APOA4, LMF1 |
| GO:0008328 | Ionotropic glutamate receptor complex | CC | 0.00586 | 4 | DLG2, GRIN2A, SHANK1, SHANK2 |
| GO:0098878 | Neurotransmitter receptor complex | CC | 0.00594 | 4 | DLG2, GRIN2A, SHANK1, SHANK2 |
| GO:0060997 | Dendritic spine morphogenesis | BP | 0.0071 | 3 | KIF1A, SHANK1, SHANK2 |
| GO:0098815 | Modulation of excitatory postsynaptic potential | BP | 0.01065 | 3 | CELF4, SHANK1, SHANK2 |
| GO:0099118 | Microtubule-based protein transport | BP | 0.01086 | 4 | DLG2, DYNLRB1, KIF1A, WDR34 |
| GO:0098840 | Protein transport along microtubule | BP | 0.01086 | 4 | DLG2, DYNLRB1, KIF1A, WDR34 |
| GO:1904115 | Axon cytoplasm | CC | 0.01098 | 3 | DLG2, KIF1A, RANBP1 |
| GO:0048854 | Brain morphogenesis | BP | 0.01101 | 3 | FGF8, SHANK1, SHANK2 |
| GO:1900449 | Regulation of glutamate receptor signaling pathway | BP | 0.0111 | 4 | DLG2, GRIN2A, SHANK1, SHANK2 |
| GO:0097106 | Postsynaptic density organization | BP | 0.0117 | 3 | DLG2, SHANK1, SHANK2 |
| GO:0008066 | Glutamate receptor activity | MF | 0.01179 | 4 | DLG2, GRIN2A, SHANK1, SHANK2 |
| GO:0099084 | Postsynaptic specialization organization | BP | 0.01218 | 3 | DLG2, SHANK1, SHANK2 |
| GO:0004970 | Ionotropic glutamate receptor activity | BP | 0.01224 | 4 | DLG2, GRIN2A, SHANK1, SHANK2 |
| GO:0022839 | Ion gated channel activity | BP | 0.01253 | 3 | ANO1, CLCA4, KCNT1 |
| GO:0004806 | Triglyceride lipase activity | MF | 0.01327 | 3 | ANGPTL4, APOA4, LMF1 |
| GO:0035235 | Ionotropic glutamate receptor signaling pathway | BP | 0.01349 | 4 | DLG2, GRIN2A, SHANK1, SHANK2 |
| GO:0035176 | Social behavior | BP | 0.01574 | 3 | GNG8, SHANK1, SHANK2 |
GO analysis of hypermethylated DMP-associated genes altered by both haloperidol and risperidone treatment.
GO, gene ontology; DMP, differentially methylated probe; BP, biological process; MF, molecular function; CC, cellular component.
FIGURE 3
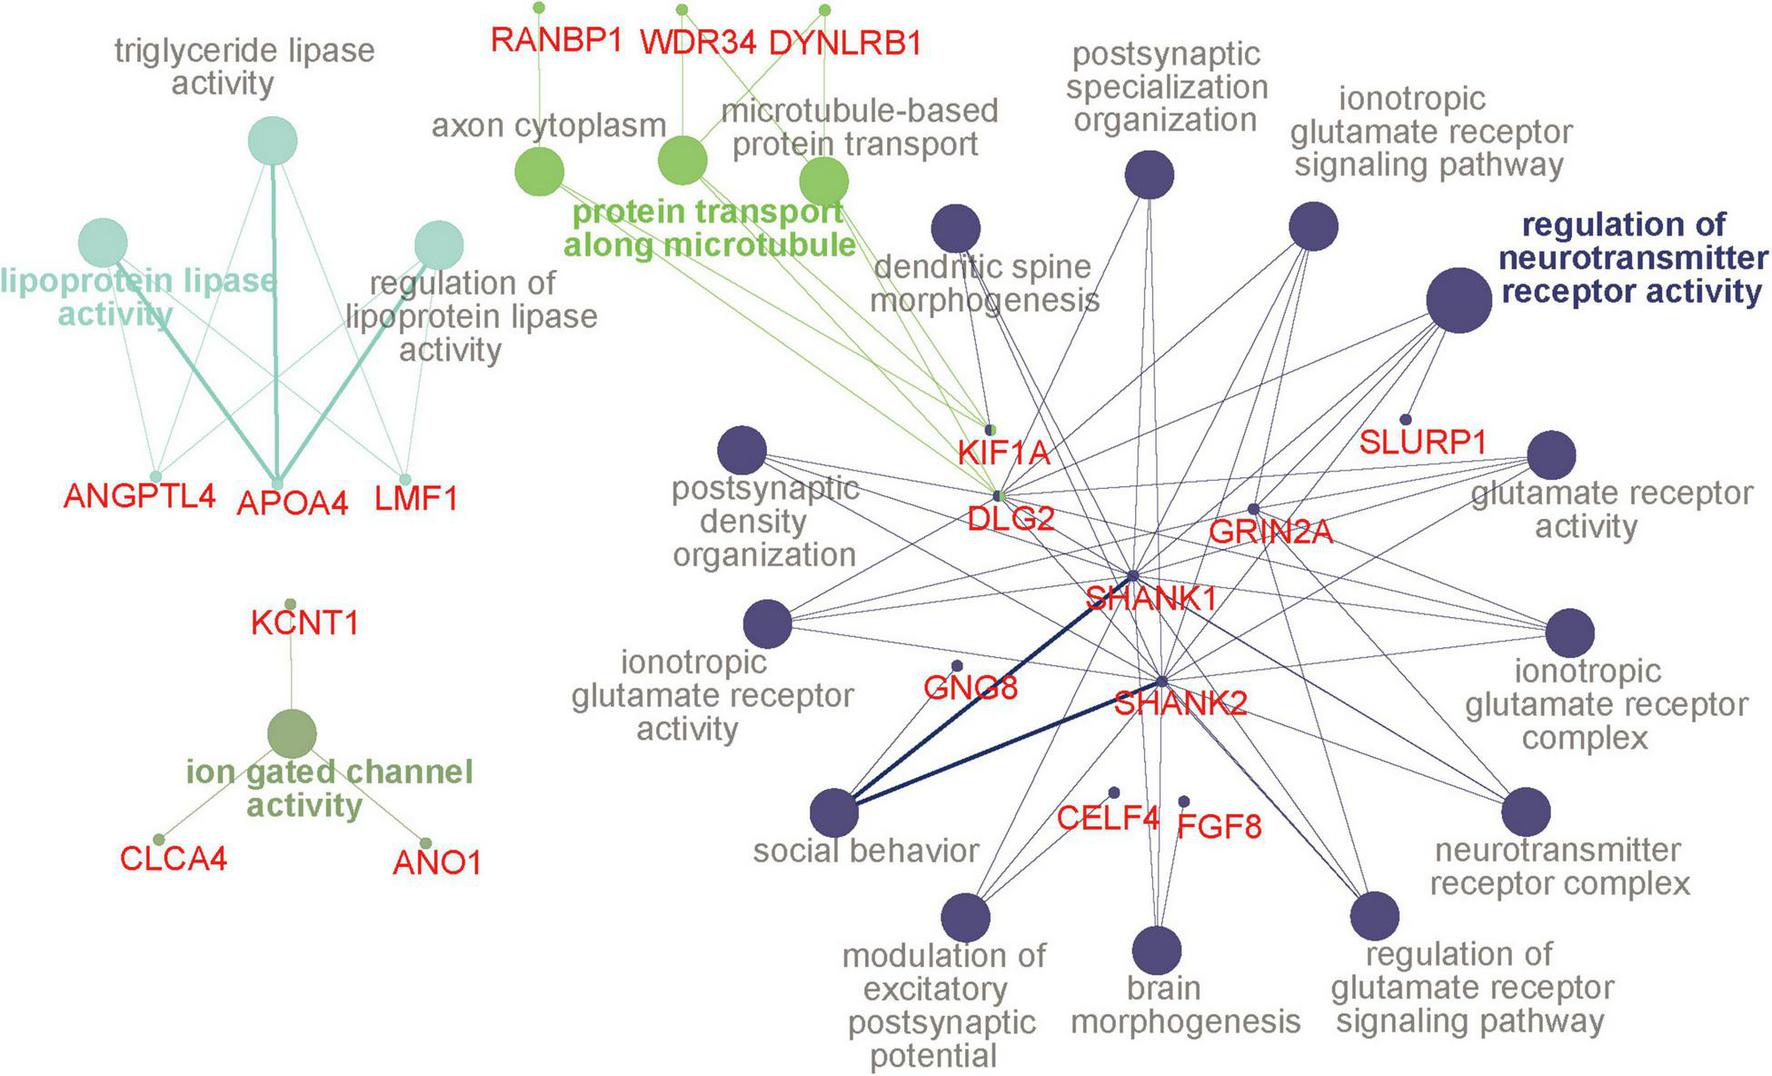
GO terms and hub genes. A picture was drawn based on the GO analysis of hypermethylated DMP-associated genes using ClueGO. Four functional groups were identified, and the color is the same for all pathways in a group. The circles with a bold font annotation represent the leading term (the most significant term of a group of pathways). Other terms are annotated in gray, and the smallest circles indicate genes related to the pathways. If the small circle is linked to two or more colors, it indicates that the gene is enriched in different pathways. The thickness of lines between pathways and genes is based on the GO evidence code. All experimental evidence codes, such as Inferred from Experiment (EXP) and Inferred from Direct Assay (IDA), have a thick edge, and others, such as Inferred from Electronic Annotation (ICA) and Inferred from Reviewed Computational Analysis (RCA), have a thin edge. DMP, differentially methylated probe; GO, gene ontology.
DNA Methylation Changes of Pharmacological Targets of Antipsychotics
We then examined the effects of haloperidol and risperidone on DNA methylation of the pharmacological targets of antipsychotics, including DRD2 and HTR2A. In DRD2, a probe (cg21013206) showed a significant increase in DNA methylation (Δβ = 0.102, P = 0.006) in the high-dose haloperidol group. This probe is located near the DRD2 promoter, suggesting a possible suppressing effect on its gene expression. In HTR2A, a probe (cg15894389) showed a significant decrease in DNA methylation (Δβ = −0.110, P = 0.0109) in the low-dose risperidone group. This probe is located within the first exon.
Discussion
We comprehensively examined DNA methylation changes induced by a typical antipsychotic, haloperidol, and a second-generation atypical antipsychotic, risperidone. To the best of our knowledge, this is the first study to examine the common effect of two distinctive antipsychotics on DNA methylation in human neuroblastoma cells. Haloperidol acts as a DRD2 antagonist to ameliorate positive symptoms. Risperidone antagonizes HTR2A as well as DRD2, thus improving both positive and negative symptoms. Our study found that haloperidol could induce DNA methylation changes at more sites than risperidone, which may be related to its stronger dopamine antagonism. In addition, our study identified the co-action sites of these two antipsychotics, both associated with regulation of neurotransmitter receptor activity and glutamate receptor activity. These results indicate that the epigenetic effects of the two antipsychotics have their own characteristics and some similarities, which are worthy of further study in the future.
The hypermethylated CpG sites in the high-dose haloperidol group were mainly located in the regions away from the promoters and the CpG island. Similarly, they were mainly located in the gene body in the low-dose group. Although risperidone induced fewer DNA methylation changes than haloperidol, risperidone also induced hypermethylation at CpG sites located away from the promoter and CpG island. These patterns of changes were closely similar to those with blonanserin (Murata et al., 2014) and perospirone (Murata et al., 2019) using the same cell culture model and suggest that antipsychotics generally increase DNA methylation in a dose-dependent manner and that genomic regions less important for gene expression are more prone to be altered by antipsychotics. This was also concordant with a previous study that revealed an association of haloperidol and increased global DNA methylation levels in leukocytes (Melas et al., 2012). It should be noted that the possible role of intergenic DNA methylation is to repress the activity of harmful genetic elements such as transposons (Pappalardo and Barra, 2021). DNA methylation of the gene body is also associated with altered gene expressions (Moore et al., 2013). Therefore, DNA methylation changes at these sites are also important.
Despite the different classes, these two antipsychotics showed very similar DNA methylation changes, especially at low doses, as evidenced by cluster analysis and PCA (Figure 1). We identified 294 common DNA methylation changes between the two antipsychotics regardless of the dose. They showed the same direction of changes in DNA methylation, which mainly consisted of hypermethylation (Figure 2). The GO and pathway analyses revealed that the hypermethylated genes were included in the GO terms related to neuronal functions such as regulation of neurotransmitter receptor activity and ionotropic glutamate receptor complex (Table 4). We identified two key DMPs, cg02631082 and cg12198334, related to SHANK1 and SHANK2, respectively, that were involved in these GO terms. Additionally, we observed that two probes, cg08447324 (Δβ = 0.117, P = 7.212e-05) and cg16658931 (Δβ = 0.114, P = 7.286e-05) in SHANK1, and two probes (cg10911054 (Δβ = 0.132, P = 2.207e-06) and cg18080819 (Δβ = 0.126, P = 1.984e-04) in SHANK2 also showed hypermethylation in the high-dose haloperidol group. SHANK genes encode scaffold proteins in postsynaptic neurons and are involved in neuropsychiatric disorders (Kursula, 2019; Taylor et al., 2020). Epigenetic regulation of SHANK genes by antipsychotics affects a broad range of neuronal functions.
Among the genes showing robust DNA methylation changes, IL20 showed the largest changes. IL20 is a cytokine belonging to the IL10 family, which also includes several other interleukins. In the central nervous system, these cytokines are upregulated or downregulated in response to environmental insults in glial cells and are involved in neuroinflammation (Burmeister and Marriott, 2018). In contrast to the well-characterized neuroprotective role of IL10, the role of IL20 remains unclear and is considered to play a proinflammatory factor in some cases (Burmeister and Marriott, 2018). In schizophrenia, increased proinflammatory cytokines may be involved in its etiology (Lesh et al., 2018; Sahbaz et al., 2020). Interestingly, haloperidol and risperidone showed opposite effects on the induction of cytokines in astroglial cell lines (Bobermin et al., 2018). Haloperidol induced the production of anti-inflammatory factors such as IL10, whereas risperidone decreased the production of these factors. Although the expression level of IL20 was not previously examined, our epigenetic study suggests that they have common suppressive effects on IL20.
Two of the other top DMP-associated genes, ATP1A1 and ZNF323, were also involved in psychiatric disorders and neural function. ATP1A1 encodes the a1 subunit of the ubiquitously expressed ouabain-sensitive Na+, K+-ATPase pump. Mutations in this gene are involved in Charcot-Marie-Tooth disease (Lassuthova et al., 2018). One study showed its downregulation in the brains of mice treated with lithium (Chetcuti et al., 2008). Both haloperidol and risperidone induced hypermethylation, suggesting a similar suppressive role in the expression of this gene. ZNF323, also known as ZSCAN31, encodes a multiple C2H2-type zinc finger domain-containing protein that plays an active role in embryonic development (Pi et al., 2002). Significant downregulation of ZNF323 in the frontal cortex and hippocampus of schizophrenia patients has been reported (Luo et al., 2015). The probe associated with ZNF323 was hypomethylated by these antipsychotics.
Among the probes related to DRD2, one probe (cg21013206) reported in blonanserin-treated cells (Murata et al., 2014) overlapped in the high-dose haloperidol group. In addition, two probes (cg22458194 and cg03691958) in the coding region of DRD2, reported in perospirone-treated cells (Murata et al., 2019), also showed DNA methylation changes in the risperidone group, but the changes did not reach the significance level (data not shown). Interestingly, the changes at these probes usually represent increased DNA methylation, suggesting the suppressive effect of DRD2 gene expression. DNA methylation in the important CpG sites for DRD2 expression may modulate the effect of antipsychotics by repressing its gene expression. The incidence of extrapyramidal symptoms (EPS) in haloperidol is higher than that in risperidone, which is related to the strong DRD2 antagonism of haloperidol. Our study suggested that haloperidol can repress the expression of DRD2 through its hypermethylation, which may provide some evidence to explain the occurrence of EPS in haloperidol from the epigenetic perspective.
From the comparison with previous studies, CACNA1A showed the highest DNA methylation change by blonanserin in the same cell culture model (Murata et al., 2014). In CACNA1A, one probe (cg26554567) showed a significant decrease in DNA methylation in the low-dose haloperidol group (Δβ = −0.109, P = 1.382e-05) and the high-dose risperidone group (Δβ = −0.107, P = 4.339e-05). GRM7 has been reported to be a potential target gene for seven antipsychotics, including haloperidol and risperidone (Liang et al., 2020). In this study, one probe (cg21032008) related to GRM7 showed a significant increase in DNA methylation (Δβ = 0.117, P = 0.0069) in the high-dose haloperidol group compared to the control group.
In this study, we used a human neuroblastoma cell line for systematic comparison of the epigenetic effects of antipsychotics. Therefore, the DNA methylation changes identified here might be quite different from those identified in postmitotic neuronal cells. Although the SK-N-SH expresses DRD2 and HTR2A very weakly at the transcript level, according to the DepMap database,4 it is not clear if DNA methylation changes identified in this study were caused by antagonism of these receptors. In addition, the molecular mechanism underlying DNA methylation changes remains unclear. Among the ingredients in the medium, FBS contains many uncharacterized chemicals. This may induce the DNA methylation changes during culture, independent of antipsychotics. However, we put the two control groups (no antipsychotics and DMSO only) and applied the different concentrations of antipsychotics. Therefore, we minimized the effect of the culture medium. In addition, it is not clear whether DNA methylation changes contribute to pharmacological efficacy. Therefore, future studies using primary cultured cells and/or animal models of psychiatric disorders will be required to clarify the true effects.
Publisher’s Note
All claims expressed in this article are solely those of the authors and do not necessarily represent those of their affiliated organizations, or those of the publisher, the editors and the reviewers. Any product that may be evaluated in this article, or claim that may be made by its manufacturer, is not guaranteed or endorsed by the publisher.
Statements
Data availability statement
The datasets presented in this study can be found in online repositories. The names of the repository/repositories and accession number(s) can be found below: https://www.ncbi.nlm.nih.gov/search/all/?term=GSE185973.
Author contributions
MB performed the experiments. YN performed the data management. JD, YN, and TK analyzed the data. JD, YN, SF, MB, and KI wrote the manuscript. KK, MB, and KI designed the experiments. All authors discussed the results and commented on the manuscript.
Funding
This study was partly supported by JSPS KAKENHI (Grant Numbers 16H06395, 16H06399, 16K21720, 18H02753, 18H05428, and 18H05430), AMED (Grant Numbers JP21dm0307001, JP21dm0307004, JP21dm0207069, JP20dm0107123, and JP21dm0207074) and Moonshot R&D (Grant Number JPMJMS2021).
Acknowledgments
This work was supported in part by the UTokyo Center for Integrative Science of Human Behavior (CiSHuB) and the International Research Center for Neurointelligence (WPI-IRCN) at The University of Tokyo Institutes for Advanced Study (UTIAS).
Conflict of interest
The authors declare that the research was conducted in the absence of any commercial or financial relationships that could be construed as a potential conflict of interest.
Supplementary material
The Supplementary Material for this article can be found online at: https://www.frontiersin.org/articles/10.3389/fnmol.2021.792874/full#supplementary-material
Footnotes
2.^ http://www.sthda.com/english/rpkgs/factoextra
References
1
Aryee M. J. Jaffe A. E. Corrada-Bravo H. Ladd-Acosta C. Feinberg A. P. Hansen K. D. et al (2014). Minfi: a flexible and comprehensive Bioconductor package for the analysis of Infinium DNA methylation microarrays.Bioinformatics301363–1369.
2
Asai T. Bundo M. Sugawara H. Sunaga F. Ueda J. Tanaka G. et al (2013). Effect of mood stabilizers on DNA methylation in human neuroblastoma cells.Int. J. Neuropsychopharmacol.162285–2294. 10.1017/s1461145713000710
3
Bindea G. Mlecnik B. Hackl H. Charoentong P. Tosolini M. Kirilovsky A. et al (2009). ClueGO: a Cytoscape plug-in to decipher functionally grouped gene ontology and pathway annotation networks.Bioinformatics251091–1093.
4
Bird A. (2002). DNA methylation patterns and epigenetic memory.Genes Dev.166–21.
5
Bobermin L. D. da Silva A. Souza D. O. Quincozes-Santos A. (2018). Differential effects of typical and atypical antipsychotics on astroglial cells in vitro.Int. J. Dev. Neurosci.691–9. 10.1016/j.ijdevneu.2018.06.001
6
Bundo M. Ueda J. Nakachi Y. Kasai K. Kato T. Iwamoto K. (2021). Decreased DNA methylation at promoters and gene-specific neuronal hypermethylation in the prefrontal cortex of patients with bipolar disorder.Mol. Psychiatry263407–3418. 10.1038/s41380-021-01079-0
7
Burmeister A. R. Marriott I. (2018). The interleukin-10 family of cytokines and their role in the CNS.Front. Cell. Neurosci.12:458.
8
Chetcuti A. Adams L. J. Mitchell P. B. Schofield P. R. (2008). Microarray gene expression profiling of mouse brain mRNA in a model of lithium treatment.Psychiatr. Genet.1864–72. 10.1097/YPG.0b013e3282fb0051
9
de la Fuente Revenga M. Ibi D. Cuddy T. Toneatti R. Kurita M. Ijaz M. K. et al (2019). Chronic clozapine treatment restrains via HDAC2 the performance of mGlu2 receptor agonism in a rodent model of antipsychotic activity.Neuropsychopharmacology44443–454. 10.1038/s41386-018-0143-4
10
Insel T. R. (2010). Rethinking schizophrenia.Nature468187–193.
11
Kolde R. (2019). pheatmap: pretty Heatmaps. R package version 1.0.12. Available Online at: https://CRAN.R-project.org/package=pheatmap.
12
Kurita M. Holloway T. Gonzalez-Maeso J. (2013). HDAC2 as a new target to improve schizophrenia treatment.Expert Rev. Neurother.131–3. 10.1586/ern.12.141
13
Kursula P. (2019). Shanks - multidomain molecular scaffolds of the postsynaptic density.Curr. Opin. Struct. Biol.54122–128. 10.1016/j.sbi.2019.01.007
14
Lassuthova P. Rebelo A. P. Ravenscroft G. Lamont P. J. Davis M. R. Manganelli F. et al (2018). Mutations in ATP1A1 Cause Dominant Charcot-Marie-Tooth Type 2.Am. J. Hum. Genet.102505–514.
15
Lê S. Josse J. Husson F. (2008). FactoMineR: a Package for Multivariate Analysis.J. Stat. Softw.251–18.
16
Lesh T. A. Careaga M. Rose D. R. McAllister A. K. Van de Water J. Carter C. S. et al (2018). Cytokine alterations in first-episode schizophrenia and bipolar disorder: relationships to brain structure and symptoms.J. Neuroinflammation15:165. 10.1186/s12974-018-1197-2
17
Liang W. Yu H. Su Y. Lu T. Yan H. Yue W. et al (2020). Variants of GRM7 as risk factor and response to antipsychotic therapy in schizophrenia.Transl. Psychiatry10:83. 10.1038/s41398-020-0763-4
18
Luo X. J. Mattheisen M. Li M. Huang L. Rietschel M. Borglum A. D. et al (2015). Systematic integration of brain eQTL and GWAS identifies ZNF323 as a novel schizophrenia risk gene and suggests recent positive selection based on compensatory advantage on pulmonary function.Schizophr. Bull.411294–1308. 10.1093/schbul/sbv017
19
Melas P. A. Rogdaki M. Osby U. Schalling M. Lavebratt C. Ekstrom T. J. (2012). Epigenetic aberrations in leukocytes of patients with schizophrenia: association of global DNA methylation with antipsychotic drug treatment and disease onset.FASEB J.262712–2718. 10.1096/fj.11-202069
20
Moore L. D. Le T. Fan G. (2013). DNA Methylation and Its Basic Function.Neuropsychopharmacology3823–38.
21
Murata Y. Bundo M. Sunaga F. Kasai K. Iwamoto K. (2019). DNA methylation profiling in a neuroblastoma cell line exposed to the antipsychotic perospirone.Pharmacopsychiatry5263–69. 10.1055/s-0044-101467
22
Murata Y. Nishioka M. Bundo M. Sunaga F. Kasai K. Iwamoto K. (2014). Comprehensive DNA methylation analysis of human neuroblastoma cells treated with blonanserin.Neurosci. Lett.563123–128. 10.1016/j.neulet.2014.01.038
23
Nestler E. J. Pena C. J. Kundakovic M. Mitchell A. Akbarian S. (2016). Epigenetic basis of mental Illness.Neuroscientist22447–463.
24
Nishioka M. Bundo M. Kasai K. Iwamoto K. (2012). DNA methylation in schizophrenia: progress and challenges of epigenetic studies.Genome Med.4:96. 10.1186/gm397
25
Pappalardo X. G. Barra V. (2021). Losing DNA methylation at repetitive elements and breaking bad.Epigenetics Chromatin14:25. 10.1186/s13072-021-00400-z
26
Pi H. Li Y. Zhu C. Zhou L. Luo K. Yuan W. et al (2002). A novel human SCAN/(Cys)2(His)2 zinc-finger transcription factor ZNF323 in early human embryonic development.Biochem. Biophys. Res. Commun.296206–213. 10.1016/s0006-291x(02)00772-6
27
Purcell S. M. Moran J. L. Fromer M. Ruderfer D. Solovieff N. Roussos P. et al (2014). A polygenic burden of rare disruptive mutations in schizophrenia.Nature506185–190. 10.1038/nature12975
28
Purcell S. M. Wray N. R. Stone J. L. Visscher P. M. O’Donovan M. C. Sullivan P. F. et al (2009). Common polygenic variation contributes to risk of schizophrenia and bipolar disorder.Nature460748–752.
29
Richetto J. Meyer U. (2020). Epigenetic modifications in schizophrenia and related disorders: molecular scars of environmental exposures and source of phenotypic variability.Biol. Psychiatry89215–226.
30
Sahbaz C. Zibandey N. Kurtulmus A. Duran Y. Gokalp M. Kirpinar I. et al (2020). Reduced regulatory T cells with increased proinflammatory response in patients with schizophrenia.Psychopharmacology2371861–1871.
31
Schizophrenia Working Group of the Psychiatric Genomics Consortium (2014). Biological insights from 108 schizophrenia-associated genetic loci.Nature511421–427. 10.1038/nature13595
32
Shannon P. Markiel A. Ozier O. Baliga N. S. Wang J. T. Ramage D. et al (2003). Cytoscape: a software environment for integrated models of biomolecular interaction networks.Genome Res.132498–2504.
33
Sugawara H. Bundo M. Asai T. Sunaga F. Ueda J. Ishigooka J. et al (2015). Effects of quetiapine on DNA methylation in neuroblastoma cells.Prog. Neuropsychopharmacol. Biol. Psychiatry56117–121. 10.1016/j.pnpbp.2014.08.010
34
Swathy B. Banerjee M. (2017). Understanding epigenetics of schizophrenia in the backdrop of its antipsychotic drug therapy.Epigenomics9721–736.
35
Taylor S. C. Ferri S. L. Grewal M. Smernoff Z. Bucan M. Weiner J. A. et al (2020). The role of synaptic cell adhesion molecules and associated scaffolding proteins in social affiliative behaviors.Biol. Psychiatry88442–451. 10.1016/j.biopsych.2020.02.012
36
Tian Y. Morris T. J. Webster A. P. Yang Z. Beck S. Feber A. et al (2017). ChAMP: updated methylation analysis pipeline for Illumina BeadChips.Bioinformatics333982–3984. 10.1093/bioinformatics/btx513
37
Ueda J. Bundo M. Nakachi Y. Kasai K. Kato T. Iwamoto K. (2021). Cell type-specific DNA methylation analysis of the prefrontal cortex of patients with schizophrenia.Psychiatry Clin. Neurosci.75297–299. 10.1111/PCN.13282
Summary
Keywords
schizophrenia, DNA methylation, haloperidol, risperidone, epigenetics, neuroblastoma
Citation
Du J, Nakachi Y, Kiyono T, Fujii S, Kasai K, Bundo M and Iwamoto K (2021) Comprehensive DNA Methylation Analysis of Human Neuroblastoma Cells Treated With Haloperidol and Risperidone. Front. Mol. Neurosci. 14:792874. doi: 10.3389/fnmol.2021.792874
Received
11 October 2021
Accepted
02 November 2021
Published
06 December 2021
Volume
14 - 2021
Edited by
Shusaku Uchida, Kyoto University, Japan
Reviewed by
Daisuke Ibi, Meijo University, Japan; Manabu Makinodan, Nara Medical University, Japan
Updates
Copyright
© 2021 Du, Nakachi, Kiyono, Fujii, Kasai, Bundo and Iwamoto.
This is an open-access article distributed under the terms of the Creative Commons Attribution License (CC BY). The use, distribution or reproduction in other forums is permitted, provided the original author(s) and the copyright owner(s) are credited and that the original publication in this journal is cited, in accordance with accepted academic practice. No use, distribution or reproduction is permitted which does not comply with these terms.
*Correspondence: Miki Bundo, bundo@kumamoto-u.ac.jpKazuya Iwamoto, iwamotok@kumamoto-u.ac.jp
†These authors have contributed equally to this work
This article was submitted to Brain Disease Mechanisms, a section of the journal Frontiers in Molecular Neuroscience
Disclaimer
All claims expressed in this article are solely those of the authors and do not necessarily represent those of their affiliated organizations, or those of the publisher, the editors and the reviewers. Any product that may be evaluated in this article or claim that may be made by its manufacturer is not guaranteed or endorsed by the publisher.