 Ahmad Faraz
 Asma Imran
 Hammad Raza2
 Muhammad Iqbal
 Asma Rehman
- 1Soil and Environmental Biotechnology Division, National Institute for Biotechnology and Genetic Engineering, Constituent College of Pakistan Institute of Engineering and Applied Sciences (NIBGE-C, PIEAS), Islamabad, Pakistan
- 2Department of Botany, Government College University Faisalabad (GCUF), Faisalabad, Punjab, Pakistan
Nitrogen (N) is an essential macronutrient required for plant productivity. Urea is a major source of N in global agriculture systems that is lost due to leaching, runoff, and volatilization, inflicting serious productivity, economic, and environmental issues. In contrast, coated urea minimizes N losses by decreasing urease activity and enhances its efficiency by maintaining a continuous N supply for plant uptake and productivity. The present study describes the impact of sulfur nanoparticle (SNP)-coated urea (SNPCU) on the morpho-physiological, biochemical, and yield traits of rice and wheat. Chemically synthesized SNP coated onto urea revealed a fine layer of SNP on urea under a scanning electron microscope. Two varieties each of rice and wheat grown in pots were fertilized as follows: control N/recommended non-coated urea U100, three doses of SNPCU (50%, 70%, and 90% of recommended N) in split doses (40% at transplanting, 30% at tillering, and 30% at the panicle stage). Analysis revealed that SNPCU at all doses increased the growth and yield parameters of both crops. The maximum increase was observed in SNPCU90, that is, chlorophyll (up to 39%), carotenoids and proteins (up to 20%), sugars and amino acids (up to 60%), along with an increase of at least 5% or more in agronomic efficiency, 10% or more in grain weight, 6% or more in harvest index, and 70% or more in N uptake in both cultivars of wheat and rice. SNPCU90 increased the nitrogen recovery efficiency by 34% and 26% in wheat varieties Galaxy and FSD-2008, while 36% and 30% in Green Super Rice and 1121 Basmati rice, respectively. SNPCU90 decreased urease activity up to 37%, 52% on day 2, and 16% and 25% on day 15 in wheat and rice, respectively. This delay increased the duration of N availability in soil for wheat and rice plants, resulting in increased nitrogen use efficiency (NUE) till 15 days. This study has demonstrated that SNPCU minimizes N loss, revealing that even a lower application of SNPCU fulfills the crop N demand. It is concluded that SNPCU at lower rates can be used for large-scale testing in fields for reducing N losses and improving yields.
1 Introduction
The world population will gradually increase from 7.3 to 9.7 billion by 2050, which will put pressure on farmers to produce more food. Approximately 107 Mt of urea fertilizer was used in agriculture from 2018 to 2019 (Hassan et al., 2024). This wide usage and large market share are due to urea being less expensive and containing a higher (46%) nitrogen (N) content (Guardia et al., 2018). N is an essential macronutrient that plays a vital role in plant development, for example, biosynthesis of numerous amino acids, chlorophyll, and nucleic acid, and significantly increases plant yield.
Loss of N as ammonia is a significant issue that reduces nitrogen use efficiency (NUE) and pollutes the environment, affects human health, alters the Earth’s radiation balance, reduces visibility, and contributes to the redistribution of N in atmospheric deposition (de Vries, 2021; Huang et al., 2017). Urea is highly soluble in water and is lost to the environment after soil application, mainly due to leaching, volatilization, and surface runoff or urease activity, causing urea losses up to 70% (Rana et al., 2021). These losses ultimately increase the demand for more urea input in crops. Recommended practice is to split the urea application or use of urease inhibitors, for example, N-(n-butyl) thiophosphoric triamide (NBPT), hydroxyurea, and boric acid (Svane et al., 2020; Ahmed et al., 2024) that bind to the active site of the urease enzyme and delay its conversion to ammonia (Sanz-Cobena et al., 2008).
Another approach is to reduce the urea hydrolysis by slowing down the urease enzymatic activity by coating the urea with less-soluble chemicals, for example, polymer, oil, organic, and inorganic compounds or their combinations, etc. (Ma et al., 2024; Xu et al., 2024). Coated urea slowly releases N in soil as it comes in contact with water or as the coating degrades (Pjnflv, 2016), providing a slow and prolonged supply of nutrients to plants for uptake. Coating also reduces N conversion to ammonia or loss due to runoff or leaching. It not only saves the labor cost of multiple applications but is also effective at a lower dose, saving 20%–30% of the urea cost (Mustafa et al., 2022). Coated urea is gaining popularity due to its better yield response, grain quality, NUE, and cost-saving features (Shivay et al., 2016).
Nanoparticles (NPs), due to their large surface area and diverse functionalities, are being used in agricultural, medical, and industrial applications. Nano-coated urea is a relatively advanced approach that has displayed the potential to improve fertilizer efficiency in the field and reduce ammonia losses quite recently (Shivay et al., 2019; Lapushkin et al., 2024).
Sulfur (S) is the fourth essential plant nutrient vital for many growth functions, including N metabolism, enzymatic activity, chlorophyll formation, protein, and oil synthesis, contributing to overall plant health and stress tolerance. S-deficiency results in short and spindly stems, yellowing of young leaves, and reduced photosynthesis, leading to lower yields (Pooniya et al., 2018). Cereal crops are often deficient in micronutrients Zn, Fe, Mn, Cu, and S. Generally, 10–40 kg ha−1 sulfur is recommended for cereal crops at different times and doses, causing its application to be labor-intensive and costly. Sulfur nanoparticles (SNP) enhance the oxidation process by lowering soil pH, while their application before sowing or at the seedling stage acidifies the soil and helps to release nutrients in the soil.
In the light of above-mentioned facts, a research study was designed to develop a coated urea (CU) fertilizer that was designed to be more effective in terms of NUE, inexpensive in terms of fertilizer saving, eco-friendly in terms of low N losses, and released sulfur nanoparticles (SNP) as an essential component for an added benefit. We hypothesized that SNPCU would be a better fertilizer than coated urea, and it would gradually supply nitrogen and sulfur to the plant. SNPCU was prepared and applied to wheat and rice grown in pots to study its response on the physio-morphological, biochemical, and yield attributes of the plants. The data of the current study reveal that SNPCU improved NUE, decreased urease activity, and increased yield in both crops.
2 Materials and methods
2.1 Preparation and characterization of sulfur-nanoparticle-coated urea
Sulfur nanoparticles (SNP) were chemically synthesized following the method of Shankar and Rhim (2018). Briefly, 2.84 g of sodium thiosulfate pentahydrate (Merck 99.9% purity) was dissolved in 900 mL distilled water, then 100 mL 0.2 M HCl (RCI Lab Scan 37% purity) was added with constant stirring at 25°C, and the mixture was sonicated for 40 min at room temperature. The solution was centrifuged, and 0.4 g/L nanoparticles (SNP) were collected, air-dried, and stored at room temperature for further use.
The rotary drum technique was used to coat the SNP onto the urea (Engro Urea, 46% N, purchased from the local market) as described by Ibrahim et al. (2014). Urea granules were preheated at 70°C for 15 min. After that, the urea granules were placed in a rotary drum for 10 min at 1,000 rpm. A mixture of 3% SNP and 2% starch as binder was sprayed onto the urea to obtain the SNPCU.
Scanning electron microscopy (SEM) analysis was carried out using a Nova nano in secondary electron (SE) mode at an accelerating voltage of 15 kV, with a horizontal field width of 41.4 μm.
SNPCU and non-coated urea (NCU) were tested using Fourier transform spectroscopy (FTIR; PerkinElmer Spectrum II) at wavelengths of 400–4,000 cm. X-ray diffraction (XRD, Bruker D8 Advance) analysis was performed on both urea and SNPCU, utilizing an X-ray diffractometer, equipped with CuKα radiation as the X-ray source. The measurement was conducted over a 2θ range of 4–48°, with an operating voltage of 40 kV and tube current of 20 Ma.
2.1.1 Experimental design for plant testing of SNPCU
The experiments were conducted at Faisalabad (11° 26′N 73°16′E) with completely randomized design (CRD), and each treatment was tested with three replicate pots. Two varieties of wheat (i.e., Faisalabad 2008 and Galaxy) and two varieties of rice (i.e., Green Super Rice and 1121 Basmati) were used in experiments. Visually healthy seeds (n = 3) were sown in each pot (n = 3) per treatment, maintaining nine plants per treatment. The treatment setup and controls for both rice and wheat were as follows:
Control 1: recommended non-coated urea @ 120 kg N ha−1 (NCU100) + Variety 1 (wheat/rice).
Control 2: recommended non-coated urea @ 120 kg N ha−1 (NCU100) + Variety 2 (wheat/rice)
Treatment 1: SNPCU at 50% rate of recommended urea; 60 kg N ha−1 (SNPCU50) + Variety 1 (wheat/rice).
Treatment 2: SNPCU at 70% rate of recommended urea: 84 kg N ha−1 (SNPCU70) + Variety 1 (wheat/rice).
Treatment 3: SNPCU at 90% rate of recommended urea: 108 kg N ha−1 (SNPCU90) + Variety 1 (wheat/rice).
Treatment 4: SNPCU at 50% rate of recommended urea; 60 kg N ha−1 (SNPCU50) + Variety 2 (wheat/rice).
Treatment 5: SNPCU at 70% rate of recommended urea: 84 kg N ha−1 (SNPCU70) + Variety 2 (wheat/rice).
Treatment 6: SNPCU at 90% rate of recommended urea: 108 kg N ha−1 (SNPCU90) + Variety 2 (wheat/rice).
The pots were kept in natural conditions of temperature and sunlight during the normal crop growing season and irrigated when required.
2.2 Growth parameters
Three plants from each replicate were uprooted at physiological maturity (day 60 after sowing). The plant roots were washed with water to remove the soil particles and separated from the plant to determine the shoot and root fresh weight and length, tillers per plant, and leaf area. The grain yield was recorded after final harvesting (3° months after sowing), and nutrients were analyzed. Six plants from each treatment were uprooted, and the data were recorded. Plant fresh biomass was measured immediately after harvesting. The plants were dried in an oven at 80°C for 3°days to determine the dry matter/biomass. The harvest index was calculated using Equation 1 by dividing the economic yield (grain yield) by the biological yield (straw yield + grain yield).
2.3 Biochemical analysis
2.3.1 Chlorophyll content
The total chlorophyll content of leaves was analyzed following Arnon (1949). Fresh leaf material was taken to observe the plant’s photosynthesis rate.
2.3.2 Total sugars
Total sugar content was determined by the DuBois et al. (1956) method. The fresh leaf material was homogenized in methanol and centrifuged at 1,200 rpm, and the supernatants were collected. A 3 mL volume of ice-cold phenol sulfuric acid reagent (80% H2SO4 285 mL + 15 g phenol) was added to 0.1 mL of the supernatant. The mixture was placed at room temperature for half an hour, and the absorbance was analyzed at 490 nm in a spectrophotometer.
2.3.3 Total reducing sugars
The total reducing sugar content in the leaf was determined by the Henson and Stone (1988) method. Fresh leaf material (0.25 g) was ground in 80% methanol using a chilled pestle and mortar, followed by centrifuging at 12,000 rpm for 10 min. A volume of 0.3 mL supernatant was collected in a test tube, to which 1.5 mL DNSA (3, 5-dinitrosalicylic acid) and 1 mL of distilled water were added and mixed gently. The mixture was heated for 30 min at 100°C using a water bath and then cooled. Then, a spectrophotometer was used to determine the absorbance at 540 nm.
2.3.4 Total soluble proteins
Total soluble protein content was determined by the Bradford (1976) method. Fresh leaf material was ground in phosphate buffer, samples were centrifuged, and the supernatant was collected in a test tube. A 3 mL volume of Bradford regent was added to 0.3-mL supernatant, and the absorbance was measured at 595 nm using a spectrophotometer after 30 min of reaction.
2.3.5 Total free amino acids
Total free amino acid content was analyzed by using the Hamilton et al. (1943) method. Fresh leaf material was homogenized in a phosphate buffer, followed by centrifuging at 1,400 rpm, and the supernatants were separated in a test tube. A 0.5 mL volume of ninhydrin and pyridine was added to 0.5 mL of supernatant, and the mixture was heated in a water bath for 30 min at 100°C. The volume was made up to 15 mL by adding distilled water, and the final absorbance was recorded at 570 nm using a spectrophotometer.
2.3.6 Proline
Proline content was determined by the Bates et al. (1973) method. The fresh leaf sample was ground in phosphate buffer, centrifuged at 14,000 rpm, and supernatants were collected. A 0.5 mL volume of 5-SSA was added and kept in a water bath at 100°C for 30 min. Then, the samples were cooled, and 1 mL of acetic acid and ninhydrin was added and heated again at 100°C in a water bath. A 4 mL volume of toluene was added after cooling the solution and mixed thoroughly. The absorbance was recorded at 520 nm using a spectrophotometer.
2.4 Soil and plant nutrient analysis
2.4.1 Estimation of total nitrogen in soil
Soil samples were collected, air-dried, and sieved. Total nitrogen (TN) in the soil was determined by the Kjeldahl method (Bremner and Mulvaney, 1982). One gram of soil sample was added to 5 mL of 2.5% salicylic acid and kept overnight. After 24 h, 0.5 g sodium thiosulfate was added, and the mixture was heated at 200°C for 1 h. The samples were cooled, 1.1 g of the digestion mixture was added, and the samples were reheated at 375°C until the soil mixture became clear. Subsequently, 20 mL of distilled water was added, followed by 17 mL of 12 M NaOH in samples and distillate using the Kjeldahl apparatus. A boric acid solution was taken in measuring flasks, and 40 mL of distillate was collected. The sample was then titrated against N/50 of H2SO4 solution.
2.4.2 Available nitrogen in soil
The Kjeldahl method was used to analyze available nitrogen (AN) in soil following Bremner and Mulvaney (1982). The soil samples were collected from pots, air-dried, and sieved. A 2 g amount of soil was added to 0.1 g MgO in a 100-mL distillation tube, gently mixed, and 20 mL of distilled water was added. The distillate was collected in a volumetric flask containing a boric acid solution. Then, it was titrated against N/500 H2SO4.
2.4.3 Urease activity in soil
The urease activity in soil was determined by the Tabatabai and Bremner (1972) method. Briefly, a 5-g soil sample was taken in a flask containing 0.2 mL of toluene and 9 mL of THAM buffer, and the flask was gently vortexed to mix the contents. Then, 1 mL of 0.2 M urea solution was added, and the flask was swirled and incubated at 37°C for 3 h. After that, the volume was made up to 50 mL by adding KCl-Ag2SO4. In the control, 1 mL of 0.2 M urea solution was added before making the volume up to 50 mL by adding KCl-Ag2SO4. A 20-mL aliquot of an aliquot was pipetted into a distillation flask, 0.2 g of MgO was added, and the sample was distilled using a Kjeldahl rapid still II. Then, 40 mL of the distillate was collected in a volumetric flask, containing 5 mL of boric acid indicator, and titrated against N/500 H2SO4 until the solution color became pink.
2.4.4 Total nitrogen in plant straw
Total N in straw was analyzed by the Kjeldahl method following the Bremner and Mulvaney (1982) method. Plant straw was dried in an oven at 80°C and ground with a pestle and mortar. Then, 0.5-g ground leaf material was added to the digestion tube, followed by 1.5 g of the digestion mixture and 4 mL concentrated H2SO4. The mixture was heated for 30 min at 375°C until the sample color was clear. Then, 20 mL of distilled water was added, the sample was distilled, and 30 mL of the distillate was collected in a boric acid indicator-containing flask. The solution was titrated against N/50 H2SO4.
2.4.5 Total nitrogen in grain
Total N in grains was determined by the Kjeldahl method (Concon and Soltess, 1973). Grain samples were ground with a disc grinder. A 0.2 g amount of the ground sample was placed in a digestion tube, followed by 1.5 g of digestion mixture, 4 mL of H2SO4, and 2 mL of H2O2. The mixture was heated at 375°C until the sample color was clear. After that, 20 mL of distilled water was added, and the sample was distilled. Then, 35 mL of the distillate was collected in a volumetric flask containing a boric acid solution. The sample was titrated against N/50 H2SO4, and Total N was calculated using the equation below.
2.4.6 Nitrogen uptake in wheat and rice
The total N uptake in wheat and rice plants from experimental pots was calculated using Equations 2–4 respectively using the formula given below:
2.4.7 Nitrogen recovery efficiency, agronomic efficiency, nitrogen harvest index, and partial factor productivity
Nitrogen recovery efficiency (NRE), agronomic efficiency (AE), nitrogen harvest index (NHI), and partial factor productivity (PFP) were calculated using Equations 5–8 respectively using the formulas mentioned below.
2.5 Statistical analysis
Two-way factorial analysis of variance (ANOVA) with three/six independent replicates was used to check the effect of SNPCU fertilizer application on wheat and rice plants separately. Least significant data (LSD) with 5% probability was used to compare significant treatments. The statistical analysis was done using Statistix 8.1 and IBM SPSS Statistics 2.0. The visualization of mean values was completed using Origin-Pro (2018). The correlation analysis was done using the R Package from Rstudio (RStudio Team, 2019), and the correlation matrix was visualized using the corrplot package.
3 Results
3.1 Scanning electron microscopy (SEM) analysis
The urea coated with sulfur nanoparticles shows heterogeneous morphology, which indicates variations in shape compared with uncoated urea. The SEM analysis shows a rough surface of NCU showing irregular cracks (Figure 1A). The observed cracks resulted from the granules pressing against each other during the storage process. The crystal appears more distinct with more detailed edges of the rough layers (Figure 1B), while the surface roughness becomes more evident at the highest magnification power (Figure 1C).
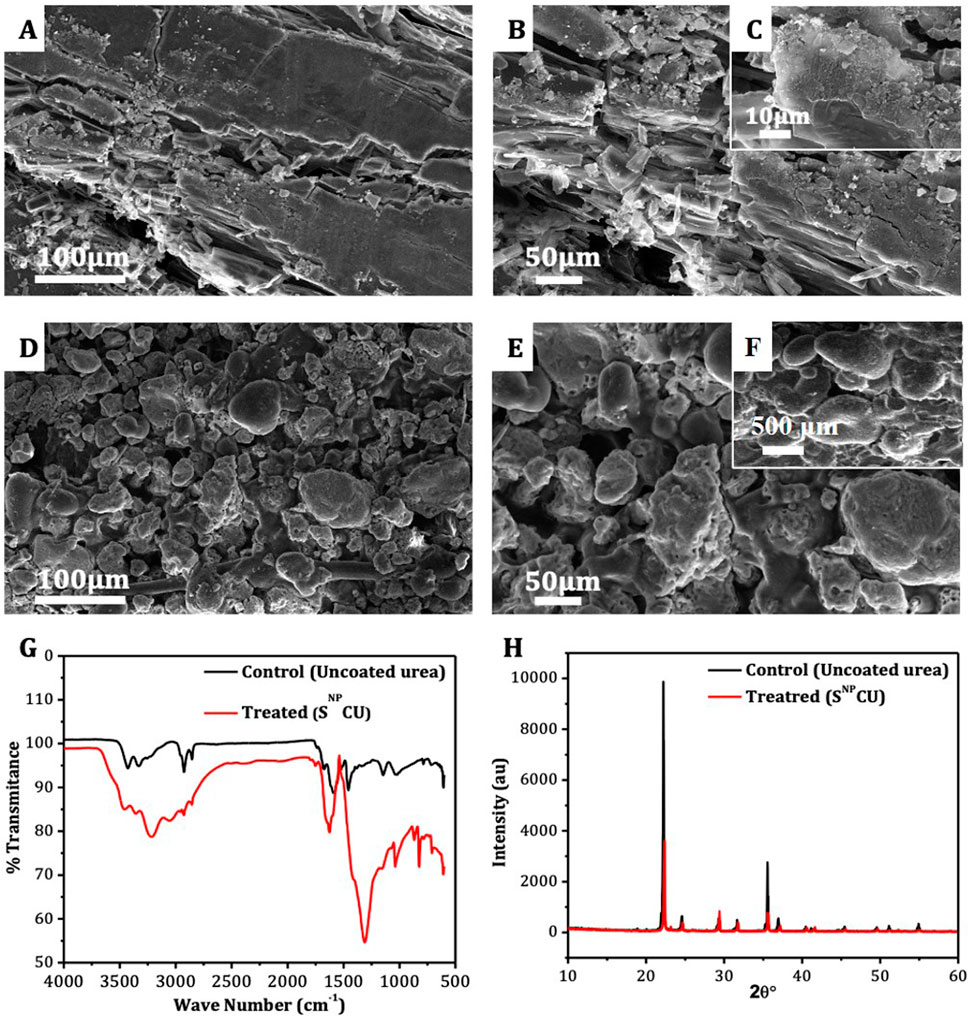
Figure 1. Scanning electron microscope images of (A) non-coated urea at 100 µm scale, (B) non-coated urea at 50 µm scale, (C) non-coated urea at 10 µm scale, (D) SNPCU at 100 µm scale, (E) SNPCU at 50 µm scale, (F) SNPCU at 500 µm scale, (G) FTIR of non-coated urea and SNPCU, and (H) XRD of non-coated urea and SNPCU.
Scanning electron microscopy analysis of SNPCU indicated the formation of SNP on the surface of urea. The presence of distinct irregularly shaped structures distributed over the surface of the urea indicated the successful deposition of SNP (Figures 1D–F). The deposition of SNP did not disturb the shape of the NCU. This shows that the nanoparticles adhered well without any structural deformation.
3.2 Fourier transform infrared spectroscopy (FTIR) and XRD analysis
The typical FTIR spectra of SNPCU and NCU are shown (Figure 1G). The identification of the free NH2 group conforms to the polymer-like structure. SNPCU has a mixed structural symbol of mono- or-di (hydroxymethyl) urease. The bond between 3,350 cm−1 and 3,450 cm−1 is an attribute of a hydrogen bond, an N-H bond, and an O-H bond, ascribed to the monomer of formaldehyde and water. No residual formaldehyde was found in polymers. SNPCU shows other characteristic peaks, amide I, II, and C=O, and they are shifted to a lower frequency than CU (Figure 1G). Many methylene bridges (N–CH2–N) were found, especially at 1,600–1,300 cm−1, which have higher C-H bond formation and show different sizes of multiple hydroxyl urea chains.
SNPCU has been characterized using X-ray diffraction analysis (Figure 1G). The XRD pattern of SNPCU matches with the sulfur reference of ICSD # 98-003-8,147 as shown (Figure 1H). Because the SNP was obtained by chemical synthesis, some degree of misfit peaks is expected. However, the major peaks observed at the 2θ value of 22° and 35° (Figure 1H) confirm the crystalline structure of urea. These peaks align with the Madhurambal and Mariappan (2010).
3.3 Effect of SNPCU application on wheat growth and yield
Generally, the growth of plants with the SNPCU application was better than that of the NCU plants (Figure 2). The analysis of variance shows that the plant growth was significantly (P < 0.05) improved by application of SNPCU compared to NCU (Table 1). Maximum shoot length was recorded with the application of SNPCU90 in both varieties, where Galaxy showed an increase of 35% in shoot length (SL: 66.7 cm) while FSD-2008 showed 23% (SL: 86.3 cm) over CU control plants. Root length (RL) response toward coated or non-coated urea was variable in both cultivars, where a relatively higher RL (11.3 g) was observed in non-coated than in SNPCU. Root fresh weight and dry weights showed a non-significant response toward application of NCU and SNPCU in both varieties. Flag leaf area was highest at SNPCU90 application in both varieties (16.3, 16.1), showing an increase of 10.3% and 7.3%, respectively, over the NCU control in Galaxy (14.8) and FSD-2008 (15).
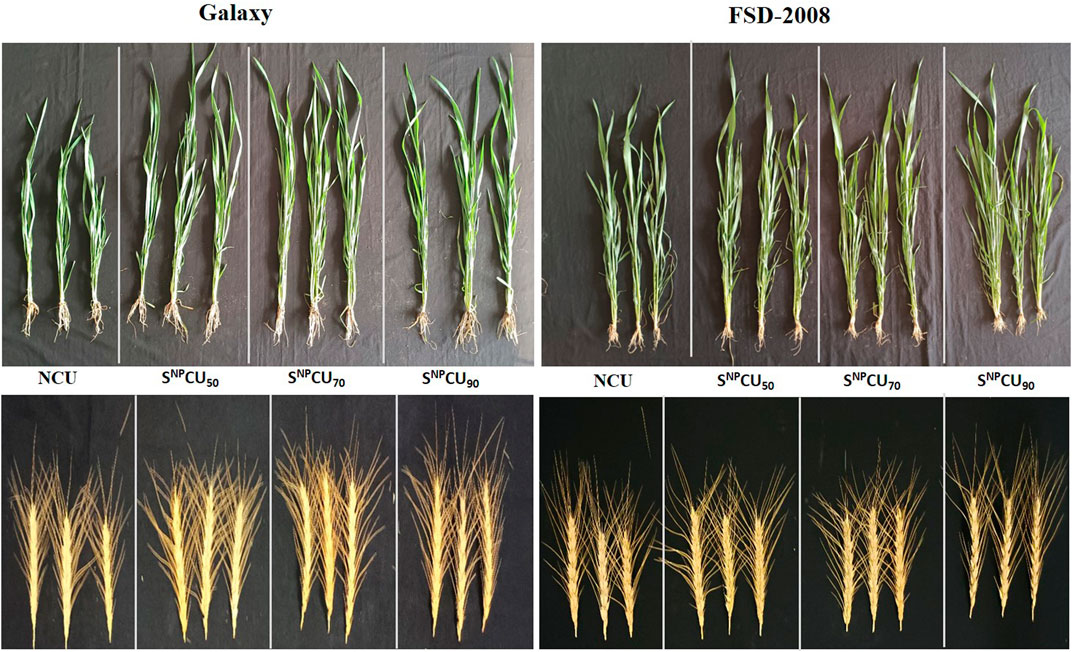
Figure 2. Representation of plant vegetative and reproductive growth (spikes) under different treatments of SNPCU and control (non-coated urea) in wheat.
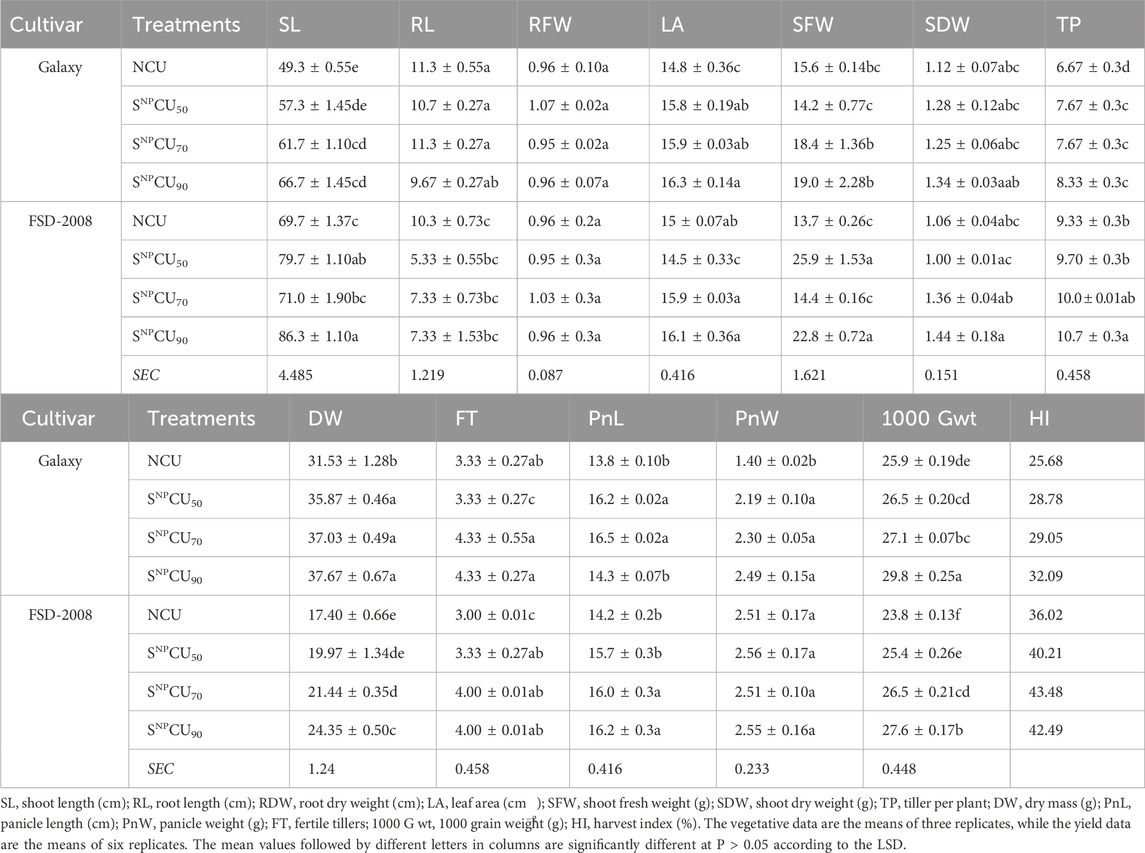
Table 1. Effect of different doses of SNPCU and NCU on the morphophysiological, biochemical, and yield attributes of two wheat varieties grown in pots.
Application of SNPCU significantly (P < 0.05) improved the number of tillers per plant in both varieties, where maximum tillering was observed at SNPCU90 application (10.7) and (8.33) in FSD-2008 and Galaxy, respectively, compared to NCU plant tillering (6.67). Similarly, the number of fertile tillers, length of panicle, and panicle weights were higher in SNPCU treatments than in non-coated urea treatments in both varieties (Table 1). FSD-2008 and Galaxy both showed a significant (P < 0.05) increase in 1000-grain weight with an increasing dose of SNPCU fertilizer compared to non-coated urea (Table 1). Maximum grain weight was exhibited in the plants at SNPCU90 application (P < 0.05) in Galaxy (29.8 g), followed by the same treatment of FSD-2008 (27.6 g) (Table 1). Minimum grain weights were observed in both varieties treated with NCU. Even the SNPCU50 application showed higher grain weight than the CU (Table 1).
3.4 Effect of SNPCU application on rice growth and yield
Generally, the growth of plants with the SNPCU application was better than the NCU plants (Figure 3). The application of SNPCU showed a significant (P < 0.05) effect on growth and yield parameters of Green Super Rice compared to Basmati 1121 (Table 2). The highest shoot length (80 cm) was observed in the SNPCU90 application in Green Super Rice. In treatments with SNPCU70, the shoot length was non-significantly different from NCU, demonstrating that SNPCU is as effective at lower doses than non-coated urea (Table 2). A similar significant (P < 0.05) response was observed for leaf area and shoot fresh and dry weights in these plants, where lower doses of SNPCU showed higher leaf area and shoot fresh weight and dry weight than NCU in both rice varieties. The effect on root length and root dry weight was non-differential and inconclusive. The maximum shoot fresh weight was recorded in Green Super Rice (20.3 g), while the minimum was observed in NCU (11 g) on Green Super Rice (Table 2).
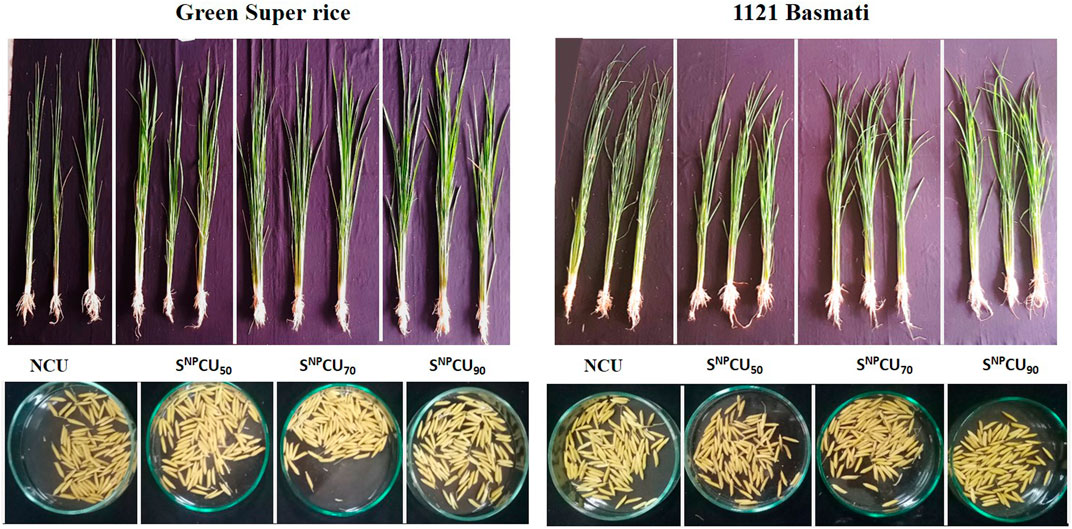
Figure 3. Representation of plant vegetative and reproductive growth (grains) under different treatments of SNPCU and control non-coated urea in rice.
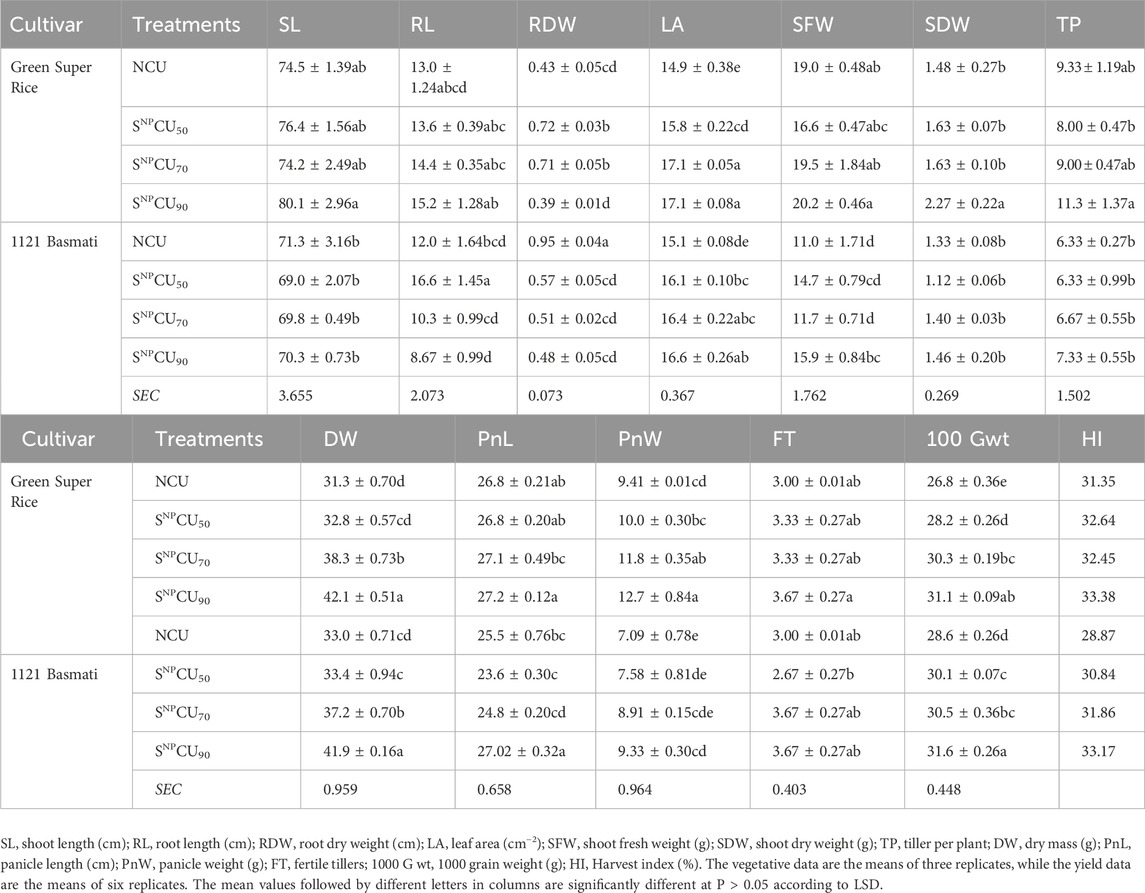
Table 2. Effect of different doses of SNPCU and NCU on the morphophysiological, biochemical, and yield attributes of two rice varieties grown in pots.
Regarding yield parameters, the response of Green Super Rice was significantly (P < 0.05) better than that of 1121 Basmati. At maturity, the highest biomass, panicle length, and tillering were observed under the treatment of SNPCU90 in both varieties compared to NCU (Table 2). The maximum fertile tillers were found at SNPCU90. Analysis of variance (P < 0.05) shows maximum panicle length in Basmati 1121 (27.02 cm) with SNPCU90 application, while the minimum was observed with NCU (25.5 cm). SNPCU significantly (P < 0.05) increased panicle weight (12.7 g) in Green Super Rice, while the lowest was observed with the application of NCU (7.09 g). Our result further revealed that grain weight was maximum in Basmati 1121 at SNPCU90 (31.6 g), followed by the same treatment of Green Super Rice (31.1 g). Minimum grain weights were observed in both varieties in NCU-treated plants. Even the SNPCU50 application showed higher grain weight than the NCU (Table 2). The largest harvest index was observed with the SNPCU90 application, while the lowest was found with NCU in Green Super Rice and 1121 Basmati.
3.5 Total and available N dynamics in soil
Total nitrogen (NT) and available nitrogen (NA) in soil after application of SNPCU showed a gradual increase or decrease over time in a dose-dependent manner (Figure 4). In wheat, SNPCU50 increased NT by 6.2%, 9.3%, 25%, and 26% in Galaxy and by 2.7%, 8%, 25%, and 32% in FSD-2008 on the 2nd, 7th, 14th, and 30th days, respectively. SNPCU90 shows maximum NT in soil with increases of 10%, 16%, 39%, and 39% in Galaxy and 11.5%, 22.8%, 37%2 and 63% in FSD-2008 on corresponding days (Figure 4A). Moreover, the application of SNPCU50 decreased NA content in soil by 45%, 30% and 40% in Galaxy and 30%, 31% and 31% in FSD-2008 on day 2. A similar trend was observed on days 7 and 14 (Figure 4B).
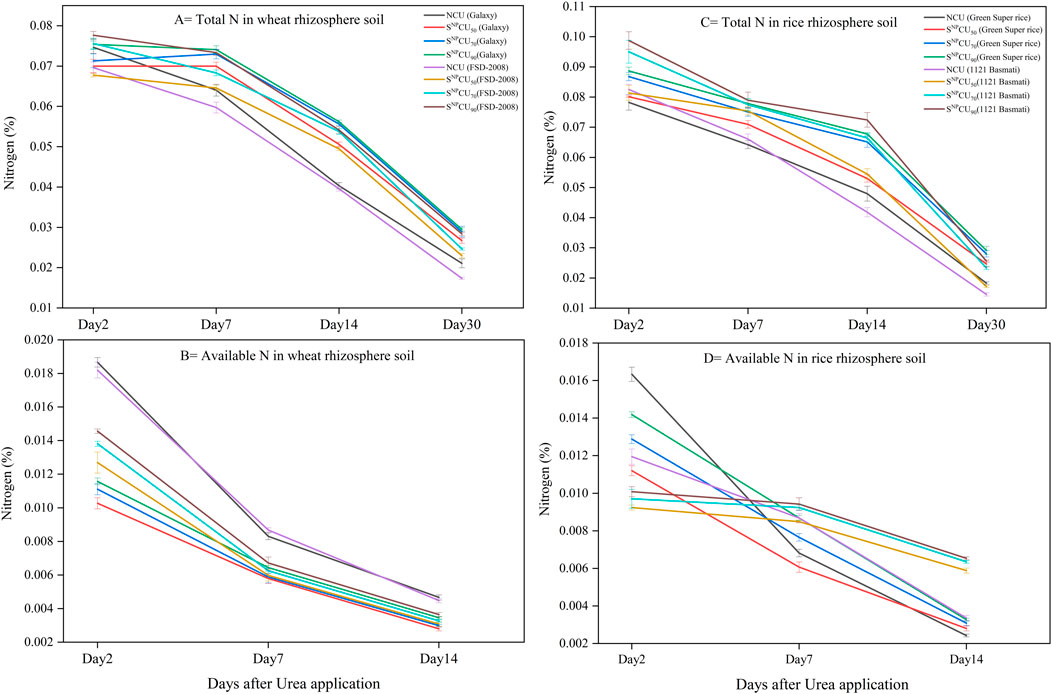
Figure 4. Dynamics of total nitrogen and available nitrogen in the rhizosphere at 7 cm of soil depth under different treatments of SNPCU and control (Non-coated urea). Total nitrogen (A) and available nitrogen (B) in wheat; total nitrogen (C) and available nitrogen (D) in rice rhizosphere soil. Control NCU: 100% recommended dose of urea, SNPCU50 (50% recommended dose of urea), SNPCU70 (70% recommended dose of urea), and SNPCU90 (90% recommended dose of urea). The vertical bars represent the standard deviation of the mean (n = 3).
A similar trend was observed in Green Super Rice rhizosphere soil, where the percentage increase in NT observed in SNPCU50 was 2.4%, 10%, 10%, and 34% while it was 1.3%%, 30% and 17% in 1121 Basmati on the 2nd, 7th, 14th, and 30th days, respectively. The maximum NT content in soil was observed @ SNPCU90 with an increase of 13%, 21%, 41%, and 59% in Green Super Rice and 19%, 19%, 73%, and 75% in 1121 Basmati on the 2nd, 7th, 14th, and 30th days, respectively (Figure 4C).
Furthermore, the application of SNPCU50 resulted in an initial decrease in NA content, showing decreases of 31.4% and 10.9% on day 2 and day 7 and an increase of 15.4% afterwards, that is, on day 14 in Green Super Rice. A similar trend was observed in 1121 Basmati, where SNPCU50 reduced NA by 22.4% and 2.1% on day 2 and day 7, followed by a 75% increase in NA on day 14 (Figure 4D).
3.6 Urease activity in soil
Urease activity of soil showed a gradual decrease after the application of SNPCU, where the higher dose showed higher activity and vice versa. The application of SNPCU90 resulted in the most significant (P < 0.05) decline in urease enzyme activity, with reductions of 37%, 10.44%, and 16.6% in Galaxy and 27.83%, 12.16%, and 16.6% in FSD-2008 on days 2, 7, and 14, respectively. A similar trend was observed in rice, where SNPCU90 reduced the urease enzyme by 38%, 26.25%, and 18% in Green Super Rice, while it reduced the urease enzyme by 52%, 16.7%, and 25.8% in 1121 Basmati (Figures 5A,B).
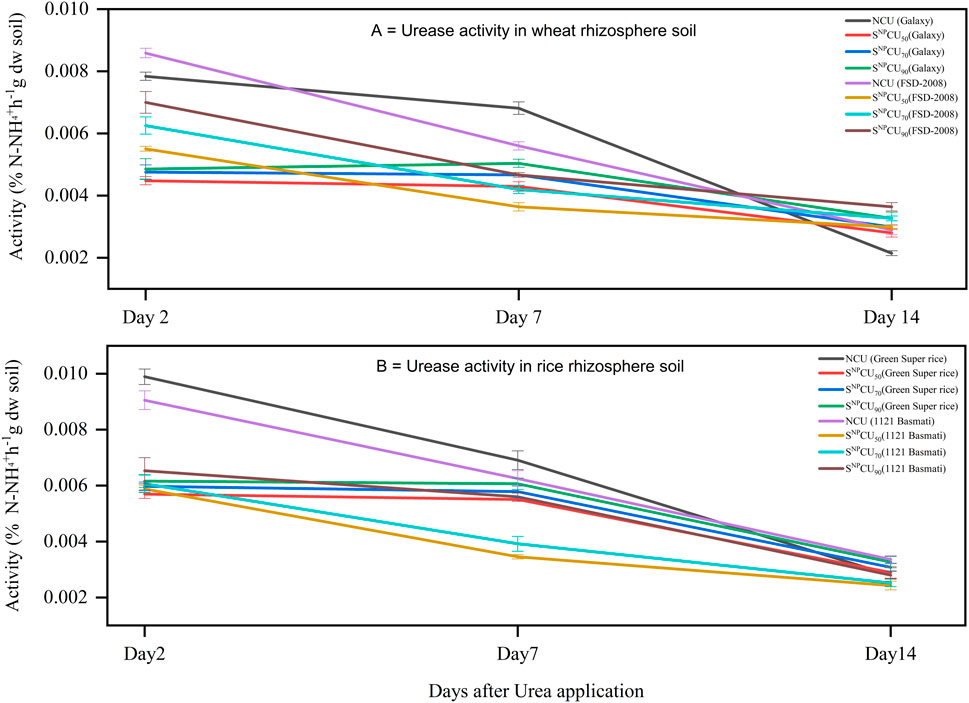
Figure 5. Dynamics of urease activity in the rhizosphere of wheat (A) and rice (B) at 7 cm of soil depth under different treatments of SNPCU and control non-coated urea. Control NCU: 100% recommended dose of urea, SNPCU50 (50% recommended dose of urea), SNPCU70 (70% recommended dose of urea), and SNPCU90 (90% recommended dose of urea). The vertical bars represent the standard deviation of the mean (n = 3).
3.7 Nitrogen uptake efficiency
Although wheat and rice grow during different seasons, the rates of uptake and accumulation of nitrogen in grain were significantly higher in SNPCU treatments. Our findings revealed that SNPCU increased total nitrogen uptake as the dose increased. The higher dose, that is, SNPCU90 showed higher N accumulation in grain and straw in both wheat varieties where the maximum was observed in Galaxy (64 and 14.91 kg h−1) with an increase of 1.29% and 0.14% over the respective variety NCU control, while the minimum (30.72 kg h−1 and 6.41 kg h−1) was observed in NCU plants of FSD-2008 (Table 3).
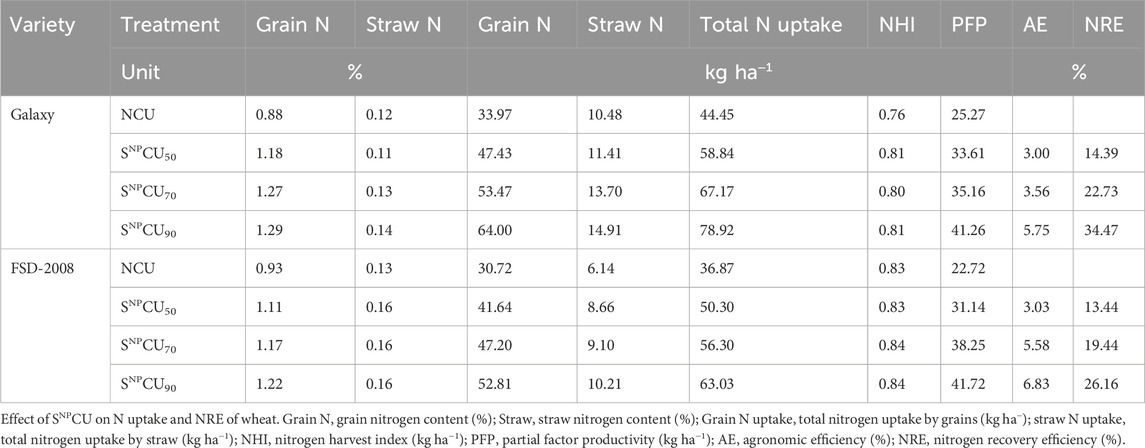
Table 3. Effect of SNPCU on N uptake and NRE of two wheat varieties grown in pots.
The agronomic efficiency (AE) and N recovery efficiency (NRE) increased as the dose of SNPCU increased (Table 3). Table 4 elaborates the effect of biological amendments on N uptake, AE, and NRE on rice. Application of SNPCU increased N content uptake in grain and straw. The highest dose, that is, SNPCU90, showed higher N content in grain and straw in both cultivars, with the maximum in Green Super Rice by 1.07% and 0.25%, respectively. The lowest N content was found in the control where NCU was applied (Table 4).
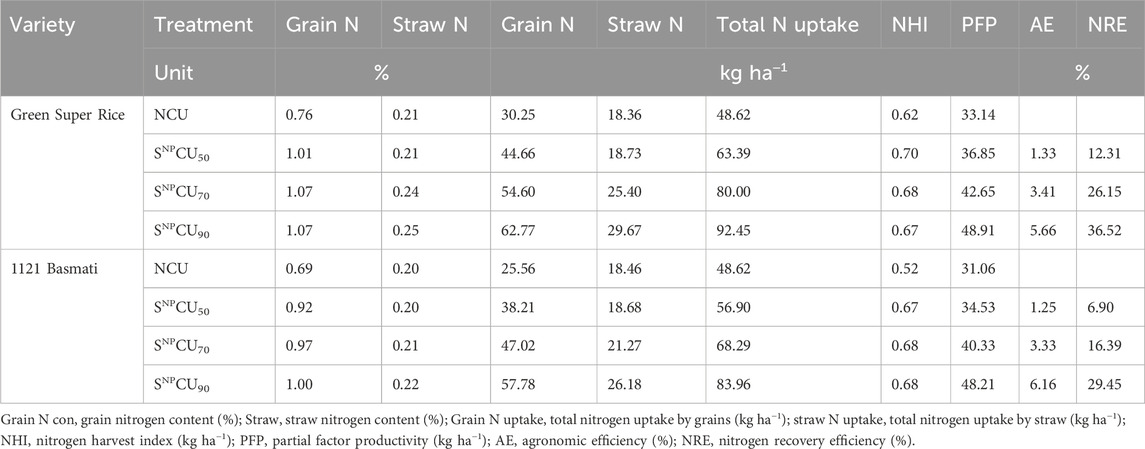
Table 4. Effect of SNPCU on N uptake and NRE of two rice varieties grown in pots.
In grains, the highest N uptake was recorded in Green Super Rice (62.77 kg ha−1) followed by 1121 Basmati (61.88 kg ha−1) in SNPCU90, while the lowest was observed in the control. The higher straw N uptake (29 and 26.18 kg ha−1) was obtained in SNPCU90 in both cultivars of rice, followed by the SNPCU70 and SNPCU50 treatments. Lower straw N uptake was recorded in NCU (Table 4).
Both cultivars of rice showed higher AE (5.66 and 6.16) in SNPCU90. The lowest agronomic efficiency (1.25) over the control was found in 1121 Basmati with SNPCU50. Table 4 shows that both varieties of rice show higher NRE (36.52 and 32.87) in SNPCU90 than the control. Treatment with SNPCU50 showed the lowest NRE (9.33) in 1121 Basmati.
3.8 Biochemical analysis
3.8.1 Chlorophyll content
Compared to the control, SNPCU significantly improved the chlorophyll (a, b) content in wheat and rice where maximum chlorophyll a content was exhibited in SNPCU treatment (0.6 mg/g and 0.12 mg/g FW), while it was the lowest in CU (0.4 and 0.04 mg/g FW) in wheat and rice, respectively.
Similarly, maximum chlorophyll b content was observed in SNPCU90 (0.1 mg/g and 0.8 mg/g FW) in rice and wheat, respectively, while the minimum was recorded in NCU (Figure 6).
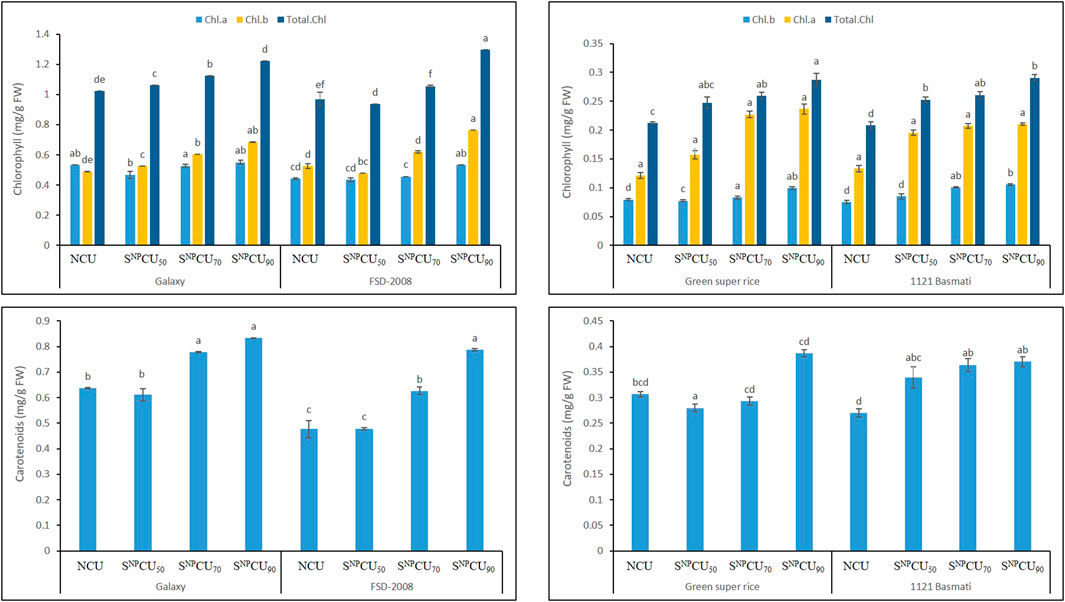
Figure 6. Effect of SNPCU on the chlorophyll and carotenoid content of two wheat and rice varieties grown in pots.
Overall, the results showed that SNPCU has a synergistic effect with total chlorophyll in rice and wheat, upon the longer availability of nitrogen in soil, which influenced the total chlorophyll content in plants. A higher application of SNPCU90 shows a maximum amount of (0.3 mg/g FW) and (1.3 mg/g FW) total chlorophyll content in rice and wheat. Furthermore, the data showed higher carotenoid content in SNPCU-treated plant leaves, while the minimum was shown by the leaves where NCU was applied (Figure 6).
3.8.2 Total sugar, reducing sugar, proline, total soluble protein, and free amino acid
SNPCU significantly enhanced total sugars and reducing sugars in wheat and rice in the following order: SNPCU90> SNPCU70> SNPCU50 >NCU, indicating a strong relationship between N release and plant sugars. The maximum total and reducing sugars were found in SNPCU90 (Figure 7), while the lowest was recorded in NCU in both cultivars of rice and wheat. A similar trend was observed for the proline content in rice and wheat.
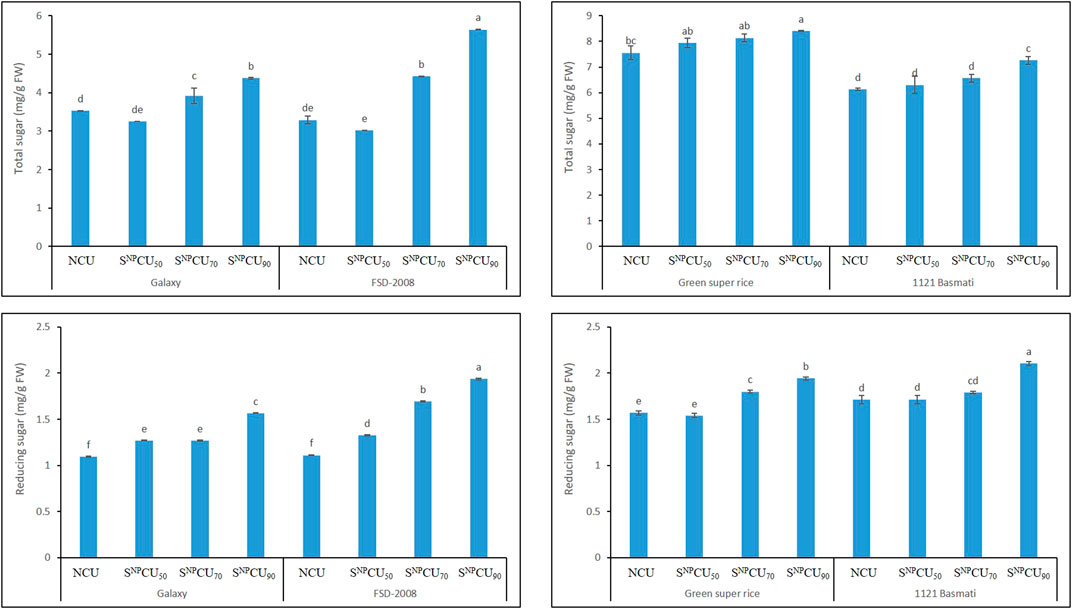
Figure 7. Effect of SNPCU on the total sugar and reducing sugar content of two wheat and rice varieties grown in pots.
The results shown in Figure 8 regarding protein content in plants indicate a synergistic effect with SNPCU. The maximum soluble protein (30 mg/g) was found with the application of SNPCU90 in wheat and rice plants (27 mg/g), while the minimum was recorded in NCU (21 mg/g FW). Regarding the free amino acid content, SNPCU slowly releases nitrogen in soil, allowing the plant to utilize nitrogen over a longer time than NCU. A higher value of free amino acids was found by the application of SNPCU90 in wheat and rice, while the minimum was recorded in NCU, which rapidly released nitrogen in the soil (Figure 9).
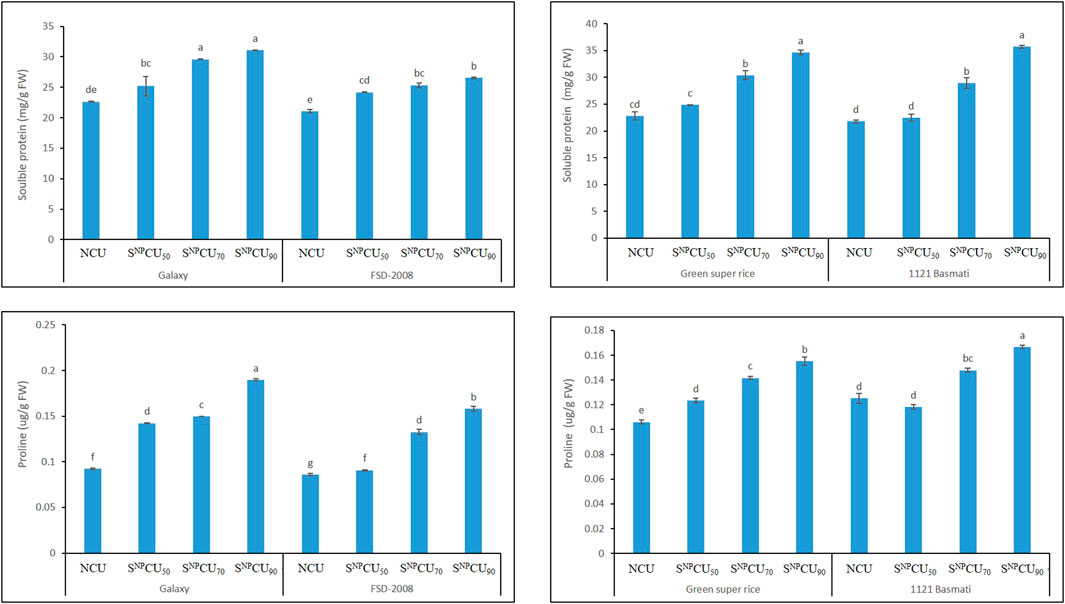
Figure 8. Effect of SNPCU on the soluble protein and proline content of two wheat and rice varieties grown in pots.
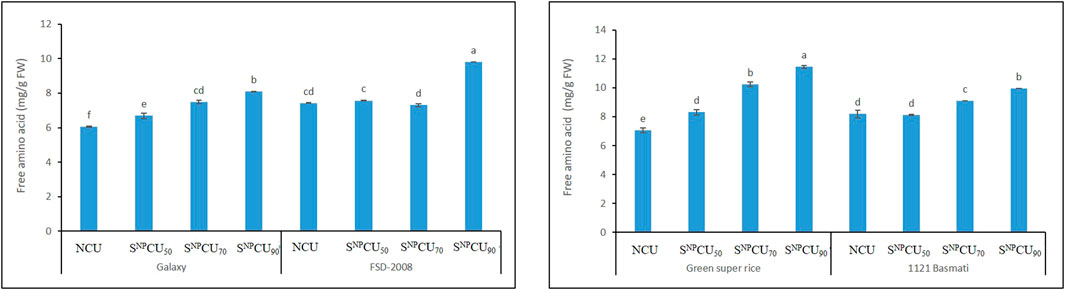
Figure 9. Effect of SNPCU on the free amino acid content of two wheat and rice varieties grown in pots.
3.9 Correlation analysis
Correlation analysis revealed a significant correlation (P < 0.05) between different parameters in wheat (Figure 10A), where a negative correlation was observed for RL with SL (r = −0.825*), SFW (r = −0.668), and RDW (r = −0.795*). On the other hand, a strong positive correlation was observed for 1,000 grain weight and plant N (r = 0.955**), plant N and Grain N (r = 0.912**), straw N and total reducing sugars (r = 0.938**), and proteins and SL (r = 0.918**). Significant positive correlations were also observed for other traits, for example, HI with total sugars (r = 0.815*), (r = 0.881*), proline (r = 0.794*), and soluble proteins (r = 0.744*). Biomass showed correlations with SL (r = 0.7*), SFW (r = 0.754*), and Plant N (r = 0.808*). Many other positive correlations were observed for plant parameters.
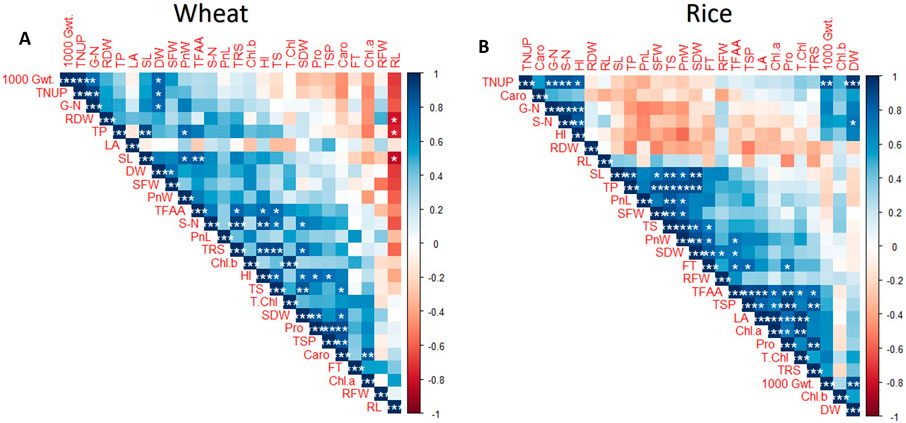
Figure 10. Correlation matrix for the biochemical, morphological, agronomical, and yield parameters of (A) wheat and (B) rice plants treated with SNPCU and NCU grown in pots.
In rice, correlation analysis revealed a significant correlation (P < 0.05) among different parameters studied (Figure 10B). A strong positive correlation was observed for SL and SDW (r = 0.912**), protein content (r = 0.903**), SFW with total sugars (r = 0.942**); Leaf area with total chlorophyll (r = 0.937**), chlorophyll a (r = 0.964**), free amino acids (r = 0.903**); biomass with plant N (r = 0.963**), 1000-grain wt (r = 0.844**), and grain N with straw N (r = 0.923**). SL was also positively correlated to total sugars (r = 0.854**), SDW with total proteins (r = 0.898**), fertile tillers (r = 0.849**), and total sugars (r = 0.826**). Many other positive correlations were observed in the analysis.
4 Discussion
The wheat-rice cropping system feeds billions of people around the world and is the major system consuming urea fertilizer in agriculture, but this system exhibits very low NUE. Due to environmental concerns, heavy losses, and low efficiency, coated urea fertilizers are becoming increasingly popular in farm fields. During the last decade, urea has been coated with polymers like polyethylene, polyurethane, bentonite, or oils. Although a polymer coating on urea increases its NUE, these polymers are not degradable and accumulate in the soil over time, which decreases soil fertility and is a serious environmental concern, as the polymers may break down into microplastics.
This study reports and evaluates the effect of SNPCU on plant growth and yield under natural environmental conditions. Several reports indicate a positive response of the plant to N and sulfur application. We have studied the synergistic response of urea coated with SNP. The SNPCU acts as a dual-purpose fertilizer as it makes application of N and S easy in the field. Our study reveals that SNPCU stimulates the plant’s biochemical and physiological machinery, for example, chlorophyll a, b, total carbohydrates, soluble sugars, and proteins, more than the CU. Similar was reported by earlier studies using coated urea with metallic S (Aziz and El-Ashry, 2002; Asghar et al., 2022). Sulfur increases wheat and rice shoot length, panicle length, shoot fresh weight (Khan et al., 2015; Asghar et al., 2022), and grain yields up to 10% (Asghar et al., 2022; Mandi et al., 2022). As a general observation, our study also exhibited a similar trend with SNPCU treatments. However, we observed that these treatments showed no effect on root growth, although a substantial increase in the shoot length, which was also evident by the negative correlation of root length with the shoot parameters. We anticipate that SNPCU might decrease sulfur deficiency in the soil with simultaneous improvement in N recovery and plant metabolic functioning. The same findings reported that SNP use efficiency enhances total free amino acid and protein content in peanut with the reduction of 25% conventional sulfur without harming the environment (Thirunavukkarasu et al., 2024).
The urea prill is highly soluble in water and a highly volatile compound, resulting in a high loss of N through either urease activity or volatilization. Coated urea has a fine layer of water-repellent compound, which improves its stability. The coating reduces both its solubility and its volatility. SNPCU slowly releases N in the soil, which makes maximum N content available in the soil over a long time, and the plants uptake maximum N. The SNPCU coating reduces N loss from urea, thus increasing N accessibility (Rose, 2016) and NUE (Shivay et al., 2016) for a long time.
Urease enzymes in the soil have a major role in accelerating the release of N from urea fertilizers. The N released from coated urea is influenced by the soil microbial activity, which can delay N release and decrease the soil urease activity of zinc-coated urea (Shakeel et al., 2024). Coating on urea acts as a urease inhibitor, as it becomes a barrier between urease bacteria and urea. This inhibits the urease enzyme activity in soil by 6–8 weeks and reduces the hydrolysis of urea (Shaviv, 2001; Bolan et al., 2004). The relationship between SNPCU and urease enzyme activity is crucial for N cycling and crop productivity. SNPCU, due to its coating, delays urease enzyme activity and results in long-term N availability, N transformation, minimized N loss, improved NUE, and enhanced crop growth and yield. Our results show that the highest urease enzyme activity was in the soils where the application of NCU was done, while the minimum was in SNPCU until 14 days of application in both cultivars of wheat and rice.
Application of slow-release urease increases N content in plant tissue due to longer N availability in the soil after its application. Our study reveals that the application of SNPCU increased the N concentration in plant straw and grains as the dose increased in both cultivars of wheat and rice. SNPCU application resulted in a maximum amount of N uptake in leaves, which ultimately increased the N content in grains and maximum grain yield and weight in both crops. Similar findings were reported by Mirbolook et al. (2023) and Hayat et al. (2024), who showed that NH4+ and NO3− status in plant tissue improve with the slow-release fertilizer. Yan et al. (2024) reported that the application of a higher dose of uncoated urea prill in rice accelerates N loss while coated urea releases N gradually, which matches the plant’s demand for N. This helps plants absorb N and accumulate biomass, ultimately which translates into higher yield (Wang et al., 2016), as observed during the present study.
Application of SNPCU maintains a higher NT level and lower NA over an extended period due to its gradual hydrolysis, reducing N losses and ensuring efficient N cycling, which contributes to long-term N availability during crucial crop growth stages. Furthermore, NCU rapidly hydrolyzes into ammonium (NH4+) and nitrate (NO3−), leading to greater N loss through volatilization, leaching, and runoff. It has been reported that the application of a higher dose of NCU in rice accelerates N loss while coated urea releases N gradually, which matches the plant’s N demand (Wang et al., 2016). Our result shows that compered to non-coated urea, SNPCU increased NT and decrease NA in both varieties of wheat and rice over a 30-day period.
The mechanism behind better outcomes of SNPCU for minimizing N loss and improved NUE and plant growth can be attributed to the following points. First, the application of SNPCU reduced N and sulfur loss due to adsorption/retention properties as an adsorbent material. Second, the application of SNPCU enhanced soil mineral N for plant uptake over a maximum time period. The partial factor productivity has a positive correlation with N. Application of SNPCU significantly improved the partial factor productivity, where a maximum was observed with SNPCU90 of 48.91% and 48.21% in Green Super Rice and 1121 Basmati, respectively. Correlation analysis further supports the fact that SNPCU significantly improved grain weight and biomass due to improved N uptake (grain and straw) and proline content, as they showed a significant positive correlation with each other. Similarly, the application of SNPCU90 increases partial factor productivity by 41.26% and 41.71% in Galaxy and FSD-2008, respectively. Our findings show that the application of SNPCU increased the nitrogen harvest index (NHI), nitrogen recovery efficiency (NRE), and agronomic efficiency (AE) in both cultivars of wheat and rice in a dose-dependent manner. These findings are in line with Hayat et al. (2024) and Rose et al., (2018), who reported that AE has a positive correlation with N uptake by plants.
5 Conclusion
The study revealed that SNPCU is more effective in terms of NUE, inexpensive in terms of fertilizer saving, eco-friendly in terms of low N losses, and has SNP as an essential component for an added benefit. Among different treatment applications, SNPCU increased total and available nitrogen in soil in a dose-dependent manner. The plant experiments revealed that the application of SNPCU improved growth, yield attributes, biochemical traits, and nitrogen use efficiency, showing higher N uptake by plants and grains than uncoated urea. A few studies report some negative impact of SNP in soil if used in large amounts, for example, altering soil structure, lowering soil pH, and possibly impacting microbial communities or nutrient availability. However, we have used these nanoparticles in very small quantities for coating that will not cause any such harm to the soil. Furthermore, we have conducted a whole metagenome analysis of these nanoparticles in detail (unpublished data not part of this study) that shows no harmful impact on resident microbial communities. However, the long-term impact of any nanoparticles used in agriculture is still not clear. The addition of SNP to urea is relatively costly, but this cost will be reduced by reducing the amount of coated urea application per acre. Hence, we conclude that SNPCU is a better fertilizer than coated urea, and it will supply a slow amount of nitrogen and sulfur to the plant. Further field trials are necessary to validate these findings across different regions and soil types.
Data availability statement
The original contributions presented in the study are included in the article/supplementary material; further inquiries can be directed to the corresponding author.
Author contributions
AF: Data curation, Formal analysis, Methodology, Validation, and Writing – original draft. AI: Conceptualization, Data curation, Project administration, Resources, Supervision, and Writing – review and editing. HR: Formal analysis, Investigation, Software, Supervision, Visualization, and Writing – review and editing. MI: Data curation, Resources, Software, and Writing – review and editing. AR: Investigation, Methodology, Validation, and Writing – review and editing.
Funding
The author(s) declare that no financial support was received for the research and/or publication of this article.
Conflict of interest
The authors declare that the research was conducted in the absence of any commercial or financial relationships that could be construed as a potential conflict of interest.
Generative AI statement
The author(s) declare that no Generative AI was used in the creation of this manuscript.
Publisher’s note
All claims expressed in this article are solely those of the authors and do not necessarily represent those of their affiliated organizations, or those of the publisher, the editors and the reviewers. Any product that may be evaluated in this article, or claim that may be made by its manufacturer, is not guaranteed or endorsed by the publisher.
References
Ahmed, M., Raza, S., Elrys, A. S., Lei, M., Chen, Z., and Zhou, J. (2024). Urease inhibitor N-(n-butyl) thiophosphoric triamide (NBPT) application as a mitigating strategy of ammonia volatilization from different loess soils of China. J. Soil Sci. Plant Nutr. 24 (3), 5854–5867. doi:10.1007/s42729-024-01946-z
Arnon, D. I. (1949). Copper enzymes in isolated chloroplasts. Polyphenoloxidase in Beta vulgaris. Plant Physiol. 24 (1), 1–15. doi:10.1104/pp.24.1.1
Asghar, M. G., Ikram, R. M., Hashim, S., Hussain, S., Irfan, M., Mubeen, K., et al. (2022). Sulphur coated urea improves morphological and yield characteristics of transplanted rice (Oryza sativa L.) through enhanced nitrogen uptake. J. King Saud University-Science 34 (1), 101664. doi:10.1016/j.jksus.2021.101664
Aziz, E. E., and El-Ashry, S. M. (2002). The influence of slow release and conventional nitrogen fertilizers on plant growth and chemical constituents of Cymbopogon citratus hort. grown sandy soil. J. Plant Prod. 27 (5), 3333–3346. doi:10.21608/jpp.2002.254717
Bates, L. S., Waldren, R. P. A., and Teare, I. D. (1973). Rapid determination of free proline for water-stress studies. Plant soil 39, 205–207. doi:10.1007/bf00018060
Bolan, N., Saggar, S., and Singh, J. (2004). The role of inhibitors in mitigating nitrogen losses in grazed pasture. N. Z. Soil News 42, 42.
Bradford, M. M. (1976). A rapid and sensitive method for the quantitation of microgram quantities of protein utilizing the principle of protein-dye binding. Anal. Biochem. 72 (1-2), 248–254. doi:10.1016/0003-2697(76)90527-3
Bremner, J. M., and Mulvaney, C. S. (1982). Nitrogen—total. Methods soil analysis part 2. Chem. Microbiol. Prop. 9, 595–624. doi:10.2134/agronmonogr9.2.2ed.c31
Concon, J. M., and Soltess, D. (1973). Rapid micro Kjeldahl digestion of cereal grains and other biological materials. Anal. Biochem. 53 (1), 35–41. doi:10.1016/0003-2697(73)90405-3
de Vries, W. (2021). Impacts of nitrogen emissions on ecosystems and human health: a mini review. Curr. Opin. Environ. Sci. and Health 21, 100249. doi:10.1016/j.coesh.2021.100249
DuBois, M., Gilles, K. A., Hamilton, J. K., Rebers, P. T., and Smith, F. (1956). Colorimetric method for determination of sugars and related substances. Anal. Chem. 28 (3), 350–356. doi:10.1021/ac60111a017
Guardia, G., Sanz-Cobena, A., Sanchez-Martín, L., Fuertes-Mendizábal, T., González-Murua, C., Álvarez, J. M., et al. (2018). Urea-based fertilization strategies to reduce yield-scaled N oxides and enhance bread-making quality in a rainfed Mediterranean wheat crop. Agric. Ecosyst. and Environ. 265, 421–431. doi:10.1016/j.agee.2018.06.033
Hamilton, P. B., Van Slyke, D. D., and Lemish, S. (1943). The gasometric determination of free amino acids in blood filtrates by the ninhydrin-carbon dioxide method. J. Biol. Chem. 150, 231–250. doi:10.1016/s0021-9258(18)51268-0
Hassan, M. U., Guoqin, H., Arif, M. S., Mubarik, M. S., Tang, H., Xu, H., et al. (2024). Can urea coated fertilizers be an effective means of reducing greenhouse gas emissions and improving crop productivity. J. Environ. Manag. 367, 121927. doi:10.1016/j.jenvman.2024.121927
Hayat, A., Jilani, G., Jalil, S., Iqbal, T., Rasheed, M., Chaudhry, A. N., et al. (2024). Combining urea with chemical and biological amendments differentially influences nitrogen dynamics in soil and wheat growth. ACS omega 9 (30), 32617–32627. doi:10.1021/acsomega.4c01451
Henson, C. A., and Stone, J. M. (1988). Variation in α-amylase and α-amylase inhibitor activities in barley malts. J. Cereal Sci. 8 (1), 39–46. doi:10.1016/S0733-5210(88)80047-X
Huang, J., Duan, Y. H., Xu, M. G., Zhai, L. M., Zhang, X. B., Wang, B. R., et al. (2017). Nitrogen mobility, ammonia volatilization, and estimated leaching loss from long-term manure incorporation in red soil. J. Integr. Agric. 16 (9), 2082–2092. doi:10.1016/S2095-3119(16)61498-3
Ibrahim, K. R. M., Babadi, F. E., and Yunus, R. (2014). Comparative performance of different urea coating materials for slow release. Particuology 17, 165–172. doi:10.1016/j.partic.2014.03.009
Khan, A. Z., Ali, B., Afzal, M., Wahab, S., Khalil, S. K., Amin, N., et al. (2015). Effects of sulfur and urease coated controlled release urea on dry matter yield, N uptake and grain quality of rice. J. Animal and Plant Sci. 25 (3). Available online at: https://www.thejaps.org.pk/docs/v-25-03/12.pdf.
Lapushkin, V. M., Lapushkina, A. A., and Torshin, S. P. (2024). Effect of coated urea and NPK fertilizers on spring wheat yield and nitrogen use efficiency. Braz. J. Biol. 84, 279269. doi:10.1590/1519-6984.279269
Ma, Q., Tao, R., Jia, W., Zhu, M., Ding, J., Li, C., et al. (2024). Split application of polymer coated urea combined with common urea improved nitrogen efficiency without sacrificing wheat yield and benefits while saving 20% nitrogen input. Front. Plant Sci. 15, 1321900. doi:10.3389/fpls.2024.1321900
Madhurambal, G., and Mariappan, M. (2010). Growth and characterization of urea-thiourea non-linear optical organic mixed crystal. Available online at: http://nopr.niscpr.res.in/handle/123456789/7645.
Mandi, S., Shivay, Y. S., Prasanna, R., Kumar, D., Purakayastha, T. J., Pooniya, V., et al. (2022). Improving micronutrient density in basmati rice and durum wheat through summer green manuring and elemental sulfur fertilisation. Crop Pasture Sci. 73, 804–816. doi:10.1071/CP21313
Mirbolook, A., Sadaghiani, M. R., Keshavarz, P., and Alikhani, M. (2023). New slow-release urea fertilizer fortified with zinc for improving zinc availability and nitrogen use efficiency in maize. ACS omega 8 (48), 45715–45728. doi:10.1021/acsomega.3c06013
Mustafa, A., Athar, F., Khan, I., Chattha, M. U., Nawaz, M., Shah, A.N., et al. (2022). Improving crop productivity and nitrogen use efficiency using sulfur and zinc-coated urea: a review. Front. Plant Sci. 13, 942384. doi:10.3389/fpls.2022.942384
Pjnflv, B. (2016). Sulphur coated urea. Available online at: https://www.researchgate.net/publication/301799338.
Pooniya, V., Shivay, Y., Pal, M., and Bansal, R. (2018). Relative performance of boron, sulphur and zinc coatings onto prilled urea for increasing productivity and nitrogen use efficiency in maize. Experimental Agriculture. 54 (4), 577–591.
Rana, M. A., Mahmood, R., and Ali, S. (2021). Soil urease inhibition by various plant extracts. Plos one 16 (10), 0258568. doi:10.1371/journal.pone.0258568
Rose, T. J. (2016). Polymer-coated urea delays growth and accumulation of key nutrients in aerobic rice but does not affect grain mineral concentrations. Agronomy 6 (1), 9. doi:10.3390/agronomy6010009
Rose, T. J., Wood, R. H., Rose, M. T., and Van Zwieten, L. (2018). A re-evaluation of the agronomic effectiveness of the nitrification inhibitors DCD and DMPP and the urease inhibitor NBPT. Agric. Ecosyst. and Environ. 252, 69–73. doi:10.1016/j.agee.2017.10.008
Sanz-Cobena, A., Misselbrook, T. H., Arce, A., Mingot, J. I., Diez, J. A., and Vallejo, A. (2008). An inhibitor of urease activity effectively reduces ammonia emissions from soil treated with urea under Mediterranean conditions. Agric. Ecosyst. and Environ. 126 (3-4), 243–249. doi:10.1016/j.agee.2008.02.001
Shakeel, S., Mahmood, R., Fatima, A., Nadeem, F., Ali, S., Ali, N., et al. (2024). Iron (Fe) and zinc (Zn) coated urea application enhances nitrogen (N) status and bulb yield of onion (A. cepa) through prolonged urea-N stay in alkaline calcareous soil. Sci. Hortic. 336, 113421. doi:10.1016/j.scienta.2024.113421
Shankar, S., and Rhim, J. W. (2018). Preparation of sulfur nanoparticle-incorporated antimicrobial chitosan films. Food Hydrocoll. 82, 116–123. doi:10.1016/j.foodhyd.2018.03.054
Shaviv, A. (2001). Improvement of fertilizer efficiency-product processing, positioning and application methods. doi:10.5555/20013099265
Shivay, Y. S., Pooniya, V., Pal, M., Ghasal, P. C., Bana, R., and Jat, S. L. (2019). Coated urea materials for improving yields, profitability, and nutrient use efficiencies of aromatic rice. Glob. Challenges 3 (12), 1900013. doi:10.1002/gch2.201900013
Shivay, Y. S., Pooniya, V., Prasad, R., Pal, M., and Bansal, R. J. C. R. C. (2016). Sulphur-coated urea as a source of sulphur and an enhanced efficiency of nitrogen fertilizer for spring wheat. Cereal Res. Commun. 44 (3), 513–523. doi:10.1556/0806.44.2016.002
Svane, S., Sigurdarson, J. J., Finkenwirth, F., Eitinger, T., and Karring, H. (2020). Inhibition of urease activity by different compounds provides insight into the modulation and association of bacterial nickel import and ureolysis. Sci. Rep. 10 (1), 8503. doi:10.1038/s41598-020-65107-9
Tabatabai, M. A., and Bremner, J. M. (1972). Assay of urease activity in soils. Soil Biol. Biochem. 4 (4), 479–487. doi:10.1016/0038-0717(72)90064-8
Thirunavukkarasu, M., Subramanian, K. S., and Yuvaraj, M. (2024). Response studies of nano-sulphur on nutrient uptake, sulphur fractions, yield and quality parameters of peanut (Arachis hypogaea L.). J. Plant Nutr. 47 (7), 1079–1088. doi:10.1080/01904167.2023.2294931
Wang, H., Hegazy, A. M., Jiang, X., Hu, Z., Lu, J., Mu, J., et al. (2016). Suppression of ammonia volatilization from rice–wheat rotation fields amended with controlled-release urea and urea. Agron. J. 108 (3), 1214–1224. doi:10.2134/agronj2015.0295
Xu, R., Fu, J., Zhang, Y., Sun, Z., Xu, Y., Zhang, W., et al. (2024). Combination of Polymer-coated urea and rapid-release urea increases grain yield and Nitrogen use efficiency of rice by improving root and shoot activities. Agronomy 14 (7), 1585. doi:10.3390/agronomy14071585
Keywords: wheat, rice, sulphur nanoparticles, nitrogen use efficiency, urea
Citation: Faraz A, Imran A, Raza H, Iqbal M and Rehman A (2025) Sulfur nanoparticle-coated urea improves growth and nitrogen use efficiency in wheat (Triticum aestivum L.) and rice (Oryza sativa L.). Front. Nanotechnol. 7:1565608. doi: 10.3389/fnano.2025.1565608
Received: 23 January 2025; Accepted: 09 June 2025;
Published: 21 July 2025.
Edited by:
Xiaoping Xin, University of Missouri, United StatesReviewed by:
Jagriti Behal, Sri Sai University, IndiaSahil Tahiliani, Applied Materials, United States
Copyright © 2025 Faraz, Imran, Raza, Iqbal and Rehman. This is an open-access article distributed under the terms of the Creative Commons Attribution License (CC BY). The use, distribution or reproduction in other forums is permitted, provided the original author(s) and the copyright owner(s) are credited and that the original publication in this journal is cited, in accordance with accepted academic practice. No use, distribution or reproduction is permitted which does not comply with these terms.
*Correspondence: Asma Imran, YXNtYWFzbGFtMjAwMUB5YWhvby5jb20=