 E. Batista
 Rui F. Martins
 Vania Silverio
 Isabel Godinho1
- 1Metrology Department, Instituto Português da Qualidade, Caparica, Portugal
- 2NOVA School of Science and Technology, Caparica, Portugal
- 3INESC MN Microsistemas e Nanotecnologias, Lisboa, Portugal
- 4Department of Physics, Instituto Superior Tecnico, Universidade de Lisboa, Lisboa, Portugal
The lack of established protocols and standards for calibrating flow measuring instruments operating in the microflow range raises concerns about the reliability and precision of such measurements results. This work focuses on developing and improving innovative calibration methodologies to enhance the accuracy of microflow and nanoflow measurements. The gravimetric method already implemented at IPQ from 120 μL/h to 2000 mL/h was used and improved for low flow rates down to 10 μL/h. Additionally, three other optical methods were developed to calibrate micro/nano flows in a non-intrusive way: the interferometric, pending drop and front track. The methodology best suited for each specific flow instrument (e.g., syringe pumps and flow meters) and each for measurement range, with the lowest uncertainty, was successfully identified during this work. Also, it was possible to increase the measuring range of the Portuguese Institute for Quality–Volume and Flow Laboratory (IPQ-LVC) down to 5 nL/min (0.3 μL/h) with a 3% target uncertainty (k = 2). This was not only achieved but improved further with the interferometric method, where measurements were performed down to 1.6 nL/min (0.1 μL/h) with 2% uncertainty (k = 2). Furthermore, this method was external validated by a comparison performed under the EURAMET project 1508. The methodologies here described were the basis of the development of EURAMET guide cg 27 - Guidelines for the Calibration of Drug Delivery Devices and Infusion Device Analysers. This document provides standardized procedures for testing microflow and nanoflow instruments aiming to improve the accuracy and comparability of measurement results.
1 Introduction
Metrology, the science of measurement, plays a crucial role in ensuring the accuracy and reliability of flow measurements across various applications. Flow measurements are essential in numerous fields, including healthcare, pharmaceuticals, environmental monitoring, microfluidic technology and industrial processes. Accurate flow measurement is vital for maintaining product quality, ensuring safety, and optimizing performance but most of the instruments used to measure flow rate, especially in health applications and particularly those operating at the micro and nanoscale, have not been sufficiently studied regarding their flow accuracy and traceability. This lack of comprehensive research and validation raises concerns about the reliability and precision of these measurements, which are critical for ensuring patient safety and effective treatment outcomes. Furthermore, the absence of established protocols and standards for calibrating these instruments at such low flow ranges exacerbates the issue. Without standardized calibration procedures, it is challenging to verify the accuracy of flow measurements, leading to potential discrepancies and inconsistencies in the results. Addressing these gaps through rigorous studies and the development of robust calibration methods is essential for advancing the reliability and efficacy of flow rate measurements. In this work, new methodologies for calibration of syringe pumps, flow meters and microfluidic chips were developed and validated. The primary objective of this work is to enhance the gravimetric procedure described by Bissig et al. (Batista et al., 2020a) and to develop three innovative methods to ensure the traceability of micro and nanoflow measuring instruments. These instruments are increasingly being introduced to the market and are used in various applications, such as healthcare. In this work, various calibration methods were employed to measure flow, including gravimetry and newly developed techniques such as interferometry, pending drop, and the front track method. The front track method, in particular, was also described by Ogheard et al. (Bissig et al., 2015).
The gravimetric method, currently used at the IPQ-LVC laboratory, was improved and the lower limit 120 μL/h was extended to 10 μL/h. In the interferometry technique, an interferometer is used to measure the distance travelled by a pusher block of a syringe pump, over time, to determine the flow rate. The pending drop method uses high-resolution cameras to determine the growth of a drop over time. In the front track method, the cameras follow the meniscus of the liquid displacement in a close tube over time.
The methods developed in this work were validated internally or externally by the participation of IPQ-LVC in the EURAMET pilot project 1508 (Batista et al., 2020b).
The information described in this paper was the basis for the development of EURAMET guide cg 27 - Guidelines for the Calibration of Drug Delivery Devices and Infusion Device Analysers (EURAMET guide cg 27, 2024).
The development of the new methods has also allowed flow measurements (Batista et al., 2024) to be extended to another field–microfluidics and led to the publication of a new EURAMET Technical Guide 4 - Evaluation of flow related quantities in microfluidic devices (EURAMET, 2024).
2 Methods
The gravimetric method, interferometric method, front track and pending drop method were used to calibrate various microflow measuring instruments, namely, syringes pumps, flow meters and microfluidic chips in different flow ranges. The results were compared in terms of % of error and uncertainty mainly due to manufactures specification information. In general, 20 to 30 points were collected in each performed test.
2.1 Gravimetric method
The primary method used for flow determination is the gravimetric method (EURAMET, 2022), which involves weighing the mass of water delivered over a fixed period (Figure 1). The flow rate is calculated as the quotient of the mass of the reference liquid, typically water with specific characteristics, and the time interval, with corrections for buoyancy, evaporation, and fluid properties. This method is widely adopted by several National Metrology Institutes globally and is applied across a broad range of applications.
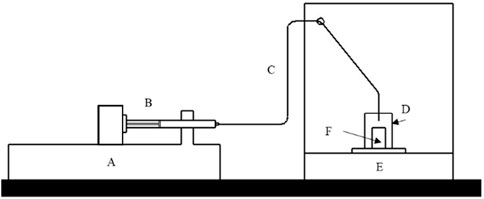
Figure 1. Gravimetric schematic of the flow circuit. The fluid goes from a glass syringe (B) of a flow generator (A) to the balance (E) through tubing (C) that is immersed in the weighing vessel (F) that is inside an evaporation trap (D).
At IPQ, a microflow setup was developed, consisting of two different assemblies using METTLER balances: an AX 26 with a resolution of 0.001 mg and a maximum capacity of 20 g, and an XP 2015 with a resolution of 0.01 mg and a maximum capacity of 220 g. In both assemblies, mass and time data are acquired and statistically processed using an application developed in LABVIEW software. Several tube diameters from 0.09 cm to 0.32 cm and different types and sized of plastic and glass syringes were used in the setup.
The setup was applied to calibrate syringe pumps, flow meters and microflow chips. The uncertainty components of this method are described in Table 1. The uncertainty calculation was determined based on the Guide to the expression of uncertainty in measurement, GUM (BIPM et al., 2008) and can be found in detail in (Sousa et al., 2021).
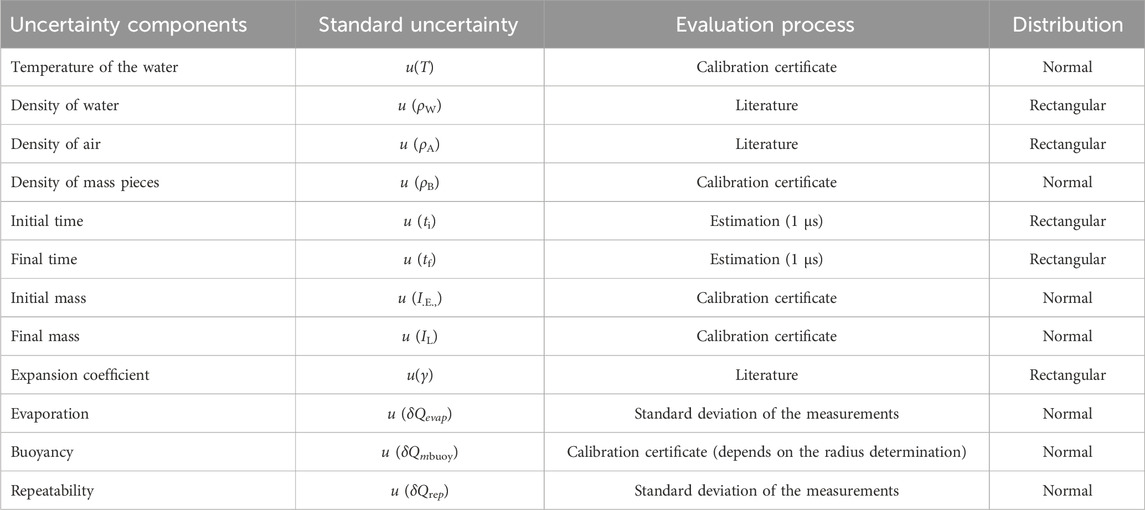
Table 1. Uncertainty components of the gravimetric method.
2.2 Interferometric method
The interferometric method developed (Batis et al., 2020) incorporates a laser unit (Hewlett-Packard, model 5528 A) operating at 633 nm, with signal processing managed by a LABVIEW script specifically developed for this purpose. The optical arrangement consists of two retroreflector cubes, complemented by a control unit, a pusher block, a flow generator, and a syringe. Figure 2 illustrates an example of the experimental setup.
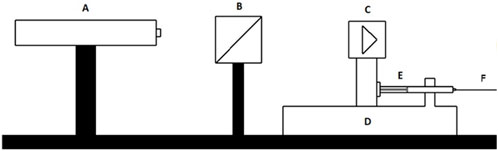
Figure 2. Interferometric schematic. (A) Is the interferometer, (B) and (C) are retroreflector cubes, (D) is a flow generator, (E) is a glass syringe that is filled with the calibration fluid connected to a tubing (F).
In practice, the flow generation was accomplished by a stepper motor that drove a screw connected to a pusher block that itself pushed the syringe piston. One of the reflector cubes was added on top of this pusher block.
Knowing the internal diameter of the syringe (made of glass or plastic) with very high precision (see 2.5), the travelled distance, and the time needed for that travelled distance (elapse time), it is possible to calculate the flow rate of the fluid inside the syringe.
This method was used to calibrate flow meters and syringe pumps.
The uncertainty components of this method are described in Table 2. In addition, the uncertainty calculation can be found in detail in (Alvares, 2020).

Table 2. Uncertainty components of the interferometric method.
2.3 Front track method
The front tracking method involves monitoring the position of the meniscus (liquid/air interface) inside a capillary tube over time. By knowing the displacement of the meniscus and the internal cross-sectional area of the capillary, the flow rate can be calculated. A high-resolution Alvium 1800 U-1240 camera with a 12 MP resolution and a Qioptic Optem 7:1 telecentric zoom lens was used for this purpose. The camera is connected to a computer and utilizes Python programming to identify the meniscus and determine its position, a translucent paper and a LED light are used as background illumination, allowing to decrease the reflection caused by ambient light, and obtain a good contrast between the background and the liquid meniscus. The setup is illustrated in Figure 3.
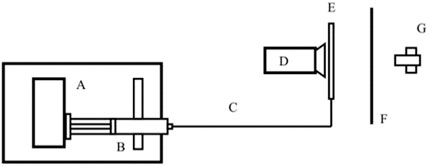
Figure 3. Schematic of the general experimental setup for the front track method, where (A) is the flow generator, (B) is the syringe, (C) is the connection line, (D) is the camera, (E) is the capillary tube, (F) is the translucent paper and (G) is the LED light.
The front track method can be applied in several type of flow measurement instruments like syringe pumps, microflow chips and flow meters down to 1.6 nL/min (0.1 μL/h) with 7% uncertainty.
The front track method can be applied in several types of flow measurement instruments, such as syringe pumps, microflow chips and flow meters. More information on this method and the uncertainty calculation can be found in (Bissig et al., 2015) and (Alvares, 2020). The uncertainty components of this method are described in Table 3.
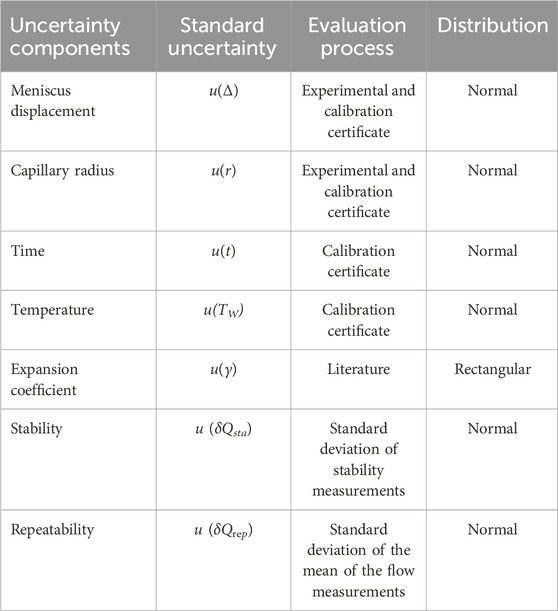
Table 3. Uncertainty components of the front track method.
2.4 Pending drop method
The pending drop method (Batista et al., 2021) involves measuring the volume (V) of a drop, its growth over time (t), and applying an evaporation correction (evap). This method is based on visualizing the increase in the volume of a drop over time, using a high-resolution Alvium 1800 U-1240 camera with a 12 MP resolution and a Qioptic Optem 7:1 telecentric zoom lens (Figure 4). The camera is connected to a computer, which processes the data. The image analysis program developed in Python consists of four steps: scale definition, image segmentation, contour determination and volume calculation. It can be used to calibrate syringe pumps from 100 μL/h to 1,000 μL/h.
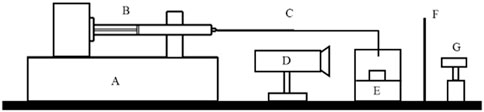
Figure 4. Schematic of the second experimental setup of the pending drop method, where (A) is a flow generator, (B) is the glass syringe, (C) is the connection line, (D) is the camera, (E) is the evaporation trap, (F) is the paper and (G) the LED light.
More information on this method and the uncertainty calculation can be found in (Batista et al., 2021). The uncertainty components of this method are described in Table 4.

Table 4. Uncertainty components of the pending drop method.
This method has still some limitation of use for high flow rates and at lower flow range has high uncertainty values. It can be used for the calibration of syringe pumps from 100 μL/h to 1,000 μL/h with an average standard uncertainty of 5%. More information on this method can be found in (Alvares, 2020; Batista et al., 2020).
2.5 Inner diameter measurements of glass syringes and capillaries
In all the methods described above a flow generator using glass syringes is used. The inner diameter determination of the syringe is critical for assuring the precision of the flow determination and it must be done using appropriate and traceable methods. In this work the gravimetric method is used to determine the inner diameter of all the used syringes (Figure 5) and also the capillaries used in the front track method. This procedure consists in measuring the liquid volume of a specific length of the glass tube. Knowing these two quantities it is possible to determine the average inner diameter of a capillary or syringe. More information on this method can be found in (Batista et al., 2023).

Figure 5. Gravimetric experimental setup for the syringe volume determination.
3 Results and discussion
The measurement error presented in this paper was determined according to the International Vocabulary of Metrology (VIM) (BIPM et al., 2012), as is defined as the measured quantity value minus a reference quantity value, Equation 1.
where:
AMetro is the relative flow measurement error or systematic error as defined by VIM (BIPM et al., 2012), Qref is the reference flow rate determined by the reference measurement method (e.g., gravimetric method), Qset is the flow rate set or the indicated flow rate at the instrument under calibration (e.g., 1 mL/h).
A precision Nexus 3,000 pump with 1 mL glass syringe was calibrated using the methods described above at the following flow rates: 1,000 μL/h, 500 μL/h, 100 μL/h, 10 μL/h, 1 μL/h.
The results are presented in Figure 6 and Table 5.

Figure 6. Comparison of Nexus pump calibration results with a 1 mL syringe.

Table 5. Calibration results of nexus pump calibration.
From the figure above it can be seen that the results from all the methods are consistent on all points.
The method with the larger uncertainty in Figure 6 is the pending drop method, which is recommended to be used only above 100 mL/h with an expanded uncertainty from 5% to 10%.
In the gravimetric method, it was possible to measure down to 10 μL/h with an acceptable expanded uncertainty of 2.6%; this allowed a decrease of range in the volume and flow laboratory of IPQ that was previously of 120 mL/h with 2.5% uncertainty.
The front track method can go to 1 μL/h with an expanded uncertainty of 7%.
The method with the smaller uncertainty is the interferometric method, especially at low flow rates. However, the instruments need to have an external piston for this method to be employed.
Tests were also performed with a Cetoni pump (Figure 7) at 0.1 mL/h using a 100 μL glass syringe with the interferometric method. The results were really outstanding, with an error of 1.7% and an expanded uncertainty of 1.9%.
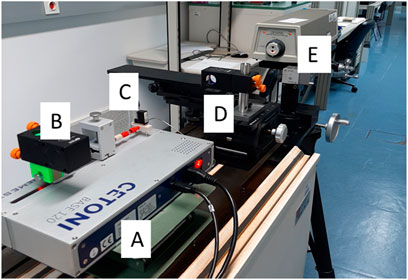
Figure 7. Cetoni pump calibration setup using the interferometric method, where (A) is the Cetoni syringe pump; (B) is the Retroreflector cube; (C) is the 100 μL glass syringe; (D) is the other Retroreflector cube; (E) is the Laser unit.
This interferometric method can calibrate flow meters and syringe pumps from 5,000 mL/h down to 1.6 nL/min (0.1 μL/h) with an expanded uncertainty range of (1.9–0.9) %. The calibration of a thermal Sensirion flow meter (Figure 8) was performed with the interferometer method and the front track method, tested at 1,500 nL/ min, 1,000 nL/min, 500 nL/min, 100 nL/min, 70 nL/min, 50 nL/min and 20 nL/min.
The results are presented Table 6 and Figure 8.

Table 6. Calibration results of a thermal sensirion flow meter.

Figure 8. Sensirion flow meter.
It can be verified from Figure 9 that the results are consistent in both methods used in the tests, and the uncertainty in general, smaller for the interferometer method.

Figure 9. Calibration of a thermal sensirion flow meter.
In order to test the methods with an instrument used in real life application a perfusor space BBraun syringe pump, used in hospitals to administrate drug to patients (Figure 10), was calibrated with water at flow rates 5,000 μL/h, 1,000 μL/h, 500 μL/h, 100 μL/h, using the methods described in section 2.

Figure 10. Calibration of BBraun pump with a 10 mL syringe using the gravimetric method.
The results presented in Figure 11 are consistent for all methods and in all flow rate points. The uncertainty values are very similar for all methods regarding each calibration point. More results on this pump can be found in (Batista, 2022).
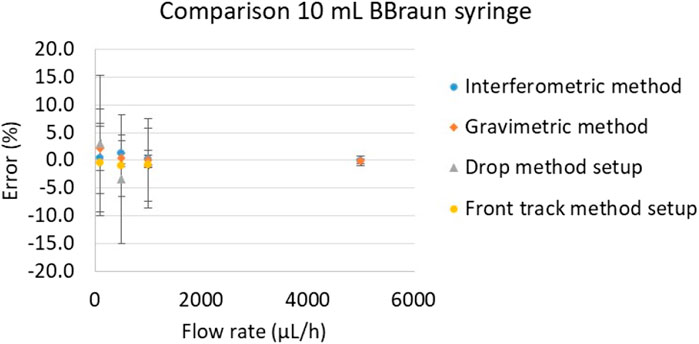
Figure 11. Calibration of BBraun pump with a 10 mL syringe.
Finally, a microfluidic Lab-On-a-Chip device (Figure 12) for passive mixing and magnetic separation of bioanalytes with square channel cross-section and obstacles that promotes a mixture of components for sample preparation was also characterized using the front track method and the gravimetric method.
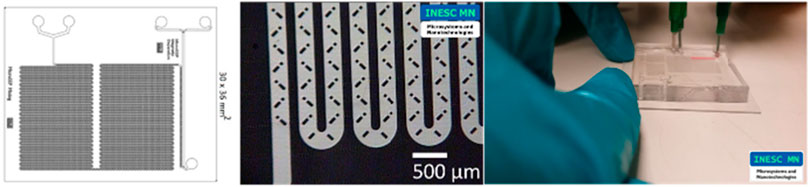
Figure 12. Microfluidic Lab-On-a-Chip device for passive mixing and magnetic separation of bioanalytes.
The chips were tested at 600 μL/h because this is the flow rate at which this chip is used. Water was used as a calibration liquid. The total acquisition time was 15 min, with one data point obtained at every 30 s. Tests were performed with and without the chip and three replicates were performed for each method. All the results, including the average of the replicates, are presented in Figure 13.
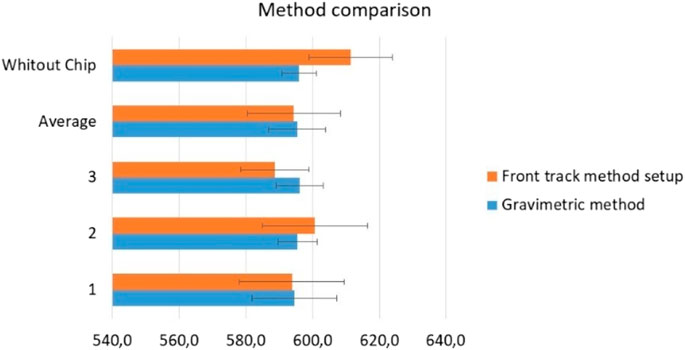
Figure 13. Comparison methods for microchips calibration.
The results in Figure 13 were consistent for the two methods used. The uncertainties values were very similar for the two methods, being higher for the front track method, probably due to the short acquisition time arising from the limitations of the capillary used.
4 Methods validation
To validate the methods developed, especially the interferometric method that gives a smaller uncertainty and can go down to 0.1 μL/h, IPQ participated in EURAMET project 1508. The results for the calibration of a Cetoni precision pump are presented in Figure 14 (EURAMET, 2022). The results of IPQ are consistent with the reference value, which was estimated based on the weighting mean of all participants at all points.

Figure 14. Intercomparison results for a cetoni pump calibration.
5 Methods comparison, applications, advantages and limitations
In Figure 15 is possible to see summarizes the range of application and uncertainty of the methodologies developed in the scope of this work for flow measurements.

Figure 15. Comparison of methods used in micro and nano flow measurements.
The developed interferometric method demonstrated exceptional performance, enabling flow measurements as low as 0.1 μL/h with uncertainty values below 2%. It is compatible with any flow generator equipped with an external motor, where the pusher block and the interferometer reflector cube are added (e.g., Nexus syringe pump). However, despite its precision, the method can be costly to implement in a laboratory setting due to the high price of the required instrumentation. Additionally, successful deployment necessitates specialized technical knowledge in interferometry.
The front track method offers a viable option for measuring flow rates as low as 0.1 μL/h across various flow generators, flow meters, insulin pumps and microfluidic chips. However, the method currently exhibits high uncertainty levels. To improve accuracy, testing with smaller capillaries is recommended, as this could reduce the measurement range and extend testing time—potentially achieving acceptable uncertainty levels between 2% and 3%. Despite its limitations, the method is characterized by its ease of implementation, straightforward handling procedures, and low cost.
In this work, the gravimetric method was successfully extended to measure flow rates down to 10 μL/h, compared to the previous limit of 100 μL/h. However, there remains potential for further improvement in both measurement range and uncertainty. This method is compatible with any flow generator, flow meter, or microfluidic device that work down to 10 μL/h, though it generally exhibits higher uncertainty than the interferometric method. Similar to the front track method, it is easy to implement and operate, and it involves relatively low costs.
The pending drop method also presents significant potential for improvement, particularly in controlling evaporation, which currently contributes to higher uncertainty values compared to the interferometric, gravimetric, and front track methods. Additionally, its operational range is more limited. Nevertheless, the method is highly versatile, suitable for use with many microfluidic or flow measurement device that work up to 100 μL/h. It is also easy to use and cost-effective to implement in a laboratory setting.
6 Conclusion
The implementation of the methodologies explored in this work was designed to enable the calibration of various types of instruments with different characteristics, such as precision syringes, perfusion syringes, microchips, and flowmeters, which are commonly used in the health and pharmaceutical industries as well as in microfluidic technologies. This calibration is crucial for ensuring the accuracy and reliability of these instruments.
It is essential that this information is disseminated not only to the scientific community but also to the medical and biomedical communities. Sharing these findings with healthcare professionals and researchers can foster collaboration and innovation, leading to further advancements in medical technology and practices. Additionally, manufacturers of medical instruments and other flow devices should be informed of these methodologies to ensure that their products meet the highest standards of accuracy and reliability.
In this work, the gravimetric method was improved for microflow measurements but there is still room for improvement. Three new methods were developed, and microfluidic chips were manipulated and tested for the first time at IPQ-LVC.
The interferometric method had the best performance regarding all methods tested but has some limitation in the type of instrument used (it must have an external motor) and cost of installation. The front track method is a good option that can be used for any type of flow measuring instrument or microfluidic device but more work is needed in order to decrease the uncertainty. The pending drop method has the worst performance of the four methods but is easy to use and low-cost i2mplementation.
All methods were internally validated by comparison with each other in the calibration of several flow measuring instruments.
This work served as the basis for the development of the EURAMET Guide CG-27, “Guidelines for the Calibration of Drug Delivery Devices and Infusion Device Analysers” (EURAMET guide cg 27, 2024). This document provides standardized procedures for testing microflow and nanoflow instruments aiming to improve the accuracy and comparability of measurement results Additionally, it contributed to the publication of the new EURAMET Technical Guide 4, “Evaluation of Flow-Related Quantities in Microfluidic Devices (EURAMET, 2024), but despite advancements in flow measurement techniques, challenges remain, particularly in microfluidics applications such has organ-on-chip. Ensuring traceability and accuracy at these scales requires ongoing research and development.
The development of standardized calibration methods and advanced measurement techniques for validating manufacturing, performance, and safety are essential in shaping the future of healthcare and microfluidic technology. The new EPM MFMET II project aims to fill these gaps by developing protocols and guidelines to support standardization efforts (Mfmet.eu, 2025).
Metrology is a key enabler of innovation and patient safety in healthcare. By ensuring the accuracy and reliability of drug delivery systems and diagnostic devices, like organ-on-chips, metrology helps reduce errors, enhance treatment efficacy, and save lives.
Going forward, standardized calibration methods, advanced measurement techniques, and collaborative research will be essential in shaping the future of healthcare technology.
Data availability statement
The data analyzed in this study is subject to the following licenses/restrictions: No restrictions. Requests to access these datasets should be directed toZWJhdGlzdGFAaXBxLnB0.
Author contributions
EB: Conceptualization, Investigation, Methodology, Validation, Visualization, Writing – original draft. RM: Supervision, Writing – review and editing. VS: Investigation, Resources, Validation, Writing – review and editing. IG: Writing – review and editing.
Funding
The author(s) declare that financial support was received for the research and/or publication of this article. The EMPIR and EPM projects “18HLT08 MeDD2” and “24NRM03 MFMET II” have received funding from the EMPIR and EPM programme co-financed by the Participating States and from the European Union’s Horizon 2020 research and innovation programme.
Acknowledgments
The EMPIR projects “18HLT08 MeDD2” and “24NRM03 MFMET II” have received funding from the EMPIR and EPM programme co-financed by the Participating States and from the European Union’s Horizon 2020 research and innovation programme.
Conflict of interest
The authors declare that the research was conducted in the absence of any commercial or financial relationships that could be construed as a potential conflict of interest.
The author(s) declared that they were an editorial board member of Frontiers, at the time of submission. This had no impact on the peer review process and the final decision.
Generative AI statement
The author(s) declare that Generative AI was used in the creation of this manuscript. The AI tool was used for text improving.
Publisher’s note
All claims expressed in this article are solely those of the authors and do not necessarily represent those of their affiliated organizations, or those of the publisher, the editors and the reviewers. Any product that may be evaluated in this article, or claim that may be made by its manufacturer, is not guaranteed or endorsed by the publisher.
References
Alvares, M. (2020). Implementação de um sistema de medição de microcaudais com recurso a métodos óticos (Master Thesis in Mechanical Engineering, FCT/UNL).
Batista, E. (2022). Calibration methodologies of microflow measuring instruments (PhD Thesis in Mechanical Engineering, FCT/UNL).
Batista, E., Álvares, M., Martins, R., Ogheard, F., Geršl, J., and Godinho, I. (2023). Measurement of internal diameters of capillaries and glass syringes using gravimetric and optical methods for microflow applications. Biomed. Eng./Biomed. Tech. 68 (1), 29–38. doi:10.1515/bmt-2022-0033
Batista, E., Alves e Sousa, J., Cardoso, S., and Silvério, V. (2020b). Experimental testing for metrological traceability and accuracy of liquid microflows and microfluidics. Flow Meas. Instrum. 71, 101691. doi:10.1016/j.flowmeasinst.2020.101691
Batista, E., Mendes, R., Furtado, A., Ferreira, M. C., Godinho, I., Sousa, J. A., et al. (2020). Calibration of syringe pumps using interferometry and optical methods. Int. J. Biomed. Biol. Eng. 14, 10.
Batista, E., Furtado, A., Pereira, J., Ferreira, M., Bissig, H., Graham, E., et al. (2020a). New EMPIR project - metrology for drug delivery. Flow Meas. Instrum. 72, 101716. doi:10.1016/j.flowmeasinst.2020.101716
Batista, E., Godinho, I., Martins, R. F., Mendes, R., and Robarts, J. (2020). Development of an experimental setup for microflow measurement using interferometry. Flow Meas. Instrum. 75, 101789. doi:10.1016/j.flowmeasinst.2020.101789
Batista, E., Silverio, V., Romieu, K., Alves e Sousa, J., and Daugbjerg, T. (2024). Development of measurement procedures for volume and flow related quantities in microfluidic devices. Sensors, 101551. doi:10.1016/j.measen.2024.101551
Batista, E., Sousa, J. A., Alvares, M., Afonso, J., and Martins, R. (2021). Development of an experimental setup for micro flow measurement using the front tracking method. Meas. Sensors 18, 100152. doi:10.1016/j.measen.2021.100152
BIPM, IEC, IFCC, ILAC, ISO (2008). IUPAC, IUPAP, and OIML. Evaluation of measurement data | Guide to the expression of uncertainty in measurement. Joint Committee for Guides in Metrology. JCGM 100.
BIPM, IEC, IFCC, ILAC, ISO, IUPAC, IUPAP (2012). International vocabulary of metrology | Basic and general concepts and associated terms (VIM). Joint Committee for Guides in Metrology. JCGM. 200
Bissig, H., Batista, E., Lucas, P., Filipe, E., Almeida, N., Ribeiro, L., et al. (2015). Primary standards for measuring flow rates from 100 nl/min to 1 ml/min – gravimetric principle. Biomed. Eng. 60 (4), 301–316. doi:10.1515/bmt-2014-0145
EURAMET (2024). EURAMET Technical Guide 4 - Evaluation of flow related quantities in microfluidic devices.
EURAMET guide cg 27 (2024). EURAMET guide cg 27 - guidelines for the calibration of drug delivery devices and infusion device Analysers.
EURAMET (2022). Pilot study intercomparison of ultra-low liquid flow rates in range below 100 nL/min. Available online at: https://www.euramet.org (Accessed March 13, 2022).
Keywords: calibration, uncertainty, flow, validation, methods
Citation: Batista E, Martins RF, Silverio V and Godinho I (2025) Advancing calibration techniques for accurate micro and nanoflow measurements. Front. Nanotechnol. 7:1600426. doi: 10.3389/fnano.2025.1600426
Received: 26 March 2025; Accepted: 02 June 2025;
Published: 11 June 2025.
Edited by:
Eliana B. Souto, University College Dublin, IrelandReviewed by:
Zimu Zhou, Western Digital, United StatesMohsen Mahmoudysepehr, University of Waterloo, Canada
Copyright © 2025 Batista, Martins, Silverio and Godinho. This is an open-access article distributed under the terms of the Creative Commons Attribution License (CC BY). The use, distribution or reproduction in other forums is permitted, provided the original author(s) and the copyright owner(s) are credited and that the original publication in this journal is cited, in accordance with accepted academic practice. No use, distribution or reproduction is permitted which does not comply with these terms.
*Correspondence: E. Batista, ZWJhdGlzdGFAaXBxLnB0