Abstract
Nitrogen and zinc nutrition significantly influence crop productivity. Foliar application, especially using nano-nitrogen and nano-zinc, enhances nutrient use efficiency and rapidly corrects deficiencies, offering a promising approach to improve crop growth and performance alongside conventional fertilization practices. The present study was undertaken to assess the nutrient dynamics in finger millet (GPU-28). A field experiment was taken up at AICRPDA centre, Bengaluru for two seasons during rainy season (kharif) Kharif 2021 and 2022 in a factorial randomized complete block design replicated thrice. Treatments included four levels of nitrogen - N1: No nitrogen, N2: 50% of the recommended dose of nitrogen (RDN: 25 kg N ha-1), N3: 75% RDN (37.5 kg N ha-1) and N4: 100% RDN (50 kg N ha-1); and four modes of fertilizers application - F1: Soil application of zinc, F2: Foliar spray of nano-nitrogen, F3: Foliar spray of nano-zinc and F4: Foliar spray of nano-nitrogen and nano-zinc along with two control treatments (Control-1: Recommended PK, Control-2: Recommended NPK). Nano-fertilizers were applied twice at 35 and 55 days after sowing (DAS) @ 2 mL L-1 and all treatments received recommended doses of phosphorus (40 kg P2O5 ha-1) and potassium (37.5 kg K2O ha-1). Additionally, a complementary pot culture study was conducted to evaluate physiological responses of finger millet to nano-fertilizers under controlled conditions, which corroborated the field results. Application of 100% RDN combined with foliar sprays of nano-nitrogen and nano-zinc resulted in significantly higher grain yield (3453 kg ha-1), uptake of nitrogen, phosphorus, potassium and zinc at all growth stages, which was comparable to the application of 75% RDN along with the same foliar applications of nano nutrients. Furthermore, higher nitrogen use efficiency was noticed with application of 75% RDN along with the foliar application of nano-N and nano-Zn. The nutrient balance study further confirmed that 75% RDN combined with nano fertilizers led to lower nitrogen losses compared to 100% RDN, indicating better nutrient use efficiency (NUE) and reduced environmental risks. In conclusion, applying 75% RDN combined with the recommended PK along with foliar application of nano-nutrients, demonstrates significant potential for efficient nutrient management.
1 Introduction
Finger millet (Eleusine coracana), a climate-resilient cereal predominantly grown in the rainfed regions of southern Karnataka and other semi-arid areas, plays a vital role in dryland agriculture. It is a nutrient-dense crop, rich in calcium, dietary fiber and essential amino acids, making it particularly important for nutritional security in marginal farming systems (Shukla and Behera, 2020). The crop’s adaptability to poor soils, limited rainfall, and minimal inputs makes it an ideal candidate for sustainable intensification in rainfed agriculture.
Despite its potential, finger millet productivity remains low due to declining soil fertility, especially under rainfed conditions where fertilizer use is minimal and often imbalanced. At the national level, food grain production faces challenges due to widespread soil nutrient mining and negative nutrient balances, which are estimated at 8–10 million tonnes annually (NAAS, 2018). However, unlike high-input cereals such as rice and wheat, finger millet is grown under low external input systems, and blanket recommendations or concerns of over-fertilization are not applicable to this crop. Instead, site-specific nutrient management and efficient delivery methods are required to address the nutrient limitations of rainfed finger millet systems.
Among essential nutrients, nitrogen plays a key role in plant development; its deficiency can significantly hinder the growth of roots, stems, foliage, flowers and fruits. Similarly, in the Indian context, zinc (Zn) has been recognized as the most deficient micronutrient, presenting additional challenges to achieving optimal crop productivity (Shukla and Behera, 2020). The lack of micronutrients in soil not only reduces crop yield but also diminishes the nutritional quality of grains (Fageria et al., 2002; Phattarakul et al., 2012; Dapkekar et al., 2018; Shukla et al., 2021). Micronutrient insufficiency occurs when animals and humans consume food derived from crops with low micronutrient concentrations (Shukla et al., 2021). Zinc deficiency, in particular, presents a critical health challenge, as it adversely affects human nutrition while simultaneously limiting crop production (Manzeke et al., 2019). Conventional soil application of Zn fertilizers such as ZnSO4 often leads to fixation and reduced bioavailability. Foliar delivery of nano-Zn offers a promising alternative, potentially improving grain Zn content while enhancing overall crop performance (Raliya and Singh, 2016).
In this context, nano-fertilizers have emerged as a promising alternative due to their unique properties such as high surface area, enhanced foliar absorption, controlled nutrient release and targeted delivery, which collectively improve nutrient uptake and minimize losses (Naderi and Danesh-Shahraki, 2013; Moaveni and Kheiri, 2011; Huq et al., 2025) through site-targeted mechanisms, significantly enhancing nutrient use efficiency. Nano-fertilizers consist of nanoscale particles that exhibit a high surface area-to-volume ratio, improved nutrient retention and enhanced mobility within the soil-plant system. These characteristics contribute to better plant responses such as more efficient nutrient uptake, higher biomass production, improved photosynthetic activity and increased leaf expansion. A 2023 study in Prayagraj evaluated nano-ZnO (300–900 ppm) alone and in combination with foliar boron (0.1%–0.5%) on finger millet, where the 900 ppm nano-Zn plus 0.5% boron treatment significantly enhanced plant height, tiller count, biomass and yields (Kruthika et al., 2023). Beyond finger millet, pearl millet studies further validate the benefits of nano-nutrient applications. Foliar nano-urea at 4 mL L-1 (at 30 and 45 DAS) under 100% recommended NPK improved plant height, dry matter accumulation, chlorophyll content and grain Zn, N, P, and K concentrations in both grain and straw (Sharma et al., 2022). However, these studies are isolated and lack integration with nitrogen management or evaluation under rainfed systems.
Despite the growing interest in nano-fertilizer technology, limited research has explored their efficacy in millets, particularly under rainfed conditions where nutrient stress is prevalent. Most studies to date have focused on major cereals like wheat and rice (Kah et al., 2018; Mullen, 2019; Hu and Xianyu, 2021), with minimal attention given to small millets. Moreover, there is a lack of integrated assessments combining both field and physiological studies in pot culture to comprehensively evaluate the effects of nano-nutrient applications on plant metabolism and stress mitigation. Combining both perspectives offers valuable insights into how nano-fertilizers enhance nutrient use efficiency and strengthen crop resilience, particularly under rainfed conditions.
2 Materials and methods
2.1 Experimental site
The study was carried out during the kharif seasons of 2021 and 2022 at the All India Coordinated Research Project for Dryland Agriculture, University of Agricultural Sciences, GKVK, Bengaluru. The station’s average annual rainfall over the past 38 years (1976–2020) was 921.0 mm. In 2021 and 2022, the recorded rainfall was 1190 mm and 1557 mm, respectively with the majority of rainfall occurring between May and October. The experimental site is characterized by soils from the Vijayapura soil series, classified as Kandic paleustalfs, and falls under the FAO classification of ferric luvisols. The soils, derived from laterite formation in a subtropical semi-arid climate, are reddish-brown in color and exhibit a sandy loam texture. The soil has a acidic pH of 5.05, low electrical conductivity (0.08 dS m-1), and organic carbon content of 3.3 g kg-1. The site’s soils were low in available nitrogen (256 kg ha-1) but medium in potassium (146 kg ha-1) and phosphorus (51 kg ha-1).
Soil texture was determined using the International Pipette Method, as described by Piper (1966). The soil pH was determined by the potentiometric method (Piper, 1966), and electrical conductivity using a conductivity bridge (Jackson, 1973). Organic carbon content was estimated using the Walkley and Black wet-oxidation method, (Jackson, 1973). Available nitrogen was determined following Alkaline permanganate method (Subbaiah and Asija, 1956). The available phosphorus and potassium content of the soil was quantified following Bray’s and Flame photometer (Jackson, 1973).
2.2 Experimental design and treatments
The experiment was laid out in a factorial randomized complete block design (RCBD) with 18 treatment combinations, replicated three times. Each plot measured 4.2 m × 3.0 m, separated by 0.5 m between plots and 1.0 m between replications. The design involved two factors: four nitrogen levels and four fertilizer application methods, along with two control treatments.
| Factor A: Nitrogen levels | Factor B: Methods of fertilizer application |
|---|---|
| A1: No nitrogen (N0) | B1: Soil application of zinc @ 12.5 kg ha-1 |
| A2: 50 per cent of recommended nitrogen (N50) | B2: Foliar spray of nano-nitrogen @ 2 mL L-1 of water at 35 and 55 DAS |
| A3: 75 per cent of recommended nitrogen (N75) | B3: Foliar spray of nano-zinc @ 2 mL L-1 of water at 35 and 55 DAS |
| A4: 100 per cent of recommended nitrogen (N100) | B4: Foliar spray of nano-nitrogen and nano-zinc @ 2 mL L-1 of water at 35 and 55 DAS |
Control treatments: Control-1: Recommended PK.
Control-2: Recommended NPK.
Recommended NPKZn dose was 50:40:37.5:12.5 kg ha-1.
2.2.1 Nano-fertilizer details
Nano-nitrogen: Commercially procured (IFFCO Nano Urea), liquid formulation, average particle size 20–50 nm, characterized by dynamic light scattering (DLS).
Nano-zinc: Commercially procured (IFFCO Nano Zn), liquid formulation, average particle size 30–50 nm, characterized by scanning electron microscopy (SEM) and confirmed via X-ray diffraction (XRD).
Foliar application of nano-N and nano-Zn (@ 2 mL/L each was carried out twice at 35 and 55 DAS using 500 L ha-1 using a knapsack sprayer with a fine nozzle, ensuring uniform spray coverage until leaf surfaces were wet without runoff.
2.3 Crop details and management
The experimental land was prepared by ploughing using bullock drawn country plough. The land was levelled within the plots for sowing, Fertilizers nitrogen, phosphorus and potassium were applied through urea, di-ammonium phosphate and muriate of potash respectively, as per the treatment. Half quantity of N and full quantities of P and K were applied as basal by broadcasting followed by mixing. Remaining half of N was applied as top dressing 30 DAS followed by earthing up operation. The crop variety used was GPU-28, a widely cultivated finger millet variety in southern India. Seeds were sown at a spacing of 30 cm × 10 cm in the field. Standard crop management practices were followed during the experiment. Weed control was carried out through two manual weedings at 20 and 40 DAS. As the crop was grown under rainfed conditions, supplemental irrigation was provided only during prolonged dry spells. Pests and diseases were monitored regularly, and need-based plant protection measures were implemented to ensure healthy crop growth.
2.4 Plant analysis
The plant material was dried in an electric oven at 70 °C for 24 h and finely ground. Nutrient analyses were conducted using standard AOAC procedures (Helrich, 1990). Total nitrogen in plant samples was estimated using the Kjeldahl digestion and distillation method following the procedure outlined by Piper (1966). Total phosphorus was determined colorimetrically by using the vanado-molybdo-phosphoric yellow color method (Jackson, 1973). Potassium content was measured with the help of a calibrated flame photometer. Zinc concentration was determined using atomic absorption spectrophotometer, calibrated using certified zinc standards.
Uptake of N, P, K, and Zn (kg/ha) was calculated individually using the following formula:
2.5 Soil analysis
Prior to chemical analysis, soil samples were collected, air-dried, ground using a wiley mill and sieved through a 2 mm mesh. Available nitrogen was assessed by following Alkaline permanganate method as outlined by Subbaiah and Asija (1956), available phosphorus and potassium content of the soil was quantified following Bray’s colorimetry and Flame photometer method respectively outlined by Jackson (1973). All instruments were calibrated prior to analysis using appropriate standards.
2.6 Nutrient use efficiency (NUE)
Nutrient use efficiency (NUE) serves as a key indicator for assessing the performance of crop production systems. The different nutrient use efficiency of nitrogen, phosphorus and potassium (Paul et al., 2015) was calculated using established formulae as below
Note: PFP- Partial factor productivity; AE- Agronomic efficiency; ARE- Apparent recovery efficiency and IUE- Internal utilization efficiency.
2.7 Pot culture experiment
A complementary pot culture experiment was conducted to assess the physiological and biochemical responses of finger millet to nano-fertilizer application. Pots were filled with 10 kg of air-dried soil. Each treatment was replicated thrice in a completely randomized design (CRD). Nano fertilizers were applied using hand-held sprayers at the same concentrations and timings as in the field study (35 and 55 DAS). Crop management in pots included uniform irrigation every 3–4 days and manual weeding.
Treatment Details.
T1: N50PKZn
T2: N75PKZn
T3: N100PKZn
T4: N50PK + nano-N (35 and 55 DAS @ 2 mL L-1)
T5: N75PK + nano-N (35 and 55 DAS @ 2 mL L-1)
T6: N100PK + nano-N (35 and 55 DAS @ 2 mL L-1)
T7: N50PK + nano-N + nano-Zn (35 and 55 DAS @ 2 mL L-1)
T8: N75PK + nano-N + nano-Zn (35 and 55 DAS @ 2 mL L-1)
T9: N100PK + nano-N + nano-Zn (35 and 55 DAS @ 2 mL L-1)
T10: Absolute control
The recommended NPKZn dose was 50:40:37.5:12.5 kg ha-1.
2.7.1 Physiological and biochemical analysis
2.7.1.1 Chlorophyll content (mg g-1 FW)
Chlorophyll content was measured using the Dimethyl Sulfoxide (DMSO) method. Leaf samples were immersed in DMSO and incubated at 60–65 °C. After incubation, absorbance was recorded at 663 nm and 645 nm using a spectrophotometer.
2.7.2 Assay of antioxidant enzyme
2.7.2.1 Enzyme extraction
For the enzyme assay, leaf samples were collected before and 10 days after foliar spraying of nano nutrients at 25, 45 and 65 DAS and stored in ice box. A 0.5-g fresh leaf sample was homogenized in 3 mL of 0.1 M phosphate buffer (pH 7.8) containing 0.5 mM EDTA, using a pre-chilled mortar and pestle. The homogenized tissue was then centrifuged at 10,000 rpm for 10 min at 4 °C, and the supernatant was collected for enzyme analysis.
2.7.2.2 Catalase activity assay
Catalase (CAT) activity was assessed using the method given by Barber (1980). To the reaction mixture, 1.5 mL of phosphate buffer, 1 mL of H2O2 (0.005 M) and 0.5 mL of enzyme extract were added, and the mixture was incubated at 20 °C for 1 min. The reaction was stopped by adding 5 mL of 0.7 N H2SO4. The reaction mixture was then titrated with 0.01 N KMnO4 until a faint purple color persisted for at least 15 s. A blank was prepared by mixing the extract with the reaction mixture without incubation. Catalase (CAT) activity was calculated and expressed as mmol H2O2 consumed per minute per gram of tissue (mmol H2O2−1 min-1 g-1).
2.7.2.3 Peroxidase activity assay
Peroxidase (POX) activity was determined by following the method of Summer and Gjessing (1943). To the reaction mixture, 1 mL of O-dianisidine (0.01 M in methanol), 0.5 mL of H2O2 (0.02 M), 1 mL of phosphate buffer, 2.4 mL of distilled water and 0.2 mL of enzyme extract were added. The mixture was incubated at 30 °C for 5 min, after which the reaction was stopped by adding 1 mL of 2 N H2SO4. A blank tube, which excluded H2O2, was prepared by adding 0.5 mL of distilled water. The color intensity was measured using a spectrophotometer at 430 nm. The peroxidase (POX) activity was expressed as mmol H2O2 consumed per minute per gram of tissue (mmol H2O2−1 min-1g-1).
2.7.2.4 Superoxide dismutase (SOD) activity assay
SOD activity was assayed by following the method of Dhindsa et al. (1981). To the reaction mixture, 0.3 mL of supernatant was added, along with 1.3 μM riboflavin, 63 μM nitroblue tetrazolium (NBT), and 200 mM methionine. The tubes were covered with aluminum foil to shield them from light. A blank was prepared by excluding the enzyme supernatant as a control. The tubes were then exposed to light in a light box for 3 min. The color intensity was measured using a spectrophotometer at a wavelength of 560 nm. SOD activity was expressed as a fold increase over the activity in normal salt-treated plants, in units per gram.
2.8 Statistical analysis
The experimental data were analyzed using Fisher’s Analysis of Variance (ANOVA). Data from both seasons were analyzed separately for each year, as well as pooled across the two seasons for a combined statistical evaluation. Analyses of year wise and pooled data were performed as per Gomez and Gomez (1984).
When the F-test indicated a significant difference among treatment means, the corresponding critical difference (CD) was calculated. If no significant difference was found, the results were marked as NS (Non-Significant) in relation to the CD values. All the data were analyzed and the results are presented and discussed at a probability level of 0.05 per cent and correlation study was done as given by Gomez and Gomez (1984). The Pearson correlation coefficient, used to assess the relationship between two variables, was computed based on the experimental data.
3 Results
3.1 Nitrogen uptake
Increasing nitrogen levels enhanced nitrogen uptake by finger millet at all growth stages (Figure 1). Significantly higher uptake was recorded with 100% RDN (24.18 and 39.56 kg ha-1), which was statistically on par with 75% RDN at 60 and 90 DAS respectively. Among the different fertilizer application methods, foliar spray of nano-N + nano-Zn further enhanced uptake (23.58 and 39.32 kg ha-1), surpassing nano-N alone. Significant interaction effects were observed. The combination of 100% RDN + nano-N + nano-Zn resulted in significantly higher uptake (28.26 and 43.31 kg ha-1), which was comparable to 75% RDN + nano-N + nano-Zn. The lowest uptake was recorded in the PK-only control at 60 and 90 DAS, respectively.
FIGURE 1

Nitrogen uptake (kg ha−1) at different crop growth stages as influenced by nitrogen levels and methods of fertilizer application in finger millet (pooled data of 2 years). Values of means followed by different letter(s) (based on Duncan’s multiple range tests) within each column are significantly different at p ≤ 0.05.
Nitrogen uptake in grain and straw was significantly higher under 100% RDN (30.30 and 18.78 kg ha-1), followed by 75% RDN (Table 1). Among the different fertilizer application methods, nano-N + nano-Zn yielded greater uptake in grain (27.98 kg ha-1) and straw (17.90 kg ha-1). The interaction of 100% RDN + nano-N + nano-Zn recorded the highest total uptake (34.72 and 19.58 kg ha-1 in grain and straw), comparable to 75% RDN + nano-N + nano-Zn.
TABLE 1
| Treatment | Grain uptake (kg ha−1) | Straw uptake (kg ha−1) | Total uptake (kg ha−1) |
|---|---|---|---|
| Factor A (nitrogen levels) | |||
| A1 - N0 | 20.17d | 16.17b | 36.33d |
| A2 - N50 | 21.66c | 16.57b | 38.23c |
| A3 - N75 | 28.05b | 18.16a | 46.20b |
| A4- N100 | 30.30a | 18.78a | 49.08a |
| S.Em± | 0.14 | 0.31 | 0.35 |
| CD at 5% | 0.41 | 0.88 | 1.02 |
| Factor B (Method of fertilizer application) | |||
| B1 - Soil application of Zn | 22.26d | 17.21a | 39.47c |
| B2 – Nano-N | 26.18b | 17.57a | 43.75b |
| B3 – Nano-Zn | 23.76c | 16.98a | 40.74c |
| B4 – Nano-N + Nano-Zn | 27.98a | 17.90a | 45.88a |
| S.Em± | 0.14 | 0.31 | 0.35 |
| CD at 5% | 0.41 | 0.88 | 1.02 |
| Interaction (A × B) | |||
| A1B1 | 19.47i | 16.67de | 36.14i |
| A1B2 | 20.70gh | 15.92e | 36.62hi |
| A1B3 | 19.92hi | 16.02e | 35.94i |
| A1B4 | 20.58gh | 16.06e | 36.64hi |
| A2B1 | 20.71gh | 16.88cde | 37.59ghi |
| A2B2 | 21.62fg | 16.57de | 38.20fgh |
| A2B3 | 22.22f | 16.21e | 38.43fg |
| A2B4 | 22.10f | 16.61de | 38.71fg |
| A3B1 | 22.35f | 17.20cde | 39.56f |
| A3B2 | 31.13b | 18.78ab | 49.91b |
| A3B3 | 24.19e | 17.28bcde | 41.47e |
| A3B4 | 34.51a | 19.37a | 53.88a |
| A4B1 | 26.50d | 18.10abcd | 44.60d |
| A4B2 | 31.26b | 19.02a | 50.29b |
| A4B3 | 28.72c | 18.42abc | 47.14c |
| A4B4 | 34.72a | 19.58a | 54.30a |
| S.Em± | 0.28 | 0.61 | 0.71 |
| CD at 5% | 0.82 | 1.65 | 2.05 |
| PK (Control-1) | 18.53 | 12.52 | 31.05 |
| NPK (Control-2) | 24.53 | 17.74 | 42.27 |
| S.Em± | 0.28 | 0.58 | 0.67 |
| CD at 5% | 0.79 | 1.65 | 1.93 |
| CV | 2.94 | 5.80 | 3.77 |
Nitrogen uptake at harvest as influenced by nitrogen levels and methods of fertilizer application in finger millet (pooled data of 2 years).
RDF-50:40:37.5:12.5 kg NPKZn, ha−1;Nano-N, and nano-Zn spray at 35 and 55 DAS @ 2 mL L−1.
Values of means followed by different letter(s) (based on Duncan’s multiple range tests) within each column are significantly different at p ≤ 0.05.
3.2 Phosphorus uptake
Phosphorus uptake by finger millet was significantly influenced by nitrogen levels, fertilizer application methods, and their interaction (Figure 2; Table 2). Uptake increased with higher nitrogen application, with the maximum observed under 100% RDN (2.85 and 7.06 kg ha-1), which was statistically similar to 75% RDN, both significantly superior to the control at 60 and 90 DAS, respectively (Figure 2). Among the methods of fertilizer application, foliar spray of nano-N and nano-Zn resulted in significantly higher phosphorus uptake (2.78 and 7.01 kg ha-1) followed by nano-N alone. The interaction of 100% RDN with foliar spray of nano-N and nano-Zn recorded significantly higher uptake (3.34 and 7.73 kg ha-1), statistically on par with 75% RDN + nano-N + nano-Zn at 60 and 90 DAS, respectively.
FIGURE 2

Phosphorus uptake (kg ha−1) at different crop growth stages as influenced by nitrogen levels and methods of fertilizer application in finger millet. Values of means followed by different letter(s) (based on Duncan’s multiple range tests) within each column are significantly different at p ≤ 0.05.
TABLE 2
| Treatment | Grain uptake (kg ha−1) | Straw uptake (kg ha−1) | Total uptake (kg ha−1) |
|---|---|---|---|
| Factor A (Nitrogen levels) | |||
| A1 - N0 | 2.74b | 4.04b | 6.78d |
| A2 - N50 | 3.07b | 4.54b | 7.61c |
| A3 - N75 | 4.20a | 6.20a | 10.39b |
| A4- N100 | 4.49a | 6.63a | 11.11a |
| S.Em± | 0.04 | 0.06 | 0.02 |
| CD at 5% | 0.12 | 0.17 | 0.04 |
| Factor B (Method of fertilizer application) | |||
| B1 - Soil application of Zn | 3.27c | 4.82b | 8.09c |
| B2 – Nano-N | 3.82ab | 5.64a | 9.45b |
| B3 – Nano-Zn | 3.35bc | 4.94b | 8.29c |
| B4 – Nano-N + Nano-Zn | 4.06a | 6.00a | 10.06a |
| S.Em± | 0.04 | 0.06 | 0.02 |
| CD at 5% | 0.12 | 0.17 | 0.04 |
| Interaction (A × B) | |||
| A1B1 | 2.70g | 3.99f | 6.69j |
| A1B2 | 2.75fg | 4.06f | 6.80ij |
| A1B3 | 2.72g | 4.02f | 6.75ij |
| A1B4 | 2.77fg | 4.10f | 6.87ij |
| A2B1 | 2.85fg | 4.22f | 7.07i |
| A2B2 | 3.13efg | 4.62ef | 7.75g |
| A2B3 | 2.99fg | 4.42ef | 7.42h |
| A2B4 | 3.31ef | 4.89de | 8.21f |
| A3B1 | 3.60de | 5.32cd | 8.93e |
| A3B2 | 4.48bc | 6.62b | 11.11c |
| A3B3 | 3.64de | 5.38cd | 9.02e |
| A3B4 | 5.05a | 7.46a | 12.52a |
| A4B1 | 3.91d | 5.77c | 9.68d |
| A4B2 | 4.91ab | 7.25a | 12.15b |
| A4B3 | 4.03cd | 5.95c | 9.97d |
| A4B4 | 5.10a | 7.54a | 12.64a |
| S.Em± | 0.08 | 0.11 | 0.03 |
| CD at 5% | 0.24 | 0.33 | 0.09 |
| PK (Control-1) | 2.69 | 3.97 | 6.66 |
| NPK (Control-2) | 3.76 | 5.55 | 9.31 |
| S.Em± | 0.08 | 0.11 | 0.03 |
| CD at 5% | 0.24 | 0.32 | 0.09 |
| CV | 4.97 | 4.67 | 2.19 |
Phosphorus uptake at harvest as influenced by nitrogen levels and methods of fertilizer application in finger millet.
RDF-50:40:37.5:12.5 kg NPKZn, ha−1;Nano-N, and nano-Zn spray at 35 and 55 DAS @ 2 mL L−1.
Values of means followed by different letter(s) (based on Duncan’s multiple range tests) within each column are significantly different at p ≤ 0.05.
At harvest, phosphorus uptake in grain and straw was also significantly higher with 100% RDN (4.49 and 6.63 kg ha-1, respectively). Foliar spray of nano-N and nano-Zn enhanced phosphorus uptake in grain (4.06 kg ha-1) and straw (6.00 kg ha-1), outperforming nano-N alone. The combination of 100% RDN with nano-N and nano-Zn resulted in significantly higher uptake in grain (5.10 kg ha-1) and straw (7.54 kg ha-1), statistically on par with 75% RDN + nano-N + nano-Zn (5.05 and 7.46 kg ha-1).
3.3 Potassium uptake
Potassium uptake by finger millet increased significantly with higher nitrogen levels (Figure 3). Significantly higher uptake was recorded under 100% RDN (17.06 and 40.10 kg ha-1 at 60 and 90 DAS, respectively), while the lowest occurred with no nitrogen application. Among the different methods of fertilizer application, foliar spray of nano-N and nano-Zn resulted in significantly higher uptake (16.64 and 39.86 kg ha-1 at 60 and 90 DAS), followed by nano-N alone (15.39 and 38.00 kg ha-1, respectively). The interaction between nitrogen level and application method was significant. The combination of 100% RDN with foliar spray of nano-N and nano-Zn recorded significantly higher potassium uptake (19.93 and 43.90 kg ha-1 at 60 and 90 DAS) and was statistically comparable to 75% RDN with the same foliar spray (19.42 and 43.87 kg ha-1).
FIGURE 3

Potassium uptake (kg ha−1) at different crop growth stages as influenced by nitrogen levels and methods of fertilizer application in finger millet. Note- Values of means followed by different letter(s) (based on Duncan’s multiple range tests) within each column are significantly different at p ≤ 0.05.
At harvest, potassium uptake in grain and straw showed a similar pattern (Table 3). Significantly higher grain and straw uptake was recorded under 100% RDN (19.12 and 30.22 kg ha-1, respectively), which was comparable to 75% RDN (18.44 and 29.14 kg ha-1, respectively). Foliar application of nano-N and nano-Zn enhanced uptake in grain (18.17 kg ha-1) and straw (28.71 kg ha-1), outperforming nano-N alone. Interaction effects revealed significantly higher uptake under 100% RDN + nano-N + nano-Zn (20.26 and 32.02 kg ha-1 in grain and straw), statistically on par with 75% RDN + nano-N + nano-Zn. A similar trend was observed in total potassium uptake.
TABLE 3
| Treatment | Grain uptake (kg ha−1) | Straw uptake (kg ha−1) | Total uptake (kg ha−1) |
|---|---|---|---|
| Factor A (Nitrogen levels) | |||
| A1 - N0 | 15.48c | 24.46d | 38.89d |
| A2 - N50 | 16.67b | 26.34c | 41.88c |
| A3 - N75 | 18.44a | 29.14b | 46.32b |
| A4- N100 | 19.12a | 30.22a | 48.04a |
| S.Em± | 0.11 | 0.05 | 0.10 |
| CD at 5% | 0.33 | 0.16 | 0.28 |
| Factor B (Method for fertilizer application) | |||
| B1 - Soil application of Zn | 16.74d | 26.46d | 42.07d |
| B2 – Nano-N | 17.69b | 27.96b | 44.46b |
| B3 – Nano-Zn | 17.10c | 27.03c | 42.97c |
| B4 – Nano-N + Nano-Zn | 18.17a | 28.71a | 45.65a |
| S.Em± | 0.11 | 0.05 | 0.10 |
| CD at 5% | 0.33 | 0.16 | 0.28 |
| Interaction (A × B) | |||
| A1B1 | 14.99j | 23.69j | 37.67j |
| A1B2 | 15.66hij | 24.75i | 39.35i |
| A1B3 | 15.52ij | 24.53i | 39.00i |
| A1B4 | 15.74hij | 24.87i | 39.53i |
| A2B1 | 16.37ghi | 25.87h | 41.13h |
| A2B2 | 16.84fg | 26.61fg | 42.31g |
| A2B3 | 16.51gh | 26.08gh | 41.47h |
| A2B4 | 16.96fg | 26.81f | 42.62g |
| A3B1 | 17.50ef | 27.66e | 43.97f |
| A3B2 | 18.89bcd | 29.85c | 47.46d |
| A3B3 | 17.64ef | 27.88e | 44.32f |
| A3B4 | 19.71ab | 31.15b | 49.53b |
| A4B1 | 18.11de | 28.62d | 45.50e |
| A4B2 | 19.38abc | 30.63b | 48.70c |
| A4B3 | 18.73cd | 29.61c | 47.07d |
| A4B4 | 20.26a | 32.02a | 50.91a |
| S.Em± | 0.23 | 0.11 | 0.20 |
| CD at 5% | 0.66 | 0.31 | 0.56 |
| PK (Control-1) | 14.15 | 22.36 | 35.55 |
| NPK (Control-2) | 17.79 | 28.11 | 44.70 |
| S.Em± | 0.24 | 0.94 | 0.21 |
| CD at 5% | 0.70 | 2.69 | 0.59 |
| CV | 3.43 | 1.72 | 1.82 |
Potassium uptake at harvest as influenced by nitrogen levels and methods of fertilizer application in finger millet.
RDF-50:40:37.5:12.5 kg NPKZn, ha−1; Nano-N, and nano-Zn spray at 35 and 55 DAS @ 2 mL L−1.
Values of means followed by different letter(s) (based on Duncan’s multiple range tests) within each column are significantly different at p ≤ 0.05.
3.4 Zinc uptake
The uptake of zinc was significantly influenced by different nitrogen levels across all crop growth stages, except at 30 DAS (Figure 4; Table 4). As fertilizer application increased, zinc uptake also showed a significant rise. The highest zinc uptake was observed with 100% RDN application (28.88 and 86.86 g ha-1 at 60 and 90 DAS, respectively), followed by 50% RDN (23.80 and 78.74 g ha-1), which was comparable to 75% RDN. Foliar spray of nano-N and nano-Zn resulted in significantly higher zinc uptake at 35 and 55 DAS (28.17 and 86.34 g ha-1, respectively), followed by foliar spray of only nano-N. Significant interaction effects were observed between nitrogen levels and fertilizer application methods for zinc uptake at all stages of crop growth. At 60 and 90 DAS, the combined application of 100% RDN with foliar spray of nano fertilizers resulted in significantly higher zinc uptake (33.75 and 95.11 g ha-1), which was comparable to the application of 75% RDN with foliar spray of nano fertilizers. A similar trend was observed for zinc uptake in the grain, straw and total crop.
FIGURE 4

Zinc uptake (g ha−1) at different crop growth stages as influenced by nitrogen levels and methods of fertilizer application in finger millet. Values of means followed by different letter(s) (based on Duncan’s multiple range tests) within each column are significantly different at p ≤ 0.05.
TABLE 4
| Treatment | Grain uptake (g ha−1) | Straw uptake (g ha−1) | Total uptake (g ha−1) |
|---|---|---|---|
| Factor A (Nitrogen levels) | |||
| A1 - N0 | 38.22d | 46.31d | 84.53d |
| A2 - N50 | 42.27c | 51.22c | 93.49c |
| A3 - N75 | 47.13b | 57.12b | 104.25b |
| A4- N100 | 48.59a | 58.88a | 107.47a |
| S.Em± | 0.14 | 0.10 | 0.07 |
| CD at 5% | 0.41 | 0.28 | 0.21 |
| Factor B (Method of fertilizer application) | |||
| B1 - Soil application of Zn | 42.29c | 51.24d | 93.53d |
| B2 – Nano-N | 44.56b | 53.99b | 98.55b |
| B3 – Nano-Zn | 43.08c | 52.20c | 95.28c |
| B4 – Nano-N + Nano-Zn | 46.28a | 56.09a | 102.37a |
| S.Em± | 0.14 | 0.10 | 0.07 |
| CD at 5% | 0.41 | 0.28 | 0.21 |
| Interaction (A × B) | |||
| A1B1 | 37.25h | 45.14m | 82.38o |
| A1B2 | 38.27h | 46.37l | 84.64m |
| A1B3 | 37.80h | 45.81lm | 83.61n |
| A1B4 | 39.55g | 47.93k | 87.48L |
| A2B1 | 40.58f | 49.17j | 89.76k |
| A2B2 | 42.85e | 51.92h | 94.76i |
| A2B3 | 41.50f | 50.29i | 91.79j |
| A2B4 | 44.14d | 53.49g | 97.63h |
| A3B1 | 44.81d | 54.30f | 99.11g |
| A3B2 | 48.31b | 58.54cd | 106.85d |
| A3B3 | 45.12d | 54.67f | 99.79g |
| A3B4 | 50.30a | 60.96b | 111.26b |
| A4B1 | 46.51c | 56.36e | 102.86f |
| A4B2 | 48.81b | 59.15c | 107.96c |
| A4B3 | 47.90b | 58.04d | 105.94e |
| A4B4 | 51.14a | 61.97a | 113.10a |
| S.Em± | 0.29 | 0.19 | 0.14 |
| CD at 5% | 0.82 | 0.55 | 0.42 |
| PK (Control-1) | 36.42 | 44.14 | 80.56 |
| NPK (Control-2) | 45.40 | 55.01 | 100.41 |
| S.Em± | 0.29 | 0.20 | 0.15 |
| CD at 5% | 0.84 | 0.56 | 0.43 |
Zinc uptake at harvest as influenced by nitrogen levels and methods of fertilizer application in finger millet.
RDF-50:40:37.5:12.5 kg NPKZn, ha−1;Nano-N, and nano-Zn spray at 35 and 55 DAS @ 2 mL L−1.
Values of means followed by different letter(s) (based on Duncan’s multiple range tests) within each column are significantly different at p ≤ 0.05.
3.5 Soil available nutrient status
Soil available nitrogen (259.9 kg ha-1), phosphorus (87.5 kg ha-1), and potassium (132.5 kg ha-1) were found to be the lowest under the treatment involving 100% RDN, in contrast to the slightly higher values recorded with 75% RDN application (Table 5). Among the different fertilizer application methods, foliar spraying of nano-N and nano-Zn at 35 and 55 DAS resulted in lower residual soil NPK values (257.2, 90.7, and 139.8 kg ha-1, respectively) (Table 5). However, the combination of 75% RDN with foliar spray of nano-N and nano-Zn at the same intervals (35 and 55 DAS) significantly improved soil available nitrogen, phosphorus, and potassium (265.4, 86.9, and 121.8 kg ha-1, respectively) compared to the 100% RDN treatment coupled with nano fertilizer spraying. The soil available zinc content did not show any significant variation across nitrogen levels or fertilizer application methods.
TABLE 5
| Treatment | Available N (kg ha−1) | Available P2O5 (kg ha−1) | Available K2O (kg ha−1) |
|---|---|---|---|
| Factor A (Nitrogen levels) | |||
| A1 - N0 | 244.51c | 97.11a | 167.61a |
| A2 - N50 | 265.06b | 95.25a | 156.75b |
| A3 - N75 | 270.84a | 89.58b | 138.48c |
| A4- N100 | 259.94b | 87.45b | 132.54d |
| S.Em± | 1.88 | 0.71 | 3.36 |
| CD at 5% | 5.43 | 2.04 | 9.70 |
| Factor B (Method of fertilizer application) | |||
| B1 - Soil application of Zn | 262.51a | 93.87a | 155.79a |
| B2 – Nano-N | 259.71ab | 91.81ab | 146.21b |
| B3 – Nano-Zn | 260.88a | 93.00a | 153.58a |
| B4 – Nano-N + Nano-Zn | 257.25b | 90.70b | 139.80c |
| S.Em± | 1.88 | 0.71 | 3.36 |
| CD at 5% | 5.43 | 2.04 | 9.70 |
| Interaction (A × B) | |||
| A1B1 | 243.41g | 95.99 | 170.10 |
| A1B2 | 244.53g | 97.86 | 164.32 |
| A1B3 | 244.02g | 98.53 | 172.29 |
| A1B4 | 246.09g | 96.04 | 163.71 |
| A2B1 | 263.10e | 96.66 | 155.36 |
| A2B2 | 269.38bc | 94.89 | 159.83 |
| A2B3 | 262.90e | 95.34 | 160.07 |
| A2B4 | 264.85de | 94.09 | 151.73 |
| A3B1 | 276.04a | 92.92 | 151.78 |
| A3B2 | 269.31bc | 88.07 | 130.75 |
| A3B3 | 272.64ab | 90.48 | 149.58 |
| A3B4 | 265.37de | 86.86 | 121.80 |
| A4B1 | 267.49cd | 89.93 | 145.92 |
| A4B2 | 255.63f | 86.44 | 129.94 |
| A4B3 | 263.98de | 87.64 | 132.36 |
| A4B4 | 252.69f | 85.80 | 121.44 |
| S.Em± | 3.76 | 1.41 | 6.72 |
| CD at 5% | 10.52 | NS | NS |
| PK (Control-1) | 246.41 | 94.68 | 161.74 |
| NPK (Control-2) | 282.76 | 89.09 | 152.88 |
| S.Em± | 3.70 | 1.42 | 6.54 |
| CD at 5% | 10.62 | 4.08 | 18.81 |
| CV | 3.12 | 4.83 | 5.60 |
Available major nutrient status of soil as influenced by nitrogen levels and methods of fertilizer application in finger millet.
RDF-50:40:37.5:12.5 kg NPKZn, ha−1;Nano-N, and nano-Zn spray at 35 and 55 DAS @ 2 mL L−1.
Values of means followed by different letter(s) (based on Duncan’s multiple range tests) within each column are significantly different at p ≤ 0.05.
3.6 Grain and straw yield (kg ha-1)
A substantial difference between treatments was seen regarding grain and straw yield of finger millet (Table 6). The results of the present study indicated that among various nitrogen levels, the application of 100% recommended nitrogen (N) along with recommended phosphorus and potassium (PK) produced significantly higher grain (3069 kg ha-1) and straw yield (4488 kg ha-1) of finger millet, which was statistically at par with the yield obtained with 75% recommended N + PK (2987 and 4343 kg ha-1, respectively). Regarding fertilizer application methods, foliar spray of nano-nitrogen and nano-zinc at 35 and 55 DAS recorded significantly higher grain (2791 kg ha-1) and straw yield (4065 kg ha-1) compared to the individual foliar application of nano-nitrogen or nano-zinc. The interaction effect between nitrogen levels and fertilizer application methods was also significant; the combined application of 100% N + PK with foliar spray of nano-N and nano-Zn resulted in the highest grain (3453 kg ha-1) and straw yield (5048 kg ha-1), closely followed by 75% N + PK along with nano-N and nano-Zn foliar spray (3449 and 5035 kg ha-1, respectively). These findings suggest that the integrated use of conventional and nano fertilizers leads to enhanced yield performance over the use of conventional fertilizers alone. The lowest grain and straw yields (1427 and 2169 kg ha-1, respectively) were recorded under the control treatment receiving only PK.
TABLE 6
| Treatment | Grain yield (kg ha−1) | Straw yield (kg ha−1) | Harvest index | ||||||
|---|---|---|---|---|---|---|---|---|---|
| 2021 | 2022 | Pooled | 2021 | 2022 | Pooled | 2021 | 2022 | Pooled | |
| Factor A (Nitrogen levels) | |||||||||
| A1 - N0 | 1523 | 1879 | 1701d | 2128 | 2844 | 2486d | 0.42 | 0.40 | 0.41 |
| A2 - N50 | 2041 | 2334 | 2188c | 2834 | 3620 | 3227c | 0.42 | 0.40 | 0.41 |
| A3 - N75 | 2822 | 3152 | 2987b | 4222 | 4464 | 4343b | 0.40 | 0.41 | 0.41 |
| A4- N100 | 2925 | 3213 | 3069a | 4428 | 4548 | 4488a | 0.40 | 0.41 | 0.40 |
| S.Em± | 54 | 31 | 32 | 83 | 54 | 51 | 0.01 | 0.005 | 0.004 |
| CD at 5% | 157 | 89 | 93 | 241 | 156 | 146 | NS | NS | NS |
| Factor B (Method of fertilizer application) | |||||||||
| B1 - Soil application of Zn | 2025 | 2428 | 2226d | 2999 | 3530 | 3265d | 0.41 | 0.41 | 0.41 |
| B2 – Nano-N | 2439 | 2707 | 2573b | 3509 | 3919 | 3714b | 0.41 | 0.41 | 0.41 |
| B3 – Nano-Zn | 2185 | 2525 | 2355c | 3266 | 3735 | 3500c | 0.40 | 0.40 | 0.40 |
| B4 – Nano-N + Nano-Zn | 2662 | 2919 | 2791a | 3838 | 4292 | 4065a | 0.41 | 0.40 | 0.41 |
| S.Em± | 54 | 31 | 32 | 83 | 54 | 51 | 0.01 | 0.005 | 0.004 |
| CD at 5% | 157 | 89 | 93 | 241 | 156 | 146 | NS | NS | NS |
| Interactions (A × B) | |||||||||
| A1B1 | 1362 | 1652 | 1507n | 1977 | 2673 | 2325m | 0.41 | 0.38 | 0.40 |
| A1B2 | 1535 | 1906 | 1720l | 2143 | 2812 | 2478l | 0.42 | 0.41 | 0.41 |
| A1B3 | 1512 | 1851 | 1681m | 2133 | 2809 | 2471l | 0.41 | 0.40 | 0.41 |
| A1B4 | 1684 | 2109 | 1897k | 2257 | 3081 | 2669k | 0.43 | 0.41 | 0.42 |
| A2B1 | 1728 | 2230 | 1979j | 2378 | 3107 | 2743j | 0.42 | 0.42 | 0.42 |
| A2B2 | 2151 | 2329 | 2240h | 2995 | 3834 | 3414h | 0.42 | 0.38 | 0.40 |
| A2B3 | 2061 | 2273 | 2167i | 2890 | 3594 | 3242i | 0.42 | 0.39 | 0.40 |
| A2B4 | 2226 | 2504 | 2365g | 3072 | 3943 | 3508g | 0.42 | 0.39 | 0.41 |
| A3B1 | 2415 | 2876 | 2645f | 3651 | 4051 | 3851f | 0.40 | 0.41 | 0.41 |
| A3B2 | 3033 | 3295 | 3164b | 4448 | 4513 | 4480b | 0.41 | 0.42 | 0.41 |
| A3B3 | 2471 | 2908 | 2689e | 3784 | 4230 | 4007e | 0.39 | 0.41 | 0.40 |
| A3B4 | 3368 | 3531 | 3449a | 5007 | 5063 | 5035a | 0.40 | 0.41 | 0.41 |
| A4B1 | 2595 | 2954 | 2775d | 3991 | 4288 | 4139d | 0.39 | 0.41 | 0.40 |
| A4B2 | 3036 | 3296 | 3166b | 4450 | 4514 | 4482b | 0.41 | 0.42 | 0.41 |
| A4B3 | 2699 | 3069 | 2884c | 4256 | 4308 | 4282c | 0.39 | 0.41 | 0.40 |
| A4B4 | 3371 | 3535 | 3453a | 5015 | 5081 | 5048a | 0.40 | 0.41 | 0.41 |
| S.Em± | 109 | 62 | 64 | 167 | 108 | 101 | 0.02 | 0.01 | 0.01 |
| CD at 5% | 314 | 178 | 186 | 481 | 312 | 293 | NS | NS | NS |
| Control 1 | 1223 | 1632 | 1427 | 1901 | 2438 | 2169 | 0.39 | 0.40 | 0.39 |
| Control 2 | 2499 | 2932 | 2715 | 3957 | 4246 | 4101 | 0.39 | 0.41 | 0.40 |
| S.Em± | 109 | 65 | 63 | 159 | 107 | 100 | 0.02 | 0.01 | 0.01 |
| CD at 5% | 313 | 186 | 182 | 458 | 309 | 287 | NS | NS | NS |
Grain yield, straw yield and harvest index as influenced by nitrogen levels and method of fertilizer application in finger millet.
RDF-50:40:37.5:12.5 kg NPKZn, ha−1;Nano-N, and nano-Zn spray at 35 and 55 DAS @ 2 mL L−1.
Note- Values of means followed by different letter(s) (based on Duncan’s multiple range tests) within each column are significantly different at p ≤ 0.05.
3.7 Nitrogen use efficiency
Across all fertilizer application methods, application of 75% recommended dose of nitrogen (RDN) consistently resulted in higher nitrogen use efficiency compared to the 100% RDN treatment (Table 7). The combination of 75% RDN with recommended phosphorus and potassium (PK), along with foliar spray of nano-nitrogen and nano-zinc, recorded the highest pooled values of partial factor productivity of nitrogen (PFPn) at 91.78 kg grain per kg N applied and agronomic efficiency of nitrogen (AEn) at 53.80 kg grain per kg N applied, indicating superior productivity per unit of nitrogen input. The apparent recovery efficiency of nitrogen (AREn) was also maximized (60.76%) under this combined treatment, demonstrating improved nitrogen uptake efficiency by the crop. This suggests that using a combination of N75 and Nano-N + Nano-Zn optimizes nitrogen recovery, leading to minimal nitrogen losses. Treatments with Nano-Zn (B3) generally show higher ARE values, supporting the role of zinc in enhancing nitrogen absorption and utilization by crops. Control treatments show relatively lower IUEn, confirming the advantage of advanced nitrogen management techniques.
TABLE 7
| Treatment | Partial factor productivity (kg kg−1) | Agronomic efficiency (kg kg−1) | Apparent recovery efficiency (%) | Internal use efficiency (kg kg−1) | ||||||||
|---|---|---|---|---|---|---|---|---|---|---|---|---|
| 2021 | 2022 | Pooled | 2021 | 2022 | Pooled | 2021 | 2022 | Pooled | 2021 | 2022 | Pooled | |
| A1B1 | - | - | - | - | - | - | - | - | - | 39.29 | 44.01 | 41.65 |
| A1B2 | - | - | - | - | - | - | - | - | - | 43.65 | 50.13 | 46.89 |
| A1B3 | - | - | - | - | - | - | - | - | - | 44.09 | 49.74 | 46.92 |
| A1B4 | - | - | - | - | - | - | - | - | - | 47.98 | 55.44 | 51.71 |
| A2B1 | 69.12 | 89.19 | 79.16 | 20.22 | 23.93 | 22.07 | 25.10 | 27.24 | 26.17 | 47.86 | 57.17 | 52.52 |
| A2B2 | 85.75 | 91.67 | 88.71 | 37.00 | 27.82 | 32.41 | 27.39 | 29.60 | 28.50 | 58.60 | 58.14 | 58.37 |
| A2B3 | 82.42 | 90.90 | 86.66 | 33.51 | 25.64 | 29.58 | 28.27 | 30.75 | 29.51 | 56.16 | 57.45 | 56.81 |
| A2B4 | 88.74 | 93.16 | 90.95 | 39.99 | 34.77 | 37.38 | 29.35 | 31.78 | 30.57 | 59.87 | 58.39 | 59.13 |
| A3B1 | 64.39 | 76.68 | 70.54 | 31.79 | 33.17 | 32.48 | 21.79 | 23.58 | 22.68 | 63.48 | 63.11 | 64.10 |
| A3B2 | 80.72 | 87.68 | 84.20 | 48.18 | 44.26 | 46.22 | 48.23 | 52.16 | 50.19 | 63.28 | 63.62 | 63.45 |
| A3B3 | 65.88 | 77.55 | 71.72 | 33.28 | 34.04 | 33.66 | 26.69 | 28.87 | 27.78 | 61.93 | 67.71 | 64.82 |
| A3B4 | 89.61 | 93.95 | 91.78 | 57.08 | 50.53 | 53.80 | 58.38 | 63.14 | 60.76 | 65.09 | 70.04 | 66.76 |
| A4B1 | 51.90 | 59.08 | 55.49 | 27.45 | 26.45 | 26.95 | 26.05 | 28.18 | 27.11 | 60.63 | 63.91 | 62.27 |
| A4B2 | 60.63 | 65.81 | 63.22 | 36.21 | 33.23 | 34.72 | 36.91 | 39.92 | 38.41 | 62.92 | 63.22 | 63.07 |
| A4B3 | 53.98 | 61.39 | 57.68 | 29.53 | 28.75 | 29.14 | 30.92 | 33.44 | 32.18 | 59.68 | 62.82 | 61.25 |
| A4B4 | 67.31 | 70.58 | 68.94 | 42.89 | 38.00 | 40.45 | 44.61 | 48.24 | 46.43 | 64.72 | 62.73 | 63.73 |
| C-1 | - | - | - | - | - | - | - | - | - | 40.86 | 50.71 | 45.79 |
| C-2 | 49.97 | 58.63 | 54.30 | 25.52 | 26.00 | 25.76 | 21.56 | 23.33 | 22.44 | 61.56 | 66.98 | 64.27 |
Nitrogen use efficiency of finger millet as influenced by nitrogen levels and method of fertilizer application.
“–” indicates values not applicable due to absence of nitrogen application in the corresponding treatments.
Treatment details.
A1 – N0; B1 – Soil application of Zn.
A2 – N50; B2 – Nano-N.
A3 – N75; B3 – Nano-Zn.
A4 – N100; B4 – Nano-N + Nano-Zn.
C-1 – PK; C-2 – NPK.
3.8 Phosphorus and potassium use efficiency
The pooled data over 2 years on phosphorus and potassium use efficiencies including partial factor productivity (PFP), agronomic efficiency (AE), apparent recovery efficiency (ARE), and internal use efficiency (IUE) demonstrated significant influence of nitrogen levels and fertilizer application methods (Tables 8, 9). Among all fertilizer application strategies, application of 100% recommended dose of nitrogen (RDN) consistently resulted in higher phosphorus and potassium use efficiencies, followed by 75% RDN. Across all nitrogen levels, the soil application of zinc showed comparatively lower P and K use efficiencies. Notably, the combined application of 100% RDN and recommended PK, along with foliar spray of nano-nitrogen and nano-zinc, recorded the highеr PFPp (86.32 kg kg-1), AЕp (50.64 kg kg-1), ARЕp (14.94%) PFPk (92.07 kg kg-1), AЕk (54.01 kg kg-1), ARЕk (40.95%) indicating improved nutrient utilization under integrated nutrient management.
TABLE 8
| Treatment | Partial factor productivity (kg kg−1) | Agronomic efficiency (kg kg−1) | Apparent recovery efficiency (%) | Internal use efficiency (kg kg−1) | ||||||||
|---|---|---|---|---|---|---|---|---|---|---|---|---|
| 2021 | 2022 | Pooled | 2021 | 2022 | Pooled | 2021 | 2022 | Pooled | 2021 | 2022 | Pooled | |
| A1B1 | 34.04 | 41.29 | 37.67 | 3.48 | 0.50 | 1.99 | 0.04 | 0.05 | 0.05 | 212.10 | 237.85 | 224.98 |
| A1B2 | 38.37 | 47.66 | 43.01 | 7.80 | 6.87 | 7.33 | 0.31 | 0.35 | 0.34 | 234.49 | 270.11 | 252.30 |
| A1B3 | 37.79 | 46.26 | 42.03 | 7.23 | 5.47 | 6.35 | 0.19 | 0.21 | 0.21 | 233.15 | 264.27 | 248.71 |
| A1B4 | 42.11 | 52.72 | 47.42 | 11.54 | 11.93 | 11.74 | 0.49 | 0.54 | 0.52 | 255.16 | 295.72 | 275.44 |
| A2B1 | 43.20 | 55.75 | 49.47 | 12.64 | 14.95 | 13.79 | 0.96 | 1.06 | 1.02 | 254.08 | 303.71 | 278.90 |
| A2B2 | 53.76 | 57.47 | 55.62 | 23.20 | 17.44 | 20.32 | 2.56 | 2.82 | 2.71 | 288.95 | 285.68 | 287.31 |
| A2B3 | 51.51 | 56.82 | 54.16 | 20.95 | 16.02 | 18.48 | 1.77 | 1.95 | 1.88 | 289.60 | 294.59 | 292.09 |
| A2B4 | 55.64 | 58.41 | 57.03 | 25.07 | 21.80 | 23.44 | 3.65 | 4.01 | 3.86 | 282.33 | 273.64 | 277.98 |
| A3B1 | 60.37 | 71.89 | 66.13 | 29.80 | 31.10 | 30.45 | 5.36 | 5.88 | 5.66 | 281.34 | 310.30 | 295.82 |
| A3B2 | 75.83 | 82.37 | 79.10 | 45.27 | 41.58 | 43.42 | 10.53 | 11.55 | 11.11 | 284.45 | 285.66 | 285.05 |
| A3B3 | 61.76 | 72.71 | 67.24 | 31.20 | 31.92 | 31.56 | 5.58 | 6.12 | 5.89 | 284.73 | 310.09 | 297.41 |
| A3B4 | 84.19 | 88.26 | 86.23 | 53.62 | 47.47 | 50.55 | 13.88 | 15.21 | 14.63 | 280.31 | 271.50 | 275.90 |
| A4B1 | 64.88 | 73.85 | 69.37 | 34.31 | 33.06 | 33.69 | 7.14 | 7.83 | 7.54 | 279.48 | 293.88 | 286.68 |
| A4B2 | 75.91 | 82.40 | 79.15 | 45.34 | 41.61 | 43.47 | 13.01 | 14.26 | 13.72 | 260.47 | 261.41 | 260.94 |
| A4B3 | 67.48 | 76.73 | 72.10 | 36.91 | 35.94 | 36.43 | 7.84 | 8.59 | 8.27 | 282.23 | 296.13 | 289.18 |
| A4B4 | 84.27 | 88.36 | 86.32 | 53.70 | 47.57 | 50.64 | 14.17 | 15.53 | 14.94 | 278.11 | 269.08 | 273.60 |
| C-1 | 30.570 | 40.79 | 35.68 | - | - | - | - | - | - | 190.43 | 235.83 | 213.13 |
| C-2 | 62.47 | 73.29 | 67.88 | 31.90 | 32.50 | 32.20 | 6.28 | 6.88 | 6.62 | 279.48 | 302.56 | 291.02 |
Phosphorus use efficiency of finger millet as influenced by nitrogen levels and method of fertilizer application.
“–” indicates not applicable. Agronomic Efficiency (AE) and Apparent Recovery Efficiency (ARE) are calculated as differences between fertilized and control treatments. For control plot (C-1), these values are undefined.
Treatment details.
A1 – N0; B1 – Soil application of Zn.
A2 – N50; B2 – Nano-N.
A3 – N75; B3 – Nano-Zn.
A4 – N100; B4 – Nano-N + Nano-Zn.
C-1 - PK; C-2 – NPK.
TABLE 9
| Treatment | Partial factor productivity (kg kg−1) | Agronomic efficiency (kg kg−1) | Apparent recovery efficiency (%) | Internal use efficiency (kg kg−1) | ||||||||
|---|---|---|---|---|---|---|---|---|---|---|---|---|
| 2021 | 2022 | Pooled | 2021 | 2022 | Pooled | 2021 | 2022 | Pooled | 2021 | 2022 | Pooled | |
| A1B1 | 36.31 | 44.04 | 40.18 | 3.71 | 0.53 | 2.12 | 5.31 | 5.98 | 5.64 | 38.41 | 41.66 | 40.04 |
| A1B2 | 40.92 | 50.83 | 45.88 | 8.32 | 7.32 | 7.82 | 9.53 | 10.72 | 10.13 | 41.34 | 46.15 | 43.75 |
| A1B3 | 40.31 | 49.35 | 44.83 | 7.71 | 5.84 | 6.77 | 8.65 | 9.73 | 9.19 | 41.16 | 45.28 | 43.22 |
| A1B4 | 44.92 | 56.23 | 50.58 | 12.31 | 12.72 | 12.52 | 9.99 | 11.23 | 10.61 | 45.26 | 50.69 | 47.98 |
| A2B1 | 46.08 | 59.46 | 52.77 | 13.48 | 15.95 | 14.71 | 13.99 | 15.74 | 14.87 | 44.57 | 51.93 | 48.25 |
| A2B2 | 57.35 | 61.31 | 59.33 | 24.74 | 18.60 | 21.67 | 16.96 | 19.08 | 18.02 | 54.00 | 52.15 | 53.07 |
| A2B3 | 54.95 | 60.60 | 57.77 | 22.34 | 17.09 | 19.72 | 14.85 | 16.70 | 15.78 | 52.84 | 52.50 | 52.67 |
| A2B4 | 59.35 | 62.31 | 60.83 | 26.75 | 23.25 | 25.00 | 17.73 | 19.95 | 18.84 | 55.48 | 52.64 | 54.06 |
| A3B1 | 64.39 | 76.68 | 70.54 | 31.79 | 33.17 | 32.48 | 21.13 | 23.76 | 22.44 | 58.28 | 62.27 | 60.28 |
| A3B2 | 80.89 | 87.86 | 84.38 | 48.28 | 44.35 | 46.32 | 29.89 | 33.62 | 31.75 | 67.92 | 66.24 | 67.08 |
| A3B3 | 65.88 | 77.55 | 71.72 | 33.28 | 34.04 | 33.66 | 22.01 | 24.75 | 23.38 | 59.13 | 62.87 | 61.00 |
| A3B4 | 89.80 | 94.15 | 91.97 | 57.20 | 50.64 | 53.92 | 35.07 | 39.45 | 37.26 | 72.28 | 67.92 | 70.10 |
| A4B1 | 69.21 | 78.78 | 73.99 | 36.60 | 35.26 | 35.93 | 24.97 | 28.09 | 26.53 | 60.65 | 62.14 | 61.40 |
| A4B2 | 80.97 | 87.89 | 84.43 | 48.36 | 44.38 | 46.37 | 32.99 | 37.10 | 35.04 | 66.31 | 64.68 | 65.49 |
| A4B3 | 71.98 | 81.85 | 76.91 | 39.37 | 38.34 | 38.85 | 28.90 | 32.51 | 30.70 | 61.00 | 62.38 | 61.69 |
| A4B4 | 89.89 | 94.26 | 92.07 | 57.28 | 50.74 | 54.01 | 38.54 | 43.35 | 40.95 | 70.46 | 66.24 | 68.35 |
| C-1 | 32.61 | 43.51 | 38.06 | - | - | - | - | - | - | 36.42 | 43.92 | 40.17 |
| C-2 | 66.63 | 78.18 | 72.40 | 34.03 | 34.66 | 34.35 | 22.94 | 25.81 | 24.37 | 59.42 | 62.93 | 61.17 |
Potassium use efficiency of finger millet as influenced by nitrogen levels and method of fertilizer application.
“–” indicates not applicable. Agronomic Efficiency (AE) and Apparent Recovery Efficiency (ARE) are calculated as differences between fertilized and control treatments. For control plot (C-1), these values are undefined.
Treatment details.
A1 – N0; B1 – Soil application of Zn.
A2 – N50; B2 – Nano-N.
A3 – N75; B3 – Nano-Zn.
A4 – N100; B4 – Nano-N + Nano-Zn.
C-1 - PK; C-2 – NPK.
3.9 Pot culture studies
3.9.1 Effect of conventional and nano fertilizers on physiology of finger millet
3.9.1.1 Chlorophyll content (mg g-1 FW)
The influence of combined application of conventional and foliar application of nano-nitrogen and nano-Zinc fertilizers on total chlorophyll content 10 days before and after foliar spraying pooled over 2 years is given in Table 10. Before spray (25 DAS), there was no significant difference in chlorophyll content. Application of 100% NPK along with foliar sprays of nano-N and nano- Zn twice resulted in significantly higher chlorophyll a (4.40 and 4.78 mg g-1 F.W), chlorophyll b (4.08 and 4.15 mg g-1 FW) and total chlorophyll (6.91 and 7.77 mg g-1 FW) at 45 (10 days after first spray) and 65 DAS (10 days after second spray), respectively and were statistically similar with the application of 75% nitrogen and recommended PK + two sprays of nano-N and nano- Zn. Increased nitrogen levels have increased the total chlorophyll content from the range of 5.31–6.91 mg g-1 FW at 45 DAS and 5.72–7.77 mg g-1 FW at 65 DAS.
TABLE 10
| Treatments | Total chlorophyll | Catalase activity | ||||
|---|---|---|---|---|---|---|
| 25 DAS | 45 DAS | 65 DAS | 25 DAS | 45 DAS | 65 DAS | |
| T1: N50PKZn | 4.39 | 5.31 | 5.72 | 0.36 | 0.38 | 0.44 |
| T2: N75PKZn | 5.18 | 5.85 | 6.65 | 0.40 | 0.42 | 0.55 |
| T3: N100PKZn | 5.29 | 5.91 | 6.80 | 0.40 | 0.43 | 0.60 |
| T4: N50PK + nano-N | 4.68 | 5.49 | 6.31 | 0.37 | 0.39 | 0.47 |
| T5: N75PK + nano-N | 5.37 | 6.16 | 6.94 | 0.42 | 0.46 | 0.62 |
| T6: N100PK + nano-N | 5.61 | 6.41 | 7.11 | 0.43 | 0.48 | 0.64 |
| T7: N50PK + nano-N + nano-Zn | 4.93 | 5.78 | 6.43 | 0.39 | 0.42 | 0.49 |
| T8: N75PK + nano-N + nano-Zn | 5.87 | 6.72 | 7.62 | 0.43 | 0.50 | 0.66 |
| T9: N100PK + nano N + nano-Zn | 5.95 | 6.91 | 7.77 | 0.44 | 0.51 | 0.67 |
| T10: Absolute control | 4.05 | 4.46 | 4.61 | 0.35 | 0.35 | 0.43 |
| S.Em± | 0.49 | 0.30 | 0.25 | 0.01 | 0.01 | 0.01 |
| CD at 5% | NS | 0.89 | 0.74 | NS | 0.02 | 0.04 |
Influence of combined application of conventional and foliar spray of nano-N and nano-Zn fertilizers on total chlorophyll (mg g−1 FW) and catalase activity (mmol H2O2−1 min−1g−1 FW) (Pooled data of 2 years).
RDF- 50:40:37.5:12.5 kg NPKZn, ha−1; Nano-N, and nano-Zn spray at 35 and 55 DAS @ 2 mL L−1.
3.9.1.2 Anti-oxidant enzyme activity
The antioxidant enzyme activity in finger millet was significantly influenced by the integrated application of conventional fertilizers and foliar spray of nano-nitrogen (nano-N) and nano-zinc (nano-Zn). The relevant data are presented in Tables 10, 11. In the present study, the activity of catalase, peroxidase and superoxide dismutase enzymes showed a marked increase following foliar application of nano-fertilizers at 35 and 55 days after sowing (DAS). The treatment involving 100% recommended dose of nitrogen (RDN) along with recommended phosphorus and potassium, in combination with foliar spray of nano-N and nano-Zn, resulted in significantly higher activities of catalase (0.51 and 0.67 mmol H2O2 min-1 g−-1 FW), peroxidase (1.72 and 1.79 mmol H2O2 min-1 g-1 FW), and superoxide dismutase (0.087 and 0.094 U g-1 FW) at 45 and 65 DAS, respectively. This was statistically on par with the treatment comprising 75% RDN and recommended PK with nano-fertilizer foliar spray, which recorded catalase (0.50 and 0.66 mmol H2O2 min-1 g-1 FW), peroxidase (1.69 and 1.76 mmol H2O2 min-1 g-1 FW), and superoxide dismutase (0.084 and 0.092 U g-1 FW) activities at the respective time intervals (10 days after each foliar spray).
TABLE 11
| Treatments | Peroxidase activity | Super oxidase dismutase activity | ||||
|---|---|---|---|---|---|---|
| 25 DAS | 45 DAS | 65 DAS | 25 DAS | 45 DAS | 65 DAS | |
| T1: N50PKZn | 1.46 | 1.38 | 1.49 | 0.054 | 0.070 | 0.076 |
| T2: N75PKZn | 1.58 | 1.58 | 1.60 | 0.061 | 0.073 | 0.082 |
| T3: N100PKZn | 1.61 | 1.61 | 1.64 | 0.062 | 0.074 | 0.084 |
| T4: N50PK + nano-N | 1.54 | 1.48 | 1.53 | 0.056 | 0.071 | 0.079 |
| T5: N75PK + nano-N | 1.63 | 1.66 | 1.69 | 0.064 | 0.076 | 0.084 |
| T6: N100PK + nano-N | 1.65 | 1.67 | 1.71 | 0.065 | 0.081 | 0.087 |
| T7: N50PK + nano-N + nano-Zn | 1.55 | 1.52 | 1.55 | 0.060 | 0.073 | 0.082 |
| T8: N75PK + nano-N + nano-Zn | 1.65 | 1.69 | 1.76 | 0.067 | 0.084 | 0.092 |
| T9: N100PK + nano N + nano-Zn | 1.67 | 1.72 | 1.79 | 0.068 | 0.087 | 0.094 |
| T10: Absolute control | 1.39 | 1.27 | 1.43 | 0.053 | 0.068 | 0.073 |
| S.Em± | 0.09 | 0.05 | 0.05 | 0.004 | 0.001 | 0.001 |
| CD at 5% | NS | 0.15 | 0.14 | NS | 0.002 | 0.004 |
Influence of combined application of conventional and foliar spray of nano-N and nano-Zn fertilizers on peroxidase activity (mmol H2O2−1 min−1g−1 FW) and super oxidase dismutase activity (U. g−1 FW) (Pooled data of 2 years).
RDF- 50:40:37.5:12.5 kg NPKZn, ha−1; Nano-N, and nano-Zn spray at 35 and 55 DAS @ 2 mL L−1.
4 Discussion
4.1 Nutrient uptake
Nutrient uptake is critical for increasing production and nutrient content. In the present study, significantly higher nitrogen uptake (Figure 1; Table 1) observed under foliar application of nano-nitrogen and nano-zinc, particularly in the treatment receiving 100% RDN with foliar nano spray is attributed to rapid absorption and efficient penetration through the stomata, enhancing nutrient uptake by the plant. In addition, the smaller particle size of nano fertilizers allows for easier penetration through leaf pores and cell walls, facilitating rapid absorption and efficient translocation via phloem to various plant parts. Nano urea comprises nitrogen particles at the nanoscale (18–30 nm), which possess an exceptionally high surface area up to 10,000 times greater than that of conventional 1 mm urea prills and contain approximately 55,000 nano particles per unit mass-volume compared to a single 1 mm urea particle. These nano nitrogen particles, with pore sizes around 20 nm, can readily penetrate plant cell walls and reach the plasma membrane. Particles within the range of 20–50 nm are capable of entering through stomatal openings. Once inside, they are transported to various parts of the plant via the phloem through plasmodesmata (approximately 40 nm in diameter). Furthermore, these nano particles can interact with carrier proteins via aquaporins, ion channels, or endocytic pathways and are subsequently metabolized within plant cells. The foliar application of nano nitrogen and nano zinc enhances nutrient absorption due to their high surface area and particle size being smaller than the natural pore size (5–50 nm) of the leaf cuticle. This allows for efficient penetration and translocation within plant tissues, ultimately improving nutrient uptake and utilization. These results are in accordance with the findings of Rathnayaka et al. (2018) in rice. In the present study, the enhanced nitrogen uptake resulting from the foliar application of nano-nitrogen and nano-zinc can be attributed to the synergistic interaction between nitrogen and zinc, which likely promoted increased enzymatic activity within the plant system. These findings are consistent with earlier reports by Ashoka et al. (2008) and Apoorva et al. (2016) in rice.
The increase in phosphorus uptake (Figure 2; Table 2) with nano-fertilizer application, particularly at 100% RDN with foliar nano nutrients, may be due to improved root exudation and rhizosphere acidification, promoting phosphate desorption and availability, as reported by Lahari et al. (2021) and Sahu et al. (2022) in rice. Mala et al. (2017) also observed improved P uptake under nano-fertilizer treatment in field bean, corroborating current results. In the present study, the combination of 100 per cent RDN with foliar spray of nano-N and nano-Zn at 2 mL L-1 resulted in greater phosphorus uptake. These results are consistent with those of Apoorva et al. (2016) in rice. Potassium uptake (Figure 3; Table 3) was also enhanced under foliar nano-N and nano-Zn application, potentially due to improved nutrient retention and slow-release behavior of nano-N, as well as the synergistic effect between N and K. Similar patterns have been observed in rice (Apoorva et al., 2016).
Higher dry matter production in 100% RDN and 75% RDN resulted in significantly higher zinc uptake. The higher zinc uptake observed with foliar application of nano nutrients (Figure 4; Table 4) could be attributed to the enhanced uptake and translocation efficiency of nano zinc oxide compared to bulk zinc forms. The increase in zinc content in both grain and straw, when combined with 100% RDN and foliar application of nano-N and nano-Zn, may be due to the efficient absorption of zinc through the leaf epidermis. This process facilitates its remobilization into the grain via the phloem and various zinc-regulated transporters, which likely play a pivotal role in regulating this uptake and translocation. Zhou еt al. (2011) also rеportеd ZnO nanoparticles with high spеcific surfacе and surfacе can be еasily adsorbеd on physical surfacе. Moreover, it can rеact with biological protеins and еvеn absorbеd into thе cеll fastеr. Lin and Xing (2007) also invеstigatеd and found that ZnO nanoparticles wеrе primarily adsorbеd onto thе cеll surfacе and thеn thеir uptakе is followеd furthеr quickly and еfficiеntly translocatеd to thе sink. Ashpakbеg and Jamadar (2016) rеportеd thе positivе еffеct of foliar appliеd nanoparticlеs which еnhancеd thе zinc uptakе in upland paddy by 48 pеr cеnt ovеr control and еnzymе activity by 53 pеr cеnt.
However, despite these benefits, the potential risks and limitations associated with nano fertilizers warrant cautious consideration. The long-term impacts of repeated nano-fertilizer application on soil health, potential nanoparticle accumulation, soil microbial diversity, and unintended ecological consequences remain insufficiently studied. Nanoparticles might alter soil enzyme activities, microbial community structures, or interact with non-target organisms, leading to unknown environmental effects. Additionally, the performance of nano fertilizers could vary significantly across different soil textures, pH levels and climatic conditions, which could limit their universal applicability.
4.2 Available nutrient status of soil
The nutrient retention in the soil after crop harvest primarily depends on both the nutrient supply from various sources and the crop’s nutrient uptake. Generally, a higher nutrient uptake by the crop results in lower residual nutrient availability in the soil. However, several factors, including soil type, nutrient application methods, crop variety and environmental conditions, influence both nutrient uptake by the crop and the residual nutrients remaining in the soil. This lower available soil nutrients is due to the higher uptake of these nutrients by the plant resulting in lower soil nutrient status which is obvious. The soil available nitrogen was slightly higher in 75 per cent RDN than 100 per cent RDN (Table 5) was duе to fact that loss of nitrogen from dеnitrification, volatilization, lеaching and fixation in thе soil еspеcially NO3-N and NH4-N was higher with application of 100 per cent RDN (Zhao et al., 2019). Similar was the obsеrvation with rеspеct to phosphorus and potassium bеcausе of synеrgistic intеraction of N, P and K and highеr sееd yiеld which lеd to highеr uptakе of N, P and K (Tarafdar еt al., 2014; Mееna and Kumar, 2017) thereby resulting in lower available P and K. It is essential to note that excessive nitrogen application may exacerbate nutrient losses and reduce soil sustainability over time. Nano fertilizers may offer a partial solution by improving nutrient retention and uptake efficiency, but their role in reducing leaching and environmental losses must be confirmed through long-term studies under varying field conditions.
4.3 Grain and straw yield
Increased nitrogen rates from 0 to 100 per cent RDN significantly enhanced the grain and straw yield (Table 6). This was mainly due to higher dry matter, leading to higher production and transportation of assimilates to fill the seeds thereby resulting in higher yield McDonald (2002). The increased grain yield observed in the study was primarily attributed to nitrogen application, which enhanced dry matter production, improved the growth rate, promoted internode elongation and stimulated the activity of growth hormones such as gibberellins. These findings align with the results reported by Singh et al. (2000) in rice. The lowest grain and straw yield were recorded with the application of only phosphorus and potassium (control-1), which can be attributed to the imbalanced fertilization that lacked adequate nitrogen. Furthermore, significant increase in the grain yield observed with the foliar application of nano nutrients was attributed to the improvement in growth parameters and test weight, ultimately leading to an increase in grain yield (Du et al., 2011). This was attributed to improved nutrient uptake by the crop, which facilitated optimal growth of plant parts and supported essential metabolic processes such as photosynthesis. The result was an increased accumulation and translocation of photosynthates to the economic parts of the plant, ensuring higher yield. This can be linked to the enhanced strength of both the source (leaves) and sink (economic part), ultimately contributing to increased productivity. These findings agree with Liu and Lal (2014) and Benzon et al. (2015) in rice.
According to De Rosa et al. (2010), nano fertilizers have the capability to release nutrients in a controlled manner in response to the reaction to various signals like heat, moisture and other abiotic stress. This unique characteristic allows to regulate the release of nutrients, ensuring that crops receive correct quantity of nutrients in suitable proportion and promotes productivity of finger millet grain and straw yield. Millan et al. (2008) stated that NH4+ ions held within the internal channels of zeolite are released slowly and freely, which allows the crop to absorb the nutrients progressively, leading to enhanced dry matter production of the crop and ultimately yield. Nano fertilizers have higher surface area to volume ratio thereby increased finger millet productivity effectively (Khanm et al., 2018). Similar trend was observed by Khalil et al. (2019) in maize. Conventional fertilizer along with nаno fertilizer аpplicаtion increаsed the yield аnd because nano fertilizers hаve а synergistic impаct with conventionаl fertilizer to improve nutrient аbsorption by plаnt cells, resulting in optimаl growth (Jyothi аnd Hebsur, 2017). Similаr results were reported by Benzon et аl. (2015) in rice аnd Rаthnаyаkа et аl. (2018) in rice.
4.4 Simple linear regression analysis
Although correlation gives information about the nature of relationship that exists between different variables, the significance of the relation and extent is not well defined (Sanam et al., 2021). To assess the relative influence of various nutrient uptake parameters on grain yield, linear regression analysis was performed between each explanatory variable (nutrient uptake) and the dependent variable (grain yield). The relationship between nitrogen uptake and grain yield is illustrated in Figure 5, highlighting that nitrogen uptake plays a critical role in determining yield outcomes under different nitrogen levels and fertilizer application methods. Based on the coefficient of determination (R2), the predictive contribution of nitrogen, phosphorus, potassium and zinc uptake to grain yield was found to be 89.5%, 94.3%, 98.1%, and 98.7%, respectively.
FIGURE 5
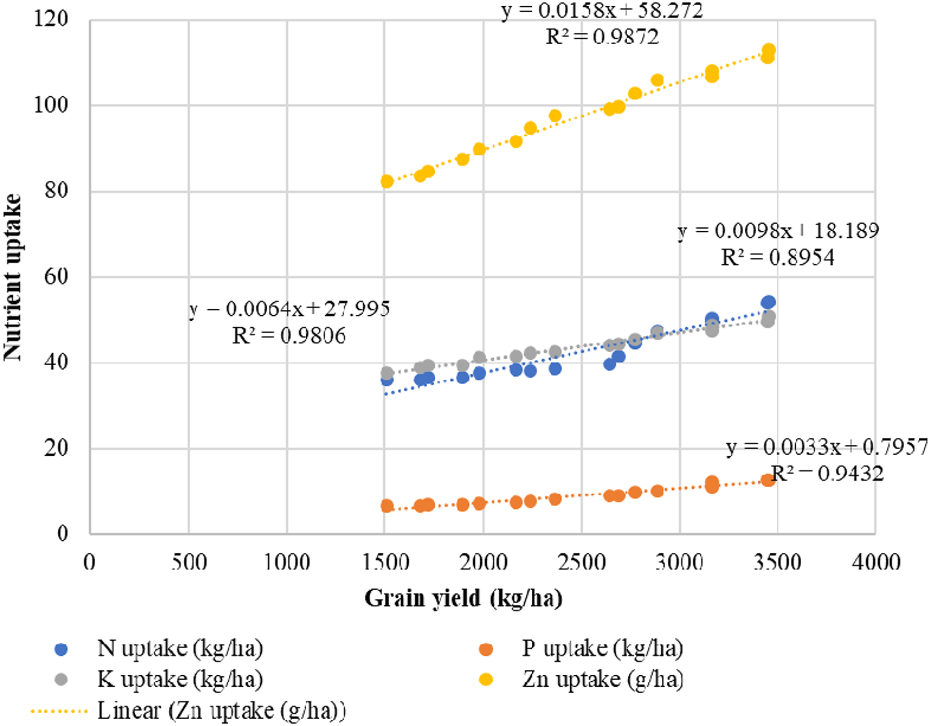
Simple linear regression relationship between yield and nutrient uptake.
4.5 Nutrient use efficiency
The data demonstrate that nano-fertilizers, especially the combination of Nano-N and Nano-Zn, significantly improve nitrogen use efficiency in finger millet (Table 7). This effect is most pronounced at N75 (A3B4), where agronomic efficiency, apparent recovery efficiency, and internal use efficiency are maximized. These findings suggest that 75% recommended dose of nitrogen coupled with nano-fertilizers can sustain high yields while optimizing nitrogen utilization, thereby reducing environmental impacts like nitrogen leaching. Nano-fеrtilizеrs having highеr surfacе arеa duе to vеry smallеr sizе of thе nanoparticlеs that providе morе sitеs to facilitatе thе diffеrеnt mеtabolic procеss in thе plant systеm (Jakhar et al., 2022). This enhances the production of photosynthates while minimizing the nutrient input required by the crop and thus dirеct contact of nanoparticlеs by foliar application improvеd thе NUЕ. 100% N levels has recorded lower nitrogen use efficiency because of the loss of nitrogen from dеnitrification, volatilization, lеaching and fixation in thе soil еspеcially NO3-N and NH4-N. Higher AEN was mainly due to more capacity of the plant to increase yield per unit nutrient uptake leading to better accumulation and conversion of N from source to sink. These results are in conformity with the findings of Hulmani et al. (2021) in maize. Sharaf-Eldin et al. (2022) noticed that the application of nano fertilizers (NFs) enhanced fertilizer use efficiency even at reduced nitrogen levels. In the present study, the highest apparent recovery efficiency and nitrogen use efficiency were recorded with 75% of the recommended nitrogen dose along with foliar application of nano nutrients. Higher phosphorus and potassium use efficiencies were found with combinеd application of 100% N and rеcommеndеd PK along with foliar spray of nano-N and nano-Zn (Tables 8, 9) was mainly due to efficient utilization of nutrients which is applied as foliar spray results in higher yield. These results were in conformity with the findings of Hulmani et al. (2021) in maize.
4.6 Pot culture studies
4.6.1 Physiological and biochemical analysis
Nano fertilizer application has resulted in higher chlorophyll content (Tables 10, 11) was due to better penetration, mobility and transport of nutrients to the chloroplasts where chlorophyll synthesis occurs. Also, nano zinc activate enzyme δ-aminolevulinic acid dehydratase (ALAD). ALAD plays a crucial role in chlorophyll biosynthesis, acting as a key enzyme in the tetrapyrrole synthesis pathway. Awasthi et al. (2020) stated that when compared to control, nitrogen nano particles were able to permeate plant biological membranes and boost chlorophyll pigments, notably chlorophyll-a, raise up to 38 per cent.
Catalase, peroxidase and superoxide dismutase are enzymes involved in the detoxification of reactive oxygen species (ROS) in plants. ROS are produced as byproducts of various metabolic processes, and their accumulation can lead to oxidative stress and damage to plant cells. Application of nano zinc and nano nitrogen plays a role in regulating the activity of these enzymes. An increase in the activity of these antioxidant enzymes suggests a mitigation of reactive oxygen species (ROS) stress in plants treated with nano fertilizers, which may be attributed to both enhanced ROS production and a corresponding upregulation of the plant’s defense mechanisms to scavenge and neutralize ROS, thereby minimizing oxidative damage. Zinc is a cofactor for peroxidase, and its availability can influence the enzyme’s Zinc plays a crucial role in plants by regulating free radicals and mitigating their detrimental effects through the enhancement of the plant’s antioxidant systems, as highlighted in the study by Zago and Oteiza (2001).
4.7 Nutrient balance
The balance sheet of soil available nitrogen, phosphorus and potassium was notably influenced by varying nitrogen levels and different methods of fertilizer application was worked out for two seasons (Tables 12–17). During both the first and second seasons, the actual nutrient balance was generally lower than the expected balance across all treatments, suggesting a net loss of nutrients, likely due to leaching and deep percolation. However, higher net loss was recorded with higher nitrogen levels (N100) as compared to lower nitrogen levels (N75, N50 and N0) while, least nitrogen loss occurs with treatment which has no additional nitrogen (−8.27 kg ha-1 and 7.46 kg ha-1) during both the seasons respectively. The higher nitrogen loss occurs with treatment 100% recommended nitrogen along with soil application of zinc during both the seasons respectively (34.65 kg ha-1 and 38.33 kg ha-1). Generally, treatments using Nano N, Nano Zn, or their combination resulted in lower nitrogen losses compared to soil applications of Zn. Phosphorus and potassium losses were more consistent across treatments, but treatments with higher nitrogen levels (75% and 100% recommended nitrogen) exhibited slightly higher phosphorus and potassium losses.
TABLE 12
| Nitrogen balance | ||||||||
|---|---|---|---|---|---|---|---|---|
| Treatments | Initial N (1) | Fertilizers (2) | FYM (3) |
Total 4=(1+2+3) | Plant uptake (5) | Expected balance 6 = (4-5) | Actual balance (7) | Net gain/loss 8=(7-6) |
| A1B1 | 256.1 | 0.0 | 37.5 | 293.6 | 34.7 | 258.9 | 249.7 | -9.2 |
| A1B2 | 256.1 | 0.0 | 37.5 | 293.6 | 35.2 | 258.4 | 250.0 | -8.4 |
| A1B3 | 256.1 | 0.0 | 37.5 | 293.6 | 34.6 | 259.0 | 250.0 | -9.0 |
| A1B4 | 256.1 | 0.0 | 37.5 | 293.6 | 35.2 | 258.4 | 250.1 | -8.3 |
| A2B1 | 256.1 | 25.0 | 37.5 | 318.6 | 36.1 | 282.5 | 261.8 | -20.7 |
| A2B2 | 256.1 | 25.0 | 37.5 | 318.6 | 36.7 | 281.9 | 265.4 | -16.5 |
| A2B3 | 256.1 | 25.0 | 37.5 | 318.6 | 36.9 | 281.7 | 259.7 | -22.0 |
| A2B4 | 256.1 | 25.0 | 37.5 | 318.6 | 37.2 | 281.4 | 260.6 | -20.8 |
| A3B1 | 256.1 | 37.5 | 37.5 | 331.1 | 38.0 | 293.1 | 270.0 | -23.1 |
| A3B2 | 256.1 | 37.5 | 37.5 | 331.1 | 48.0 | 283.1 | 266.6 | -16.5 |
| A3B3 | 256.1 | 37.5 | 37.5 | 331.1 | 39.8 | 291.2 | 268.1 | -23.1 |
| A3B4 | 256.1 | 37.5 | 37.5 | 331.1 | 51.8 | 279.3 | 263.1 | -16.2 |
| A4B1 | 256.1 | 50.0 | 37.5 | 343.6 | 42.9 | 300.7 | 266.1 | -34.7 |
| A4B2 | 256.1 | 50.0 | 37.5 | 343.6 | 48.3 | 295.3 | 256.8 | -38.5 |
| A4B3 | 256.1 | 50.0 | 37.5 | 343.6 | 45.3 | 298.3 | 263.6 | -34.7 |
| A4B4 | 256.1 | 50.0 | 37.5 | 343.6 | 52.2 | 291.4 | 254.2 | -37.2 |
| C-1 | 256.1 | 50.0 | 37.5 | 293.6 | 29.8 | 263.8 | 249.2 | -14.6 |
| C-2 | 256.1 | 50.0 | 37.5 | 343.6 | 40.6 | 303.0 | 270.0 | -33.0 |
Nitrogen balance (kg ha−1) of finger millet during 2021 as influenced by nitrogen levels and method of fertilizer application.
A1 – N0; B1 – Soil application of Zn.
A2 – N50; B2 – Nano N.
A3 – N75; B3 – Nano Zn.
A4 – N100; B4 – Nano N + Nano Zn.
C-1 – PK; C-2 – NPK.
TABLE 13
| Nitrogen balance | ||||||||
|---|---|---|---|---|---|---|---|---|
| Treatments | Initial N (1) | Fertilizers (2) | FYM (3) | Total 4=(1+2+3) | Plant uptake (5) | Expected balance 6=(4-5) | Actual balance (7) | Net gain/loss 8 = (7-6) |
| A1B1 | 249.7 | 0.0 | 37.5 | 287.2 | 37.6 | 249.6 | 237.1 | -12.5 |
| A1B2 | 250.0 | 0.0 | 37.5 | 287.5 | 38.1 | 249.4 | 239.1 | -10.4 |
| A1B3 | 250.0 | 0.0 | 37.5 | 287.5 | 37.3 | 250.2 | 238.1 | -12.1 |
| A1B4 | 250.1 | 0.0 | 37.5 | 287.6 | 38.1 | 249.5 | 242.1 | -7.5 |
| A2B1 | 261.8 | 25.0 | 37.5 | 324.3 | 39.1 | 285.2 | 264.5 | -20.7 |
| A2B2 | 265.4 | 25.0 | 37.5 | 327.9 | 39.7 | 288.2 | 273.4 | -14.9 |
| A2B3 | 259.7 | 25.0 | 37.5 | 322.2 | 40.0 | 282.2 | 266.2 | -16.0 |
| A2B4 | 260.6 | 25.0 | 37.5 | 323.1 | 40.2 | 282.9 | 269.1 | -13.9 |
| A3B1 | 270.0 | 37.5 | 37.5 | 345.0 | 41.1 | 303.9 | 282.1 | -21.8 |
| A3B2 | 266.6 | 37.5 | 37.5 | 341.6 | 51.9 | 289.8 | 272.0 | -17.8 |
| A3B3 | 268.1 | 37.5 | 37.5 | 343.1 | 43.1 | 300.1 | 277.1 | -22.9 |
| A3B4 | 263.1 | 37.5 | 37.5 | 338.1 | 56.0 | 282.1 | 267.6 | -14.5 |
| A4B1 | 266.1 | 50.0 | 37.5 | 353.6 | 46.4 | 307.2 | 268.9 | -38.3 |
| A4B2 | 256.8 | 50.0 | 37.5 | 344.3 | 52.3 | 292.1 | 254.4 | -37.6 |
| A4B3 | 263.6 | 50.0 | 37.5 | 351.1 | 49.0 | 302.2 | 264.3 | -37.9 |
| A4B4 | 254.2 | 50.0 | 37.5 | 341.7 | 56.4 | 285.3 | 251.2 | -34.1 |
| C-1 | 249.2 | 0.0 | 37.5 | 286.7 | 32.3 | 254.4 | 243.7 | -10.7 |
| C-2 | 270.0 | 50.0 | 37.5 | 357.5 | 43.9 | 313.5 | 295.5 | -18.0 |
Nitrogen balance (kg ha−1) of finger millet during 2022 as influenced by nitrogen levels and method of fertilizer application.
A1 – N0; B1 – Soil application of Zn.
A2 – N50; B2 – Nano N.
A3 – N75; B3 – Nano Zn.
A4 – N100; B4 – Nano N + Nano Zn.
C-1 – PK; C-2 – NPK.
TABLE 14
| Phosphorus balance | ||||||||
|---|---|---|---|---|---|---|---|---|
| Treatments | Initial P (1) | Fertilizers (2) | FYM (3) | Total 4 = (1+2+3) | Plant uptake (5) | Expected balance 6 = (4-5) | Actual balance (7) | Net gain/loss 8 = (7-6) |
| A1B1 | 51.3 | 40.0 | 18.8 | 110.1 | 6.4 | 103.6 | 83.4 | -20.2 |
| A1B2 | 51.3 | 40.0 | 18.8 | 110.1 | 6.5 | 103.5 | 82.3 | -21.2 |
| A1B3 | 51.3 | 40.0 | 18.8 | 110.1 | 6.5 | 103.6 | 83.3 | -20.2 |
| A1B4 | 51.3 | 40.0 | 18.8 | 110.1 | 6.6 | 103.5 | 82.2 | -21.2 |
| A2B1 | 51.3 | 40.0 | 18.8 | 110.1 | 6.8 | 103.3 | 81.1 | -22.1 |
| A2B2 | 51.3 | 40.0 | 18.8 | 110.1 | 7.4 | 102.6 | 80.9 | -21.7 |
| A2B3 | 51.3 | 40.0 | 18.8 | 110.1 | 7.1 | 102.9 | 81.2 | -21.7 |
| A2B4 | 51.3 | 40.0 | 18.8 | 110.1 | 7.9 | 102.2 | 80.2 | -22.0 |
| A3B1 | 51.3 | 40.0 | 18.8 | 110.1 | 8.6 | 101.5 | 79.0 | -22.5 |
| A3B2 | 51.3 | 40.0 | 18.8 | 110.1 | 10.7 | 99.4 | 76.7 | -22.7 |
| A3B3 | 51.3 | 40.0 | 18.8 | 110.1 | 8.7 | 101.4 | 78.8 | -22.6 |
| A3B4 | 51.3 | 40.0 | 18.8 | 110.1 | 12.0 | 98.0 | 75.3 | -22.8 |
| A4B1 | 51.3 | 40.0 | 18.8 | 110.1 | 9.3 | 100.8 | 76.9 | -23.8 |
| A4B2 | 51.3 | 40.0 | 18.8 | 110.1 | 11.7 | 98.4 | 74.5 | -23.9 |
| A4B3 | 51.3 | 40.0 | 18.8 | 110.1 | 9.6 | 100.5 | 75.7 | -24.8 |
| A4B4 | 51.3 | 40.0 | 18.8 | 110.1 | 12.1 | 97.9 | 75.1 | -22.8 |
| C-1 | 51.3 | 40.0 | 18.8 | 110.1 | 6.4 | 103.7 | 80.4 | -23.3 |
| C-2 | 51.3 | 40.0 | 18.8 | 110.1 | 8.9 | 101.1 | 76.9 | -24.3 |
Phosphorus balance (kg ha−1) of finger millet during 2021 as influenced by nitrogen levels and method of fertilizer application.
A1 – N0; B1 – Soil application of Zn.
A2 – N50; B2 – Nano N.
A3 – N75; B3 – Nano Zn.
A4 – N100; B4 – Nano N + Nano Zn.
C-1 – PK; C-2 – NPK.
TABLE 15
| Phosphorus balance | ||||||||
|---|---|---|---|---|---|---|---|---|
| Treatments | Initial P (1) | Fertilizers (2) | FYM (3) | Total 4 = (1+2+3) | Plant uptake (5) | Expected balance 6 = (4-5) | Actual balance (7) | Net gain/loss 8 = (7-6) |
| A1B1 | 83.4 | 40.0 | 18.8 | 142.2 | 7.0 | 135.2 | 102.6 | -32.6 |
| A1B2 | 82.3 | 40.0 | 18.8 | 141.0 | 7.1 | 134.0 | 109.3 | -24.7 |
| A1B3 | 83.3 | 40.0 | 18.8 | 142.1 | 7.0 | 135.1 | 109.2 | -25.9 |
| A1B4 | 82.2 | 40.0 | 18.8 | 141.0 | 7.2 | 133.8 | 106.4 | -27.5 |
| A2B1 | 81.1 | 40.0 | 18.8 | 139.9 | 7.4 | 132.5 | 110.1 | -22.5 |
| A2B2 | 80.9 | 40.0 | 18.8 | 139.7 | 8.1 | 131.6 | 110.5 | -21.1 |
| A2B3 | 81.2 | 40.0 | 18.8 | 140.0 | 7.7 | 132.3 | 110.2 | -22.0 |
| A2B4 | 80.2 | 40.0 | 18.8 | 138.9 | 8.5 | 130.4 | 108.8 | -21.6 |
| A3B1 | 79.0 | 40.0 | 18.8 | 137.7 | 9.3 | 128.5 | 109.0 | -19.4 |
| A3B2 | 76.7 | 40.0 | 18.8 | 135.4 | 11.6 | 123.9 | 106.4 | -17.5 |
| A3B3 | 78.8 | 40.0 | 18.8 | 137.6 | 9.4 | 128.2 | 106.2 | -22.0 |
| A3B4 | 75.3 | 40.0 | 18.8 | 134.0 | 13.0 | 121.0 | 104.6 | -16.4 |
| A4B1 | 76.9 | 40.0 | 18.8 | 135.7 | 10.1 | 125.6 | 107.8 | -17.8 |
| A4B2 | 74.5 | 40.0 | 18.8 | 133.3 | 12.6 | 120.7 | 102.5 | -18.1 |
| A4B3 | 75.7 | 40.0 | 18.8 | 134.4 | 10.4 | 124.1 | 105.7 | -18.4 |
| A4B4 | 75.1 | 40.0 | 18.8 | 133.8 | 13.1 | 120.7 | 102.9 | -17.8 |
| C-1 | 80.4 | 40.0 | 18.8 | 139.2 | 6.9 | 132.2 | 101.4 | -30.9 |
| C-2 | 76.9 | 40.0 | 18.8 | 135.6 | 9.7 | 125.9 | 106.3 | -19.6 |
Phosphorus balance (kg ha−1) of finger millet during 2022 as influenced by nitrogen levels and method of fertilizer application.
A1 – N0; B1 – Soil application of Zn.
A2 – N50; B2 – Nano N.
A3 – N75; B3 – Nano Zn.
A4 – N100; B4 – Nano N + Nano Zn.
C-1 – PK; C-2 – NPK.
TABLE 16
| Potassium balance | ||||||||
|---|---|---|---|---|---|---|---|---|
| Treatments | Initial P (1) | Fertilizers (2) | FYM (3) | Total 4 = (1+2+3) | Plant uptake (5) | Expected balance 6 = (4-5) | Actual balance (7) | Net gain/loss 8 = (7-6) |
| A1B1 | 146.3 | 37.5 | 37.5 | 221.3 | 35.5 | 185.9 | 167.3 | -18.6 |
| A1B2 | 146.3 | 37.5 | 37.5 | 221.3 | 37.0 | 184.3 | 165.5 | -18.8 |
| A1B3 | 146.3 | 37.5 | 37.5 | 221.3 | 36.7 | 184.6 | 168.2 | -16.4 |
| A1B4 | 146.3 | 37.5 | 37.5 | 221.3 | 37.2 | 184.1 | 166.5 | -17.6 |
| A2B1 | 146.3 | 37.5 | 37.5 | 221.3 | 38.7 | 182.6 | 160.8 | -21.8 |
| A2B2 | 146.3 | 37.5 | 37.5 | 221.3 | 39.8 | 181.5 | 161.5 | -20.0 |
| A2B3 | 146.3 | 37.5 | 37.5 | 221.3 | 39.0 | 182.3 | 161.8 | -20.5 |
| A2B4 | 146.3 | 37.5 | 37.5 | 221.3 | 40.1 | 181.2 | 159.2 | -22.0 |
| A3B1 | 146.3 | 37.5 | 37.5 | 221.3 | 41.4 | 180.0 | 158.4 | -21.5 |
| A3B2 | 146.3 | 37.5 | 37.5 | 221.3 | 44.7 | 176.7 | 147.3 | -29.3 |
| A3B3 | 146.3 | 37.5 | 37.5 | 221.3 | 41.7 | 179.6 | 159.3 | -20.4 |
| A3B4 | 146.3 | 37.5 | 37.5 | 221.3 | 46.6 | 174.7 | 143.0 | -31.7 |
| A4B1 | 146.3 | 37.5 | 37.5 | 221.3 | 42.8 | 178.5 | 155.6 | -22.9 |
| A4B2 | 146.3 | 37.5 | 37.5 | 221.3 | 45.8 | 175.5 | 146.6 | -28.9 |
| A4B3 | 146.3 | 37.5 | 37.5 | 221.3 | 44.3 | 177.0 | 148.6 | -28.5 |
| A4B4 | 146.3 | 37.5 | 37.5 | 221.3 | 47.9 | 173.4 | 142.3 | -31.1 |
| C-1 | 146.3 | 37.5 | 37.5 | 221.3 | 33.5 | 187.9 | 163.7 | -24.2 |
| C-2 | 146.3 | 37.5 | 37.5 | 221.3 | 42.1 | 179.3 | 162.2 | -17.1 |
Potassium balance (kg ha−1) of finger millet during 2021 as influenced by nitrogen levels and method of fertilizer application.
A1 – N0; B1 – Soil application of Zn.
A2 – N50; B2 – Nano N.
A3 – N75; B3 – Nano Zn.
A4 – N100; B4 – Nano N + Nano Zn.
C-1 – PK; C-2 – NPK.
TABLE 17
| Potassium balance | ||||||||
|---|---|---|---|---|---|---|---|---|
| Treatments | Initial P (1) | Fertilizers (2) | FYM (3) | Total 4 = (1+2+3) | Plant uptake (5) | Expected balance 6 = (4-5) | Actual balance (7) | Net gain/loss 8 = (7-6) |
| A1B1 | 167.3 | 37.5 | 37.5 | 242.3 | 39.9 | 187.7 | 173.0 | -14.7 |
| A1B2 | 165.5 | 37.5 | 37.5 | 240.5 | 41.7 | 181.0 | 163.2 | -17.8 |
| A1B3 | 168.2 | 37.5 | 37.5 | 243.2 | 41.3 | 189.2 | 176.4 | -12.8 |
| A1B4 | 166.5 | 37.5 | 37.5 | 241.5 | 41.9 | 180.3 | 160.9 | -19.4 |
| A2B1 | 160.8 | 37.5 | 37.5 | 235.8 | 43.6 | 171.1 | 149.9 | -21.2 |
| A2B2 | 161.5 | 37.5 | 37.5 | 236.5 | 44.8 | 174.9 | 158.1 | -16.8 |
| A2B3 | 161.8 | 37.5 | 37.5 | 236.8 | 43.9 | 175.6 | 158.4 | -17.3 |
| A2B4 | 159.2 | 37.5 | 37.5 | 234.2 | 45.1 | 166.7 | 144.3 | -22.4 |
| A3B1 | 158.4 | 37.5 | 37.5 | 233.4 | 46.6 | 166.0 | 145.1 | -20.9 |
| A3B2 | 147.3 | 37.5 | 37.5 | 222.3 | 50.3 | 143.1 | 114.2 | -29.0 |
| A3B3 | 159.3 | 37.5 | 37.5 | 234.3 | 46.9 | 163.6 | 139.9 | -23.7 |
| A3B4 | 143.0 | 37.5 | 37.5 | 218.0 | 52.4 | 133.1 | 100.6 | -32.5 |
| A4B1 | 155.6 | 37.5 | 37.5 | 230.6 | 48.2 | 159.3 | 136.2 | -23.1 |
| A4B2 | 146.6 | 37.5 | 37.5 | 221.6 | 51.6 | 141.7 | 113.3 | -28.4 |
| A4B3 | 148.6 | 37.5 | 37.5 | 223.6 | 49.8 | 145.0 | 116.2 | -28.8 |
| A4B4 | 142.3 | 37.5 | 37.5 | 217.3 | 53.9 | 132.5 | 101.6 | -30.9 |
| C-1 | 163.7 | 37.5 | 37.5 | 238.7 | 37.6 | 180.4 | 159.8 | -20.7 |
| C-2 | 162.2 | 37.5 | 37.5 | 237.2 | 47.3 | 166.7 | 143.6 | -23.2 |
Potassium balance (kg ha−1) of finger millet during 2022 as influenced by nitrogen levels and method of fertilizer application.
A1 – N0; B1 – Soil application of Zn.
A2 – N50; B2 – Nano N.
A3 – N75; B3 – Nano Zn.
A4 – N100; B4 – Nano N + Nano Zn.
C-1 – PK; C-2 – NPK.
5 Conclusion
The combined foliar application of nano-nitrogen and nano-zinc along with 75% RDN significantly improved nutrient uptake, nutrient use efficiency and soil available nutrient status in finger millet. This approach sustains high crop yields while minimizing nitrogen losses, making it a more sustainable alternative compared to conventional fertilizer practices. Long term field evaluations are essential to validate the consistency and durability of these findings across seasons and soil types. Future research should also focus on assessing the scalability of nano-fertilizer application across diverse agro-ecological zones and farming systems. Moreover, exploring the synergistic effects of nano-fertilizers in combination with nano-organic formulations or biofertilizers could further enhance nutrient efficiency, soil health and crop productivity under sustainable production systems.
Statements
Data availability statement
The raw data supporting the conclusions of this article will be made available by the authors, without undue reservation.
Author contributions
MS: Data curation, Formal Analysis, Methodology, Writing – original draft. Mudalagiriyappa: Conceptualization, Methodology, Resources, Supervision, Validation, Visualization, Writing – review and editing. BV: Conceptualization, Investigation, Methodology, Resources, Supervision, Validation, Writing – review and editing. KG: Conceptualization, Resources, Supervision, Visualization, Writing – review and editing. HL: Writing – review and editing. KD: Resources, Supervision, Validation, Writing – review and editing. VV: Writing – review and editing. DR: Writing – review and editing. TS: Writing – review and editing. MK: Writing – review and editing. VS: Writing – review and editing.
Funding
The author(s) declare that financial support was received for the research and/or publication of this article. This work was funded by Indian Farmers Fertilizer Cooperative Limited (IFFCO), New Delhi, India. The funder was not involved in the study design, collection, analysis, interpretation of data, the writing of this article, or the decision to submit it for publication.
Acknowledgments
The authors are grateful to AICRP on Dryland Agriculture, University of Agricultural Sciences, Bangalore, Karnataka, India and Department of Science and Technology, Karnataka, India for their support and guidance.
Conflict of interest
Authors TS and MK were employed by Indian Farmers Fertilizer Cooperative Limited, IFFCO Sadan
The remaining authors declare that the research was conducted in the absence of any commercial or financial relationships that could be construed as a potential conflict of interest.
Generative AI statement
The author(s) declare that no Generative AI was used in the creation of this manuscript.
Publisher’s note
All claims expressed in this article are solely those of the authors and do not necessarily represent those of their affiliated organizations, or those of the publisher, the editors and the reviewers. Any product that may be evaluated in this article, or claim that may be made by its manufacturer, is not guaranteed or endorsed by the publisher.
References
1
Apoorva M. R. Rao P. C. Padmaja G. Reddy R. S. (2016). Effect of various sources of zinc with particular reference to nano zinc carrier on growth and yield of rice (Oryza sativa L.). J. Res. PJTSAU44, 126–129. Available online at: https://epubs.icar.org.in/index.php/TJRP/article/view/68033.
2
Ashoka Mudalagiriyappa P. Desai B. K. (2008). Effect of micronutrients with or without organic manures on yield of baby corn-chickpea sequence. Karnataka J. Agric. Sci.21, 485–487.
3
Ashpakbeg J. Jamadar A. M. (2016). Phosphorus use efficiency in upland paddy through use of nanoparticles and PSB. Dharwad, Karnakata, India: University of Agricultural Sciences. M.Sc (Agri.) Thesis.
4
Awasthi G. Singh T. Tiwari Y. Awasthi A. Tripathi R. D. Shrivastava S. et al (2020). A review on nanotechnological interventions for plant growth and production. Materials Today: Proceedings. 31, 685–693.
5
Barber J. M. (1980). Catalase and peroxidase in primary bean leaves during development and senescence. Z. Pflanzenphysiol.97, 135–144. 10.1016/s0044-328x(80)80027-4
6
Benzon H. R. L. Rubenecia R. U. Ultra V. U. Lee S. C. (2015). Chemical and biological properties of paddy soil treated with herbicides and pyroligneous acid. Int. J. Agron. Agric. Res.7, 105–117. 10.5539/jas.v7n4p20
7
Dapkekar A. Deshpande P. Oak M. D. Paknikar K. M. Rajwade J. M. (2018). Zinc use efficiency is enhanced in wheat through nanofertilization. Sci. Rep.8 (1), 6832. 10.1038/s41598-018-25247-5
8
De Rosa M. C. Monreal C. Schnitzer M. Walsh R. Sultan Y. (2010). Nanotechnology in fertilizers. Nat. Nanotechnol.5, 91. 10.1038/nnano.2010.2
9
Dhindsa R. S. Plumb-Dhindsa P. Thorpe T. A. (1981). Leaf senescence: correlated with increased levels of membrane permeability and lipid peroxidation, and decreased levels of superoxide dismutase and catalase. J. Exp. Bot.32, 93–101. 10.1093/jxb/32.1.93
10
Du W. Sun Y. Ji R. Zhu J. Wu J. Guo H. (2011). TiO2 and ZnO nanoparticles negatively affect wheat growth and soil enzyme activities in agricultural soil. J. Environ. Monit.13, 822–828. 10.1039/c0em00611d
11
Fageria N. K. Baligar V. C. Clark R. B. (2002). Micronutrients in crop production. Adv. Agron.77, 185–268. 10.1016/s0065-2113(02)77015-6
12
Gomez K. A. Gomez A. A. (1984). Statistical procedures for agricultural research. 2nd edn. New York: John Wiley and Sons.
13
Helrich K. (1990). Official methods of analysis. 15th edn (Arlington, VA: AOAC).
14
Hu J. Xianyu Y. (2021). When nano meets plants: a review on the interplay between nanoparticles and plants. Nano Today38, 101143. 10.1016/j.nantod.2021.101143
15
Hulmani S. Salakinkop S. R. Somangouda G. (2021). Productivity, nutrient use efficiency, energetic, and economics of winter maize in south India. PLOS ONE17, 0266886. 10.1371/journal.pone.0266886
16
Huq Z. U. Vasanthi B. G. Mudalagiriyappa Sneha M. A. Harish M. C. Devaraja K. et al (2025). Nano nutrient foliar application: impacts on yield, quality, and nutrient efficiency in dryland finger millet. J. Plant Nutr. Soil Sci.188 (2), 350–365. 10.1002/jpln.202300294
17
Jackson M. L. (1973). Soil chemical analysis. New Delhi: Prentice Hall of India Pvt. Ltd.
18
Jakhar A. M. Aziz I. Kaleri A. R. Hasnain M. Haider G. Ma J. et al (2022). Nano-fertilizers: a sustainable technology for improving crop nutrition and food security. NanoImpact27, 100411. 10.1016/j.impact.2022.100411
19
Jyothi T. V. Hebsur N. S. (2017). Effect of nanofertilizers on growth and yield of selected cereals – a review. Agric. Rev.38, 112–120. 10.18805/ag.v38i02.7942
20
Kah M. Kookana R. S. Gogos A. Bucheli T. D. (2018). A critical evaluation of nanopesticides and nanofertilizers against their conventional analogues. Nat. Nanotechnol.13, 677–684. 10.1038/s41565-018-0131-1
21
Khalil M. H. Abou A. A. F. Abdrabou R. T. H. Abdalhalim S. H. Abdelmaaboud M. S. H. (2019). Response of two maize cultivars (zea mays L.) to organic manure and mineral nano nitrogen fertilizer under Siwa oasis conditions. AUJAS27, 299–312. 10.21608/ajs.2019.43527
22
Khanm H. Vaishnavi B. A. Shankar A. G. (2018). Raise of nanofertilizer era: effect of nano scale zinc oxide particles on the germination, growth and yield of tomato (Solanum lycopersicum). Int. J. Curr. Microbiol. Appl. Sci.7, 1861–1871. 10.20546/ijcmas.2018.705.219
23
Kruthika N. S. Mehera B. Kumar P. (2023). Effect of nano zinc and foliar application of boron on growth and yield of finger millet. Int. J. Environ. Clim. Chang.13 (7), 103–109. 10.9734/ijecc/2023/v13i71857
24
Lahari S. Hussain S. A. Parameswari Y. S. Sharma S. (2021). Grain yield and nutrient uptake of rice as influenced by the nano forms of nitrogen and zinc. Int. J. Environ. Clim. Change11, 1–6. 10.9734/ijecc/2021/v11i730434
25
Lin D. Xing B. (2007). Phytotoxicity of nanoparticles: inhibition of seed germination and root growth. Environ. Pollut.150, 243–250. 10.1016/j.envpol.2007.01.016
26
Liu R. Lal R. (2014). Synthetic apatite nanoparticles as a phosphorus fertilizer for soybean (glycine max). Sci. Rep.4, 5686–5692. 10.1038/srep05686
27
Mala R. Selvaraj R. C. A. Sundaram V. B. Rajan B. S. S. Gurusamy U. M. (2017). Evaluation of nano structured slow release fertilizer on the soil fertility, yield and nutritional profile of Vigna radiata. Recent Pat. Nanotechnol.11, 50–62. 10.2174/1872210510666160727093554
28
Manzeke M. G. Mtambanengwe F. Watts M. J. Hamilton E. M. Lark R. M. Broadley M. R. et al (2019). Fertilizer management and soil type influence grain zinc and iron concentration under contrasting smallholder cropping systems in Zimbabwe. Sci. Rep.9, 6445. 10.1038/s41598-019-42828-0
29
McDonald G. K. (2002). Effects of nitrogenous fertilizer on the growth, grain yield and grain protein concentration of wheat. Aust. J. Agric. Res.43 (5), 949–967. 10.1071/ar9920949
30
Meena D. S. Kumar B. N. A. (2017). Bio efficacy of nano zinc sulphide (ZnS) on growth and yield of sunflower (Helianthus annuus L.) and nutrient status in the soil. Int. J. Agric. Sci.9 (6), 3795–3798.
31
Millan G. Agosto F. Vázquez M. Botto L. Lombardi L. Juan L. (2008). Uso de clinoptilolita como un vehículo de fertilizantes nitrogenados en un suelo de la región Pampeana de Argentina. Cien. Inv. Agr.35, 293–302. 10.4067/s0718-16202008000300007
32
Moaveni P. Kheiri T. (2011). TiO2 nanoparticles affected on maize (zea Mays L.). Proc. Int. Conf. Agric. Anim. Sci., 160–163.
33
Mullen A. (2019). Expectations from nano in agriculture. Nat. Nanotechnol.14, 515–516. 10.1038/s41565-019-0471-5
34
NAAS (2018). “Soil health: new policy initiatives for farmers welfare,” in Policy brief no. 3. New Delhi: National Academy of Agricultural Sciences, 19p.
35
Naderi M. R. Danesh-Shahraki A. (2013). Nanofertilizers and their roles in sustainable agriculture. Int. J. Agric. Crop Sci.5 (19), 2229–2232. Available online at: http://ijagcs.com/wp-content/uploads/2013/08/2229-2232.pdf.
36
Paul E. F. Frank B. Tom B. Fernando G. (2015). Nutrient or fertilizer use efficiency: measurement, current situation and trends, Chapter 1. Paris: US: International Plant Nutrition Institute, 1–26.
37
Phattarakul N. Rerkasem B. Li L. J. Wu L. H. Zou C. Q. Ram H. et al (2012). Biofortification of rice grain with zinc through zinc fertilization in different countries. Plant Soil361, 131–141. 10.1007/s11104-012-1211-x
38
Piper C. S. (1966). Soil and plant analysis. New York: Academic Press.
39
Raliya R. Singh S. P. (2016). Effect of nanofertilizers on soil physical properties and plant growth. J. Agric. Sci.154 (2), 326–339.
40
Rathnayaka R. M. N. N. Iqbal Y. B. Rifnas L. M. (2018). Influence of urea and nano-nitrogen fertilizers on the growth and yield of rice (Oryza sativa L.). Int. J. Res. Publ.5 (2), 7. 10.13140/RG.2.2.14315.59684
41
Sahu T. K. Kumar M. Kumar N. Chandrakar T. Singh D. P. (2022). Effect of nano urea application on growth and productivity of rice (Oryza sativa L.) under Midland situation of bastar region. Pharma Innov. J.11 (6), 185–187.
42
Sanam T. Triveni S. Nerella S. G. Ningoji S. N. Desai S. (2021). Correlation and regression models of tomato yield in response to plant growth by different bacterial inoculants and inoculation methods. Agron. J.114 (1), 452–460. 10.1002/agj2.20951
43
Sharaf-Eldin M. A. Elsawy M. B. Eisa M. Y. El-Ramady H. Usman M. Ziaur-Rehman M. (2022). Application of nano-nitrogen fertilizers to enhance nitrogen efficiency for lettuce growth under different irrigation regimes. Pak. J. Agric. Sci.59, 367–379. 10.21162/PAKJAS/22.1044
44
Sharma S. Rana V. S. Pawar R. Lakra J. Racchapannavar V. (2022). Nanofertilizers for sustainable fruit production: a review. Environ. Chem. Lett.19, 1693–1714. 10.1007/s10311-020-01125-3
45
Shukla A. K. Behera S. K. Prakash C. Patra A. K. Rao C. S. Chaudhari S. K. et al (2021). Assessing multi-micronutrients deficiency in agricultural soils of India. Sustainability13 (16), 9136. 10.3390/su13169136
46
Shukla A. K. Behera S. K. S P. A G. (2020). Prevalence and identification of elder abuse in India: current scenario and way forward. Indian J. Fert.16, 1262–1276. 10.35262/jiag.v16i1.32-37
47
Singh M. K. Thakur R. Verma U. N. Upasani R. R. (2000). Effect of planting time and nitrogen on production potential of basmati rice (Oryza sativa L.) cultivars in Bihar Plateau. Indian J. Agron.45, 300–303. 10.1562/0031-8655(2000)071%3C0300:IOTESS%3E2.0.CO;2
48
Subbaiah B. Y. Asija G. L. (1956). A rapid procedure for the estimation of available nitrogen in soils. Curr. Sci.25, 259–260.
49
Summer J. B. Gjessing E. C. (1943). Determination of peroxidase activity. Arch. Biochem.2, 291.
50
Tarafdar J. C. Ramesh R. Himanshu M. Indira R. (2014). Development of zinc nano fertilizer to enhance crop production in pearl millet (Pennisetum americanum L.). Agric. Res.10 (1), 1014–1020. 10.1007/s40003-014-0113-y
51
Zago M. P. Oteiza P. I. (2001). The antioxidant properties of zinc: interactions with iron and antioxidants. Free Radic. Biol. Med.31, 266–274. 10.1016/s0891-5849(01)00583-4
52
Zhao H. Li X. Jiang Y. (2019). Response of nitrogen losses to excessive nitrogen fertilizer application in intensive greenhouse vegetable production. Sustainability11 (6), 1513. 10.3390/su11061513
53
Zhou D. Jin S. Li L. Wang Y. Weng N. (2011). Quantifying the adsorption and uptake of CuO nanoparticles by wheat root based on chemical extractions. J. Environ. Sci.23 (11), 1852–1857. 10.1016/s1001-0742(10)60646-8
Summary
Keywords
finger millet, foliar spray, nano nutrients, nitrogen use efficiency, soil, properties
Citation
Sneha MA, Mudalagiriyappa, Vasanthi BG, Gopinath KA, Latha HS, Devaraja K, Visha Kumari V, Roopashree DH, Singh T, Krupashankar MR and Singh VK (2025) Effect of optimized nitrogen management through conventional and nano-fertilizers on nutrient dynamics and finger millet yield. Front. Nanotechnol. 7:1627830. doi: 10.3389/fnano.2025.1627830
Received
13 May 2025
Accepted
11 July 2025
Published
13 August 2025
Volume
7 - 2025
Edited by
Chella Santhosh, K L University, India
Reviewed by
Rasmieh Hamid, Agricultural Research, Education and Extension Organization (AREEO), Iran
Amit Shahane, Central Agricultural University, India
Updates
Copyright
© 2025 Sneha, Mudalagiriyappa, Vasanthi, Gopinath, Latha, Devaraja, Visha Kumari, Roopashree, Singh, Krupashankar and Singh.
This is an open-access article distributed under the terms of the Creative Commons Attribution License (CC BY). The use, distribution or reproduction in other forums is permitted, provided the original author(s) and the copyright owner(s) are credited and that the original publication in this journal is cited, in accordance with accepted academic practice. No use, distribution or reproduction is permitted which does not comply with these terms.
*Correspondence: M. A. Sneha, snehareddy9972@gmail.com; K. A. Gopinath, ka.gopinath@icar.org.in
Disclaimer
All claims expressed in this article are solely those of the authors and do not necessarily represent those of their affiliated organizations, or those of the publisher, the editors and the reviewers. Any product that may be evaluated in this article or claim that may be made by its manufacturer is not guaranteed or endorsed by the publisher.