 Talia Tene1*
 Stefano Bellucci2
 Marco Guevara3Paul Romero4
 Henry Sebastián Mayorga Pérez4
 Lala Gahramanli5,6Rana Khankishiyeva7,8Elfahem Sakher9,10
 Cristian Vacacela Gomez11,12*
- 1Department of Chemistry, Universidad Técnica Particular de Loja, Loja, Ecuador
- 2National Institute of Materials Physics, Bucharest, Romania
- 3UNICARIBE Research Center, University of Calabria, Arcavacata di Rende, Italy
- 4Facultad de Informática y Electrónica, Escuela Superior Politécnica de Chimborazo (ESPOCH), Riobamba, Ecuador
- 5Nano Research Laboratory, Center of Excellence, Baku State University, Baku, Azerbaijan
- 6Faculty of Physics, Chemical Physics of Nanomaterials, Baku State University, Baku, Azerbaijan
- 7Institute of Radiation Problems, Ministry of Science and Education of the Republic of Azerbaijan, Baku, Azerbaijan
- 8Azerbaijan University of Architecture and Construction, Baku, Azerbaijan
- 9Faculty of Science and Technology University of Souk Ahras, Souk Ahras, Algeria
- 10Environmental Research Center (C.R.E), Annaba, Algeria
- 11Department of Environmental Engineering (DIAm), University of Calabria, Rende, Italy
- 12Universidad ECOTEC, Samborondón, Ecuador
In this work, we analyze graphene-oxide (GO)-based surface plasmon resonance (SPR) stacks of fixed architecture (SF6/metal/Si3N4/GO) at 633 nm to isolate the role of the plasmonic film (Au, Ag, Cu, and Al) in urine glucose (UGLU) sensing. Transfer-matrix simulations, validated against reference SPR data, identify the thickness windows for each layer and benchmark the angular response across a clinically relevant concentration ladder. Metals separate by function: Au yields the largest resonance-angle shifts and the highest sensitivity; Cu and Al provide the narrowest linewidths, elevating detection accuracy and quality factor; Ag offers a balanced compromise with deep minima. These trends persist over the examined UGLU range and clarify that maximizing sensitivity does not always maximize resolvability under fixed angular noise. We outline an experimentally feasible route—low-temperature Si3N4, nm-scale GO coatings and ultrathin dielectric caps for base metals—together with strategies to address urine-matrix effects and paths toward selective operation (e.g., enzyme or receptor layers). The results supply fabrication-ready prescriptions and a metal-dependent design map for urine-based SPR sensing, which is suitable for extension to multi-wavelength interrogation when dispersion data are available.
1 Introduction
Urine glucose (UGLU) is a clinically useful marker for screening and monitoring disturbances of glucose homeostasis (Feng et al., 2025). Glycosuria occurs when the blood glucose level exceeds the renal threshold and filtered glucose is not fully reabsorbed (Bayram and Kavukcu, 2025); although the threshold varies among individuals, values near 0.18 g dL-1 are commonly cited (Babińska and Władzinski, 2025). Routine urinalysis, therefore, flags UGLU qualitatively or semi-quantitatively, and sustained elevations prompt confirmatory blood testing and clinical follow-up (Chambliss and Van, 2022).
Conventional UGLU assays in clinical practice rely on colorimetric dipsticks that couple glucose oxidase/peroxidase reactions to indicator dyes (Lott and Turner, 1975). These tests are inexpensive and simple but are subject to matrix interferences, limited dynamic range, and semi-quantitative readout that can miss low-level glycosuria or saturate at high concentrations (Karim et al., 2018). These drawbacks motivate complementary approaches that can extend sensitivity while preserving workflow simplicity.
Optical biosensing—particularly surface plasmon resonance (SPR) (Butt, 2025)—offers label-free, real-time readout of refractive-index (RI) perturbations near a metal/dielectric interface and has become a mature platform for affinity assays and chemical sensing (Khalid-Salako et al., 2025). In the prism-coupled Kretschmann–Raether configuration (Pandey et al., 2022), a p-polarized beam excites surface plasmon polaritons (SPPs) through an evanescent field in a thin metal film (Vacacela Gomez et al., 2018); binding-induced RI changes shift the resonance angle or wavelength, enabling quantitative transduction without enzymatic labels. For glucose aqueous media, the bulk RI increases approximately linearly with concentration at visible wavelengths, providing a well-behaved surrogate for concentration in angular-interrogated SPR (Mostufa et al., 2021).
The prism material is a key degree of freedom for coupling efficiency and angular resolution. Whereas many implementations use BK7 (Khani et al., 2025) or similar crown glasses, high-index flints such as SCHOTT N-SF6 (n ≈ 1.799 at 632.8 nm) (Meshginqalam and Barvestani, 2018) provide a larger in-plane wave vector, enabling resonance at smaller incidence angles and potentially narrower dips for the same metal stack and analyte. This can improve the figure-of-merit metrics in angular interrogation when other layers are co-optimized.
On the other hand, the selection of a thin metal film strongly influences both coupling and loss. Gold (Au) remains the workhorse owing to chemical stability and biocompatibility (Manurung et al., 2025), but its inter-band absorption broadens the resonance. Silver (Ag) typically yields sharper, deeper minima (lower ohmic loss) (Zaman et al., 2025) but is prone to oxidation/sulfidation. Copper (Cu) has re-emerged as a promising plasmonic metal when protected or combined with thin dielectrics (Hossain et al., 2025), offering competitive resolution. Aluminum (Al) has gained interest for visible/UV operation and CMOS (complementary metal–oxide–semiconductor) compatibility (Tamang et al., 2021) although native oxides and higher damping must be managed through stack design. These trade-offs motivate systematic, like-for-like comparisons when the remainder of the multilayer is held constant.
A thin, high-index dielectric spacer can further tune field confinement and mitigate damping by controlling phase matching between the prism mode and the SPP (Tene et al., 2025a). Silicon nitride (Si3N4) is popular in this role because it combines a relatively high refractive index with low optical loss and robust film formation (Kumar et al., 2025), and it can act as a protective/adhesion layer between the metal and the functional coating. Recent designs show that a few-nanometer-thick Si3N4 layer can sharpen the angular dip and shift the working range without compromising coupling (Tasnim and Mohsin, 2025).
Interestingly, for the functional/affinity interface, graphene oxide (GO) offers practical advantages over atomically thin, pristine 2D crystals such as graphene or its derivatives (Xu et al., 2025). GO provides abundant oxygenated groups (epoxy, hydroxyl, and carboxyl (Vacacela Gomez et al., 2016)) that facilitate covalent or non-covalent immobilization of enzymes and receptors, can be deposited over large areas by scalable wet methods (Tene et al., 2020), and enhance adsorption due to the high surface area—all beneficial for robust, regenerable UGLU interfaces. GO-modified plasmonic stacks are, therefore, a rational route to balance sensitivity, manufacturability, and chemical stability.
With this in mind, in this study, we present, for the first time, a theoretical and computational design exploration of SPR architectures dedicated to UGLU detection across low and high concentrations (Mudgal et al., 2020) using angular interrogation at 633 nm in the Kretschmann configuration (Banerjee and Ray, 2019). We adopt a high-index SF6 prism as the coupler and perform a controlled comparison of Ag, Au, Cu, and Al films while keeping the remainder of the stack fixed. A thin Si3N4 spacer is used to tune coupling and protect the metal (Kumar A. et al., 2022), and a GO overlayer serves as the functional platform for future receptor immobilization (Zhang et al., 2013). Optical responses are computed with the transfer-matrix method (TMM) (Rumi et al., 2024) for multilayer stacks to quantify resonance angle shifts, full width at half maximum (FWHM), angular sensitivity (Sθ), detection accuracy, and composite figures of merit over UGLU concentrations ranging from trace to markedly elevated ranges.
By isolating the plasmonic metal while holding the SF6/metal/Si3N4/GO architecture constant, we delineate the trade-offs among resonance sharpness, achievable sensitivity, and robustness relevant to urine-matrix sensing. The optimized configurations reveal regimes in which high-index coupling and the GO functional interface counteract metal-dependent losses and broaden the usable dynamic range for UGLU. Conducted before fabrication, this analysis de-risks subsequent experiments and guides material selection and thickness windows before synthesis and testing of practical SPR biosensors. Accordingly, the comparative evaluation of Ag, Au, Cu, and Al—augmented by a Si3N4 spacer and a GO functional layer—maps the performance envelopes across low-to-high UGLU levels and provides a clear foundation for bench-top validation.
2 Materials and methods
2.1 Theoretical framework
In this study, we extend the methodologies reported by Wu et al. (2010), Mousania et al. (2025), and Tene et al. (2025b). Comprehensive details of the total-reflection simulations and the definitions of all performance metrics are provided in the Supporting Information (Supplementary Equations S1–S13) (Tene et al., 2025c).
To validate the transfer-matrix model, we reproduced the angular SPR reflectance for Au/graphene in water at 633 nm–634 nm from the study by Cheon et al. (2014) and fitted the theoretical curves to the reported experimental data (number of graphene layers as in the reference) (Supplementary Figure S1). We illustrate two metrics: (i) the absolute error in the resonance angle, |Δθ|, and (ii) the root-mean-square reflectance residual across the resonance window. The simulations used the same stack and optical constants described by Cheon et al. (2014) (Au film on BK7 prism, graphene overlayer, aqueous environment). The fitted curves closely follow the experimental minima and wings. This validation targets the optical solver and materials dispersion; it is independent of the glucose chemistry. After validation on Au/graphene/water, we substituted the analyte refractive index ladder for UGLU and re-optimized the SF6/metal/Si3N4/GO stacks presented here.
2.2 Initial parameters and the multilayer biosensor proposal
Supplementary Table S1 defines the five multilayer geometries and the shorthand used throughout. The common Kretschmann architecture is arranged as SF6/metal/Si3N4/GO/analyte. The reference configuration, Sys0, uses a gold film with water as the contacting medium (SF6/Au/Si3N4/GO/H2O). The sensing configurations Sys1–Sys4 replace the water layer with UGLU while sweeping the plasmonic metal under otherwise identical conditions: Sys1 = SF6/Ag/Si3N4/GO/UGLU, Sys2 = SF6/Au/Si3N4/GO/UGLU, Sys3 = SF6/Cu/Si3N4/GO/UGLU, and Sys4 = SF6/Al/Si3N4/GO/UGLU. This construction isolates metal-dependent behavior while preserving the same prism, dielectric spacer, functional coating, and analyte boundary, and it provides a water baseline (Sys0) for comparison to the urine matrix. These reference systems are subsequently optimized with the contacting medium set to H2O for Sys0 and to UGLU under normal conditions for Sys1–Sys4.
Supplementary Table S2 lists the initial (pre-optimization) optical constants and thicknesses used to seed the parameter search. The coupling prism is high-index SF6 glass with n = 1.7990 at the operating wavelength (Akib et al., 2024). The plasmonic layer starts at 45.0 nm for all four metals, with complex refractive indices drawn from the indicated datasets (Akib et al., 2024; Kumar R. et al., 2022): Au n = 0.1378 + 3.6196i, Ag n = 0.0803 + 4.2347i, Cu n = 0.0369 + 4.5393i, and Al n = 0.0778 + 5.8535i. A Si3N4 spacer of 5.00 nm with n = 2.0394 is inserted between the metal and the functional layer to tune phase matching and provide protection/adhesion (Kumar A. et al., 2022). The functional overlayer is GO with n = 1.2728 + 0.00392835i and an initial thickness of 2.55 nm, which is consistent with the few-nanometer coatings suitable for receptor immobilization (Xue et al., 2013; Cheon et al., 2014). The analyte refractive indices for the contacting media are n = 1.330 for H2O (Mudgal et al., 2020) and n = 1.335 for urine (normal) (Mudgal et al., 2020). These values are used only as the starting points; subsequent optimization adjusts thicknesses to maximize the resonance quality within each system.
Scheme 1 summarizes the interrogation geometry and layer order. A p-polarized beam enters through the SF6 prism and reflects at the prism/metal interface, and the reflected intensity is measured as a function of incidence angle θ. The evanescent field penetrates the Si3N4 spacer and GO layer into the contacting medium—H2O for Sys0 and UGLU for Sys1–Sys4. Across the four sensing stacks, the only structural variable is the identity of the metal (Ag, Au, Cu, and Al); the prism, spacer, functional layer, and analyte definition are kept constant. This like-for-like design enables a clean comparison of how the plasmonic metal governs the coupling strength, loss, and, ultimately, sensing performance in the SF6/metal/Si3N4/GO platform.
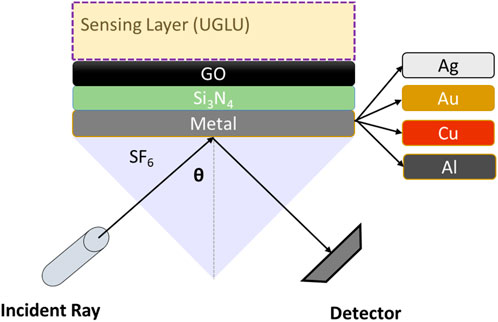
Scheme 1. Schematic of the multilayer SPR platform and optical interrogation geometry.
3 Results and discussions
3.1 Systems considered in this study
Figure 1a displays the reflectance curves at 633 nm for SF6/metal/Si3N4/GO/UGLU, with the metal identity varying. The resonance angles are grouped as Sys4 (Al, 50.37°) < Sys3 (Cu, 52.05°) < Sys1 (Ag, 52.72°) < Sys2 (Au, 54.73°), indicating metal-dependent phase-matching at the prism/metal boundary. Figure 1b quantifies the relative angular-sensitivity gain with respect to the water baseline, Sys0: 7.39% (Sys4), 4.30% (Sys3), 3.07% (Sys1), and 0.61% (Sys2). The corresponding absolute resonance-angle shifts for an index change 1.330 → 1.335 (Figure 1c) follow the same order, with Δθ = 4.02° (Sys4), 2.34° (Sys3), 1.67° (Sys1), and 0.33° (Sys2).
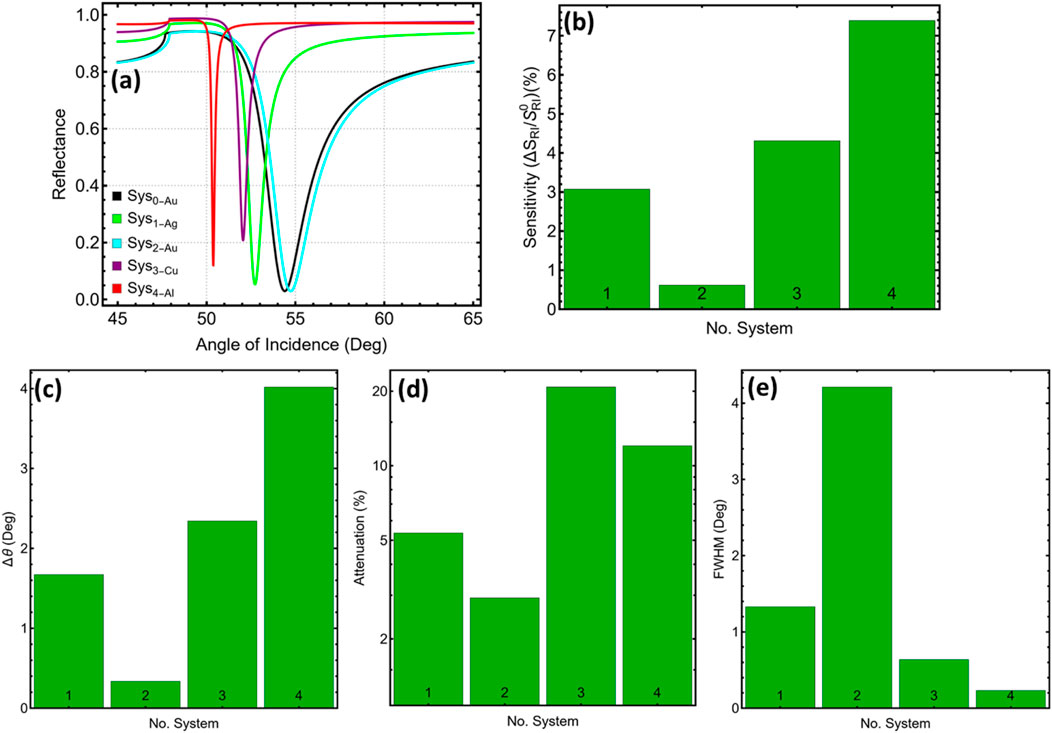
Figure 1. Comparative performance of metal-based SPR configurations. (a) Simulated reflectance as a function of incidence angle for the reference sensor (Sys0) and four alternative systems (Sys1–Sys4). (b) Relative angular sensitivity, expressed as the percentage gain concerning Sys0. (c) Absolute resonance-angle shift (Δθ) produced by a refractive-index change from 1.330 to 1.335. (d) Minimum reflectance at the resonance dip (attenuation). (e) Full width at half-maximum (FWHM) of each resonance curve.
The depth and linewidth further separate the systems. The minimum reflectance at the dip (Figure 1d) is the lowest for Sys2 (2.92%), followed by Sys1 (5.35%), Sys4 (12.04%), and Sys3 (20.79%), showing that Au produces the deepest resonance under the initial parameters. Linewidths (Figure 1e) favor Al and Cu: FWHM = 0.23° (Sys4), 0.63° (Sys3), 1.32° (Sys1), and 4.21° (Sys2). Combining Δθ with FWHM points to Al- and Cu-based stacks as strong candidates for angular interrogation in UGLU, whereas Au yields a deep but broad resonance with limited Δθ; Ag lies between these behaviors.
Hence, these contrasts emphasize that the plasmonic film governs the balance among angle shift, dip depth, and linewidth in the SF6/metal/Si3N4/GO architecture. The baseline outcomes in Supplementary Table S3, therefore, serve as the starting point for metal-specific optimization of film thickness and for tuning the Si3N4 and GO layers, which was executed with the contacting medium fixed to H2O for Sys0 and to UGLU (normal) for Sys1–Sys4.
3.2 Metal thickness optimization
Figure 2 highlights how the metal thickness (30 nm–55 nm) tunes the resonance metrics for the four stacks: SF6/Ag/Si3N4/GO/UGLU (Sys1), SF6/Au/Si3N4/GO/UGLU (Sys2), SF6/Cu/Si3N4/GO/UGLU (Sys3), and SF6/Al/Si3N4/GO/UGLU (Sys4). The angle-resolved spectra in Supplementary Figure S2 corroborate these trends by showing the concurrent evolution of the dip position, depth, and linewidth as the thickness varies in 5-nm steps.
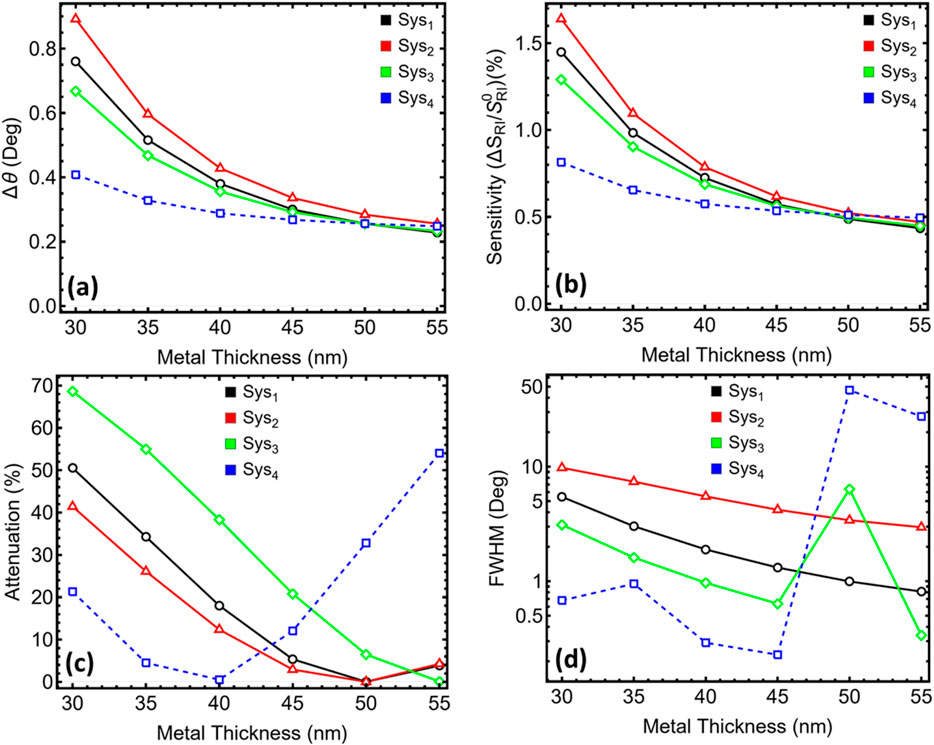
Figure 2. Effect of metal layer thickness with variations in Ag (Sys1), Au (Sys2), Cu (Sys3), and Al (Sys4) (30 nm–55 nm) on the resonance characteristics of the four alternative systems (Sys1–Sys4). (a) Resonance angle shift. (b) Percentage gain in angular sensitivity. (c) Residual reflectance at the resonance minimum. (d) FWHM of each resonance system.
Particularly, for Sys1 (Ag), Figure 2a shows a monotonic decrease of the angle shift Δθ from 0.76° at 30 nm to 0.22° at 55 nm; the relative sensitivity gain drops in parallel from 1.44% to 0.43% (Figure 2b). The key benefit of added Ag thickness is the dramatic reduction in residual reflectance at the minimum (“attenuation,” Figure 2c): 50.52% → 0.03% between 30 and 50 nm, before a slight rise to 3.86% at 55 nm. Linewidth narrows from 5.45° at 30 nm to 0.99° at 50 nm and then to 0.81° at 55 nm (Figure 2d). The spectra in Supplementary Figure S2a visualize this transition from an under-coupled, shallow dip at 30 nm–35 nm to a deep, sharp resonance near 50 nm. Selecting 50 nm balances near-zero attenuation (0.03%), sub-degree FWHM (0.99°), and a measurable Δθ (0.25°).
For Sys2 (Au), the thickness sweep yields broader resonances than Ag at comparable thicknesses. Δθ decreases from 0.89° (30 nm) to 0.28° (50 nm) and 0.25° (55 nm) (Figure 2a); the sensitivity gain falls from 1.63% to 0.52% and 0.47% (Figure 2b). Crucially, attenuation collapses from 41.42% (30 nm) to 0.03% at 50 nm and then rises to 4.26% at 55 nm (Figure 2c). FWHM contracts from 9.78° to 3.41° (30 nm → 50 nm) and further to 2.96° at 55 nm (Figure 2d). Supplementary Figure S2b shows the dip deepening and narrowing through 45 nm–50 nm. Given the objective of minimal attenuation and the modest linewidth improvement beyond 50 nm, 50 nm is retained for Au.
For Sys3 (Cu), attenuation steadily improves with thickness, from 68.64% at 30 nm to 0.33% at 55 nm (Figure 2c), whereas Δθ declines from 0.66° to 0.23° (Figure 2a), and the relative sensitivity changes from 1.29% to 0.51% (Figure 2b). Linewidth behavior is largely favorable up to 45 nm (FWHM 0.96° at 40 nm and 0.63° at 45 nm), followed by a transient broadening at 50 nm (6.37°) and a sharp recovery to 0.33° at 55 nm (Figure 2d). The corresponding spectra in Supplementary Figure S2c exhibit a brief over-coupled regime near 50 nm before a very steep, deep dip appears at 55 nm. The triplet attenuation = 0.33%, FWHM = 0.33°, and Δθ = 0.23° at 55 nm offer high angular precision with low residual reflectance; 55 nm is, therefore, selected for Cu.
For Sys4 (Al), a clear optimum emerges near 40 nm. Δθ decreases gently from 0.40° (30 nm) to 0.28° (40 nm) and 0.26° (45 nm) (Figure 2a), whereas the sensitivity gain follows 0.81% → 0.53% → 0.51% (Figure 2b). Attenuation reaches a minimum at 40 nm (0.51%), rising at 45 nm (12.04%) and rising markedly at ≥50 nm (32.81%–54.01%) (Figure 2c). The linewidth is already narrow at 40 nm–45 nm (0.29° and 0.22°, Figure 2d) but degrades at higher thicknesses. Supplementary Figure S2d shows the best-defined dip at 40 nm–45 nm; beyond this range, the resonance becomes shallow and broader. The 40 nm choice secures the lowest attenuation with a narrow dip and maintains Δθ ≈ 0.28°.
In combination, Figure 2 and Supplementary Figure S2 establish metal-specific thickness windows that reconcile Δθ, relative sensitivity, attenuation, and FWHM within the SF6/metal/Si3N4/GO/UGLU architecture. The adopted values—Ag 50 nm (Sys1), Au 50 nm (Sys2), Cu 55 nm (Sys3), and Al 40 nm (Sys4)—are located at or near the minima of attenuation while preserving sharp angular features and practical angle shifts, as quantified in Supplementary Table S4. These metal-dependent optima provide the starting point for subsequent tuning of the Si3N4 and GO layers and for extending the assessment to low- and high-UGLU concentrations.
3.3 Silicon nitride thickness optimization
Figure 3 summarizes how the Si3N4 thickness (5 nm–15 nm) tunes the resonance when the metal is fixed at its selected value for each stack (Sys1–Sys4), and Supplementary Figure S3 shows the corresponding angle-resolved spectra. In all four systems, the spacer primarily controls phase matching and field overlap within the GO/UGLU region, which manifests as a near-linear growth of Δθ with the thickness (Figure 3a) and a concomitant increase in the sensitivity enhancement relative to the water reference (Figure 3b).
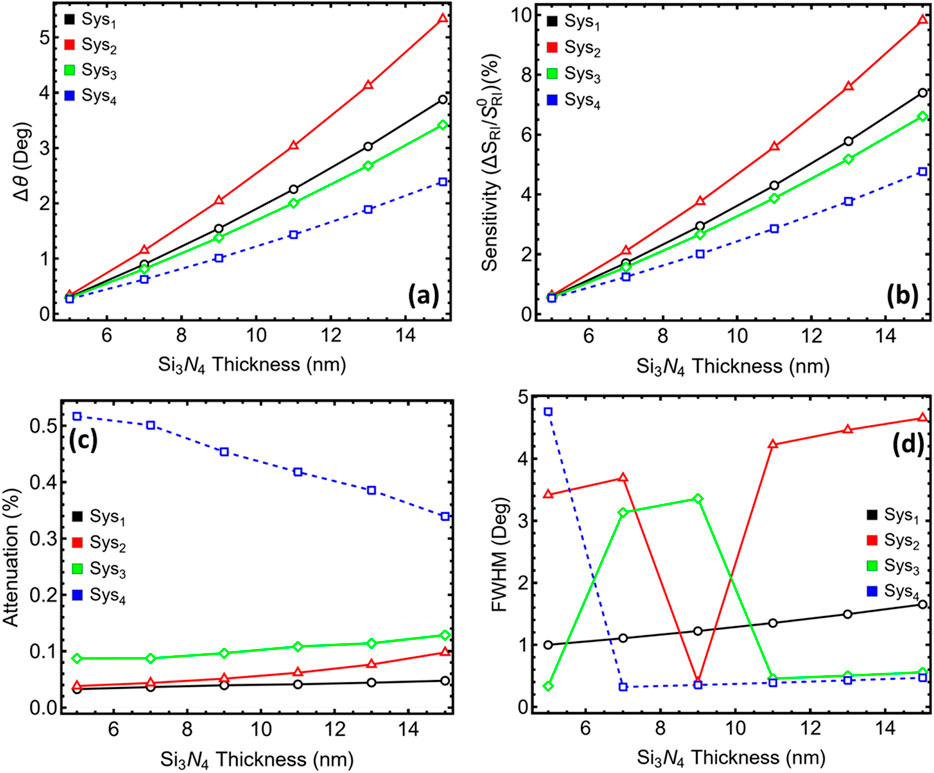
Figure 3. Effect of Si3N4 thickness (5 nm–15 nm) on resonance characteristics for the four alternative meta-dependent systems (Sys1–Sys4). (a) Resonance-angle shift. (b) Percentage gain in angular sensitivity. (c) Residual reflectance at the resonance minimum. (d) FWHM of each resonance dip.
For Sys1 (Ag), Δθ rises from 0.30° at 5 nm to 3.87° at 15 nm, with sensitivity enhancement increasing from 0.58% to 7.40% (Supplementary Table S5). Attenuation remains essentially at the noise floor across the sweep (0.03%–0.04%, Figure 3c), whereas FWHM broadens modestly from 1.00° to 1.65° (Figure 3d). The spectra in Supplementary Figure S3a track this evolution: increasing Si3N4 thickens the evanescent tail into UGLU, shifting the dip to larger angles and slightly widening it, but the minimum reflectance stays near zero. Selecting 15 nm leverages the substantial gains in Δθ and sensitivity with only a minor penalty in linewidth and no practical increase in residual reflectance.
For Sys2 (Au), the spacer exerts a stronger influence on linewidth. Δθ increases from 0.33° to 5.33° (5 nm → 15 nm), and the sensitivity enhancement increases from 0.61% to 9.81% (Figures 3a, b). Attenuation remains low (0.03%–0.09%; Figure 3c). FWHM, however, is non-monotonic: it is broad at 5 nm–7 nm (3.41°–3.68°), reaches a sharp minimum at 9 nm–11 nm (0.39°), and then broadens again to 4.65° at 15 nm (Figure 3d; Supplementary Table S5). The spectra in Supplementary Figure S3b visualize this sharpening near 9 nm–11 nm. Choosing 15 nm prioritizes the largest Δθ and sensitivity enhancement while keeping attenuation negligible, acknowledging that an Au-specific setting of 9 nm–11 nm would deliver a markedly narrower dip at the cost of reduced Δθ (≈2.04°–3.03°) and sensitivity (≈3.76%–5.58%).
For Sys3 (Cu), Δθ increases from 0.29° to 3.42°, and the sensitivity enhances from 0.56% to 6.61% as the spacer thickens to 15 nm (Figures 3a, b). Attenuation remains very low (0.08%–0.12%), and the linewidth stays in a narrow band at the thick end of the sweep: FWHM = 0.50° (11 nm), 0.42° (13 nm), and 0.55° (15 nm) after passing through a broader regime at 7 nm–9 nm (3.13°–3.35°) (Figure 3d; Supplementary Table S5). Supplementary Figure S3c confirms the progressive right-shift and eventual sharpening. The 15 nm configuration captures the high Δθ and sensitivity while preserving a sub-degree linewidth and near-zero minima.
For Sys4 (Al), the spacer improves all metrics simultaneously over most of the range. Δθ grows from 0.26° to 2.38° (5 nm → 15 nm), sensitivity enhances from 0.53% to 4.76%, attenuation decreases from 0.51% to 0.33%, and FWHM collapses from 4.75° to 0.46° (Figures 3a–d; Supplementary Table S5). The spectra in Supplementary Figure S3d show a shallow, broad dip at 5 nm–7 nm that evolves into a deep, narrow resonance by 13 nm–15 nm. The 15 nm setting is, therefore, optimal across all criteria for Al.
Indeed, Figure 3, Supplementary Figure S3, and Supplementary Table S5 indicate that a Si3N4 thickness of 15 nm provides a consistent operating point across the metal set: Δθ and sensitivity are maximized; attenuation remains negligible for Ag, Au, and Cu (≤0.12%) and is reduced for Al (to 0.33%); and the linewidth is modestly affected (Ag), acceptably narrow (Cu and Al), or broadened in a known, controllable way (Au).
3.4 Graphene oxide thickness optimization
As other graphene-plasmonic derivatives (Sindona et al., 2019; Vacacela Gomez et al., 2017), graphene-based coatings concentrate the evanescent field, add abundant binding sites, and can tailor interfacial charge—traits that are advantageous for plasmonics. Among them, GO is practical at scale: solution processing (spin/spray/dip) yields uniform, few-nanometer films and straightforward chemical functionalization (Tene et al., 2023). Here, the GO thickness is swept by multiples of a base layer; that is, L1–L6 = 2.55 × {1, 2, 3, 4, 5, and 6} nm, giving 2.55, 5.10, 7.65, 10.20, 12.75, and 15.30 nm.
Figure 4 summarizes the response across metals, and Supplementary Figure S4 shows the corresponding spectra. Panels 4a–b reveal a V-shaped angular response: Δθ and the relative sensitivity drop toward a shallow minimum near L3 ≈ 7.65 nm and recover at larger thicknesses. Panel 4c shows that attenuation generally remains low at thin GO and drifts upward with thickness, whereas panel 4d confirms that FWHM is essentially set by the metal and is nearly thickness-invariant over L1–L6 (≈1.63° for Sys1, ≈4.6° for Sys2, ≈0.56° for Sys3, and ≈0.47° for Sys4).
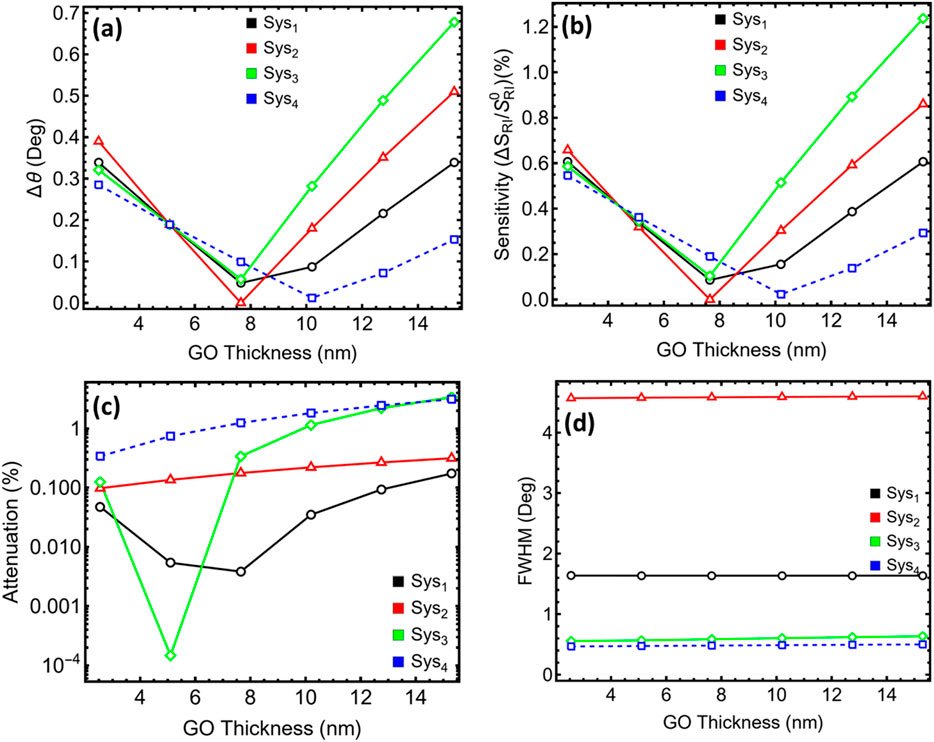
Figure 4. Effect of GO thickness (0.7 nm–7.05 nm) on the resonance characteristics for the four alternative metal-dependent systems (Sys1–Sys4). (a) Resonance-angle shift. (b) Percentage gain in angular sensitivity. (c) Residual reflectance at the resonance minimum. (d) FWHM of each resonance dip.
In Ag (Sys1), Δθ follows 0.33° → 0.18° → 0.04° → 0.08° → 0.21° → 0.33° from L1 to L6, with the sensitivity tracing the same valley (Supplementary Table S6). Attenuation is already small at L1 (0.04%) and reaches its minimum at L3 (0.003%); FWHM stays at 1.63°. Choosing L2 = 5.10 nm avoids the near-zero Δθ at L3, holds attenuation at 0.005%, and preserves a stable linewidth, which are conditions that favor precise angle tracking without pushing Δθ into the noise.
In Au (Sys2), the V-shape is pronounced: Δθ ≈ 0.39° (L1) → ≈0.00° (L3) → 0.51° (L6), whereas attenuation increases smoothly from 0.09% (L1) to 0.31% (L6); FWHM is ≈ 4.6° across the set. Although L1 gives the lowest attenuation and larger Δθ than L2, ultrathin GO can be more sensitive to discontinuities and hydration. Selecting L2 = 5.10 nm keeps attenuation low (0.13%), maintains spectral stability (Supplementary Figure S4b), and aligns the GO thickness with the other metals for a single, fabrication-friendly working point.
As noted, Cu (Sys3) shows the clearest attenuation minimum at L2, where the residual reflectance is 1 × 10⁻⁴%, whereas Δθ remains measurable (0.18°) and FWHM stays near 0.56°. Thickening GO beyond L3 raises attenuation (0.33% → 3.38% from L3 to L6) and only gradually increases Δθ (0.05° → 0.67°), which is a trade that does not benefit angular interrogation. The spectra in Supplementary Figure S4c already display a clean, deep dip at L2.
In Al (Sys4), Δθ decreases from 0.28° (L1) to 0.18° (L2) and bottoms out near L3–L4 (0.01°–0.07°), and then it partially recovers at larger thicknesses; attenuation climbs from 0.33% (L1) to 3.13% (L6); FWHM remains ≈0.46°–0.50°. Although L1 is numerically superior for Δθ and attenuation, adopting L2 = 5.10 nm standardizes the functional-layer thickness across metals and still keeps the metrics within a tight band (Δθ 0.18°, attenuation 0.74%, and FWHM 0.47°).
Hence, Figure 4 and Supplementary Table S6 indicate that L2 = 5.10 nm provides a global operating point that has the following characteristics.
1. It avoids the Δθ-minimum regime near L3 that is seen in all metals.
2. It keeps attenuation extremely low (10−4–10−1% across Sys1–Sys3 and <1% for Sys4).
3. It leaves FWHM essentially unchanged (metal-limited).
4. It simplifies fabrication and surface chemistry by using the same GO thickness for the entire metal set.
Although certain systems admit slightly lower attenuation at other Lᵢ (e.g., Sys1 at L3 and Sys2 and Sys4 at L1), those points coincide with very small Δθ or with ultrathin films that are less forgiving during processing.
3.5 Glucose at different concentrations and the related refractive index
Supplementary Table S7 compiles the layer set-points after thickness optimization. The prism and ordering remain fixed (SF6/metal/Si3N4/GO/analyte), whereas the metal film is metal-specific: Sys1 (Ag, 50 nm), Sys2 (Au, 50 nm), Sys3 (Cu, 55 nm), and Sys4 (Al, 40 nm). The spacer and functional layer are unified at Si3N4 = 15 nm and GO = 5.10 nm. This combination reflects the trade-offs extracted from Figures 2–4: the chosen metal thickness suppresses residual reflectance while keeping Δθ and FWHM within practical ranges; the 15 nm Si3N4 layer strengthens phase matching and field overlap into UGLU with only modest linewidth penalties; and a 5.10-nm GO film avoids the Δθ minimum encountered near ∼7.65 nm yet maintains very low attenuation. Using a common Si3N4/GO pair also standardizes fabrication and isolates the metal dependence in the subsequent concentration sweeps.
Supplementary Table S8 lists the UGLU refractive indices used as inputs for sensing simulations at 633 nm: n = 1.335, 1.336, 1.337, 1.338, 1.341, 1.347 for 0–0.015, 0.625, 1.25, 2.5, 5.0, and 10.0 g dL-1, respectively (Mudgal et al., 2020; Shoshi et al., 2025; Rahman, 2025; El-Assar et al., 2022; Houari et al., 2024; Raghuwanshi and Pandey, 2022). In particular, Supplementary Figure S5 shows a quasi-linear RI–RI concentration relation across 0.015 g dL-1–10 g dL-1, with an average slope of approximately 1.2 × 10⁻³ RIU (g dL-1)−1 and a slight steepening above 2.5 g dL-1. This monotonic ladder provides evenly progressing refractive-index steps for calibration and enables direct mapping of concentration to Δθ in angular interrogation. The near-linearity implies that a single sensitivity factor is a reasonable first approximation across the range, whereas the mild curvature at the upper end motivates reporting sensitivity locally (low vs. high UGLU) when comparing Sys1–Sys4.
3.6 UGLU sensing
As stated, with the optimized layers fixed (Sys1: Ag 50 nm; Sys2: Au 50 nm; Sys3: Cu 55 nm; Sys4: Al 40 nm; Si3N4 = 15 nm; GO = 5.10 nm), the spectra in Supplementary Figure S6 translate steadily to higher θ as UGLU increases, and the lineshape tied to each metal remains intact—broad for Au, intermediate for Ag, and narrow for Cu and Al.
Angle shifts scale almost linearly with concentration (Figure 5a). As shown in Supplementary Table S9, Δθ at ≤0.015 g dL-1 is already resolvable—0.37° (Sys2), 0.32° (Sys1), 0.31° (Sys3), and 0.27° (Sys4). Mid-range values at 5.0 g dL-1 read 0.82° (Sys2), 0.71° (Sys1), 0.68° (Sys3), and 0.61° (Sys4). At 10 g dL-1, the ordering remains Au (1.28°) > Ag (1.11°) ≈ Cu (1.06°) > Al (0.94°). This nearly linear Δθ–Δθ concentration behavior mirrors the quasi-linear refractive-index ladder used as the input.
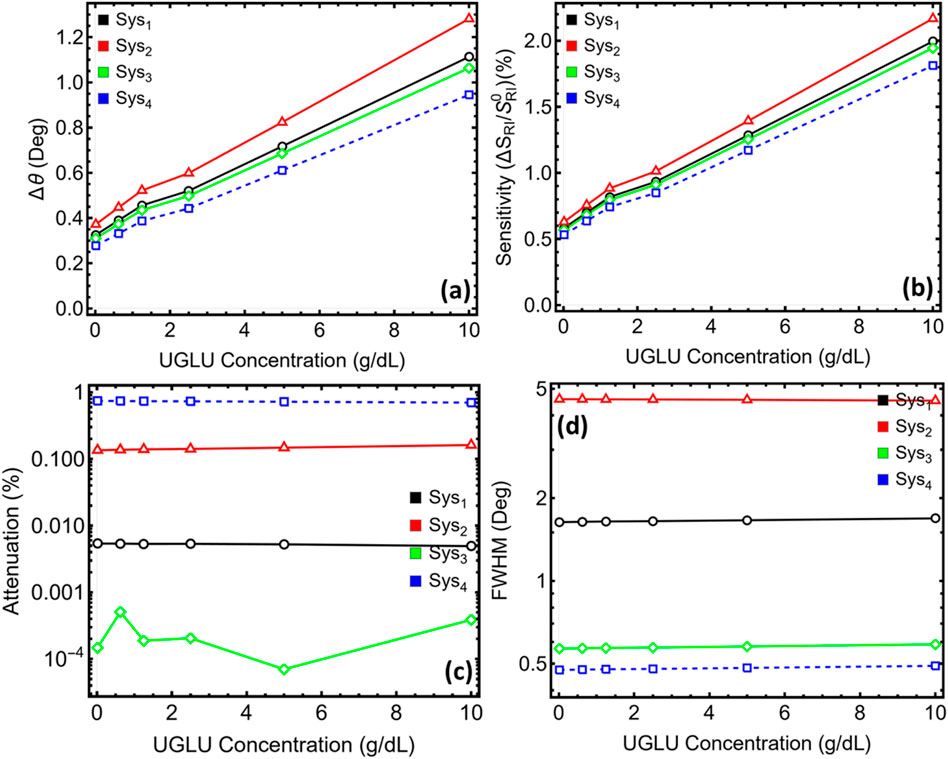
Figure 5. Performance of the four optimized prism configurations (Sys1–Sys4) across urine-glucose (UGLU) concentrations from 0.015 to 10 g dL-1. (a) Resonance angle. (b) Percentage increase in angular sensitivity. (c) Minimum reflectance. (d) FWHM of each resonance curve.
The percentage gain in angular sensitivity relative to the water baseline (Figure 5b) tracks the same progression across the ladder: at 10 g dL-1, the values are 2.16% (Sys2), 1.99% (Sys1), 1.94% (Sys3), and 1.81% (Sys4). The close correspondence between Δθ and the percentage gain across all concentrations indicates that, for each stack, a single slope provides a practical calibration from concentration to the angle.
Contrast at the resonance minimum remains effectively constant with concentration for a given metal (Figure 5c). Sys3 (Cu) exhibits the lowest residual reflectance, between ∼10−4 and 10−3%, reaching ≈7 × 10⁻⁵% at 5.0 g dL-1; Sys1 (Ag) stays near ∼5 × 10⁻³%. Sys2 (Au) remains at ∼0.13%–0.16%, and Sys4 (Al) remains at ∼0.69%–0.74%. These plateaus are evident in Supplementary Figure S6, where the dips shift laterally but retain their depths.
Linewidths are similarly concentration-invariant (Figure 5d): ≈1.63°–1.68° for Sys1, ≈4.55°–4.58° for Sys2, ≈0.56°–0.58° for Sys3, and ≈0.47°–0.49° for Sys4. Hence, concentration information is carried predominantly by Δθ, whereas both the dip depth and width are set by the choice of metal.
Across the full concentration window, Au delivers the largest Δθ and percentage gain; Ag and Cu provide very deep minima; Al and Cu maintain the narrowest dips. These signatures, visible directly in Figure 5 and Supplementary Figure S6 and enumerated in Supplementary Table S9, persist from low to high UGLU and enable straightforward calibration based on the measured angle shift.
3.7 Performance-sensing metrics
Figure 6a shows that the angular sensitivity to refractive-index change, S (° RIU−1), is essentially constant across the UGLU ladder for each metal. Supplementary Table S10 shows the following ranges: Sys2 (Au) holds the highest S, from 74.40° to 75.35° RIU−1; Sys1 (Ag) varies from 65.10° to 65.47° RIU−1; Sys3 (Cu) varies from 62.10° to 62.55° RIU−1; and Sys4 (Al) varies from 55.50° to 55.58° RIU−1. The sensitivity hierarchy, therefore, remains Au > Ag ≈ Cu > Al throughout 0.015 g dL-1–10 g dL-1, indicating that the optimized metal film sets the intrinsic S level, whereas concentration primarily translates the resonance along θ.
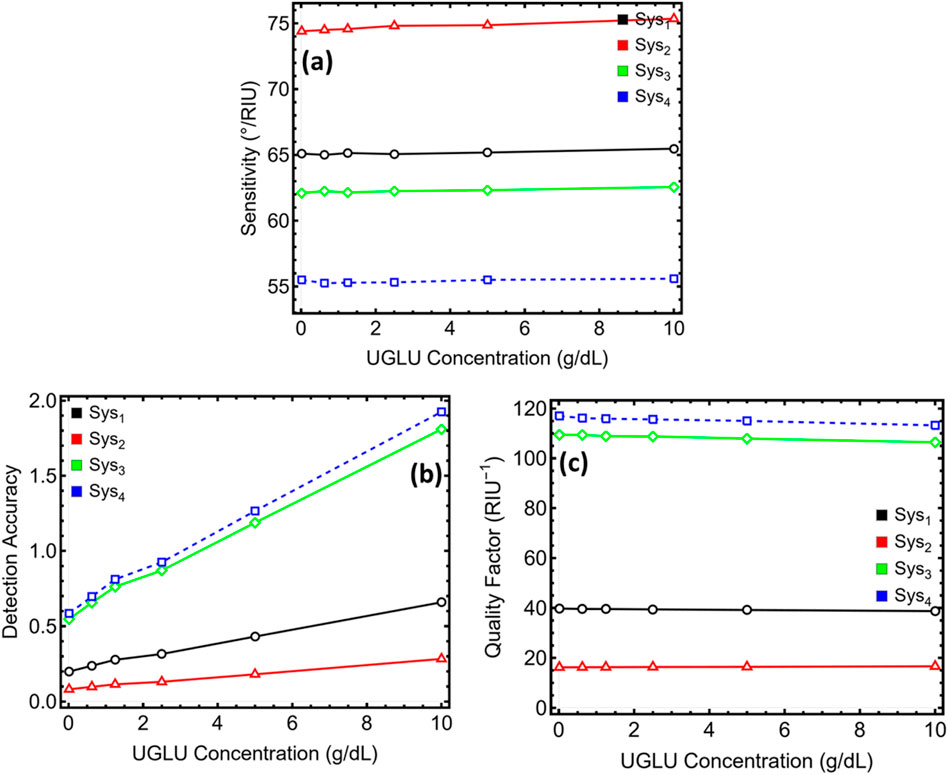
Figure 6. Variation of key performance metrics for the four optimized sensor configurations (Sys1–Sys4) across urine-glucose (UGLU) concentrations from 0.015 to 10 g dL-1. (a) Angular sensitivity to refractive-index change, which is reported in ° RIU−1. (b) Detection accuracy (DA), which is evaluated as the ratio of resonance-angle shift to full width at half-maximum. (c) Quality factor (QF), which is obtained by dividing sensitivity by linewidth and expressed in RIU−1.
Detection accuracy (DA) rises with concentration for every system because Δθ increases while the linewidth is nearly fixed (Figure 6b). Numerically, Sys1 (Ag) grows from 0.19 to 0.65, Sys2 (Au) grows from 0.08 to 0.28, Sys3 (Cu) grows from 0.54 to 1.80, and Sys4 (Al) grows from 0.58 to 1.92 as UGLU moves from ≤0.015 to 10 g dL-1. The narrow-line stacks, Al and Cu, therefore, achieve the highest DA across the ladder; Ag occupies an intermediate band; Au remains the lowest because of its broader dip.
Quality factor (QF) is nearly concentration-independent, mirroring the flat S curves and constant linewidths in Figure 6c. Supplementary Table S10 reports modest variations over the full range: Sys4 (Al) changes from 117.01 to 113.24 RIU−1, Sys3 (Cu) changes from 109.47 to 106.44 RIU−1, Sys1 (Ag) changes from 39.77 to 38.75 RIU−1, and Sys2 (Au) changes from 16.24 to 16.65 RIU−1. The ranking remains stable, with Al ≳ Cu ≫ Ag > Au.
Taken as a set, Figure 6 and Supplementary Table S10 indicate complementary operating regimes rather than winners and losers. Au offers the largest S per RIU, which suits applications prioritizing absolute sensitivity to refractive-index change. Cu and Al pair solid S with narrow dips, yielding the strongest DA and QF for precise angle tracking. Ag sits between these behaviors, retaining higher contrast than Au with a tighter linewidth, and thus, it provides a balanced option when both sensitivity and resolvable angles matter.
Figure 7a and Supplementary Table S10 show that the figure of merit (FoM, RIU−1) is largely concentration-independent for each sensor, with small, metal-specific drifts. Sys3 (Cu) remains the highest throughout, from 109.45 to 106.40 RIU−1, as UGLU increases from ≤0.015 to 10 g dL-1; Sys1 (Ag) occupies a mid-high band, 39.56 RIU−1 → 38.56 RIU−1; Sys4 (Al) starts lower but climbs modestly with concentration, 30.20 RIU−1 → 34.17 RIU−1; and Sys2 (Au) remains the lowest, 14.04 RIU−1 → 13.96 RIU−1. The ranking Cu > Ag ≳ Al ≫ Au is preserved across all concentrations, matching the linewidth ordering seen earlier.
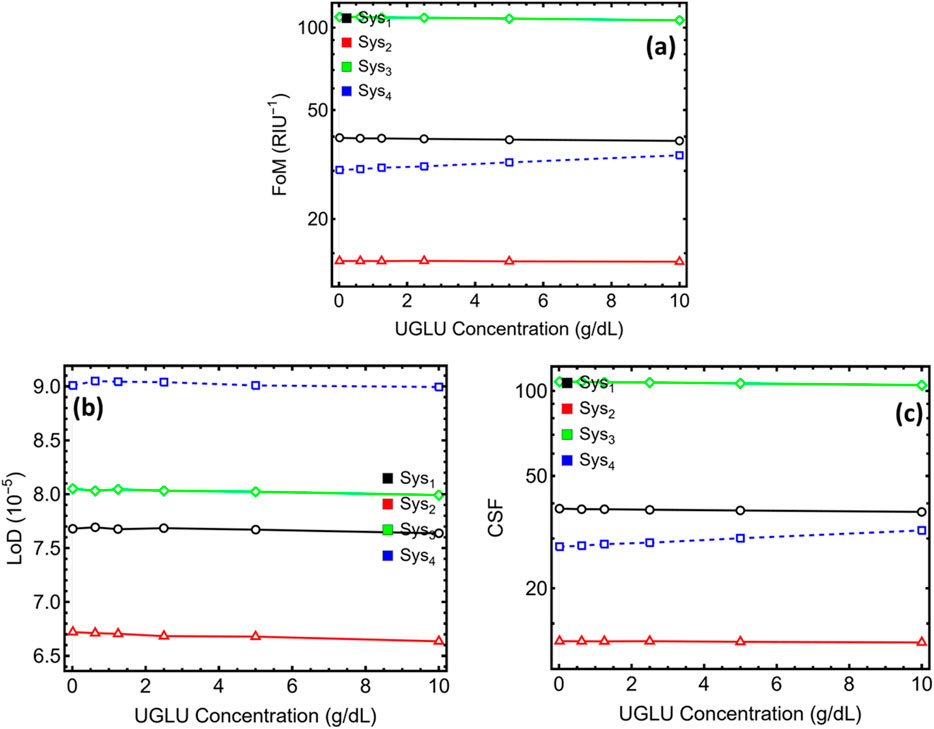
Figure 7. Extended performance analysis for the optimized prism sensors (Sys1–Sys4) over urine-glucose (UGLU) concentrations. (a) Figure of merit (FoM). (b) Limit of detection (LoD). (c) Combined sensitivity factor (CSF).
The limit of detection (LoD, ×10−5 RIU) in Figure 7b (computed for an angular resolution of 0.005°) is effectively flat with concentration for each metal and separates clearly by stack. Sys2 (Au) reaches the smallest LoD, 6.72 → 6.63, followed by Sys1 (Ag), 7.68 → 7.63, and then Sys3 (Cu), 8.05 → 7.99. Sys4 (Al) remains the highest, 9.00 → 8.99. Thus, when the experimental constraint is angular resolution, Au minimizes the detectable RI change, with Ag close behind; Cu and Al require slightly larger index steps to exceed the 0.005° threshold.
Figure 7c summarizes the combined sensitivity factor (CSF), which incorporates both the dip depth and width. Sys3 (Cu) again leads, 107.87 → 104.84, and Sys1 (Ag) remains in a stable mid-range, 38.29 → 37.29. Sys2 (Au) is the lowest and is nearly constant, 12.99 → 12.86. Sys4 (Al) is distinctive in that the CSF increases with concentration, 28.07 → 32.05, reflecting the persistence of a narrow line while the signal contribution from the dip strengthens across the ladder.
3.8 State-of-the-art comparison
Table 1 contrasts our SF6/metal/Si3N4/GO stacks with BK7-based, multilayer designs that report very high angular sensitivities (>300° RIU−1). In our architecture, S is lower (e.g., ∼55°–75° RIU−1 across Al → Au) because we prioritized spectral sharpness: thin, low-loss GO and Si3N4 set near the coupling minimum yield narrow FWHM, which elevates DA = Δθ/FWHM and QF = S/FWHM. This trade-off is evident in the table: literature entries with very high S typically exhibit broader dips or added loss from thicker/multi-2D stacks, whereas our Cu and Al systems sustain tight linewidths and high DA/QF that benefit angle-tracking precision. A practical advantage is that our prescriptions use single-spacer stacks and few-nanometer-thick GO, which are fabrication-friendly.
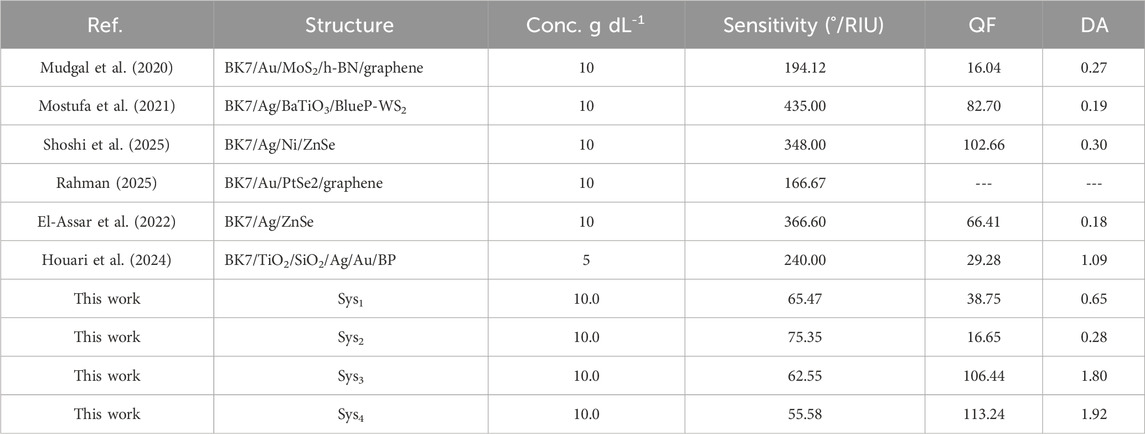
Table 1. Comparison with available literature.
Nevertheless, S can be raised further without forfeiting sharpness by (i) retuning the Si3N4 spacer down by a few nanometers to increase field overlap in the analyte, (ii) using hybrid Ag/Au or low-loss caps that shift the coupling condition toward steeper dθ/dn, or (iii) operating with phase or intensity interrogation near quadrature, which boosts responsivity for a given FWHM. These paths preserve the comparative trends we report (Au: largest Δθ/S; Cu/Al: narrowest FWHM, highest DA/QF; Ag: balanced) while offering headroom to increase the slope where applications demand it. In this framework, Sys3 (Cu) and Sys4 (Al) remain advantageous for precision angle tracking (high DA/QF), Sys1 (Ag) provides deep minima and balanced metrics, and Sys2 (Au) is preferred when maximizing S and LoD under fixed angular resolution. Overall, the table maps complementary operating regimes rather than a single winner and indicates clear, practical levers to raise sensitivity if required.
3.9 Fabrication feasibility
In Figure 8, we outline a potential experimentally feasible route for the SF6/metal/Si3N4/GO stacks with actionable tolerances. Metal films (Au, Ag, Cu, and Al; target 40 nm–50 nm) are deposited on the prism (Raghuwanshi and Pandey, 2022). To curb degradation, Ag and Cu are capped with Al2O3 (2 nm–5 nm, ALD (atomic layer deposition)) (Raghuwanshi and Pandey, 2022); Al carries a native ∼1 nm–3 nm oxide that can be retained or gently thickened (Ansari and Husain, 2011). The Si3N4 spacer (15 ± 2 nm) could be grown at low temperature either by PECVD (plasma-enhanced chemical vapor deposition) (≤140 °C) (Ko et al., 2025) or reactive sputtering (≤100 °C) (Chhoker et al., 2025) using cooled stages to prevent metal roughening; both routes routinely deliver ±1 nm–2 nm thickness control and sub-nm RMS roughness when tuned. GO could be applied from aqueous dispersions by spin or dip coating to GO thickness of 5 ± 1 nm, verified by ellipsometry/AFM (atomic force microscope) (Maulana et al., 2025); a brief O2-plasma activation (≤10 s, low power) may be used to improve the adhesion without meaningful optical loss (Alemán et al., 2018), followed by mild baking (80 °C–100 °C, 10 min).
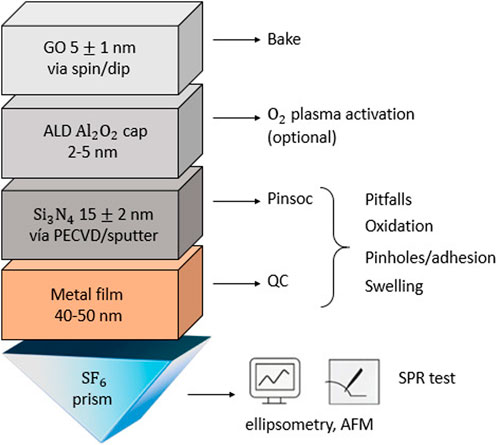
Figure 8. Illustration of the potential experimental feasibility of the proposed biosensors.
Known issues and mitigations could include the following: oxidation (dielectric capping) (Janarthanan, 2025), pinholes (optimize flow rate/solids) (Bläsi and Gerken, 2021), adhesion (surface activation) (Saffioti et al., 2020), and aqueous swelling (test and condition in buffered synthetic urine) (Nair et al., 2019). Quality control includes post-deposition ellipsometry (thickness, n, k) (Mandal and Moirangthem, 2025) and SPR baseline stability under temperature-controlled flow (25 °C ± 0.1 °C) with a reference channel (Naimushin et al., 2003). This protocol translates the optimized designs into realistic fabrication steps while preserving the optical figures of merit beyond absolute sensitivity.
3.10 Clinically relevant concentrations
Figure 9 shows a linear relationship between the resonance angle (θSPR) and the RI across UGLU dilutions with high linearity (R2 ≈ 0.96–0.97). The fitted slopes give the angular sensitivity S (° RIU−1): Ag (Sys1) S = 73.75, Au (Sys2) S = 84.38, Cu (Sys3) S = 70.51, and Al (Sys4) S = 62.56. Metals, therefore, are separated by the role—Au has the highest slope, Cu/Al has lower slopes but complementary advantages via narrow linewidths, and Ag is balanced.
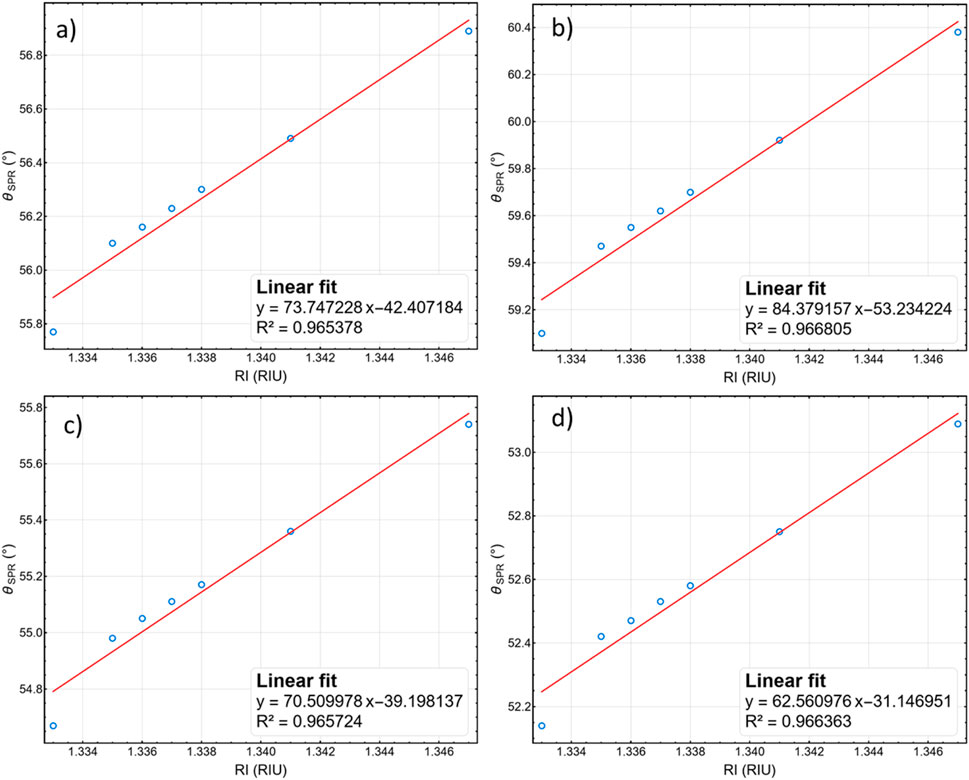
Figure 9. Resonance angle (θ_SPR) versus refractive index for UGLU dilutions with linear fits; the slope gives the angular sensitivity S (° RIU−1) of each optimized sensor. Panels: (a) Sys1–Ag, (b) Sys2–Au, (c) Sys3–Cu, and (d) Sys4–Al. R2 values of the fits are indicated.
For small RI perturbations, the response follows this equation: Δθ = S · Δn. Hence, the low-concentration shift at 0.3 g dL-1 is obtained from the RI increment at that concentration (Δn0.3 = n (0.3)−n (0)) using the following:
• Sys1–Ag: Δθ0.3 = 73.75 · Δn0.3.
• Sys2–Au: Δθ0.3 = 84.38 · Δn0.3.
• Sys3–Cu: Δθ0.3 = 70.51 · Δn0.3.
• Sys4–Al: Δθ0.3 = 62.56 · Δn0.3.
If sensitivity in concentration units is needed near the low end, we use the following:
• Sc = S · (dn/dc) [° (g dL-1)], so Δθ(c) ≈ Sc · c for small c.
These relations allow direct reporting of θ-shifts at 0.3 g dL-1 (and other low levels) from the existing RI ladder while keeping the figures focused on comparative trends.
4 Limitations and perspectives
In this study, we model UGLU sensing as a bulk RI perturbation and, by design, omit chemical and thermal complexities of real urine (Babińska and Władzinski, 2025). Components such as urea, salts, and proteins, along with variability in the pH and temperature, can shift the baseline RI and broaden the resonance; fluctuations as small as ±0.001 RIU may compete with Δθ at low concentrations (Montero-Jimenez et al., 2025). Future experimental work should, therefore, (i) implement glucose-selective functional layers (e.g., glucose oxidase (Tiandho et al., 2025) or affinity receptors on GO) with optical budgeting for added thickness and loss, (ii) perform calibration and recovery tests by spiking synthetic urine across the reported concentration ladder, (iii) employ a reference channel and temperature control (±0.1 °C) to suppress baseline drift, and (iv) consider multi-wavelength or spectroscopic SPR to improve the discrimination of matrix changes.
On the other hand, for experimental translation, two routes are most mature: (i) enzymatic functionalization—immobilizing glucose oxidase on GO via carboxyl activation (Barros et al., 2025) or a thin primer—yielding a biolayer of a few-tens of nanometers (n ≈ 1.40–1.50) with high specificity; and (ii) synthetic receptors—grafting phenylboronic acid (PBA) moieties to bind glucose cis-diols while keeping the layer thin (<5 nm–10 nm) (Morariu, 2023). Both routes add optical thickness and may introduce loss, which can broaden FWHM and shift the resonance. A practical mitigation is to re-optimize the Si3N4 spacer for the chosen functional layer (thickness/index), minimize ancillary primers/linkers, and verify stability and nonspecific adsorption in synthetic urine with temperature control and a reference channel. Hence, future work should (i) incorporate the recognition layer explicitly into the TMM model (t, n, and k) and re-solve for thickness windows that preserve DA/QF while retaining or improving sensitivity, (ii) benchmark selectivity and drift experimentally using spiked synthetic urine, and (iii) evaluate multi-wavelength interrogation to help disentangle receptor-induced signals from matrix variations.
We point out that GO possesses a finite imaginary RI (k) in the visible spectrum; i.e., it is slightly absorbing (Ebrahimi Naghani et al., 2023). This absorption increases plasmonic damping and can broaden the resonance linewidth (FWHM). In our modeling, GO is treated as a lossy overlayer (n + i k), and its thickness is limited to ∼5 nm to balance analyte-field overlap with absorption-induced broadening.
Finally, in this work, we adopt 633 nm to match available urine RI measurements and provide a consistent basis for optimization (Mostufa et al., 2021; Mudgal et al., 2020; Shoshi et al., 2025; Rahman, 2025; El-Assar et al., 2022; Houari et al., 2024). Whereas spectroscopic SPR and multi-wavelength readouts can further mitigate matrix effects, extending the present results simply requires dispersion-resolved inputs (n, k vs. λ) for the analyte and layers; the same transfer-matrix workflow then yields updated optima. The key comparative trends between the metals—larger Δθ/S for Au and narrower FWHM with elevated DA/QF for Cu and Al, with Ag being intermediate—are governed by intrinsic optical loss and coupling conditions and are expected to persist with minor wavelength shifts.
5 Conclusion
In this work, we presented, for the first time, UGLU sensing using SF6/metal/Si3N4/GO architectures and established a like-for-like comparison of plasmonic metals (Ag, Au, Cu, and Al) for this task. We implemented angular SPR at 633 nm with a transfer-matrix framework and validated the numerical approach before performing a three-step optimization: metal thickness, Si3N4 spacer, and GO overlayer. The optimized stacks were as follows: Ag 50 nm, Au 50 nm, Cu 55 nm, and Al 40 nm, with Si3N4 = 15 nm and GO = 5.10 nm; these settings minimized attenuation while preserving usable angle shifts.
We then evaluated UGLU from 0.015 to 10 g dL-1 (n = 1.335–1.347). The resonance-angle shift increased nearly linearly with concentration, confirming straightforward calibration. The metal identity fixed the resonance shape: Au produced the largest Δθ and highest S (≈75° RIU−1) but the broadest lines, Ag produced moderate S with deep minima, and Cu and Al maintained narrow dips (FWHM ≈0.56°–0.58° and 0.47°–0.49°, respectively), which raised the detection accuracy to 1.80–1.92 at 10 g dL-1. Quality factor remained almost constant with concentration and favored Al and Cu (≈113 and ≈106 RIU−1 at the high end).
Across all metrics, the stacks exhibited stable, metal-specific signatures that were preserved from low to high UGLU. The findings supplied clear thickness windows, identified operating regimes suited to angle-tracking or contrast-based readout, and emphasized the practicality of GO as a scalable functional layer. These modeling results de-risk fabrication and provide directly testable prescriptions for prism-coupled SPR experiments on UGLU, whereas the metal-dependent trends establish a transparent basis for extending the platform to other urinary biomarkers and affinity chemistries.
Data availability statement
The original contributions presented in the study are included in the article/Supplementary Material; further inquiries can be directed to the corresponding authors.
Author contributions
TT: Conceptualization, Data curation, Formal analysis, Funding acquisition, Investigation, Methodology, Project administration, Resources, Software, Supervision, Validation, Visualization, Writing – original draft, Writing – review and editing. SB: Writing – original draft, Writing – review and editing. MG: Writing – original draft, Writing – review and editing. PR: Writing – original draft, Writing – review and editing. HM: Writing – original draft, Writing – review and editing. LG: Writing – original draft, Writing – review and editing. RK: Writing – original draft, Writing – review and editing. ES: Writing – original draft, Writing – review and editing. CV: Conceptualization, Data curation, Formal analysis, Funding acquisition, Investigation, Methodology, Project administration, Resources, Software, Supervision, Validation, Visualization, Writing – original draft, Writing – review and editing.
Funding
The authors declare that financial support was received for the research and/or publication of this article. This work was funded and supported by Universidad Técnica Particular de Loja under grant No: POA_VIN-56. SB was supported, in part, by a project funded by Romania’s National Recovery and Resilience Plan (PNRR), component C9—Support for the private sector, research, development, and innovation I8—Development of a program to attract highly specialized human resources from abroad in research, development, and innovation activities, entitled “Composite materials for applications in the water management field,” (ID: 11/26.07.2023, contract number 760270/26.03.2024). CV was supported by Progetto FUCSIE (Forum Universitario per la Cooperazione Scientifica fra Italia e Ecuador), Program: Piano Azione e Coesione (PAC) 2014/2020—Obiettivo specifico 10.5—Progetto Strategico Regionale “Calabria Alta formazione” (CUP H28D19000110008-CA.04.01.01.07.01).
Conflict of interest
The authors declare that the research was conducted in the absence of any commercial or financial relationships that could be construed as a potential conflict of interest.
Generative AI statement
The authors declare that Generative AI was used in the creation of this manuscript. ChatGPT o3 and Grammarly were used for English improvement.
Any alternative text (alt text) provided alongside figures in this article has been generated by Frontiers with the support of artificial intelligence and reasonable efforts have been made to ensure accuracy, including review by the authors wherever possible. If you identify any issues, please contact us.
Publisher’s note
All claims expressed in this article are solely those of the authors and do not necessarily represent those of their affiliated organizations, or those of the publisher, the editors and the reviewers. Any product that may be evaluated in this article, or claim that may be made by its manufacturer, is not guaranteed or endorsed by the publisher.
Supplementary material
The Supplementary Material for this article can be found online at: https://www.frontiersin.org/articles/10.3389/fnano.2025.1702438/full#supplementary-material
References
Akib, T. B. A., Rana, M. M., and Mehedi, I. M. (2024). Multi-layer SPR biosensor for in-situ amplified monitoring of the SARS-CoV-2 omicron (B.1.1.529) variant. Biosens. Bioelectron. X 16, 100434. doi:10.1016/j.biosx.2023.100434
Alemán, C., Fabregat, G., Armelin, E., Buendía, J. J., and Llorca, J. (2018). Plasma surface modification of polymers for sensor applications. J. Mater. Chem. B 6 (41), 6515–6533. doi:10.1039/c8tb01553h
Ansari, S. A., and Husain, Q. (2011). Immobilization of Kluyveromyces lactis β galactosidase on concanavalin A layered aluminium oxide Nanoparticles—Its future aspects in biosensor applications. J. Mol. Catal. B Enzym. 70 (3-4), 119–126. doi:10.1016/j.molcatb.2011.02.016
Babińska, M., and Władzinski, A. (2025). Enhanced sensitivity of absorption spectroscopy glucose detection by machine learning. Photonics Lett. Pol. 17, 1319. doi:10.4302/plp.v17i1.1319
Banerjee, J., and Ray, M. (2019). Comparative performance evaluation of mono-Metallic and Bi-Metallic plasmonic sensors using WS2 and graphene with optical bio-sensing application. Sensors Actuators B Chem. 281, 520–526. doi:10.1016/j.snb.2018.10.115
Barros, R. A., Rivereau, L., Sampaio, M. J., Cristóvão, R. O., Silva, C. G., and Faria, J. L. (2025). Graphitic carbon nitride: a reusable and stable support for glucose oxidase. Langmuir 41, 15880–15891. doi:10.1021/acs.langmuir.5c00737
Bayram, M. T., and Kavukcu, S. (2025). Renal glucosuria in children. World J. Clin. Pediatr. 14, 91622. doi:10.5409/wjcp.v14.i1.91622
Bläsi, J., and Gerken, M. (2021). Multiplex optical biosensors based on multi-pinhole interferometry. Biomed. Opt. express 12 (7), 4265–4275. doi:10.1364/boe.426991
Butt, M. A. (2025). Surface plasmon resonance-based biodetection systems: principles, progress and applications—A comprehensive review. Biosensors 15, 35. doi:10.3390/bios15010035
Chambliss, A. B., and Van, T. T. (2022). Revisiting approaches to and considerations for urinalysis and urine culture reflexive testing. Crit. Rev. Clin. Lab. Sci. 59, 112–124. doi:10.1080/10408363.2021.1988048
Cheon, S., Kihm, K. D., Kim, H. G., Lim, G., Park, J. S., and Lee, J. S. (2014). How to reliably determine the complex Refractive Index (RI) of graphene by using two independent measurement constraints. Sci. Rep. 4, 6364. doi:10.1038/srep06364
Chhoker, K., Gupta, D., Malik, N., Kumar, A., Kumar, S., and Aggarwal, S. (2025). Morphological and optical behavior of annealed and RF sputtered Si3N4 ceramic thin films. Integr. Ferroelectr. 241 (1-3), 189–200. doi:10.1080/10584587.2025.2482423
Ebrahimi Naghani, M., Neghabi, M., Zadsar, M., and Abbastabar Ahangar, H. (2023). Synthesis and characterization of linear/nonlinear optical properties of graphene oxide and reduced graphene oxide-based zinc oxide nanocomposite. Sci. Rep. 13 (1), 1496. doi:10.1038/s41598-023-28307-7
El-Assar, M., Taha, T. E., El-Samie, F. E. A., Fayed, H. A., and Aly, M. H. (2022). ZnSe-based highly-sensitive SPR biosensor for detection of different cancer cells and urine glucose levels. Opt. Quantum Electron. 55 (1), 76. doi:10.1007/s11082-022-04326-y
Feng, X., Wang, M., Wang, Y., Liang, R., and Yan, C. (2025). Associations between environmental glyphosate exposure and glucose homeostasis indices in US general adults: a national population-based cross-sectional Study. Sci. Rep. 15, 1627. doi:10.1038/s41598-024-84694-5
Hossain, M. K., Aljishi, A., Khan, F., Ul-Hamid, A., and Rahman, M. M. (2025). Fabrication and wetting characteristics of copper thin film: an active layer for SPR-Based sensor applications. J. Sci. Adv. Mater. Devices 10, 100839. doi:10.1016/j.jsamd.2024.100839
Houari, F., El Barghouti, M., Mir, A., and Akjouj, A. (2024). Nanosensors based on bimetallic plasmonic layer and Black phosphorus: application to urine glucose detection. Sensors 24, 5058. doi:10.3390/s24155058
Janarthanan, V. (2025). Black phosphorus-assisted plasmonic enhancement in D-Shaped photonic crystal fibers for advanced biomedical sensing. Plasmonics, 1–16. doi:10.1007/s11468-025-03267-y
Karim, M. N., Anderson, S. R., Singh, S., Ramanathan, R., and Bansal, V. (2018). Nanostructured silver fabric as a free-standing NanoZyme for colorimetric detection of glucose in urine. Biosensors 110, 8–15. doi:10.1016/j.bios.2018.03.025
Khalid-Salako, F., Kurt, H., and Yüce, M. (2025). Surface plasmon resonance aptasensors: emerging design and deployment landscape. Biosensors 15, 359. doi:10.3390/bios15060359
Khani, A., Razaghi, M., Hosseini, K., and Fotouhi, B. (2025). Highly sensitive optical surface Plasmon Resonance biosensor based on BK7/Ag/Ti/Al grating for cancer detection. Plasmonics. doi:10.1007/s11468-025-03200-3
Ko, Y., Choi, H., Kim, J., Kim, N., and Chae, H. (2025). Line Ratio of optical emission spectroscopy Peaks for predicting deposition rate and refractive Index of silicon nitride in plasma enhanced chemical vapor deposition processes. Plasma Process. Polym. 22, e70040. doi:10.1002/ppap.70040
Kumar, A., Kumar, A., and Srivastava, S. K. (2022a). Silicon Nitride–BP-Based surface plasmon resonance highly sensitive biosensor for virus SARS-CoV-2 detection. Plasmonics 17, 1065–1077. doi:10.1007/s11468-021-01589-1
Kumar, R., Pal, S., Prajapati, Y. K., Kumar, S., and Saini, J. P. (2022b). Sensitivity improvement of a MXene-Immobilized SPR sensor with ga-doped-zno for biomolecules detection. IEEE Sens. J. 22, 6536–6543. doi:10.1109/JSEN.2022.3154099
Kumar, S., Yadav, A., and Malomed, B. A. (2025). Highly Sensitive Plasmonic Sensors Based on Silicon and Nitrides of Si and Ga on Mono and Bimetallic Layers for Biomedical Applications. Plasmonics. doi:10.1007/s11468-025-03215-w
Lott, J. A., and Turner, K. (1975). Evaluation of Trinder’s glucose oxidase method for measuring glucose in serum and urine. Clin. Chem. 21, 1754–1760. doi:10.1093/clinchem/21.12.1754
Mandal, N., and Moirangthem, R. S. (2025). Unveiling olive oil authenticity: a comprehensive Study on adulteration detection through SPR-Enhanced ellipsometry. Food Anal. Methods 18 (3), 442–458. doi:10.1007/s12161-024-02724-4
Manurung, R. V., Gumilar, G., Sugandi, G., Gemilang, B., and Anshori, I. (2025). High-Performance bimetallic thin film fiber optic SPR sensors: a new approach to analyte detection. Phys. Scr. 100, 085527. doi:10.1088/1402-4896/adf3ec
Maulana, G. A., Syarifuddin, I. M., Sukma, F. O. R., Hanif, M. A., Saroja, G., Santjojo, D. J., et al. (2025). Tuning viscosity and spin time to enhance the thinnest rGO film coating in SPR sensors. Plasmonics 20, 6105–6114. doi:10.1007/s11468-025-03110-4
Meshginqalam, B., and Barvestani, J. (2018). Performance enhancement of SPR biosensor based on phosphorene and transition metal dichalcogenides for sensing DNA hybridization. IEEE Sens. J. 18, 7537–7543. doi:10.1109/JSEN.2018.2861829
Montero-Jimenez, M., Recky, J. R. N., von Bilderling, C., Scotto, J., Azzaroni, O., and Marmisolle, W. A. (2025). PEDOT: Tosylate-polyamine-based enzymatic organic electrochemical transistors for high-performance glucose biosensing in human urine samples. J. Electroanal. Chem. 978, 118867. doi:10.1016/j.jelechem.2024.118867
Morariu, S. (2023). Advances in the design of phenylboronic acid-based glucose-sensitive hydrogels. Polymers 15 (3), 582. doi:10.3390/polym15030582
Mostufa, S., Paul, A. K., and Chakrabarti, K. (2021). Detection of hemoglobin in blood and urine glucose level samples using a graphene-coated SPR based biosensor. OSA Contin. 4, 2164–2176. doi:10.1364/OSAC.433633
Mousania, Y., Karimi, S., and Farmani, A. (2025). Designing high-performance SPR biosensor using hybrid structure of BifeO3 and 2D material for SARS-CoV-2 detection. Plasmonics 20, 7209–7228. doi:10.1007/s11468-024-02516-w
Mudgal, N., Saharia, A., Agarwal, A., Ali, J., Yuapapin, P., and Singh, G. (2020). Modeling of highly sensitive surface plasmon resonance (SPR) sensor for urine glucose detection. Opt. Quantum Electron. 52, 307. doi:10.1007/s11082-020-02427-0
Naimushin, A. N., Soelberg, S. D., Bartholomew, D. U., Elkind, J. L., and Furlong, C. E. (2003). A portable surface plasmon resonance (SPR) sensor system with temperature regulation. Sensors Actuators B Chem. 96 (1-2), 253–260. doi:10.1016/s0925-4005(03)00533-1
Nair, R. R., Debnath, S., Das, S., Wakchaure, P., Ganguly, B., and Chatterjee, P. B. (2019). A highly selective turn-on biosensor for measuring spermine/spermidine in human urine and blood. ACS Appl. Bio Mater. 2 (6), 2374–2387. doi:10.1021/acsabm.9b00084
Pandey, P. S., Raghuwanshi, S. K., and Kumar, S. (2022). Recent advances in two-dimensional materials-based Kretschmann configuration for SPR sensors: a review. IEEE Sens. J. 22, 1069–1080. doi:10.1109/JSEN.2021.3133007
Raghuwanshi, S. K., and Pandey, P. S. (2022). A numerical study of different metal and prism choices in the surface plasmon resonance biosensor chip for human blood group identification. IEEE Trans. NanoBioscience 22 (2), 292–300. doi:10.1109/tnb.2022.3185806
Rahman, K. M. (2025). Modeling of a BK7 Prism/Ag/Ni/ZnSe/SM-Based sensor for maintaining optimum performance in glucose level detection. Biosens. Bioelectron. X 24, 100604. doi:10.1016/j.biosx.2025.100604
Rumi, R. B., Paul, A. K., Alyami, S. A., and Moni, M. A. (2024). Multi-Disease detection using a prism-based Surface Plasmon Resonance sensor: a TMM and FEM approach. IEEE Trans. NanoBiosci 23, 51–62. doi:10.1109/TNB.2023.3286269
Saffioti, N. A., Cavalcanti-Adam, E. A., and Pallarola, D. (2020). Biosensors for studies on adhesion-mediated cellular responses to their microenvironment. Front. Bioeng. Biotechnol. 8, 597950. doi:10.3389/fbioe.2020.597950
Shoshi, M. S., Huraia, M. A., Raj, V. R., Jawad, A., Kong, C. Y., Tabata, H., et al. (2025). Revolutionary barium Titanate-BlueP/TMDCs SPR sensor: Ultra-sensitive detection of urine glucose levels. Talanta Open 11, 100401. doi:10.1016/j.talo.2025.100401
Sindona, A., Pisarro, M., Bellucci, S., Tene, T., Guevara, M., and Vaccacela Gomez, C. (2019). Plasmon oscillations in two-dimensional arrays of ultranarrow graphene nanoribbons. Phys. Rev. B 100, 235422. doi:10.1103/PhysRevB.100.235422
Tamang, J. S., Dhar, R. S., Bhoi, A. K., Singh, A. K., and Chatterjee, S. (2021). Bio-sensing application of chalcogenide thin film in a graphene-based surface plasmon Resonance (SPR) sensor. Sādhanā 46, 120. doi:10.1007/s12046-021-01645-w
Tasnim, N., and Mohsin, A. S. M. (2025). Tunable MIM - Grating based SPR biosensor using metal-bismuth selenide (Bi2Se3)-Silicon nitride (Si3N4) for Dengue, Malaria, glucose, and electrolyte detection with enhanced sensitivity. Phys. Scr. 100, 075570. doi:10.1088/1402-4896/adedd0
Tene, T., Tubon Usca, G., Guevara, M., Molina, R., Veltri, F., Arias, M., et al. (2020). Toward large-scale production of oxidized graphene. Nanomaterials 10, 279. doi:10.3390/nano10020279
Tene, T., Jiménez-Gaona, Y., Campoverde-Santos, D. K., Cevallos, Y., La Pietra, M., Vacacela Gomez, C., et al. (2023). Tunable optical and semiconducting properties of eco-friendly-prepared reduced graphene oxide. Front. Chem. 11, 1267199. doi:10.3389/fchem.2023.1267199
Tene, T., Coello-Fiallos, D., Borja, M., Sánchez, N., Londo, F., Vacacela Gomez, C., et al. (2025a). Surface plasmon resonance biosensors for SARS-CoV-2 sensing: the role of silicon nitride and graphene. Biosens. Bioelectron. X 23, 100586. doi:10.1016/j.biosx.2025.100586
Tene, T., León, M., Cevallos, Y., Vinueza-Naranjo, P. G., Inca, D., Boukerche, S., et al. (2025b). A novel Mxene-SPR-Based sensor for sensing different types of cancers. Front. Med. 12, 1608424. doi:10.3389/fmed.2025.1608424
Tene, T., Guevara, M., Caicedo, I., Granizo Jara, J. L., Borja, M., Gahramanli, L., et al. (2025c). MoS2–Si3N4-Based SPR biosensor for the detection of malaria at different stages: a theoretical Insight. Biosens. Bioelectron. 26, 100655. doi:10.1016/j.biosx.2025.100655
Tiandho, Y., Afriani, F., Iskandar, J., Gumilar, G., Widianto, E., Muslihati, A., et al. (2025). Theoretical model of a highly sensitive graphene–DNA aptamer-based label-free surface plasmon resonance biosensor for urine glucose detection. Microchem. J. 218, 115382. doi:10.1016/j.microc.2025.115382
Vacacela Gomez, C., Robalino, E., Haro, D., Tene, T., Escudero, P., Haro, A., et al. (2016). Structural and electronic properties of graphene oxide for different degree of oxidation. Mater. Today Proc. 3, 796–802. doi:10.1016/j.matpr.2016.02.011
Vacacela Gomez, C., Pisarro, M., Gravina, M., and Sindona, A. (2017). Tunable plasmons in regular planar arrays of graphene nanoribbons with armchair and zigzag-shaped edges. Beilstein J. Nanotechnol. 8, 172–182. doi:10.3762/bjnano.8.18
Vacacela Gomez, C., Guevara, M., Tene, T., Lechon, L. S., Merino, B., Brito, H., et al. (2018). Energy gap in graphene and silicene nanoribbons: a semiclassical approach. AIP Conf. Proc. 2003, 020015. doi:10.1063/1.5050367
Wu, L., Chu, H. S., Koh, W. S., and Li, E. P. (2010). Highly sensitive graphene biosensors based on Surface Plasmon resonance. Opt. Express 18, 14395–14400. doi:10.1364/OE.18.014395
Xu, Q., Yin, H., Cui, M., Huang, R., and Su, R. (2025). An enhanced bimetallic optical fiber SPR biosensor using graphene oxide for the label-free and sensitive detection of human IgG. Sensors 25, 1630. doi:10.3390/s25051630
Xue, T., Cui, X., Chen, J., Liu, C., Wang, Q., Wang, H., et al. (2013). A switch of the oxidation State of graphene oxide on a surface plasmon resonance chip. ACS Appl. Mater. Interfaces 5, 2096–2103. doi:10.1021/am400481t
Zaman, M. U., Ansari, G., Uniyal, A., Alqhtani, N. R., Pal, A., Alqahtani, A. S., et al. (2025). Barium titanate and silver layer-based Surface Plasmon resonance sensor for dental application: a numerical analysis. Plasmonics. doi:10.1007/s11468-025-03020-5
Keywords: SPR biosensor, graphene oxide, Prims, surface plasmon resonance, urine glucose, TMM approach
Citation: Tene T, Bellucci S, Guevara M, Romero P, Mayorga Pérez HS, Gahramanli L, Khankishiyeva R, Sakher E and Vacacela Gomez C (2025) Tuning urine glucose sensing via metal films in graphene-oxide-based SPR architectures. Front. Nanotechnol. 7:1702438. doi: 10.3389/fnano.2025.1702438
Received: 09 September 2025; Accepted: 27 October 2025;
Published: 20 November 2025.
Edited by:
Sajid Husain, University of California, Berkeley, United StatesReviewed by:
Tahereh Jamshidnejad, Razi University, IranOlabisi Abdullahi Onifade, Universiti Sains Malaysia, Malaysia
Copyright © 2025 Tene, Bellucci, Guevara, Romero, Mayorga Pérez, Gahramanli, Khankishiyeva, Sakher and Vacacela Gomez. This is an open-access article distributed under the terms of the Creative Commons Attribution License (CC BY). The use, distribution or reproduction in other forums is permitted, provided the original author(s) and the copyright owner(s) are credited and that the original publication in this journal is cited, in accordance with accepted academic practice. No use, distribution or reproduction is permitted which does not comply with these terms.
*Correspondence: Talia Tene, dGJ0ZW5lQHV0cGwuZWR1LmVj; Cristian Vacacela Gomez, Y3Jpc3RpYW5pc2FhYy52YWNhY2VsYWdvbWV6QGZpcy51bmljYWwuaXQ=