Abstract
Background:
Turmeric (Curcuma longa) and Tamarind (Tamarindus indica) are botanicals commonly used to support cartilage health. While direct benefits of turmeric on cartilage homeostasis have been reported, its bioavailability profile is widely known to be poor. Co-administration of other botanical substances may improve translational potential of oral turmeric if they do not interfere with bioactivity of turmeric on target tissues. The purpose was to compare turmeric (TUR) and a 2:1 blend of turmeric and tamarind (TT) on responses of cartilage to inflammatory stimuli.
Methods:
TUR and TT underwent simulated digestion, hepatic biotransformation, and ultrafiltration, and were used to condition cartilage explants in the presence or absence of lipopolysaccharide (LPS). Explants were cultured for 120 h; the first 24 h in basal tissue culture media and the remaining 96 h in media containing TUR or TT (0, 7.6, 22.8 or 38 μg/mL). LPS (0 or 10 μg/mL) was added for the final 48 h. Media samples were collected prior to LPS exposure (0 h) and 24 and 48 h after, and analyzed for prostaglandin E2 (PGE2), glycosaminoglycan (GAG), and nitric oxide (NO). Cartilage was digested and analyzed for GAG, and a GAG retention index (GRI) was calculated. At the end of the 120 h culture period, explants were stained for viability. Data were analyzed using a 2-way repeated measures ANOVA (GAG, PGE2, NO) or 1-way ANOVA without repeated measures (viability, tissue GAG, and GRI). Significance was accepted at p < 0.05.
Results:
Neither TUR nor TT affected chondrocyte viability or PGE2 production. TUR (38 μg/mL) reduced media GAG in unstimulated explants and increased GRI. TTsim (22.8 and 38 μg/mL) reduced NO and media GAG, in both stimulated and unstimulated explants, and increased GRI.
Conclusion:
These data provide evidence that both turmeric and a blend of turmeric and tamarind can protect cartilage from inflammatory challenge, with the latter demonstrating greater effects.
Background
Turmeric (Curcuma longa), a South Asian herb in the ginger family, has been widely used as a nutritional supplement due to its anti-inflammatory and anti-arthritic properties (Daily et al., 2016; Chin, 2016; Henrotin et al., 2010). Its principal bioactive compound, curcumin, reduces pro-inflammatory mediators such as prostaglandin E2 (PGE2), nitric oxide (NO), and interleukins, and inhibits matrix metalloproteinases (MMP) like MMP-3, which are involved in cartilage degradation (Pearson and Kott, 2019; Amalraj et al., 2017). Previously, a simulated biological extract of turmeric produced a significant reduction in lipopolysaccharide (LPS) induced PGE2, NO, and glycosaminoglycan (GAG) release in porcine cartilage explants in vitro (Pearson and Kott, 2019), which contributes further evidence for a direct anti-inflammatory effect of turmeric on this tissue. While these in vitro data encourage consideration of turmeric as a dietary supplement to support cartilage health, its very poor bioavailability profile (Sharma et al., 2001) makes translating in vitro promise into in vivo practice challenging. It has long been known that some botanical extracts such as piperine (Thanawala et al., 2024) improve the bioavailability of turmeric, but to the authors’ knowledge there is no evidence that piperine enhances bioactivity of turmeric beyond its influence on absorption.
Tamarind (Tamarindus indica) is a plant traditionally used in Indian and Southeast Asian medicine to treat pain, inflammation and gastrointestinal disorders (Jain et al., 2022). Its bioactive compounds are flavonoids, alkaloids, tannins, saponins, and phenols, which inhibit inflammatory enzymes such as cyclooxygenase-2 (COX-2), inducible nitric oxide synthase (iNOS), 5-lipooxygenase (5-LOX), and tumor necrosis factor-α (TNF-α) (Komakech et al., 2019). These data support the use of tamarind as an antioxidant and analgesic to reduce cartilage degradation and inflammatory markers (Kwon et al., 2023). Combining tamarind seed extract and turmeric rhizome extract in a standardized 2:1 blend has shown evidence of synergy between the two botanical ingredients (Kwon et al., 2023; Rao et al., 2019; Prasad et al., 2023). In a preclinical study with monosodium iodoacetate-induced osteoarthritic rats, the combination of tamarind + turmeric reduced TNF-α, nitrite, and MMP expression, and preserved collagen type II (Kwon et al., 2023). In clinical trials, the combination significantly improved measures of pain and musculoskeletal function in humans with osteoarthritis or exercise-induced knee pain (Kare et al., 2022). This suggests a potential synergistic effect when turmeric and tamarind are blended compared to either ingredient on their own.
The purpose of the current study was to compare the direct effects of biological extracts of turmeric with that of a combination of tamarind and turmeric (2:1) on cartilage explant responses to inflammatory stimuli.
Methods
All chemical reagents were purchased from Sigma Aldrich Canada (Oakville, ON) unless specified otherwise. All spectrophotometric and fluorescence analyses were conducted using a Victor 31,420 Microplate Spectrophotometer (Perkin Elmer, Woodbridge, ON, Canada).
Simulated biological extraction
A simulated biological extract of each of 1) turmeric (TURsim; JIAHERB INC., Pine Brook, NJ, USA), 2) tamarind + turmeric (2:1; NXT15906F6) (TTsim; NXT USA, Inc., Metuchen, NJ, USA), and 3) blank (Bsim) were prepared as previously described (Pearson and Kott, 2019). An in vivo dose of 2.5 g/day (Rao et al., 2019) was used to calculate an estimated in vitro dose of TURsim and TTsim, assuming full dispersion of the dose in 330 L of total body water (Forro et al., 1985). Simulated biological extracts of TURsim and TTsim were created by individually adding 0.028 g of turmeric or tamarind + turmeric (respectively) to 17.5 mL of simulated gastric fluid (containing 37 mM NaCl, 0.03 M HCl, and 3.2 mg/mL pepsin) and shaken at 37 °C for 2 h. At 2 h, acidity was neutralized by adding 575 μL of 4.4 M NaOH (pH = 6.0) and 18.25 mL of simulated intestinal fluid (containing 20 mg/mL pancreatin, 30 mM K2HPO4, and 160 mM NaH2PO4; pH adjusted to 7.4) to the mixture, which was then returned to the shaker at 37 °C for an additional 2 h. The resulting mixture was centrifuged two times at 6,000 x g for 20 min at 4 °C with the supernatant poured off after each spin. The supernatant was allowed to return to room temperature for approximately 30 min then 200 μL of rat liver microsomes (male) were added to reach a final concentration of 0.03 mg/mL (Crosbie et al., 2025) followed by NADPH (10 mg/mL in 0.01 M NaOH). The resulting mixture was shaken at 37 °C for an additional 30 min then centrifuged at 6,000 x g for 20 min at 4 °C. The supernatant was then returned to room temperature and passed through a 0.22 μm filter and fractioned using a size-exclusion ultrafiltration centrifuge unit (50 kDa; Amicon Ultra). A blank (Bsim; no test ingredient included) was prepared simultaneously using identical methodology. The resulting 50 kDa fractions of TURsim and TTsim were created such that a 10 μL aliquot placed into 1 mL of culture media contained sufficient extract to provide the targeted dose. Final conditioning concentrations in explant wells were 0 (B), 7.6 (T1), 22.8 (T3), and 38 μg/mL (T5).
Explant culture
Explants were prepared and maintained as previously described (Pearson and Kott, 2019). Briefly, articular cartilage from 18 pigs (9 pigs per experiment) was aseptically harvested from the intercarpal joints using a 4 mm biopsy tool and acclimatized in basal tissue culture media (TCM; comprised of DMEM-low glucose supplemented with amino acids, sodium selenite, manganese sulfate, NaHCO3, and ascorbic acid) for 72 h in 24-well tissue culture plates (2 explants per well) at 37 °C with 7% CO2. Three additional cartilage explants were harvested at the beginning of the experiment, stored in sterile filtered phosphate buffered saline, and frozen at −20 °C for baseline tissue GAG analysis. Media (1,000 μL) was removed and refreshed from each well every 24 h. After the first 24 h, TURsim and TTsim was added to fresh TCM every 24 h at doses corresponding to 0, 1, 3, and 5 times the initial dose (denoted as B, T1, T3 and T5). After 72 h of culture, half of each of the explant wells were stimulated with LPS (from Escherichia coli O111:B4; 10 mg/mL) for the final 48 h. For the final 48 h, media samples were collected prior to LPS stimulation (0 h), and then at 24 and 48 h after LPS stimulation and stored at −20 °C until analysis. At the end of the experiment one explant per well was stained to determine cell viability (see below) and one explant was placed in sterile filtered phosphate buffered saline and frozen at −20 °C for subsequent analysis of tissue GAG.
Sample analyses
At the end of each experiment, cartilage explants were immediately stained for viability. Tissue culture media samples were analyzed for biomarkers with importance in cartilage inflammation (PGE2 and NO) and structure (GAG release in media). Frozen cartilage explants were thawed and analyzed for GAG content.
Cell viability
Viability of cells within cartilage explants was determined using a Calcein-AM (C-AM)/Ethidium homodimer-1 (EthD-1) cytotoxicity assay kit (Molecular Probes) modified for use in cartilage explants (Crosbie et al., 2025). Calcein-AM (4 μM) and EthD-1 (8 μM) solutions were prepared in sterile distilled water. Explants were placed one per well into a sterile 96-well microtitre plate and incubated in 200 μL of the C-AM/EthD-1 solution for 40 min at room temperature. The microplate reader was set to scan each well, beginning at the bottom, using 10 horizontal steps at each of three vertical displacements set 0.1 mm apart. C-AM and EthD-1 fluorescence in explants were obtained using excitation/emission filters of 485/530 nm and 530/685 nm, respectively. Viability was determined by the following equation: C-AM/C-AM + EthD-1.
PGE2
Tissue culture media samples were analyzed for PGE2 using a commercially available ELISA kit (Arbour Assays; cat #K051-H5). Plates were read at absorbance of 450 nm. A best-fit third order polynomial standard curve was developed for each plate (R2 ≥ 0.99), and these equations were used to calculate PGE2 concentrations for samples from each plate.
Nitric oxide
Nitrite (NO2-), a stable oxidation product of NO, was analyzed by the Griess reaction (Velusami et al., 2018). Undiluted TCM samples were added to 96 well plates. Sulfanilamide (0.01 g/mL) and N-(1)-Napthylethylene diamine hydrochloride (1 mg/mL) dissolved in phosphoric acid (0.085 g/L) was added to all wells, and absorbance was read within 5 min at 530 nm. Sample absorbance was compared to a sodium nitrite standard. A best-fit linear standard curve was developed for each plate (R2 ≥ 0.99), and these equations were used to calculate nitrite concentrations for samples from each plate.
Media GAG
TCM GAG concentrations were determined using a 1,9-Dimethyl Methylene Blue (1,9-DMB) spectrophotometric assay (Crosbie et al., 2025; Kirker-Head et al., 2000; Setzer et al., 2021). Samples were added to 96-well plates at 50% dilution and serially diluted 1:2 up to a final dilution of 1:64. Guanidine hydrochloride (275 mg/mL) was added to each well followed immediately by addition of 150 μL DMB reagent. Absorbance was measured at 530 nm. Sample absorbance was compared to that of a bovine chondroitin sulfate standard (Sigma, Oakville, ON, Canada). A best-fit linear standard curve was developed for each plate (R2 ≥ 0.99), and these equations used to calculate GAG concentrations for samples on each plate.
Tissue GAG
Explants harvested at baseline and after 120 h of culture were digested in papain prior to analysis by 1,9-DMB (Clutterbuck et al., 2009). Explants were dried and weighed, then each disc was cut into 6-8 pieces and placed in microcentrifuge tubes. In each microcentrifuge tube 600 μL of working digestion solution was added containing 2.6 mg/mL ammonium acetate, 0.38 mg/mL Na2EDTA•2H2O, 0.31 mg/mL DL-Dithiothreitol, and 40 μg/mL papain (STEMCELL Technologies Canada Inc., Vancouver, BC, Canada) (Crosbie et al., 2025). Samples were placed in a shaking water bath for 72 h at 65 °C. After 72 h of digestion, samples were frozen at −20 °C until analysis for tissue GAG. Tissue GAG concentration was determined using the same methods as media GAG concentrations except tissue GAG concentrations were corrected based on a dilution factor of 30 and results are reported as μg/mg of cartilage tissue (Crosbie et al., 2025).
GAG retention index
A Glycosaminoglycan Retention Index (GRI) (Crosbie et al., 2025) was calculated for each animal using the following equation:
Values <1 indicate net loss, and values >1 indicate net retention.
Statistical analyses
Data are presented as mean ± SEM unless otherwise indicated. Any treatments stimulated with LPS are designated with + (i.e., B+, T1+, T3+, and T5+). Statistical analysis was performed using Sigma Plot, Version 14.0 (Grafiti, Palo Alto California). Data were analyzed using a 2-way repeated measures ANOVA (with respect to time and treatment) to determine the effect of TURsim and TTsim on PGE2, media GAG, NO. A 1-way ANOVA was used to determine effects of treatment on cell viability, tissue GAG, and GRI. When a significant F-ratio was obtained, the Holm Sidak post-hoc test was used to identify differences between treatments. Significance was accepted when p < 0.05.
Results
Cell viability
Explants remained over 99% viable and no significant effect of LPS stimulation or conditioning (Figure 1) on cell viability in explants was observed at any dose.
FIGURE 1
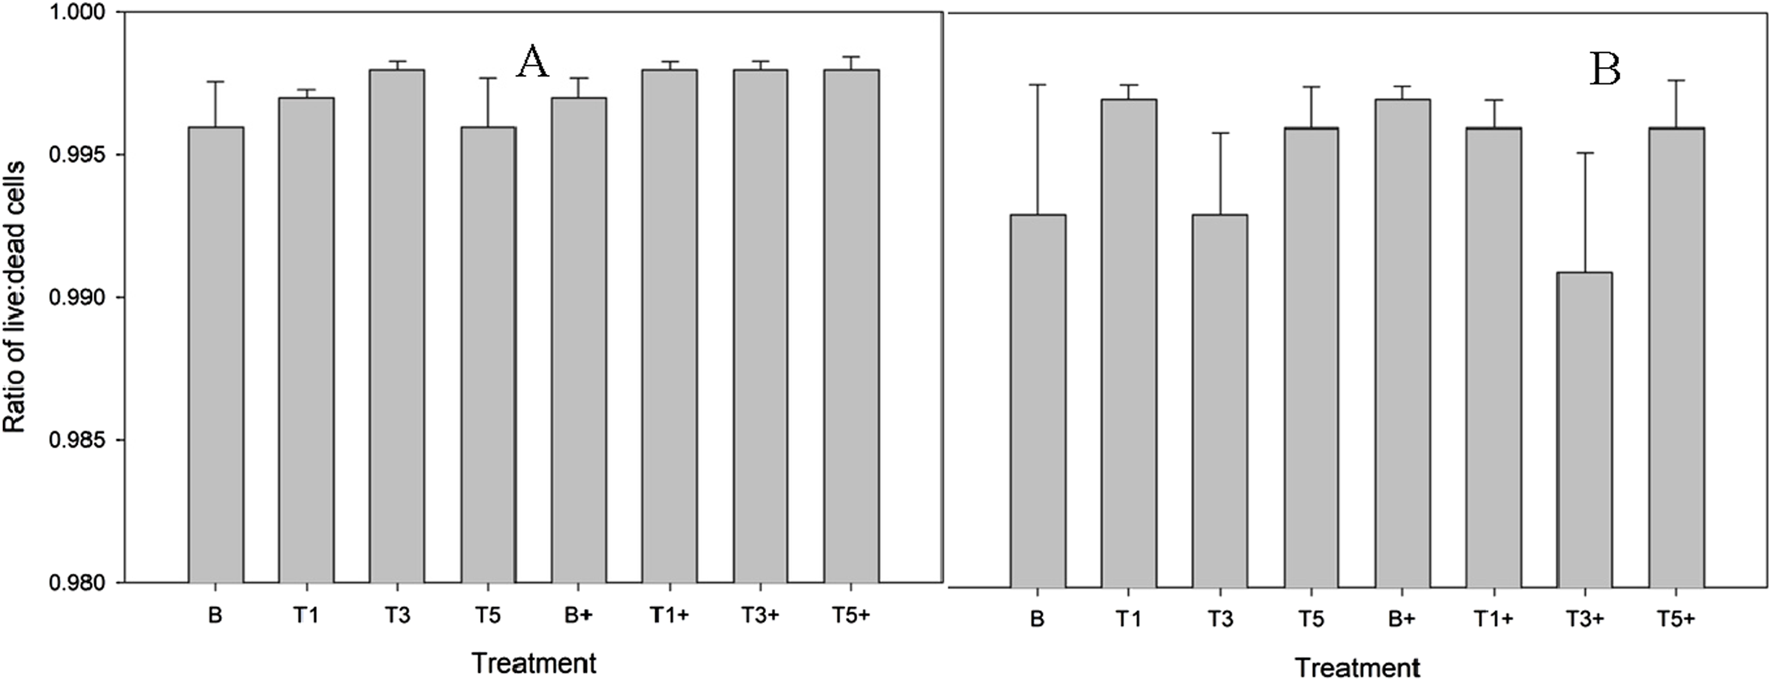
Proportion of live cells within explants conditioned with TURsim (A) or TTsim (B) (T1: 7.6 μg/mL; T3: 22.8 μg/mL; T5: 38 μg/mL) and an unconditioned control (B) in the presence (+) or absence of lipopolysaccharide (LPS; 10 μg/mL). Data represent the final 48 h of a 120 h culture duration. LPS-stimulated explants received LPS for the final 48 h.
Nitric oxide
TURsim
There was no effect of TURsim on media NO in unstimulated explants (Figure 2A), and there were no differences in NO concentration between groups. In LPS-stimulated explants (Figure 2B), LPS significantly increased NO concentration at 24 (p < 0.001) and 48 h (p < 0.001) from 0 h. There were no significant differences in NO concentration between groups at any time.
FIGURE 2
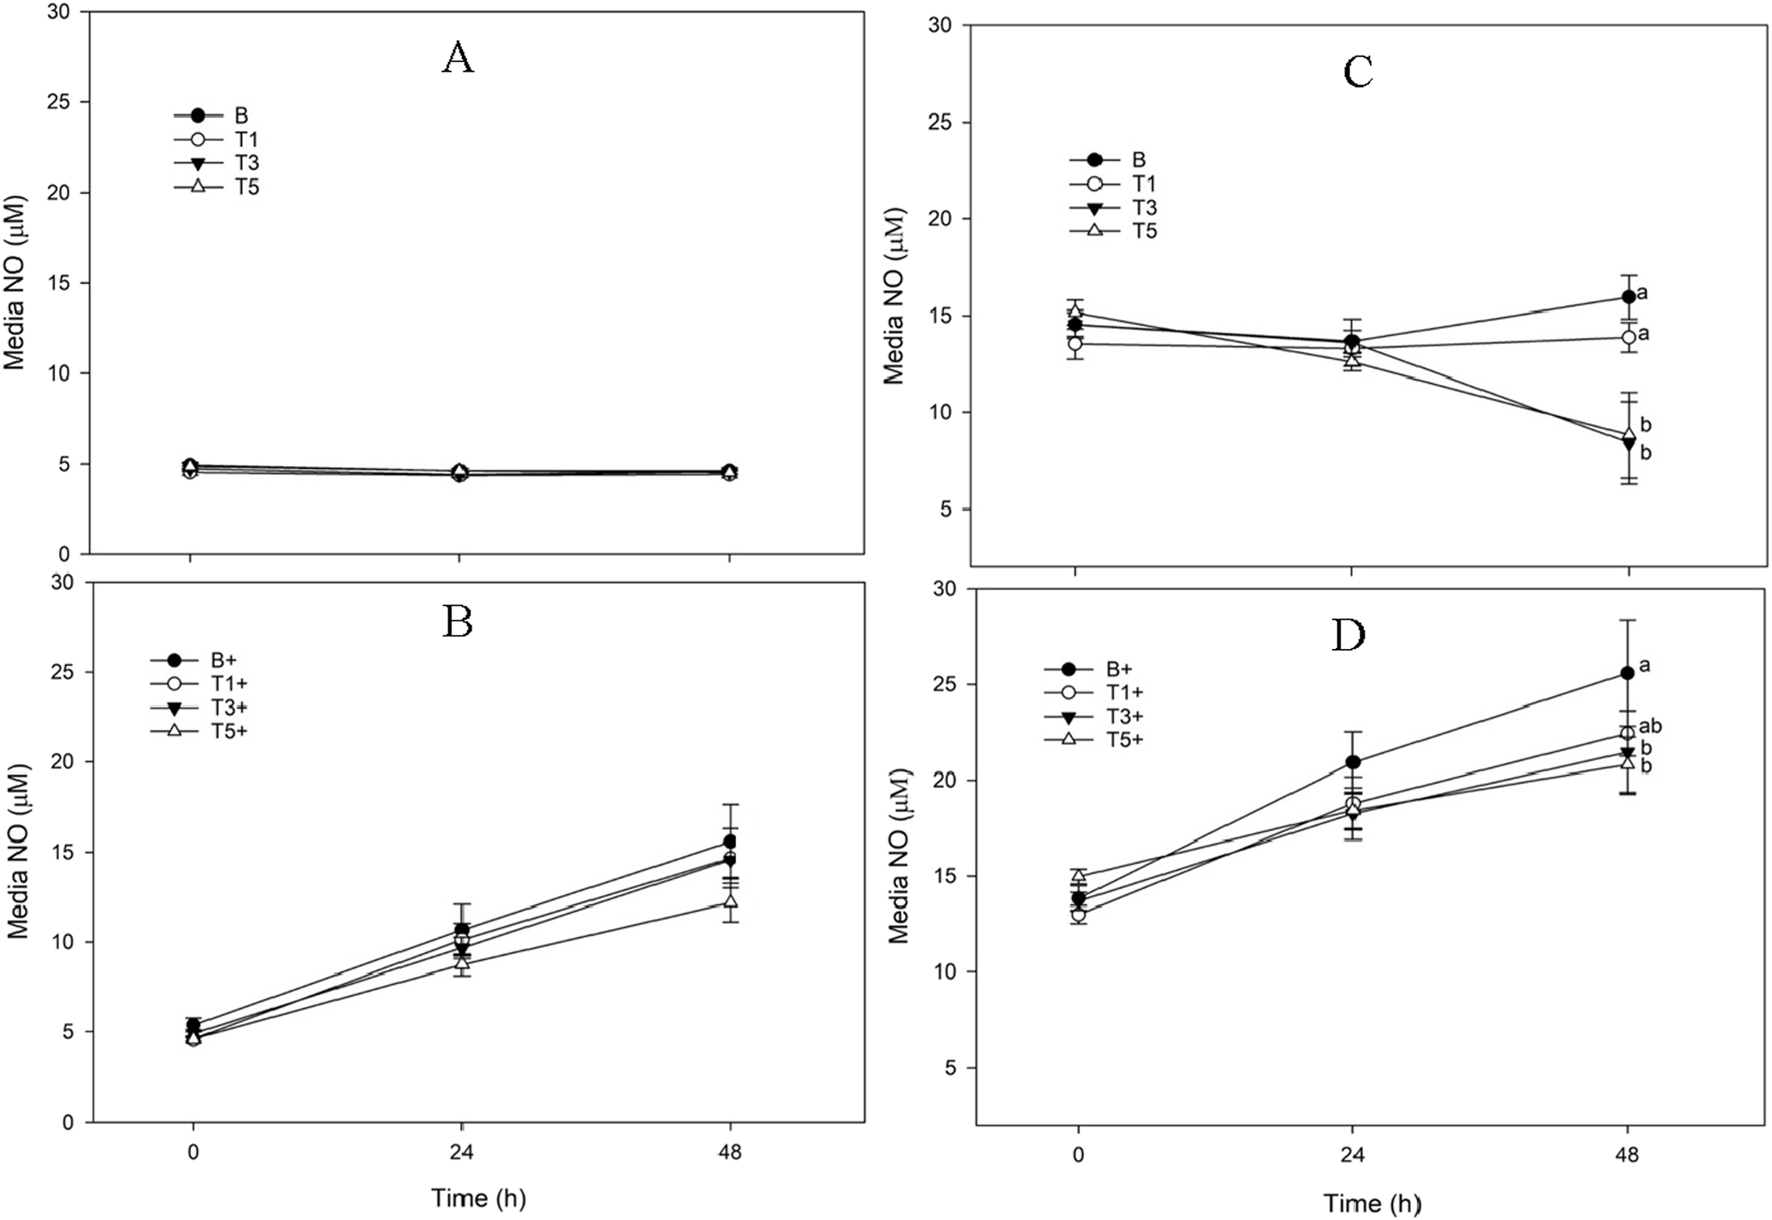
Media Nitric Oxide (NO) concentration from explants conditioned with TURsim or TTsim (T1: 7.6 μg/mL; T3: 22.8 μg/mL; T5: 38 μg/mL) in the absence [(A,C) respectively] or presence [(B,D) respectively] of lipopolysaccharide (LPS; +; 10 μg/mL), compared to an LPS-stimulated (B+) or unstimulated (B) blank control. Data represent the final 48 h of a 120 h culture duration. LPS-stimulated explants received LPS for the final 48 h. Different lower-case letters denote significant difference between groups at a single time point (p < 0.05).
TTsim
There was no significant change in NO concentration in B explants across the 48 h sampling time course (Figure 2C). NO was significantly lower at 48 h than at 0 h in both TTsim-T3 and TTsim-T5 (p < 0.001 for both). LPS produced a significant increase in NO in TTsim-B+ and TTsim-T1+ explants at 24 and 48 h (p < 0.001 for all) (Figure 2D). In explants conditioned with TTsim-T5+, NO was significantly increased at 48 h (p = 0.008) but not at 24 h (p = 0.06). At 48 h, TTsim-3+ and TTsim-5+ both had significantly lower NO than B+ (p = 0.009 and p = 0.004, respectively).
PGE2
There were no significant effects of TURsim or TTsim on PGE2 production in either unstimulated (Figure 3A,C) or stimulated (Figure 3B,D) explants.
FIGURE 3
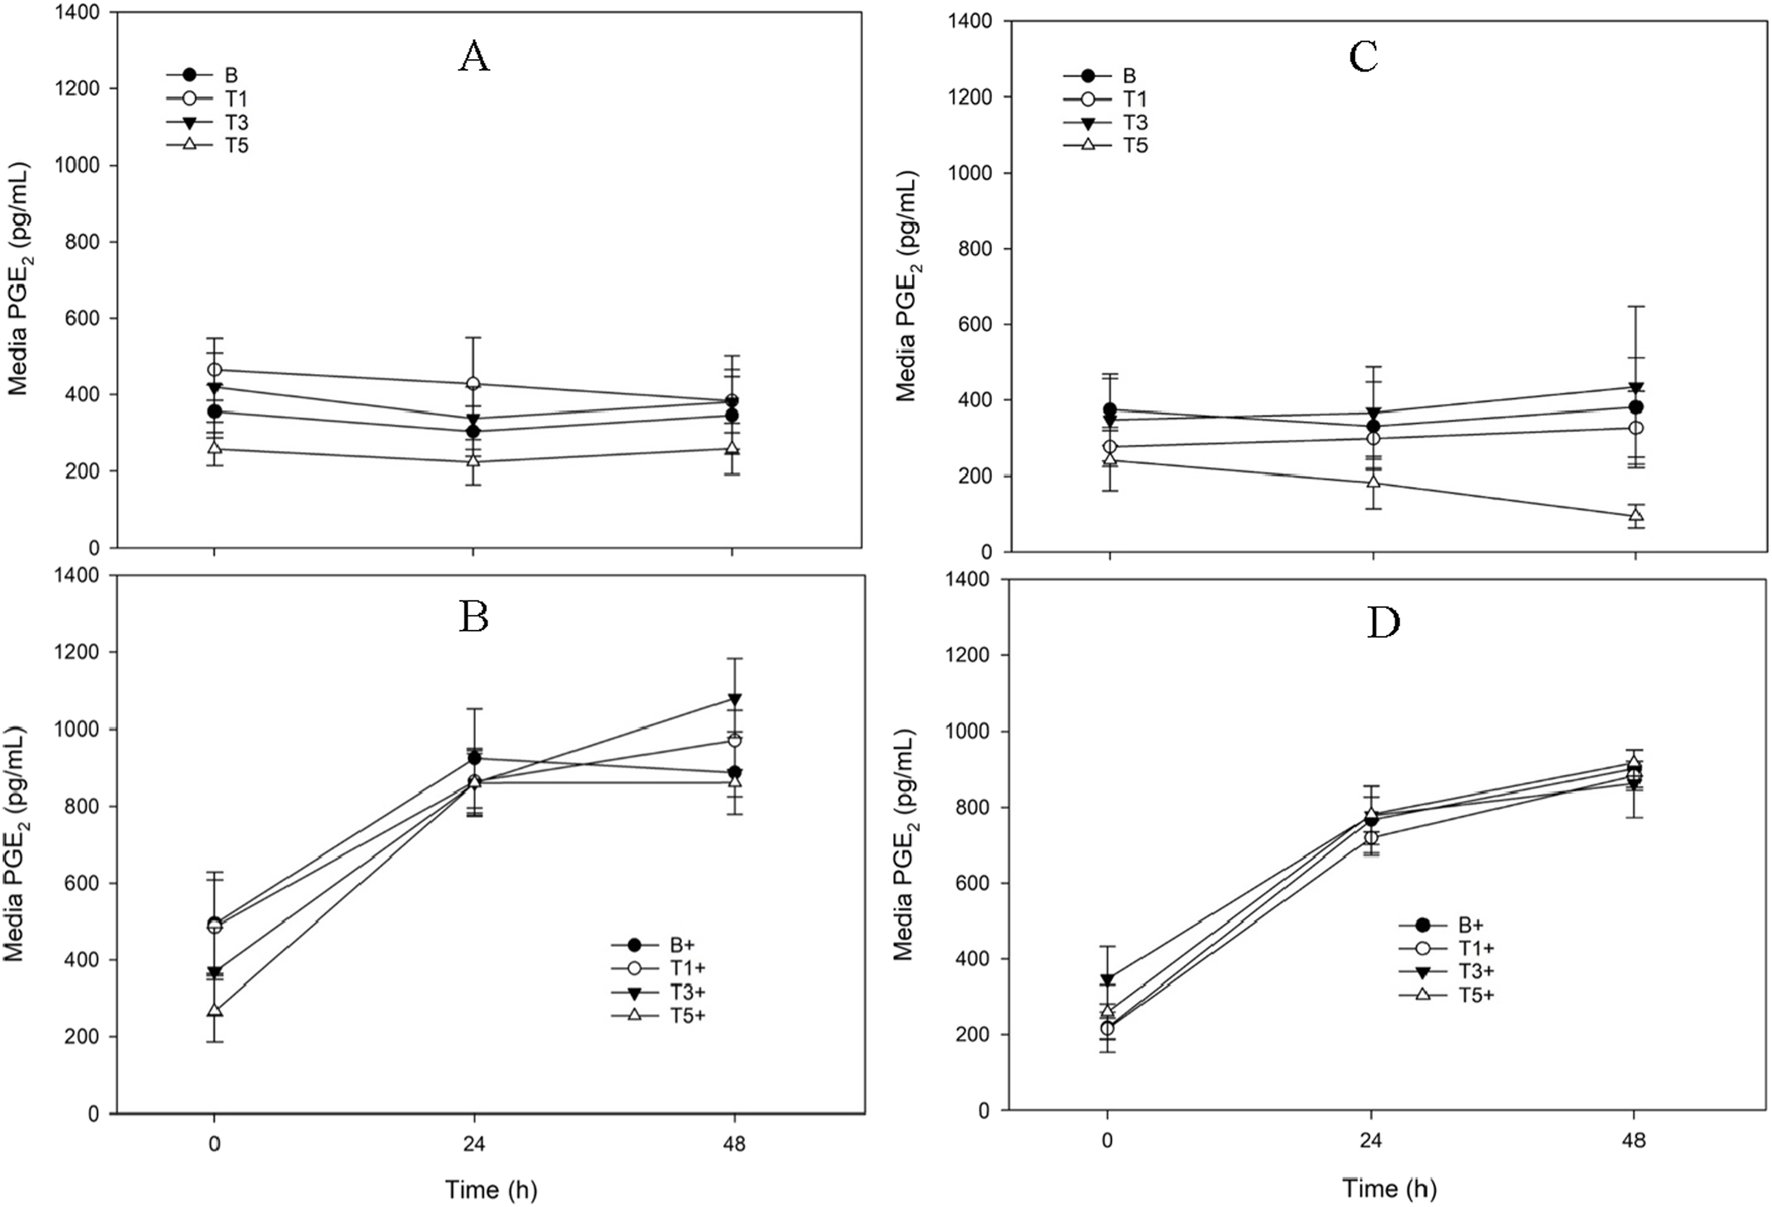
Media Prostaglandin E2 (PGE2) concentration from explants conditioned with TURsim or TTsim (T1: 7.6 μg/mL; T3: 22.8 μg/mL; T5: 38 μg/mL) in the absence [(A,C) respectively] or presence [(B,D) respectively] of lipopolysaccharide (LPS; +; 10 μg/mL), compared to an LPS-stimulated (B+) or unstimulated (B) blank control. Data represent the final 48 h of a 120 h culture duration. LPS-stimulated explants received LPS for the final 48 h.
Media GAG
TURsim
In unstimulated explants there were no significant changes from 0 h in media GAG in any treatments across the 48 h sampling period (Figure 4A). At 0 h, media GAG was significantly lower in TURsim-T1 and TURsim-T5 than in B explants (p = 0.007 for both). There were no significant effects of time or treatment in LPS-stimulated explants (Figure 4B).
FIGURE 4
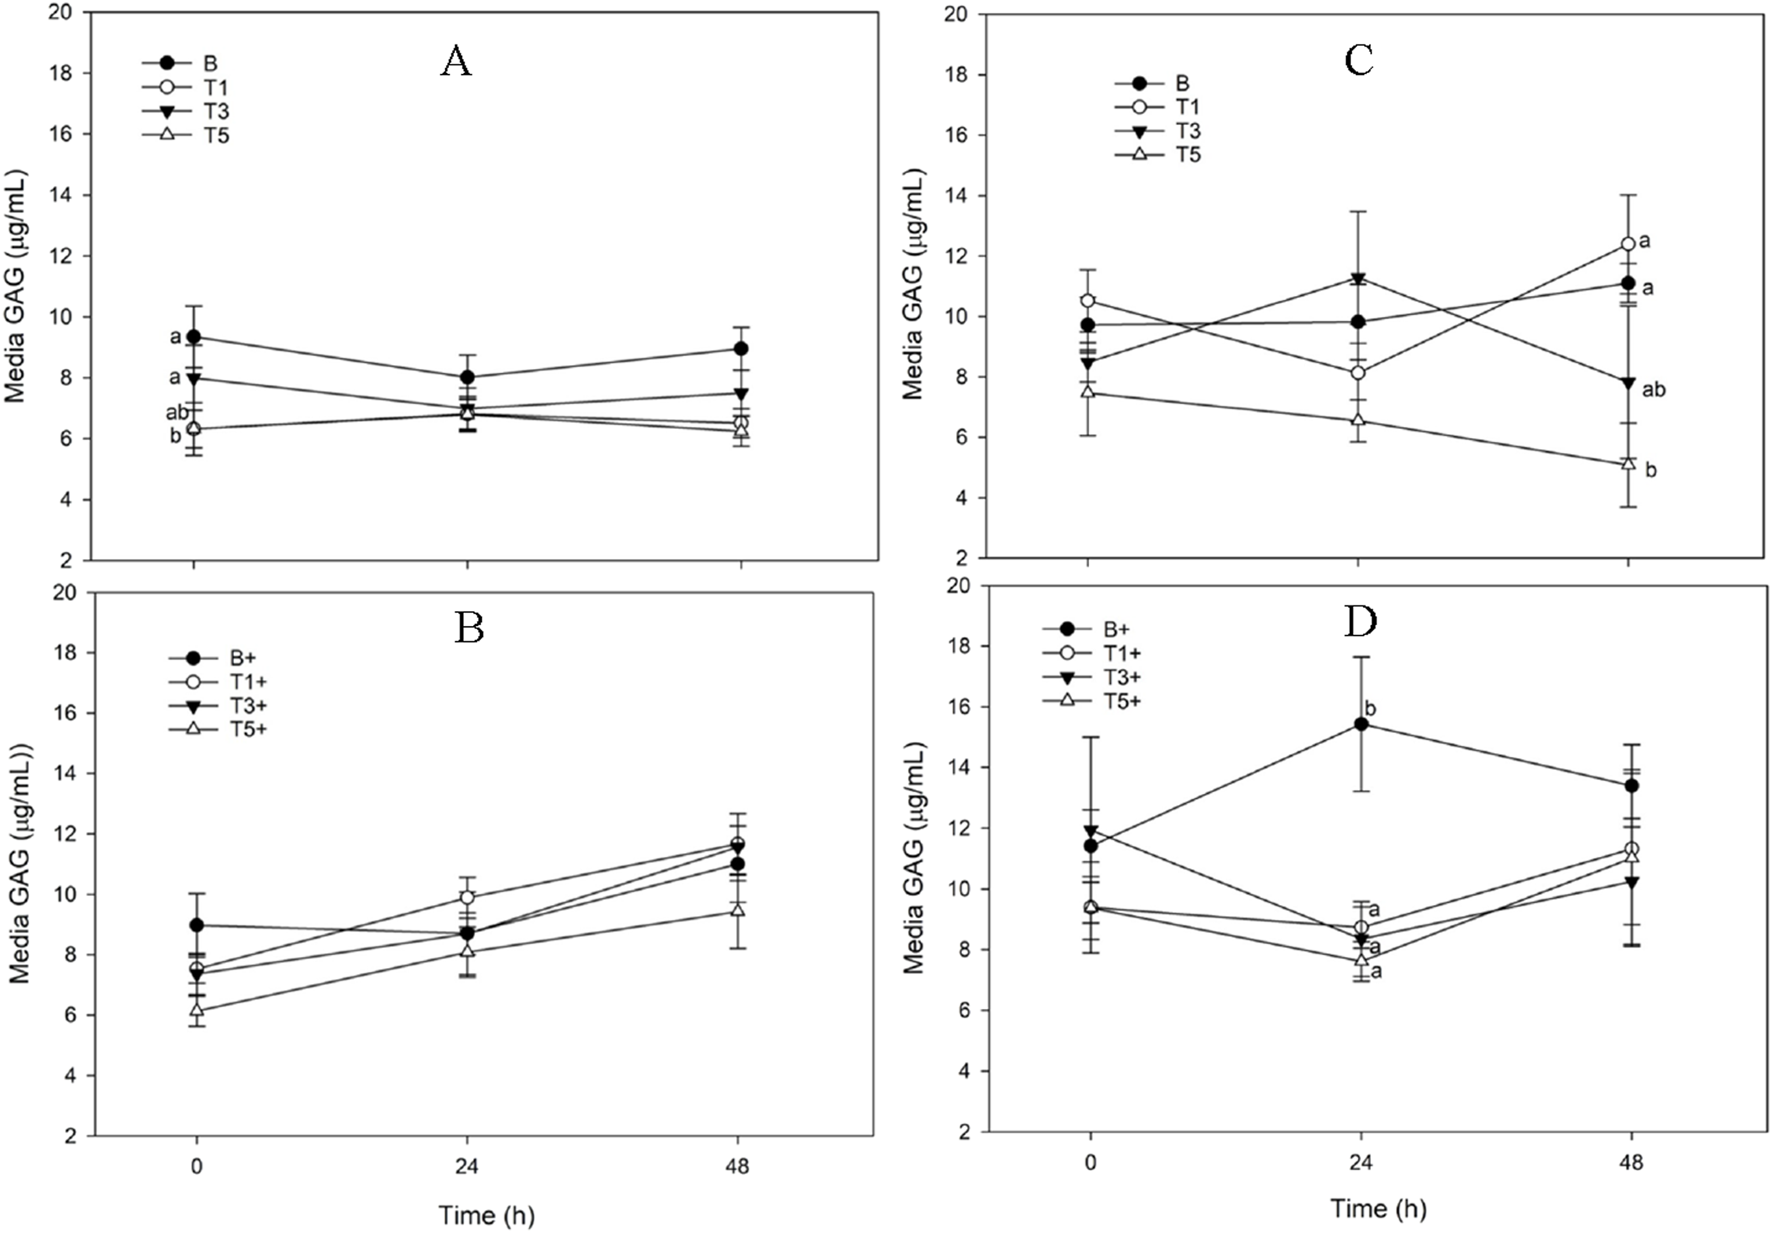
Media Glycosaminoglycan (GAG) concentration from explants conditioned with TURsim or TTsim (T1: 7.6 μg/mL; T3: 22.8 μg/mL; T5: 38 μg/mL) in the absence [(A,C) respectively] or presence [(B,D) respectively] of lipopolysaccharide (LPS; +; 10 μg/mL), compared to an LPS-stimulated (B+) or unstimulated (B) blank control. Data represent the final 48 h of a 120 h culture duration. LPS-stimulated explants received LPS for the final 48 h.
TTsim
In unstimulated explants there were no effects of time on media GAG in any treatment. At 48 h, TTsim-T5 had significantly lower media GAG than TTsim-T1 (p = 0.001) and TTsim-B (p = 0.01) (Figure 4C). There were no significant effects of LPS on media GAG in any treatment. At 24 h, media GAG was significantly higher in TTsim-B+ than in TTsim-T1+ (p = 0.04), TTsim-T3+ (p = 0.03), and TTsim-T5+ (p = 0.01) (Figure 4D).
Tissue GAG
TURsim
There were no significant effects of time or TURsim conditioning on tissue GAG (Figure 5A). A significant reduction in GAG retention between baseline and B was not observed in any explants conditioned with TURsim.
FIGURE 5
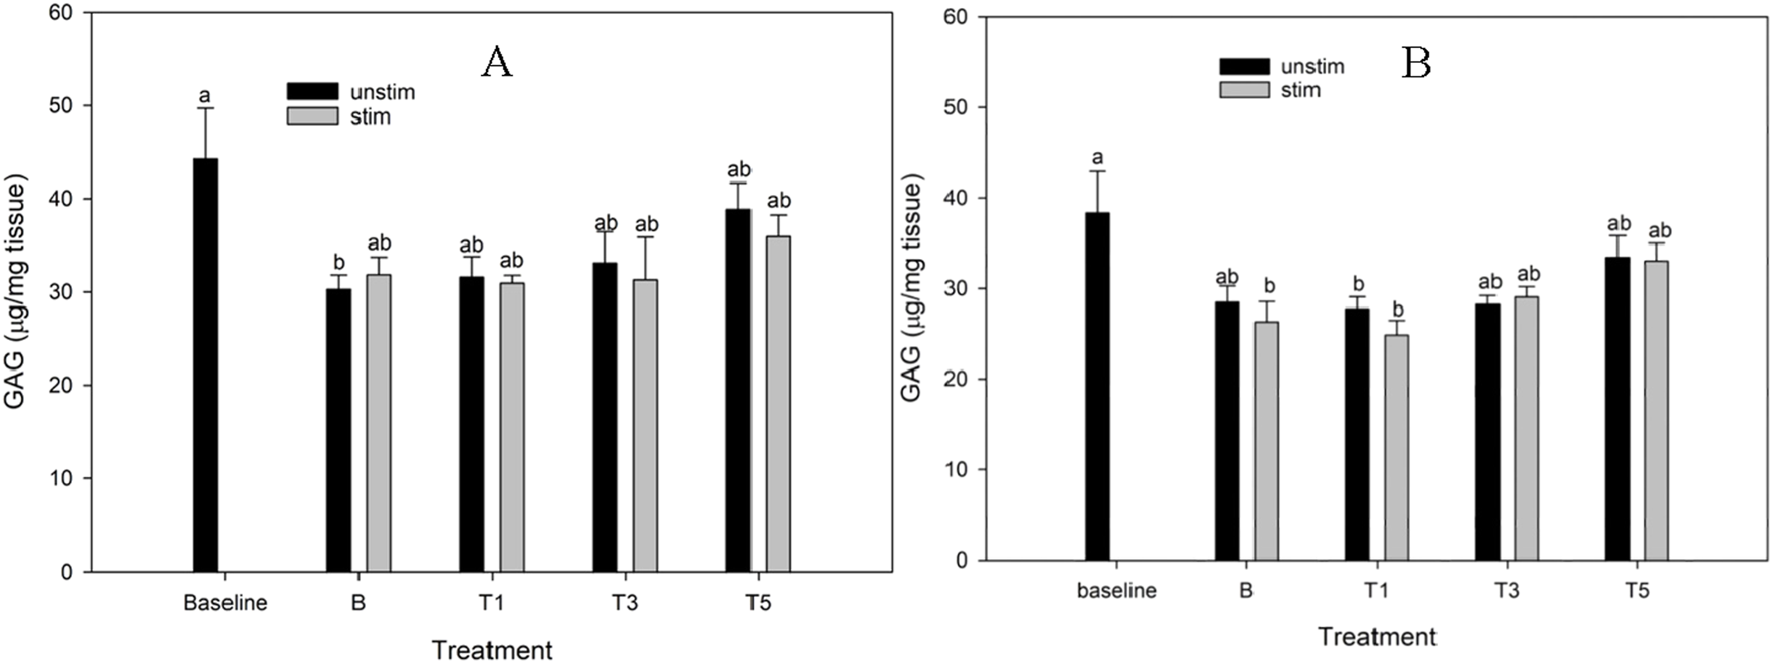
Cartilage glycosaminoglycan (GAG) content of explants conditioned with TURsim (A) and TTsim (B) at 0 (B) 7.6 (T1), 22.8 (T3) and 38 μg/mL (T5) in the absence (black bars) or presence (grey bars) of lipopolysaccharide (LPS; 10 μg/mL). Baseline explants were collected prior to 120 h of culture and all other explants were after 120 h culture. * Denotes significant change from baseline. Lowercase letters denote significant differences between groups.
TTsim
In the TTsim experiment, TTsim-B+, TTsim-T1+, and TTsim-T1a had significantly lower tissue GAG than baseline (p = 0.007, 0.001 and 0.03, respectively) (Figure 5B). There were no differences between baseline and TTsim-T3 or TTsim-T5, either in the presence or absence of LPS, nor between baseline and TTsim-B.
GAG retention index
TURsim
In unstimulated explants, GAG retention index was significantly higher in TURsim-T1 (p = 0.02) and TURsim-T5 (p = 0.004) than in TURsim-B (Figure 6A). There were no significant differences between groups in stimulated explants.
FIGURE 6
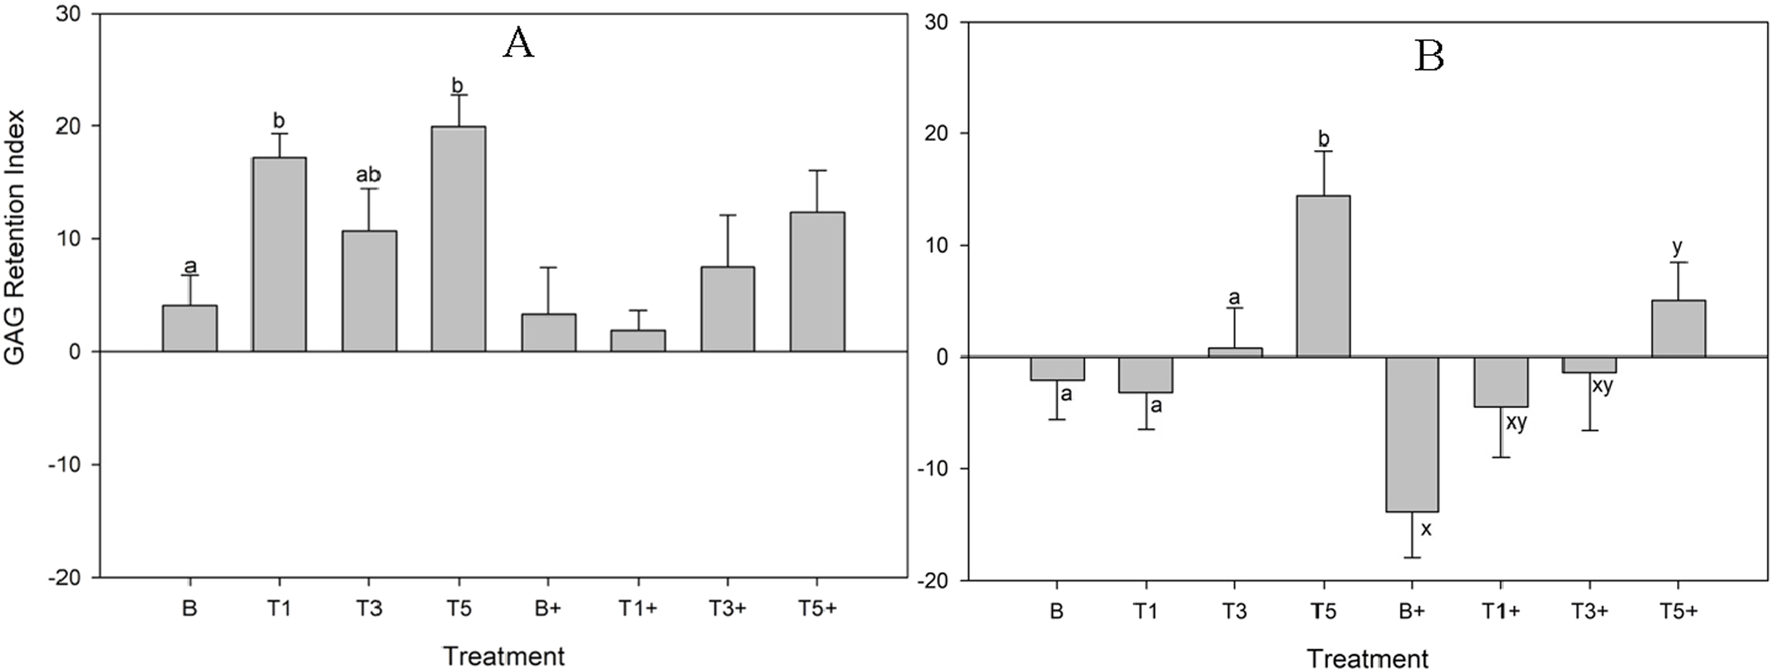
Glycosaminoglycan Retention Index by explants conditioned with TURsim (A) and TTsim (B) at 0 (B) 7.6 (T1), 22.8 (T3) and 38 μg/mL (T5) after 120 h of culture. In treatments denoted with ‘+’, lipopolysaccharide (10 μg/mL) was added for the final 48 h of culture. Different lowercase letters denote significant differences between groups.
TTsim
In unstimulated explants, GAG retention index was significantly higher in TTsim-T5 than in TTsim-B (p = 0.02), TTsim-T1 (p = 0.01), and TTsim-T3 (p = 0.05) (Figure 6B). In stimulated explants, TTsim-T5+ had significantly higher GAG retention index than TTsim-B+ (p = 0.02).
Discussion
The purpose of the current study was to generate new information on the effects of turmeric alone and in combination with tamarind on cartilage explant homeostasis in the presence or absence of an inflammatory stimulus (LPS). The main findings of this study are that turmeric had no significant effects on NO or PGE2, with or without exposure to LPS. A small but significant reduction in GAG loss in unstimulated explants conditioned with the highest turmeric dose prior to the final 48 h culture period contributed to a significant increase in GAG Retention Index in the T5 dose of turmeric. These improvements in cartilage structure from turmeric were not observed in the LPS-stimulated explants. In contrast, addition of tamarind to turmeric resulted in significant reductions in NO (T3 and T5 doses for both stimulated and unstimulated explants), and media GAG (T5 for unstimulated explants, T3 and T5 for stimulated explants) and a significant increase in GAG retention index (T5). Both test articles were not associated with a loss of cell viability at the doses tested. These data provide evidence for a synergistic interaction between tamarind and turmeric on cartilage homeostasis.
The weak effects of turmeric alone in the current study contrast with our earlier work which showed a marked dose-responsive, inhibitory effect of turmeric on LPS-induced production of PGE2 (Pearson and Kott, 2019). Peak PGE2 response to LPS (10 μg/mL) in the current study was around 800–1,000 pg/mL which is approximately half of the peak of 1,500–2,500 pg/mL in the former (which used an LPS stimulus of 5 μg/mL). It is therefore possible that a stronger inflammatory stimulus is required to observe separation between treatment groups. It is unknown why the LPS stimulation in the current study produced a blunted PGE2 response, despite being at a higher dose, but may result from a different pathotype of LPS used. This highlights the importance of identifying the strain of LPS used in these types of experiments. Nevertheless, the moderated PGE2 response in the current study is closer to the magnitude of synovial fluid PGE2 in horses with joint disease of approximately 700 pg/mL (range, 19–1,100 pg/mL) (Kirker-Head et al., 2000); thus, turmeric influence (or lack thereof) on cartilage explant PGE2 production in the current study may be more translatable to the in vivo setting, and suggests that turmeric may not exert its effects through a PGE2-dependent mechanism. Inclusion of tamarind with turmeric did not impact the influence of turmeric on PGE2 production.
Similar to PGE2, the current study did not generate evidence for an effect of turmeric on nitric oxide. This is again in contrast to our earlier investigation of a biological extract of turmeric, in which turmeric was found to increase LPS-induced nitric oxide in a dose-dependent manner (Pearson and Kott, 2019). The turmeric material in both studies was put through an identical simulated biological extraction procedure, and the tested concentrations were within a similar range. However the source of the material differed, and the content of curcuminoids in turmeric can vary widely depending on turmeric variety (Setzer et al., 2021), region of origin, and processing (Booker et al., 2014). It can be concluded that the source material used in the current study did not influence nitric oxide production from cartilage explants, either in the presence or absence of LPS. However, the inclusion of tamarind in the biological extract produced clear effects on nitric oxide, with both the T3 and T5 doses of the tamarind-turmeric combination inhibiting nitric oxide in both the presence and absence of LPS. This is consistent with an in vivo report of lowered serum nitrite and articular iNOS in arthritic rats provided with a combination tamarind + turmeric blend (Kwon et al., 2023). While it is known that tamarind alone has inhibitory effects on NO production (Komakech et al., 2019), it is not known to what extent synergies between tamarind and turmeric contributed to the effects observed on nitric oxide in the current study. This question should be explored in future research.
The most pronounced effects in the current study, from both test articles, were associated with preservation of cartilage extracellular matrix. The effect of turmeric alone in unstimulated explants was weak, and significant only at the beginning of the 48 h sample collection time course. Cartilage explants were cultured in the presence of their test articles for 48 h prior to beginning of the sampling time course, suggesting that this ‘preconditioning’ contributed to a turmeric-mediated slowing of cartilage matrix breakdown occurring in response to the explantation process. This small but significant reduction in GAG loss, coupled with a small (non-significant) increase in cartilage GAG, contributed to the improvement seen in GAG retention index in turmeric-conditioned explants. These data contribute further evidence for the ability of turmeric to protect cartilage structure in vitro (Pearson and Kott, 2019; Clutterbuck et al., 2009). Inclusion of tamarind in the biological extract appeared to augment effects on cartilage structure, primarily through more marked reduction in media GAG loss in both unstimulated and LPS-stimulated explants than with turmeric alone. This led to a significant improvement in GAG retention index with the highest dose of tamarind + turmeric. Data which inform the degree to which tamarind alone produced this effect is, to the author’s knowledge, not available; thus, we can say only that a combination of tamarind and turmeric reduces GAG loss from cartilage better than turmeric alone. This aligns well with studies which report that tamarind combined with turmeric improves clinical outcomes (Rao et al., 2019; Prasad et al., 2023), and reduces a biomarker of cartilage breakdown (CTX-II) in people with knee arthritis (Prasad et al., 2023). Future studies should explore the extent to which tamarind contributes to the effects observed in the combination product in the current study.
Conclusion
It is concluded that a combination of turmeric and tamarind improves upon the anti-inflammatory and anti-catabolic effects of turmeric alone in cartilage explants. This effect is achieved primarily through improved inhibition of nitric oxide and augmented protection of cartilage explants against GAG loss. Further research into this combination product is warranted.
Statements
Data availability statement
The raw data supporting the conclusions of this article will be made available by the authors, without undue reservation.
Ethics statement
The requirement of ethical approval was waived by University of Guelph Animal Care Committee for the studies involving animals because post-mortem tissue obtained from animals slaughtered for human consumption was used. Ethics approval was not required. The studies were conducted in accordance with the local legislation and institutional requirements.
Author contributions
MC: Writing – review and editing, Methodology, Investigation, Formal Analysis, Writing – original draft, Data curation. RL: Investigation, Methodology, Writing – original draft. KV: Investigation, Methodology, Writing – review and editing. JS-Y: Writing – review and editing, Methodology, Investigation. WP: Project administration, Formal Analysis, Investigation, Resources, Data curation, Supervision, Funding acquisition, Writing – review and editing, Conceptualization, Methodology.
Funding
The author(s) declared that financial support was received for this work and/or its publication. Platinum Performance, grant #05639. The funders had no role in the design of the study; in collection, analyses, or interpretation of data; in the writing of the manuscript; or in the decision to publish the results.
Conflict of interest
The author(s) declared that this work was conducted in the absence of any commercial or financial relationships that could be construed as a potential conflict of interest.
Generative AI statement
The author(s) declared that generative AI was not used in the creation of this manuscript.
Any alternative text (alt text) provided alongside figures in this article has been generated by Frontiers with the support of artificial intelligence and reasonable efforts have been made to ensure accuracy, including review by the authors wherever possible. If you identify any issues, please contact us.
Publisher’s note
All claims expressed in this article are solely those of the authors and do not necessarily represent those of their affiliated organizations, or those of the publisher, the editors and the reviewers. Any product that may be evaluated in this article, or claim that may be made by its manufacturer, is not guaranteed or endorsed by the publisher.
Abbreviations
5-LOX, 5-lipooxygenase; C-AM, Calcein-AM; COL2A1, collagen type II; COX2, cyclooxygenase-2; EthD-1, Ethidium homodimer-1; GAG, Glycosaminoglycan; GRI, Glycosaminoglycan retention index; GIT, Gastrointestinal tract; HIF-2α, hypoxia-inducible factor-2 alpha; IL, interleukin; iNOS, inducible nitric oxide synthase; LPS, Lipopolysaccharide; MMP, matrix metalloproteinases; NF-κB, nuclear factor-kappa B; NO, Nitric oxide; PGE2, Prostaglandin E2; TCM, Tissue culture media; TNF-α, tumor necrosis factor-alpha.
References
1
Amalraj A. Pius A. Gopi S. Gopi S. (2017). Biological activities of curcuminoids, other biomolecules from turmeric and their derivatives – a review. J. Tradit. Complement. Med.7 (2), 205–233. 10.1016/j.jtcme.2016.05.005
2
Booker A. Frommenwiler D. Johnston D. Umealajekwu C. Reich E. Heinrich M. (2014). Chemical variability along the value chains of turmeric (curcuma longa): a comparison of nuclear magnetic resonance spectroscopy and high performance thin layer chromatography. J. Ethnopharmacol.152 (2), 292–301. 10.1016/j.jep.2013.12.042
3
Chin K. Y. (2016). The spice for joint inflammation: anti-inflammatory role of curcumin in treating osteoarthritis. Drug Des. Dev. Ther.10, 3029–3042. 10.2147/DDDT.S117432
4
Clutterbuck A. L. Mobasheri A. Shakibaei M. Allaway D. Harris P. (2009). Interleukin-1beta-induced extracellular matrix degradation and glycosaminoglycan release is inhibited by curcumin in an explant model of cartilage inflammation. Ann. N. Y. Acad. Sci.1171, 428–435. 10.1111/j.1749-6632.2009.04687.x
5
Crosbie M. Vanderboom K. Souccar-Young J. Pearson W. (2025). Integrating cartilage explant culture with simulated digestion and hepatic biotransformation refines in vitro screening of joint care nutraceuticals. MPs8 (4), 91. 10.3390/mps8040091
6
Daily J. W. Yang M. Park S. (2016). Efficacy of turmeric extracts and curcumin for alleviating the symptoms of joint arthritis: a systematic review and Meta analysis of randomized clinical trials. J. Med. Food19, 717–729. 10.1089/jmf.2016.3705
7
Forro M. Cieslar S. Ecker G. L. Walzak A. Hahn J. Lindinger M. I. (1985). Total body water and ECFV measured using bioelectrical impedance analysis and indicator dilution in horses. J. Appl. Physiol.89 (2), 663–671. 10.1152/jappl.2000.89.2.663
8
Henrotin Y. Clutterbuck A. L. Allaway D. Lodwig E. M. Harris P. Mathy-Hartert M. et al (2010). Biological actions of curcumin on articular chondrocytes. Osteoarthr. Cart.18, 141–149. 10.1016/j.joca.2009.10.002
9
Jain S. Patil S. G. Chinta G. Alluri K. V. (2022). TamaFlexTM—A novel nutraceutical blend improves lameness and joint functions in working horses. Vet. Med. Sci.8 (5), 1936–1945. 10.1002/vms3.894
10
Kare S. K. Vinay V. Maresz K. Prisk V. Vik H. (2022). “Tamarindus indica seed extract-based botanical compositions alleviate knee pain and improve joint function in mild-to-moderate osteoarthritis: a randomized, double-blind, placebo-controlled clinical study,”Evidence-Based Complementary Altern. Med.1–14. 10.1155/2022/2226139
11
Kirker-Head C. A. Chandna V. K. Agarwal R. K. Morris E. A. Tidwell A. O'Callaghan M. W. et al (2000). Concentrations of substance P and prostaglandin E2 in synovial fluid of normal and abnormal joints of horses. Am. J. Vet. Res.61 (6), 714–718. 10.2460/ajvr.2000.61.714
12
Komakech R. Kim Y. Matsabisa G. M. Kang Y. (2019). Anti-inflammatory and analgesic potential of Tamarindus indica linn. (fabaceae): a narrative review. Integr. Med. Res.8 (3), 181–186. 10.1016/j.imr.2019.07.002
13
Kwon S. B. Chinta G. Kundimi S. Kim S. Cho Y. D. Kim S. K. et al (2023). A blend of Tamarindus indica and Curcuma longa extracts alleviates monosodium iodoacetate (MIA)-induced osteoarthritic pain and joint inflammation in rats. J. Am. Nutr. Assoc.43 (1), 48–58. 10.1080/27697061.2023.2209880
14
Pearson W. Kott L. S. (2019). A biological extract of turmeric (Curcuma longa) modulates response of cartilage explants to lipopolysaccharide. BMC Complementary Altern. Med.19 (1), 252. 10.1186/s12906-019-2660-z
15
Prasad N. Vinay V. Srivastava A. (2023). Efficacy of a proprietary combination of Tamarindus indica seeds and Curcuma longa rhizome extracts in osteoarthritis: a clinical investigation. Food Nutr. Res.20, 67. 10.29219/fnr.v67.9268
16
Rao P. S. Ramanjaneyulu Y. S. Prisk V. R. Schurgers L. J. (2019). A combination of Tamarindus indica seeds and Curcuma longa rhizome extracts improves knee joint function and alleviates pain in non-arthritic adults following physical activity. Int. J. Med. Sci.16 (6), 845–853. 10.7150/ijms.32505
17
Setzer W. N. Duong L. Poudel A. Mentreddy S. R. (2021). Variation in the chemical composition of five varieties of Curcuma longa rhizome essential oils cultivated in north Alabama. Foods10 (2), 212. 10.3390/foods10020212
18
Sharma R. A. McLelland H. R. Hill K. A. Ireson C. R. Euden S. A. Manson M. M. et al (2001). Pharmacodynamic and pharmacokinetic study of oral curcuma extract in patients with colorectal cancer. Clin. Cancer Res.7 (7), 1894–1900.
19
Thanawala S. Shah R. Doyle L. Upadhyay V. (2024). Comparative pharmacokinetics of curcuminoids from water-dispersible turmeric extract against a curcuminoids-piperine combination: an open-label, randomized, balanced, 2-Treatment, 2-Sequence, 2-Period crossover study. Altern. Ther. Health Med.30 (4), 18–23.
20
Velusami C. C. Richard E. J. Bethapudi B. (2018). Polar extract of Curcuma longa protects cartilage homeostasis: possible mechanism of action. Inflammopharmacology26 (5), 1233–1243. 10.1007/s10787-017-0433-1
Summary
Keywords
anti-inflammatory, arthritis, chondroprotective, nutraceuticals, tamarind, turmeric
Citation
Crosbie M, Lamon R, Vanderboom K, Souccar-Young J and Pearson W (2026) A blend of tamarind (Tamarindus indica) and turmeric (Curcuma longa) has more pronounced effects on cartilage explant homeostasis than turmeric alone. Front. Nat. Prod. 4:1764266. doi: 10.3389/fntpr.2025.1764266
Received
09 December 2025
Revised
17 December 2025
Accepted
23 December 2025
Published
12 January 2026
Volume
4 - 2025
Edited by
Argyrios Periferakis, Carol Davila University of Medicine and Pharmacy, Romania
Reviewed by
Lamprini Troumpata, Carol Davila University of Medicine and Pharmacy, Romania
Iosif-Aliodor Timofticiuc, Carol Davila University of Medicine and Pharmacy, Romania
Updates
Copyright
© 2026 Crosbie, Lamon, Vanderboom, Souccar-Young and Pearson.
This is an open-access article distributed under the terms of the Creative Commons Attribution License (CC BY). The use, distribution or reproduction in other forums is permitted, provided the original author(s) and the copyright owner(s) are credited and that the original publication in this journal is cited, in accordance with accepted academic practice. No use, distribution or reproduction is permitted which does not comply with these terms.
*Correspondence: Wendy Pearson, wpearson@uoguelph.ca
Disclaimer
All claims expressed in this article are solely those of the authors and do not necessarily represent those of their affiliated organizations, or those of the publisher, the editors and the reviewers. Any product that may be evaluated in this article or claim that may be made by its manufacturer is not guaranteed or endorsed by the publisher.