- 1Lancaster University, School of Engineering, Lancaster, United Kingdom
- 2University of Manchester, Department of Electrical and Electronic Engineering, Manchester, United Kingdom
- 3Research Centre for Radwaste Disposal, Williamson Research Centre and Dalton Nuclear Institute, University of Manchester, Manchester, United Kingdom
A technique for the in-situ localization of radioactivity is described in which the influence of γ-radiation impinging on a high-Z collimator, by which the angular response of a scintillation detector is constrained in order to identify the corresponding angular position of the radiation source, is expressed mathematically by way of a normalized sinc transform. We test this approach by examining the utility of the sinc transform to express the angular responses derived from a slot-collimated cerium bromide detector, across a variety of energy regions. Individual spectra have been acquired as a function of angle to explore how the shape of the response of the collimator-detector arrangement changes for X-rays and γ rays. A 90% improvement in localization is observed when this is defined in terms of the area described by the variance between the known location and that indicated by the response of the collimated system. This approach has the potential to improve source location accuracy and to further optimize autonomous robot exploration routines used to characterize contaminated environments associated with nuclear legacies and radiological emergencies.
1 Introduction
Releases of radioactivity to the environment are of global concern and can rank high on risk registers, for example in the context of industrial nuclear accidents (UK Government, 2020, pp. 9), malicious activities resulting in the need for a stand-off forensic analysis of radiation emitted by orphan radioactivity and environmental consequences as in the case of the Fukushima Daiichi accident (Magwood IV et al., 2021). Determining the angular position of radioactivity in such circumstances is essential to inform and/or develop plans for emergency response and decontamination. In this regard, integrating capabilities in robotics and radiation detection can reduce risk by removing people from a hazardous environment whilst increasing characterization performance (Tsitsimpelis et al., 2019), particularly where the decommissioning of legacy nuclear facilities and managing nuclear waste are priorities (Martin et al., 2018; Nancekievill et al., 2018; Tsitsimpelis et al., 2021; West et al., 2021). However, since only a miniscule physical amount of radioactivity is necessary to generate a large geometrical distribution of radiation, using the latter to pinpoint the position of said radioactivity can be prone to significant uncertainty, especially if the angular response function of the detection system is poorly characterized. Conversely, if this uncertainty can be reduced via improved source localization, remedial operations might be easier and quicker, reducing the time people are required to work near to a radiological hazard and the amount of radioactive waste produced. A variety of commercial radiation imaging systems are available based on collimated detectors and also the use of coded apertures (H3D, 2022; Nuvia tech Instruments, 2022). Of particular relevance to this work are the Rad Scan and Cartogam systems (Gal et al., 2001; Hughes and Cracknell, 2011).
The detection technique at the focus of this article concerns source localization by means of a single, directionally-sensitive radiation detector. Recently, Miller et al. (2015) explored the drive-by response of a horizontal, rotating lanthanum bromide (LaBr3) detector in a right-circular cylindrical collimator to caesium-137 (137Cs) and cobalt-60 (60Co) point radioactive sources. They derived this based on 1) solid angle and 2) attenuation in the detector, advancing approaches by Klann et al. (2006) and Abbas and Noureddeen (2011), and they incorporated the functionality of a four-wheeled robot. In this research, we have combined this insight with the use of systems (Tsitsimpelis et al., 2021; West et al., 2021) in which a gimbal is coupled to a slot-collimated cerium bromide (CeBr3) detector.
The main novelty of this article is the application of mathematical transforms to describe the angular response of a collimated radiation detector in order to predict the location of contamination with increased spatial accuracy. In particular, a normalized sinc transform has been utilized for a set of angular responses obtained at different azimuthal (tilt) angles in order to test the potential benefit of the transform method to improve our ability to locate point-localized radioactivity (in this case 137Cs). Furthermore, the potential of linking formal time series methods to this analysis is explored. In this particular example, the model structure of the sinc transform is cast as a regressor to estimate a dynamic linear regression model (DLR, defined in Section 4.3), with coefficients corresponding to time (or rather angle) variants, each represented by an integrated random walk (IRW) model (Young, 1998; Taylor et al., 2018). In turn, the angular measurements are subsampled and reconstructed back to the original resolution, to highlight the advantage of using transform methods when timing constraints do not necessarily allow for lengthy and high-resolution measurements. Finally, energy-resolved data are utilized to investigate the structure of these angular responses, as illustrated by a comparison of the characteristic 662 keV γ-ray photopeak and 32 keV X-ray lines of the 137Cs photon spectrum.
The paper is structured as follows: Section 2 describes the background to the transform hypothesis; Section 3 outlines the bespoke radiation detection instrumentation hardware developed for this study; Section 4 presents the results; Section 5 discusses the findings of the research and directions for future research, and Section 6 concludes the work.
2 Background
In this article it is postulated that the detection response derived with a simple collimator of a finite geometric opening corresponds to the transform of a function corresponding to that opening as a function of horizontal (pan) scan angle θ, that is,
where
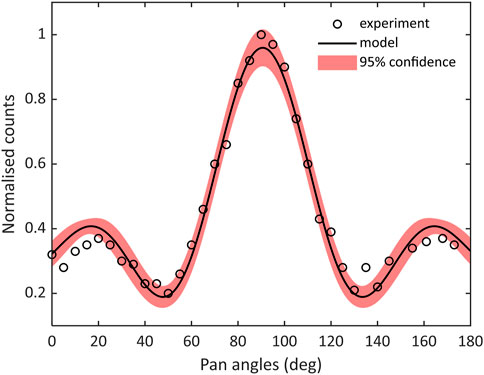
FIGURE 1. Data from Miller et al. (2015) derived with a collimated LaBr3 detector rotated in the horizontal plane and exposed to 137Cs and 60Co point sources (open circles), compared to the model response from Eq. 1 (solid black line), and standard errors.
The rationale behind deriving an a-priori model, as above, to drive-by responses is that it represents the measured data mathematically, somewhat independent of constraints associated with real environments, such as measurement noise, and it provides a potential route by which the influence of constraints such as the available dwell time at a given position (that limit the number of measurements and hence the spatial resolution) might be reduced. Similarly, formal time series methods may be utilized to discern features from responses in more complex scenarios, where, e.g., dispersed sources, and scatter from clutter and materials constituting boundaries (walls and floors) etc. is present. As such, this new analysis may benefit the optimization of robotic path-planning to yield better, spatially-resolved radiation maps and thus improved source localization.
3 Materials and methods
3.1 Hardware description for the results presented between Sections 4.1 and 4.4
The radiation detection hardware used for this aspect of the research comprised a Mixed Field Analyzer (MFA, Hybrid Instruments Ltd., United Kingdom) (Joyce et al., 2014) ported to a bespoke enclosure to house the components necessary to incorporate it on a Clearpath RoboticsTM Jackal (see Tsitsimpelis et al., 2021, for a more detailed description).
A single, miniature CeBr3 scintillator (SCIONIX, 2020) was used for γ-radiation detection, due its compact form factor, relatively high light output, competitive energy resolution, low intrinsic background and room temperature operation (Caunt, 2020). The detector is coupled to a 10-mm thick slot collimator made from lead, which covers the crystal via a 5-mm slit aperture. The 10-mm thickness of lead results in an attenuation of ∼90% for γ rays with energies of approximately 0.6 MeV. Figures 2A,B comprises schematic diagrams of the detector and collimator, respectively. The collimated detector is coupled to dedicated servo motors, constituting a gimbal that enables its field of view to be adjusted in terms of the horizontal axis (pan angle), the azimuthal axis (tilt angle) and rotation around its own axis (roll angle). Figure 2C depicts an isometric 3D drawing of the gimbal, with the axes of rotation highlighted for clarity.
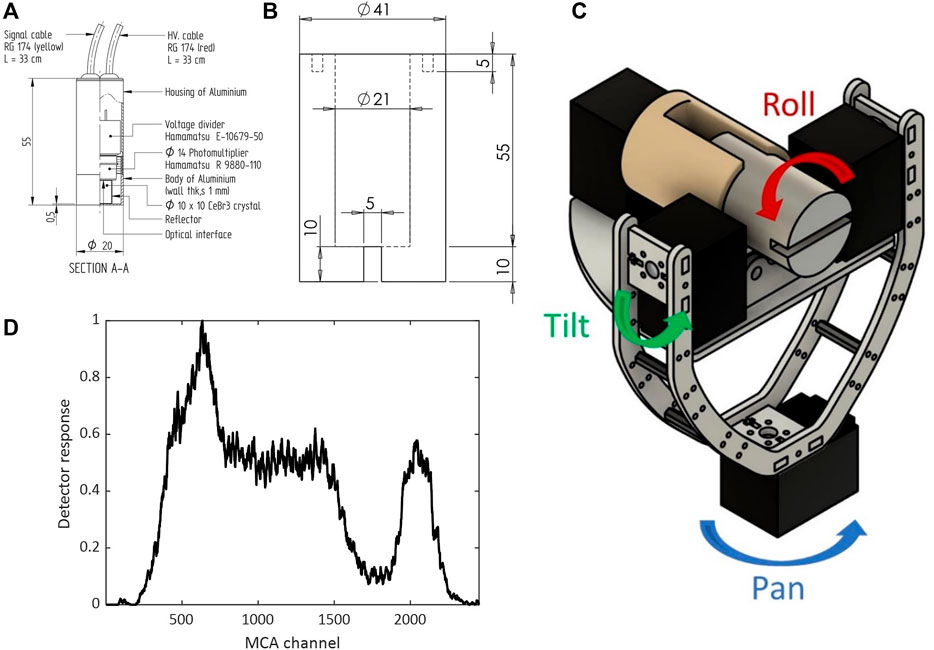
FIGURE 2. (A) A cross-sectional schematic diagram of the CeBr3 detector used for this research, dimensions are in mm where not indicated otherwise, (B) a plan view drawing of the lead collimator, (C) a diagram, in perspective, of the gimbal design developed in this research including the slot collimator at its center, (D) a corresponding a normalized γ-ray spectrum obtained with a 300 kBq 137Cs point source for the dataset presented in Sections 4.1–4.4, recorded with the aforementioned detector, over a 4-hour period.
The gimbal apparatus is controlled by the ubiquitous Robot Operating System (Quigley et al., 2009), within which custom code has been written to cause the motors to move to a set of pre-defined orientations. During this type of raster scanning routine, the MFA digitizer gathers spectroscopic information, whilst radiation counts that comprise the gross spectrum (not energy resolved) are collected for each measurement angle. Figure 2D depicts the associated spectra for the data presented in Sections 4.1–4.4, acquired over a four-hour period. The region around the characteristic 137Cs γ-ray photopeak at 662 keV, which mostly contributes to the sum of counts for each measurement angle when the exposed surface of the detection crystal is not facing the source, is depicted by ∼channel 2000 of the MFA’s Multi-Channel Analyzer (MCA).
3.2 Hardware description for the results presented in Section 4.5
To investigate energy-resolved responses, the processing hardware described above was replaced with a Red Pitaya STEMlab 125-14. Code was embedded to operate this unit as an MCA, and a portion of it was modified to facilitate communication directly to the ROS middleware. The STEMlab device has software and hardware characteristics that make it ideal for incorporation to robotic platforms, i.e., it has a very small footprint, is low cost, powered via USB and easily programmable. In its current version, it has been incorporated successfully to a Clearpath RoboticsTM Husky robot in collaboration with the Oxford Robotics Institute (ORI), and deployed twice recently at UKAEA (United Kingdom Atomic Energy Authority) (Robotics and AI for nuclear, 2021).
To produce the experimental results presented in Section 4.5, the hardware is instructed to gather a spectrum of the X-ray and γ-ray photon energies every second. These were accumulated iteratively during the experiment and reset for each measurement angle, thus producing a set of angular responses across a range of specific energy bands of interest.
4 Results
4.1 Analysis of raw data
Using the setup described in Section 3.1, the gimbal-detector apparatus was instructed to carry out a pan angle scan between 90° and −90° (corresponding to the left and right sides of the field of view of the detector). This was repeated for a set of different tilt angles, ranging between −90° and 90° (corresponding to the top and bottom sides of the field of view). The roll angle was fixed at an angle that forms a vertical slot collimation (rotated by 90° from the angle depicted in Figure 2D). The measurement intervals were set at 2o with 20-second gross counts between each other.
For the purposes of this analysis, we consider a scenario with minimum environmental complexity, i.e., comprising a 300 kBq 137Cs point source at the center of the scanning area of the detector, spaced apart by 20 cm when the collimated detector is at a pan angle of 0° (i.e., both isotope and location known a-priori). However, the short duration of each measurement relates to some extent with a real-world scenario, in the sense that the resulting dataset has structural features which are imparted by timing constraints in hazardous environments (predominantly noise).
An initial estimate of the location of the source based on the raw data can be derived simply by highlighting the datum with the highest count. As can be seen in the depiction of all pan angle sweep responses for this dataset, in Figure 3A, the maximum datum (highlighted by the red dot) is very close to the center as expected. However, there is a tilt offset of 6° relative to the known position, which could be attributed to measurement noise and/or source center misalignment (note that source and detector where aligned manually and hence a slight misalignment is feasible). It is also worth noting that the resulting image essentially reflects the shape of the collimator, having a cylindrical complexion with a slot that exposes part of the surface of the detector. Figure 3B is a 3-dimensional representation of the dataset, while Figure 3C depicts an isolated region of the dataset: the pan angle sweep response for a fixed tilt angle at 0°.
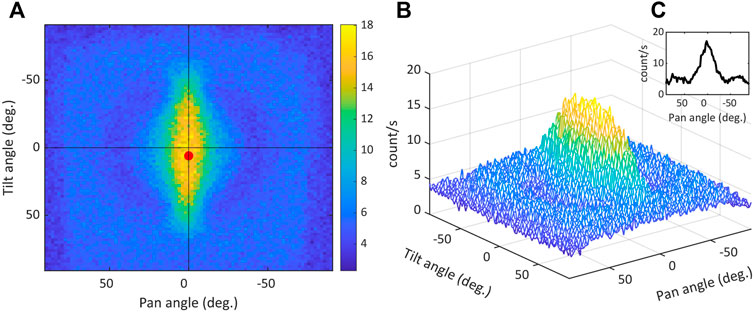
FIGURE 3. Measurements taken with the apparatus described in Section 3.1, including: (A) All angular responses or pan angle sweeps (90° to −90°) for fixed tilt angles ranging between −90° and 90°, with 2° measurement intervals; the where the cross indicates the center point of the measurement area and the red dot indicates the pan angle/tilt angle coordinate of the data point with the maximum value (B) A 3D representation of the dataset shown in (A), (C) Example angular response with the tilt angle fixed at 0°.
4.2 Applying the sinc transform to all angular responses
The data in Figure 4A show pan angle sweep response for a tilt angle of 0°, including measurement uncertainties, along with the model fit of Eq. 1 and associated 95% confidence interval. Here, the simulation output appears to underestimate the peak count magnitude, while the overall response deviates from the true shape of the observed side lobes, as well as the data ranging between approximately 40° to 25° and −25° to −40°. The coefficient of determination for the sinc model is RT2 = 0.92, while the
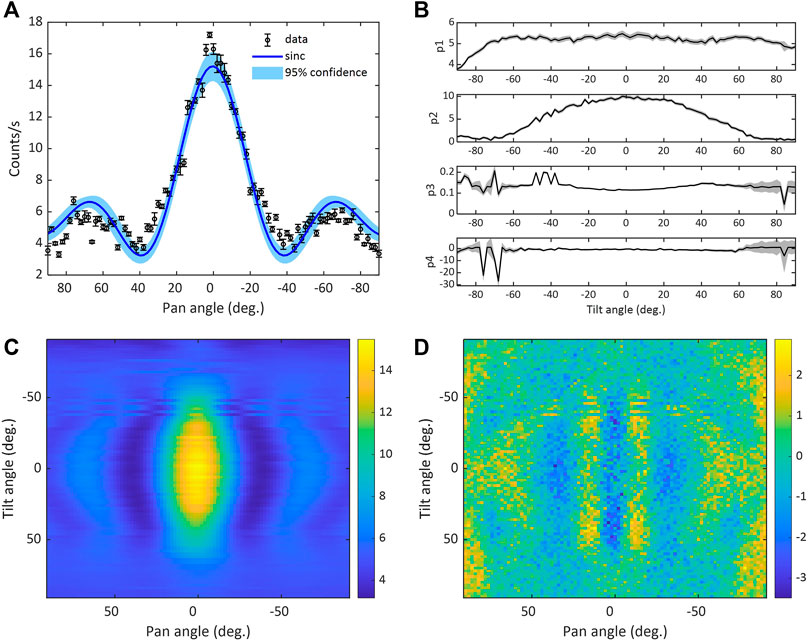
FIGURE 4. (A) The black circles correspond to the data from a single horizontal sweep with the tilt angle at 0° (with error bars representing measurement uncertainties), while the blue solid line is the fixed parameter sinc model response based on Eq. 1, and confidence bounds depicted by the blue shaded area, (B) Parameter p1 to p4 values for each horizontal sweep, as a function of tilt angle, estimated for the sinc function using the curve-fitting toolbox in MATLAB; with standard errors represented by grey shaded areas, (C) a 2D representation of all angular responses represented by sinc functions, utilizing the parameters estimated in Figures 4B, (D) a 2D representation of the fit residuals, by means of subtracting the data and model fit values.
Using the curve fitting toolbox in MATLAB™ (Version R2021b), the parameters in Eq. 1 have been optimized for each pan angle of the sweep response dataset depicted in Figure 3. Figure 4B depicts a quad plot of how the set of parameters
4.3 Applying the sinc transform with time varying parameters to all angular responses
To improve the performance of the sinc transform approach in the presence of more complex situations, greater flexibility of the model is required. This might aid applications, for example, where time constraints result in lower resolution data, increased noise is a problem and, importantly, to enable the analysis of data on the robotic platform in real time rather than being limited to post-processing. In this context, a time-variant approach is to map Eq. 1 to a DLR model, which has the following general structure:
where
where, for the present application, we propose
where
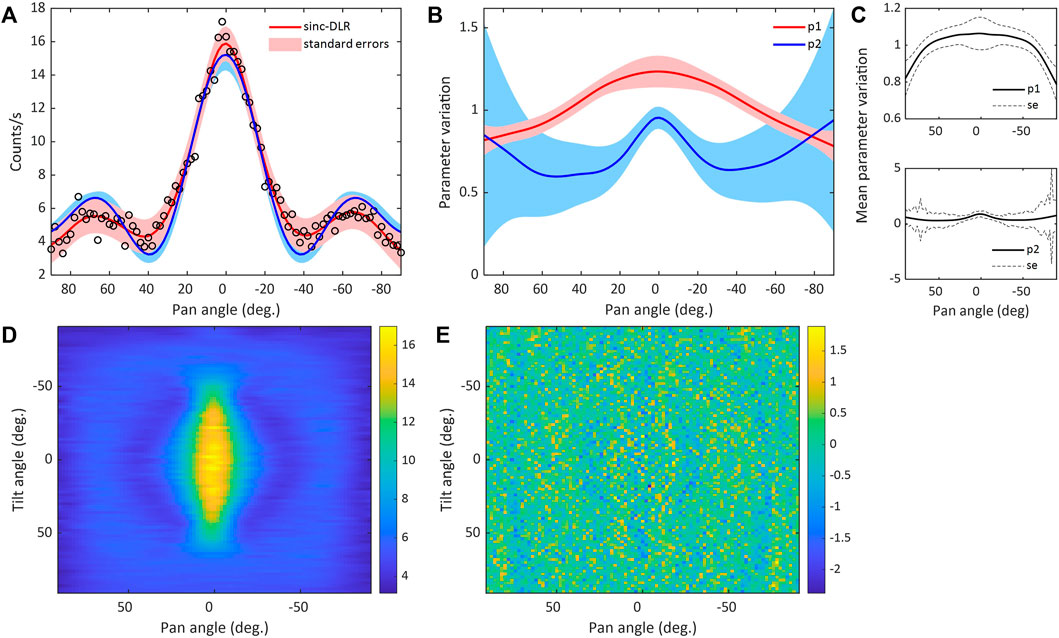
FIGURE 5. (A) Sinc-DLR model response based on Eq. 4 and standard errors, appended on raw data and sinc model response from Figure 4A, (B) Varying parameter values and associated standard errors for the sinc-DLR model response depicted in (A), (C) Mean parameter variation for all horizontal sweep sinc-DLR models, (D) a 2D representation of all angular responses represented by sinc-DLR functions based on Eq. 4, (E) a 2D representation of the fit residuals, by means of subtracting the data and model fit values.
Figure 6A displays the image of the raw data with the red, black and green dots highlighting the maximum datum based on the raw data, sinc, and sinc-DLR responses, respectively. As can be seen in the zoomed-in shot of Figure 6A, both the sinc and sinc-DLR functions yield a center offset of 2° tilt angle, with the latter indicating a 2° pan angle as well, while the simpler alternative obtained via the maximum datum of the raw data yields a 6° offset of tilt angle. Given the estimated error in the assumed center of the experiment (center of the black cross on Figure 6A) is ± 1° (17.45 mrad) in both vertical and horizontal planes, the location implied by the maximum datum of the raw data is off-center by 5°–7° (87.26–122.17 mrad) in the vertical plane and ± 1° (17.45 mrad) in the horizontal plane, while the maximum estimated by the sinc model is off center by 1°–3° (17.45–52.35 mrad) and ± 1° (17.45 mrad) in the horizontal plane; and the maximum estimated by the sinc-DLR model is off-center by 1°–3° (17.45–52.35 mrad) in both planes. In-situ, however, the metric of interest we might be consider is the area subtended from a surface in the vertical defined by a diameter between the known position of a source and that inferred by radiation localized from the source by a collimator system at a given stand-off distance. With this in mind and for example assuming a stand-off distance of 5 m, the reduction in the area achieved using the sinc formalism (2°) over the use of the maximum datum (6°) is one of 0.026–0.212 m2, respectively, corresponding to an improvement of 90%.
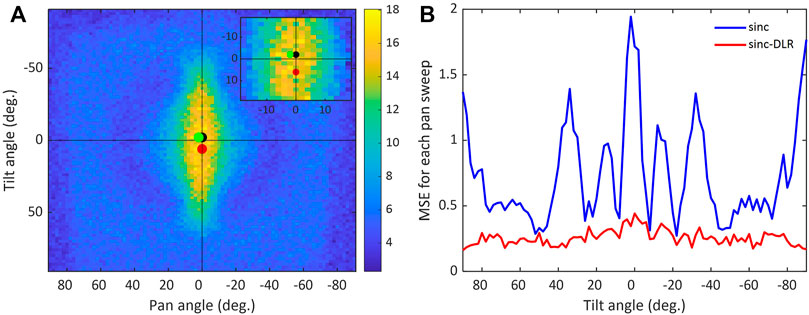
FIGURE 6. (A) Indications of the coordinates of the source on the original dataset, based on the raw data (red dot), the sinc function as expressed in Eq. 1 (black dot, behind green dot), and the sinc form of the DLR model, as expressed by Eq. 4 (green dot). (B) MSE for each angular response model fit over the full tilt angle range, using the sinc model (blue line) and the sinc-DLR model (red line).
As the sinc model yields an estimated set of coordinates closer to the assumed center of the location of the source than the sinc-DLR model and, given that manual placement of source and detector grants a slight misalignment, it does not necessarily mean that the latter performs worse. For example, apart from the aforementioned results, Figure 6B depicts the mean squared error (MSE) values of each horizontal angular response over the full tilt angle range, where the sinc-DLR MSE being consistently below 0.5 for the whole dataset, and does not exhibit the volatility of the sinc MSE; suggesting that the sinc-DLR model would perform better in more complex geometric scenarios. On the other hand, both model responses help reducing the influence of measurement noise which is inherent in the raw data.
4.4 Modelling based on subsampled data
As alluded to earlier, apart from dealing with measurement noise, a particular advantage of utilizing transform methods to explain the data mathematically is that it is possible to change the resolution of the model. For instance, in a real-world application it might not be feasible to scan every two degrees, and a lower resolution might be required to speed up the scanning process. Therefore, using the sinc formalism to describe angular measurements allows radioactivity to be localized with high resolution. To illustrate this, each horizontal sweep of the exemplar dataset has been subsampled to a 10° resolution. Based on this resolution, it is possible to estimate the varying parameters of a sinc-DLR model, utilize kernel interpolation to estimate the varying parameter values for the original data resolution, and essentially derive the model response down to a 2° resolution. The comparison of the model response yielded from the latter approach with that of the 2° sinc-DLR model is shown in Figure 7A, exhibiting negligible difference even though there was an approximately five-fold reduction of the available measurement points. Figure 7B displays the residual fits for all horizontal sweeps subsampled to 10° and expressed back to 2° using sinc-DLR models, suggesting an overall accurate capture of the dataset at its original 2° resolution.
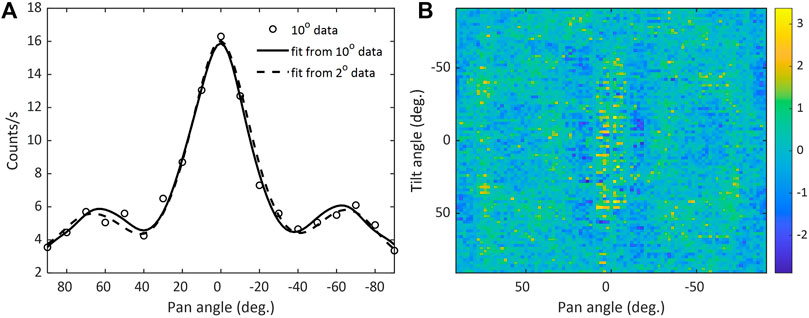
FIGURE 7. (A) A comparison of sinc-DLR models based on subsampled data (10°—black line) and original resolution data (2°- dashed line) data for a single horizontal sweep, and black circles depict the 10° subsampled data, (B) a 2D representation of the fit residuals, by means of subtracting the subsampled data and model fit values.
4.5 Modelling of energy-resolved angular responses
Using the hardware setup described in Section 3.2, the gimbal-detector apparatus was instructed to carry out a single, pan-angle scan between 90° and −90° with a tilt angle fixed at 0°. As for the previous experimental configuration, the roll angle was fixed at an angle so that the collimation is contrived of a vertical slot. The measurement intervals were set at 2° with 3-hour counts at each position, and separate spectra were generated for each measurement angle. The counts registered for each footprint of interest were extracted from each spectrum to derive the angular response. For this experiment, a sealed, 600 kBq 137Cs point source was placed at the center of the area scanned by the detector, 30 cm from the detector.
In this research, access to individual spectra for each measurement angle provides improved insight of the angular response in regions of interest associated with the X-ray and γ-ray peaks. To extract the information and formulate these energy-specific angular responses, a simple analysis is performed by summing the counts over a range of channels. A more complex analysis of the data needs to consider the associated gain-drift and background counts under each peak. As can be seen in Figure 8A, which depicts the spectra obtained from pan angles at −90° and 90°, the resulting drift is minute; as is to be expected given that the spectra are derived from symmetrical angles with the source at the center of the scan. Furthermore, the two spectra were taken ∼11 days apart, exhibiting the consistency and reliability of the processing electronics throughout the duration of the experiment. However, an overt drift is observed around the 662 keV region of interest (ROI), which is due to the angular deviation of the collimated detector from the centre of the source, as shown by the spectra in Figure 8B. To correct for the gain-drift, a Gaussian curve was fitted to the photopeak in each spectrum to derive the mean and, in turn, normalize each x-axis to the mean of the 0° photopeak. An additional stop was added where the chosen peak boundaries for the X-ray and photopeak in the 0° dataset were matched with the nearest in the rest of the spectra, ensuring they represent the same energy range. The background was corrected by fitting a straight line between the boundaries of each peak and performing an elementwise subtraction. The remaining curve was summed to determine the total, this being repeated for all X-ray and γ-ray peaks. Figure 8C shows the gain-drift corrected pulse height spectra generated for four different pan angles, with the spectrum resulting from the measurement with a pan angle of 0°, clearly showing the 137Cs X-ray at ∼32 keV, the lead X-ray at ∼72 keV, the backscattering peak at ∼180 keV, and the photopeak at 662 keV (corresponding channels on the MCA at 64, 150, 403 and 1351, respectively).
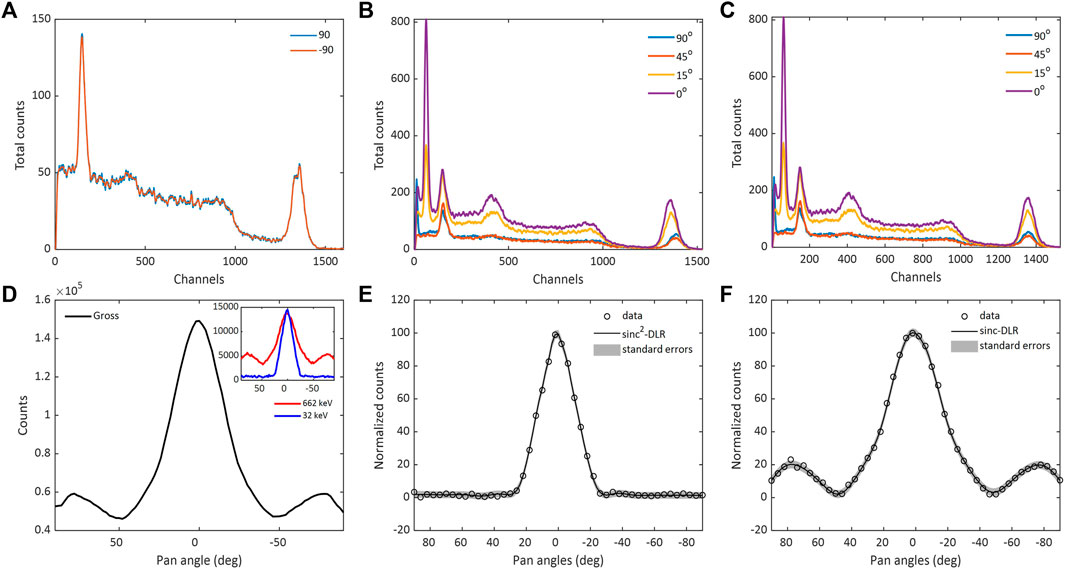
FIGURE 8. (A) Two spectra recorded with a 137Cs source, at the start of the experiment for pan angle −90°, and 11 days after for pan angle 90°, exhibiting almost zero drift. (B) Four spectra from the same experiment at a variety of angles, (with 0° being no angular deviation from the point source) showing how the gain-drift overtly occurs within the 662 keV ROI, (C) The same four spectra with gain-drift correction, (D) The angular response of the gross spectrum counts depicted by the black line, while the figure in-set depicts the derived angular responses for the 32 keV X-ray (blue line) and the 662 γ-ray photopeak (red line); both processed with gain-drift correction and background subtraction, (E) Data and sinc2-DLR model fit of the X-ray angular response, and standard errors, (F) Data and sinc-DLR model fit of the photopeak angular response.
From the individual spectra, the angular responses of specific peaks of interest were isolated. The gross spectrum angular response, as well as the angular responses stemming from the two analyses of the data described above are shown in Figure 8D. Both the X-ray and γ-ray results show a large peak at the center; the γ-ray data exhibit side lobes, whereas these are not present in the X-ray data, consistent with the greater attenuation of the lead for this latter, lower-energy case. Furthermore, the Full Width Half Maximum of the peak corresponding to the X-ray angular response is slightly better than that of γ ray (X-ray: 13%, γ ray: 19%), which is a potentially useful feature when resolving multiple sources and with regard to reducing uncertainty in localization. Figures 8E,F depict the X-ray and γ ray, respectively, data and model fits, and associated standard errors (which are significantly smaller due to the long measurement periods providing good statistical significance to the data). In the case of modelling the X-ray, squaring the sinc component of the sinc-DLR models suppresses the side lobes that are inherent on the higher-energy angular responses, and reduces the peak width. Both model fits are characterized by an excellent coefficient of determination at 0.99.
5 Discussion and future research
This article describes the application of a mathematical transform to parameterize the angular response of a collimated radiation detector and the ability to resolve in terms of energy and predict the location of contamination with increased spatial accuracy. Further, it highlights the potential to accommodate constraints associated with hazardous environments, such as low-resolution measurements and measurement noise. The exemplar dataset that was utilized for the results presented between Sections 4.1 and 4.4 comprised a scan of 8281 measurements with a total duration of ∼46 h. Within a robotic exploration framework this might appear initially as cumbersome for some applications (although feasible, if required, by means of, e.g., split scanning sessions). In this research however, its use as a benchmark shows that this computationally simple approach of mathematical modelling localizes the radiation hotspot accurately even when used on the subsampled equivalent of the 2° resolution dataset; and thus, provides a valuable means for interpreting data obtained in robotic exploration routines.
With regard to the raster scanning pattern that was chosen in this study, the vertical slot collimation was applied to minimize the field of view of the detector (in comparison to a horizontal slot) and thus to maximize its resolution capability in the horizontal plane. Carrying out 180 pan-angle scans at different tilt angles allows, in turn, the location of the source to be derived both in the horizontal and vertical planes. On the other hand, when considering the scan as a function of tilt angle, its resolution capability is minimized, which could have implications when multiple sources are present. Future research will address this by either alternating between a vertical and a horizontal slot (i.e., by changing the roll angle) for each angle of measurement, or utilizing two identical setups with one having vertical and the other having horizontal slot collimation.
Further advancing this model to incorporate angle variant parameters may also be useful in more complex scenarios. Within the context of this preliminary analysis, the latter model structure exhibits better prediction accuracy than the constant parameter sinc function, even in this simple controlled experiment. This suggests that similar models, such as state-dependent parameter models, where all the coefficients are optimized, may unlock yet further potential.
The discussion in Section 4.5 illustrated how energy-resolved angular responses might improve localization accuracy, as is evident for example by the sharp peak of the 32 keV X-ray emitted by the 137Cs source. In future research we will utilize sources with more complicated spectra comprising several lines, such as 152Eu, to evaluate whether localization performance can be improved by means of, for example grouping analysis. We will also investigate the performance of the models introduced in this work, corresponding to more realistic scenarios. For instance, by means of using multiple sources and varying the separation between them in three dimensions, as well as using dispersed quantities of radioactive contamination and different collimation geometries in simulation and experimental studies.
6 Conclusion
This paper describes the viability of transform-based modeling the angular responses of a collimated, directionally sensitive CeBr3 detector system. A sinc function has been utilized to fit a collection of angular responses at different azimuthal orientations, for a simple geometric scenario where a 137Cs point source location is known a-priori. The structure of this function has been embedded in a DLR model, enabling access to parameter estimation by means of Kalman filtering and fixed interval smoothing, facilitating a potentially useful avenue for future research concerning more complex environmental scenarios where clutter and dispersed sources are present. Finally, by acquiring a separate spectrum for each measurement angle, it has been possible to demonstrate how the shape of the response of this bespoke collimator-detector arrangement changes for X-rays and γ rays.
Data availability statement
The raw data supporting the conclusions of this article will be made available by the authors, without undue reservation.
Author contributions
IT and TA were the lead researchers on this study, performing the measurements and analysis, leading on the preparation of the manuscript. IT and JT construed the sinc-DLR rationalization. MJ conceived the research hypothesis and attracted the funding that enabled this research. MJ, JT, BL and FL supervised the team performing the experimental measurements and co-authored the manuscript. AW was part of the researcher team and co-authored the manuscript.
Acknowledgments
We acknowledge the financial support of the Engineering and Physical Sciences Research Council (EPSRC) via grants no. EP/V026941/1, EP/R026084/1 and EP/W001128/1. MJ acknowledges the receipt of a Wolfson Research Merit Award from the Royal Society. We acknowledge useful discussions with Alexander Miller.
Conflict of interest
The authors declare that the research was conducted in the absence of any commercial or financial relationships that could be construed as a potential conflict of interest.
Publisher’s note
All claims expressed in this article are solely those of the authors and do not necessarily represent those of their affiliated organizations, or those of the publisher, the editors and the reviewers. Any product that may be evaluated in this article, or claim that may be made by its manufacturer, is not guaranteed or endorsed by the publisher.
References
Abbas, M. I., and Noureddeen, S. (2011). Analytical expression to calculate total and full-energy peak efficiencies for cylindrical phoswich and lanthanum bromide scintillation detectors. Radiat. Meas. 46 (4), 440–445. doi:10.1016/j.radmeas.2011.01.017
Caunt, J. (2020). Cerium bromide. AvaliableAt: https://johncaunt.com/materials/cebr3/.
Gal, O., Izac, C., Jean, F., Lainé, F., Lévêque, C., and Nguyen, A. (2001). Cartogam - a portable gamma camera for remote localisation of radioactive sources in nuclear facilities. Nucl. Instrum. Methods Phys. Res. Sect. A Accel. Spectrom. Detect. Assoc. Equip. 460 (1), 138–145. doi:10.1016/S0168-9002(00)01108-6
H3D (2022). Industrial imaging spectrometer. AvaliableAt: https://h3dgamma.com/h100.php.
Hughes, K., and Cracknell, E. (2011). “Gamma-ray imaging for generating 3D dose rate maps,” in ASME 2011 14th International Conference on Environmental Remediation and Radioactive Waste Management, Parts A and B, September 25–29, 2011 (Reims, France: ICEM), 221–225. doi:10.1115/ICEM2011-59123
Joyce, M. J., Gamage, K. A. A., Aspinall, M. D., Cave, F. D., and Lavietes, A. (2014). Real-time, fast neutron coincidence assay of plutonium with a 4-channel multiplexed analyzer and organic scintillators. IEEE Trans. Nucl. Sci. 61 (3), 1340–1348. doi:10.1109/TNS.2014.2313574
Klann, R. T., Lou, Q., and Fink, C. L. (2006). Angular response functions for sodium iodide detectors. IEEE Nucl. Sci. Symposium Conf. Rec. 2 (1), 1224–1228. doi:10.1109/NSSMIC.2006.356065
Magwood IV, W. D., Creswell, L., Gauntt, R., McCree, V. M., Weightman, M., Muroya, N., et al. (2021). Fukushima Daiichi nuclear power plant accident. NEA--7558. doi:10.1787/124c2774-en
Martin, H., Watson, S., Lennox, B., and Poteau, X. (2018). Miniature inspection robot for restricted access exploration (MIRRAX). Phoenix, AZ: Waste Management Symposia.
Miller, A., Machrafi, R., and Mohany, A. (2015). Development of a semi-autonomous directional and spectroscopic radiation detection mobile platform. Radiat. Meas. 72, 53–59. doi:10.1016/j.radmeas.2014.11.009
Nancekievill, M., Jones, A. R., Joyce, M. J., Lennox, B., Watson, S., Katakura, S., et al. (2018). Development of a radiological characterization submersible ROV for use at Fukushima Daiichi. IEEE Trans. Nucl. Sci. 65 (1), 2565–2572. doi:10.1109/TNS.2018.2858563
Nuvia tech Instruments (2022). Portable spectrometric gamma imaging system. AvaliableAt: https://www.nuviatech-instruments.com/product/nuhp-nuvision/.
Quigley, M., Conley, K., Gerkey, B., Faust, J., Foote, T., Leibs, J., et al. (2009). Ros: An open-source robot operating system. Kobe, Japan: IEEE.
Robotics and AI for nuclear (2021). Robotics and AI for nuclear - year three report. AvaliableAt: https://rainhub.org.uk/about/annual-reports/.
SCIONIX (2020). Scintillation detectors. AvaliableAt: https://scionix.nl/scintillation-detectors.
Taylor, C. J., Young, P. C., Tych, W., and Wilson, E. D. (2018). New developments in the CAPTAIN Toolbox for Matlab with case study examples. IFAC-PapersOnLine 51 (15), 694–699. doi:10.1016/j.ifacol.2018.09.202
Tsitsimpelis, I., Taylor, C. J., Lennox, B., and Joyce, M. J. (2019). A review of ground-based robotic systems for the characterization of nuclear environments. Prog. Nucl. Energy 111, 109–124. doi:10.1016/j.pnucene.2018.10.023
Tsitsimpelis, I., West, A., Licata, M., Aspinall, M. D., Jazbec, A., Snoj, L., et al. (2021). Simultaneous, robot-compatible γ-ray spectroscopy and imaging of an operating nuclear reactor. IEEE Sensors J. 21 (4), 5434–5443. doi:10.1109/JSEN.2020.3035147
West, A., Tsitsimpelis, I., Licata, M., Jazbec, A., Snoj, L., Joyce, M. J., et al. (2021). Use of Gaussian process regression for radiation mapping of a nuclear reactor with a mobile robot. Sci. Rep. 11, 11. doi:10.1038/s41598-021-93474-4
Keywords: radiation localization, nuclear instrumentation, mathematical modeling, characterization, collimated detector, angular response analysis
Citation: Tsitsimpelis I, Alton TL, West A, Taylor CJ, Livens FR, Lennox B and Joyce MJ (2022) Improved localization of radioactivity with a normalized sinc transform. Front. Nucl. Eng. 1:989361. doi: 10.3389/fnuen.2022.989361
Received: 08 July 2022; Accepted: 24 August 2022;
Published: 14 September 2022.
Edited by:
Marco Caresana, Politecnico di Milano, ItalyReviewed by:
Nabil Menaa, European Organization for Nuclear Research (CERN), SwitzerlandNima Ghal-Eh, Ferdowsi University of Mashhad, Iran
Copyright © 2022 Tsitsimpelis, Alton, West, Taylor, Livens, Lennox and Joyce. This is an open-access article distributed under the terms of the Creative Commons Attribution License (CC BY). The use, distribution or reproduction in other forums is permitted, provided the original author(s) and the copyright owner(s) are credited and that the original publication in this journal is cited, in accordance with accepted academic practice. No use, distribution or reproduction is permitted which does not comply with these terms.
*Correspondence: Ioannis Tsitsimpelis, aS50c2l0c2ltcGVsaXMzQGxhbmNhc3Rlci5hYy51aw==
 Ioannis Tsitsimpelis
 Tilly L. Alton1
 Andrew West
 C. James Taylor
 Barry Lennox