 Jennifer Yao1*
 Shalini Tripathi1
 Bruce K. McNamara1Nabajit Lahiri1
 Shawn L. Riechers1
 Sayandev Chatterjee2
 Dallas D. Reilly1Eugene S. Ilton1
 Edgar C. Buck1*
- 1Pacific Northwest National Laboratory, Richland, WA, United States
- 2TerraPower LLC, Bellevue, WA, United States
Introduction: This study aims to develop a microgram-scale microfluidic electrochemical cell (E-cell) for investigating the redox behavior of uranium oxide (UO2). The traditional bulk electrochemical methods may require shielded facilities to investigate the hazardous materials, e.g., spent nuclear fuel, due to high radiation levels. Microfluidic E-cells offer advantages such as reduced radiation exposure, control over fluid flow rates, and high-throughput capabilities.
Methods: The design of the E-cell considers electrode morphology, adhesion to a thin membrane, electrode configuration, and vacuum compatibility. Three techniques, including FIB-SEM lift-out, Au coating, and polyvinylidene fluoride (PVDF) binder, are explored for fabricating and attaching microgram quantities of UO2 as working electrodes. The PVDF binder method proves to be the most effective, enabling the creation of a vacuum-compatible microfluidic E-cell.
Results and discussion: The PVDF binder method demonstrates successful electrochemical responses and allows for real-time monitoring of UO2 electrode behavior at the microscale. It offers chemical imaging capabilities using in situ SEM/EDS analysis. The technique provides consistent redox outcomes similar to bulk electrochemical analysis.
Conclusion: The development of a microgram-scale microfluidic electrochemical cell using the PVDF binder technique enables the investigation of UO2 redox behavior. It offers a low-risk approach with reduced radiation exposure and high-throughput capabilities. The technique provides real-time monitoring and chemical imaging capabilities, making it valuable for studying spent nuclear fuel systems and material characterization.
1 Introduction
The release of most radionuclides from spent nuclear fuel (SNF) under long-term geologic repository conditions is mainly controlled by the rate at which the uranium oxide (UO2) fuel matrix oxidizes and dissolves (Bruno and Ewing, 2006; Ewing, 2015). Therefore, it is crucial to understand the redox behavior of UO2 inside a failed waste container. However, conducting experiments on bulk amounts of SNF can be costly due to the need for shielded hot cell facilities to protect researchers from the intense β/γ radiation field. If the amount of SNF used in a single test could be significantly reduced, conducting electrochemical experiments outside a shielded facility might be possible. Bulk electrochemical methods have yielded critical information on the redox behavior of UO2 under various conditions (Shoesmith, 2000; Sunder et al., 2004). More specifically, 238UO2 working electrodes (WEs) have been well-studied in traditional 3-electrode E-cells (Shoesmith et al., 1994; King and Shoesmith, 2004). The dimensions of typical UO2 WEs in prior studies are ∼1.50 cm2 by 1.5 mm thick. The mass of the UO2 electrode in such an E-cell is approximately 2.5 g (Sunder et al., 1981; Shoesmith et al., 1984; King et al., 1999). Consequently, if highly radioactive material is incorporated into these WEs, such as Pu and/or fission products from SNF, the radiation dose would rapidly rise to hazardous levels. In this paper, we describe several different approaches we used to develop a microfluidic E-cell that uses microgram quantities of UO2 as the WE and that also allows for in situ chemical imaging capabilities. Our goal is to provide a versatile approach and risk of exposure to hazardous radioactive materials when investigating the electrochemical properties of spent nuclear materials.
Microfluidic E-cells have several advantages over traditional electrochemical cells that go beyond reducing the radiation dose, including the ability to control fluid flow rates and to perform high-throughput experiments due to the small sample volumes. These features make microfluidic E-cells valuable for a variety of applications, including drug discovery (Sanjay et al., 2018), environmental monitoring (Marle and Greenway, 2005), and biochemical analysis (Mehling and Tay, 2014). Furthermore, an in situ microfluidic cell has additional advantages in that it can be utilized to gain chemical and morphological information using vacuum-based analytical techniques (Gallaway et al., 2010; Yao et al., 2017; Yao et al., 2020).
Designing a microfluidic electrochemical cell that is compatible with vacuum-based analytical instruments requires careful consideration of several factors, including the morphology and conductive properties of the WE (e.g., UO2) to be studied and its adhesion to the underside of an ultrathin detection window (a 50-nm-thick Si3N4 membrane in this study), the electrode configuration, and the vacuum compatibility of the E-cell after it is loaded with testing solution. The main differences among the three designs we tested are the techniques for fabricating and attaching the WE to the Si3N4 membrane.
Electrodes can be fabricated using a variety of techniques, such as screen printing (Suresh et al., 2021), inkjet printing (Moya et al., 2017), or electrodeposition (Choi et al., 1998). However, those techniques are unsuitable for making an electrode that must be firmly attached to the thin Si3N4 membrane without damaging the membrane. The primary issue with the former two methods is the potential damage to the Si3N4 membrane during the printing process. The challenge associated with the electrodeposition method is achieving sufficient adhesion strength. The adhesion strength between the electrode and the substrate can vary based on factors like electrodeposition process parameters, substrate surface properties, and electrode material. Moreover, electrodes produced through this method may demonstrate durability limitations when subjected to extended electrochemical experiments, including multiple cyclic voltammetry (CV) scans and prolonged periods of electrochemical corrosion. Instead, we tested WEs composed of micro-sized UO2 lift-outs or microgram quantities of UO2 particles.
2 Materials and methods
2.1 Electrode fabrication methods and E-cell assembly
2.1.1 FIB-SEM lift-out method for producing an intact UO2 electrode
Sections of UO2 up to nearly 120 µm in length, 12 µm wide, and 3 µm thick were produced by gallium (Ga) ion milling on an FEI Helios 660 FIB-SEM (see Figure 1B). The backscattered electron (BSE) images exhibit some channeling contrast enabling the large ∼15-µm-diameter grains, typical of nuclear fuels, to be seen. It was not possible to increase the width of the section without an excessive amount of trenching. The sections remained sufficiently sturdy to be welded to the bottom of the Si3N4 detection window in contact with an Au conductive path (Figure 1A). The sections were polished in the ion beam to reveal the grain structure of the UO2. The Au conductive path was created using a silver (Ag) wire attached with conductive epoxy. The Ag wire was used to connect to the electrochemical analyzer cable designated for the WE. The ion beam welding had to be performed extremely carefully, as any damage to the window membrane would result in a solution leak during the in situ chemical mapping (e.g., SEM) and electrochemical measurement. Figure 1A illustrates the FIB-SEM lift-out process schematically, and Figure 1C displays the relative location of the UO2 lift-out on the bottom of the Si3N4 window membrane after welding.
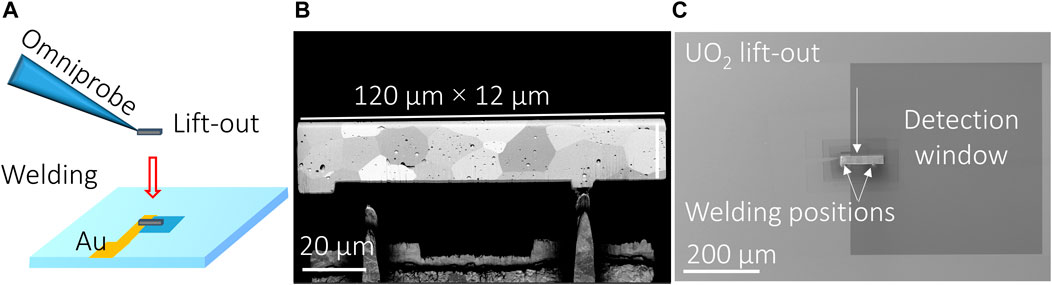
FIGURE 1. (A) Schematic of the FIB-SEM lift-out method, (B) SEM-BSE image of UO2 lift-out and its dimensions, and (C) the UO2 lift-out electrode and its relative location on the bottom of the Si3N4 window membrane after welding.
2.1.2 Au-coating method for particle electrode fabrication
The second method used UO2 particles to make the WE. The advantages compared to the lift-out method include 1) the ability to make mechanical mixtures of different materials (e.g., 238UO2 + 233UO2 to investigate the effect of α radiation on UO2 corrosion) (Yao et al., 2022) faster sample preparation for increased throughput. How to attach the particles to the detection window is a challenge. One solution was to apply an additional Au layer on top of the UO2 particles after they were deposited on the bottom of the Si3N4 window: 1 µL of DI water containing 10 µg UO2 particles was deposited onto the center of the detection window and dried. Then a 5-nm-thick gold layer (1 mm × 1 mm) was sputter-coated on top of the deposited UO2 using a sputter coater (Cressington 208) (Figures 2A, B). The current of the sputter coater was set to 20 mA, and the desired thickness was set to 5 nm. This Au layer served as the “glue” to attach the UO2 particles to the detection window, and it also provided good conductivity for electron transfer between the UO2 particles and permeability to the electrolyte due to the porous structure of the Au coating layer (Zhang and Olin, 2014; Mantel et al., 2018). Figure 2C displays the optical image of the WE from the top of the detection window.
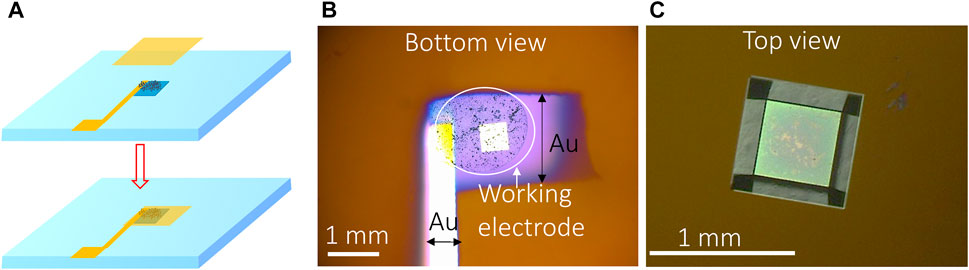
FIGURE 2. (A) Schematic of the Au-coating method for making particle-based WE, (B) optical image of particles attached on the bottom of the Si3N4 membrane by gold coating, and (C) top view of the detection window containing particle-based WE.
2.1.3 PVDF method for particle electrode fabrication
This method utilizes a blend of polyvinylidene fluoride (PVDF) and carbon black (CB) dissolved in the solvent N-methyl-2-pyrrolidone (NMP) to create a conductive composite electrode by binding the particles together. This binder material (PVDF/CB/NMP) was chosen for its exceptional resistance to high electrochemical potentials and its durability in facilitating electron transfer over an extended period (Li et al., 2016; Ram et al., 2020). The porosity of PVDF/CB/NMP also ensures that the electrolyte can make contact with the UO2 particles, and its long-lasting properties were particularly suitable for conducting extended testing. To create the UO2 WE, a slurry containing 8 mg/mL UO2 was prepared by mixing PVDF and CB in NMP solvent (Figure 3A). Then, 1 µL of the slurry was deposited onto the bottom of the Si3N4 membrane, forming the UO2 WE after the NMP solvent evaporated in the vacuum bell (Figures 3B, C). More details on this fabrication procedure can be found in our previous work (Yao et al., 2022).
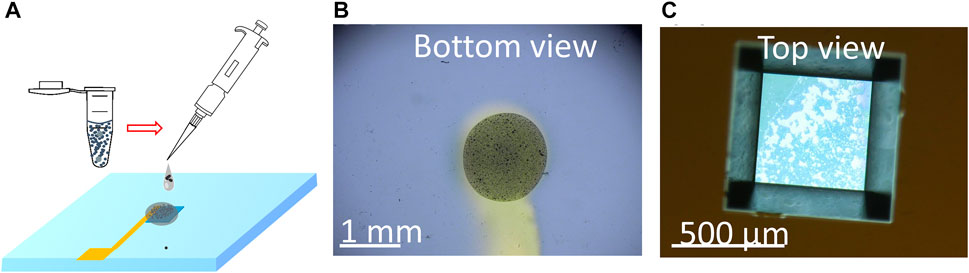
FIGURE 3. (A) Schematic of the process of drop casting the particles mixed with PVDF/CB/NMP to form the UO2 composite electrode and optical images of the composite electrode from the bottom view (B) and top view (C).
2.1.4 Microfluidic E-cell assembly
The vacuum-compatible E-cell used in this work has three electrodes, the WE, which consists of particles or the solid lift-out, the platinum (Pt) wire reference (RE), and the counter (CE) electrodes. The Pt wire (obtained from Alfa Aesar) was cut to lengths of 3–4 cm and inserted into a polydimethylsiloxane (PDMS) reservoir. An approximately 3-mm segment of each Pt wire was used as the RE or CE. No polish is needed for an RE or a CE made of platinum wire due to the original smooth surface of the wire. The top of the E-cell is a Si frame (7.5 mm × 7.5 mm × 200 µm) with the detection window (0.5 mm × 0.5 mm) in the center. The bottom of the Si frame was covered entirely by a 50-nm-thick X-ray- and electron-transparent Si3N4 membrane (Norcada, NX7050A). The Si3N4 membrane was coated with 10 nm titanium and 30 nm Au films sequentially using a sputter coater (Cressington 208) to form a conductive path before the attachment of the WE. An important component of this novel E-cell is the WEs are in contact with the underside of the detection window, thereby allowing in situ microstructural analysis and chemical mapping. The bottom of the Si3N4 membrane was bonded to the PDMS reservoirs (2 mm × 3 mm × 1.5 mm to form the seal (Figure 4). The seal was created using oxygen plasma treatment, which helped form strong covalent bonds (Si-O-Si) between the Si3N4 membrane and the PDMS (Borók et al., 2021). In addition, the PDMS reservoir was outfitted with two Teflon tubes that functioned as inlet and outlet solution flow paths and were connected by the polyether ether ketone (PEEK) union. This connection allows the E-cell to form an enclosed system and withstand vacuum-based instrumental analysis. The E-cell components were assembled following the fabrication procedure reported previously (Yao et al., 2022).
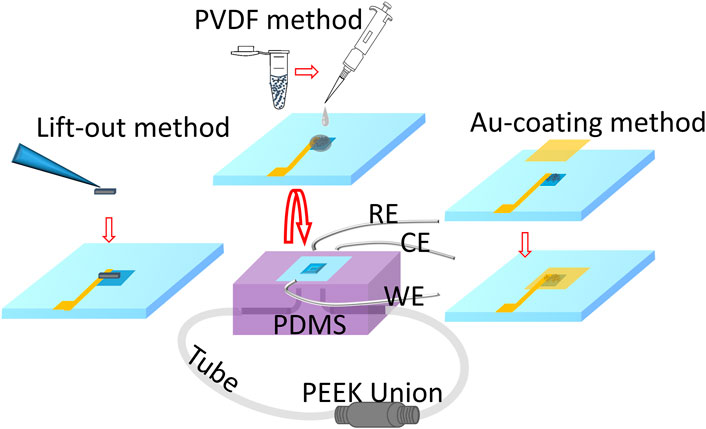
FIGURE 4. Schematic illustrating the incorporation of each WE-attached Si3N4 membrane prepared by three different methods to the main structure of the microfluidic E-cell. The WE-attached Si3N4 membrane supported by the Si frame was flipped over, and the bottom of the membrane was bonded with the E-cell main structure consisting of PDMS and wires that were used to connect to the RE, CE, and WE electrical cables separately.
2.2 Analysis methods
2.2.1 Electrochemical measurement
The electrochemical behavior of the UO2 WE was studied using a CH Instruments Model 600E electrochemical workstation. Cyclic voltammetry (CV) was employed to analyze the redox behavior of the WE. Its redox response was confirmed by cycling the potential of the UO2 WE and measuring the resulting current. Blank controls were performed for each test. The voltage scan range for measurements on electrodes prepared using the lift-out and Au-coating techniques is −1.0 V–1.0 V vs. Pt RE, while for the PVDF method, it is −1.2 V to 0.3 V vs. Pt RE. All CV scans were conducted at a scan rate of 20 mV/s. In addition, voltammograms of control materials were collected for comparison. For the first two methods, the control material consisted of an Au film, which also served as the conductive path. In the PVDF method, the control material was an electrode made of PVDF, carbon black, and NMP solvent deposited on the Au film without UO2 incorporation.
2.2.2 In situ SEM/EDS
The UO2-attached E-cell was introduced into an FEI Quanta SEM equipped with an EDS (EDAX Inc., Mahwah, NJ) compositional analysis system. Less than 100 µL of the electrolyte was injected into the microfluidic E-cell before being mounted onto the SEM stage. Secondary electron (SE) images and BSE were acquired under high vacuum during in situ imaging and EDS analysis. The accelerating voltage and current were set to 10–20 keV and 0.11 nA, respectively. Images were acquired at different magnifications to show morphology before and after electrochemical reactions of the UO2 WE. The vacuum was kept at ∼1 × 10⁻⁵ torr during measurement. EDS was used to acquire elemental information on the electrode surface, with the collection time set to 100 s.
2.3 Chemicals and materials
The lift-out was cut from sintered UO2 pellets acquired from Framatome (Richland, WA). The UO2 particles were obtained by grinding a single crystal of UO2. The PVDF/CB/NMP method uses UO2 particles, PVDF (Alfa Aesar), CB (TIMCAL, Graphite & Carbon Ltd.), and NMP (solvent, Sigma-Aldrich) to form the paste for drop casting.
All chemicals were reagent grade or better. The electrolyte, 0.1 M KNO3 (Sigma Aldrich), was prepared to separately test the performance of the UO2 WEs made by lift-out and Au-coating techniques. A second electrolyte, NaClO4 (Sigma Aldrich), was used to benchmark the results against the bulk analysis as reported by Shoesmith’s group (Sunder et al., 1996; Sunder et al., 1998). The 0.1 M NaClO4 solution was adjusted by an aqueous NaOH solution (Sigma-Aldrich) to pH 9.5 and applied in the PVDF method-related testing. The electrolytes were purged with N2 at least 30 min prior to being loaded into the E-cell.
3 Results and discussion
First, we applied focused ion beam scanning electron microscopy (FIB-SEM) to cut a micro-sized UO2 piece and weld it onto the Si3N4 window membrane to form the WE. This process was very delicate, requiring attention to detail during each fabrication step. Alternatively, utilizing UO2 particles instead of regular geometric-shaped electrodes provides flexibility in fabricating electrodes that vary in quantity, materials, and dimension. Similar to the FIB-SEM approach, the primary consideration is how to adhere the UO2 particle electrode onto the detection window without breaking the ultrathin window membrane. The materials that help attach the UO2 particles to the detection window should be chemically inert, permeable, and electron conductive; otherwise, the accuracy of the electrochemical measurement would be significantly affected (Son et al., 2021a; Son et al., 2021b). In this regard, we tried two approaches, including the gold (Au) coating and a PVDF binder. We found that composite PVDF UO2 particle electrode was the most efficient and effective way of producing a vacuum-compatible, particle-attached microfluidic electrochemical cell (PAMEC). This development paves the way for investigating microgram amounts of SNF. More generally, the PAMEC design offers a promising approach for multimodal chemical mapping combined with real-time electrochemical measurements of hazardous materials.
3.1 FIB-SEM lift-out method
The equiaxial grain structure of the UO2 was well preserved in the lift-out section, as shown in Figure 1B. The 120-µm-long section contained about 20 individual grains with intact grain boundaries. The redox properties and chemical/morphological response of the UO2 lift-out WE were characterized using an operando electrochemical analyzer combined with in situ SEM/EDS. Figure 5 compares the cyclic voltammograms of the UO2 lift-out WE in 0.1 M KNO3 (red) and the 0.1 M KNO3 blank control (black) using a scan rate of 20 mV/s. Two well-resolved cathodic peaks (Ic, IIc) were observed at 0.13 V and −0.35 V vs. Pt RE. However, these peaks are likely the result of redox reactions from the background electrolyte rather than electron transfer from the WE, as two similar cathodic peaks were observed in the 0.1 M KNO3 blank control. This suggests that the single micro-sized UO2 lift-out is not a viable WE, possibly due to insufficient current sensitivity. Nonetheless, the E-cell withstood the vacuum condition and allowed in situ SEM/EDS chemical mapping of the WE during the electrochemical measurement (Figure 6).
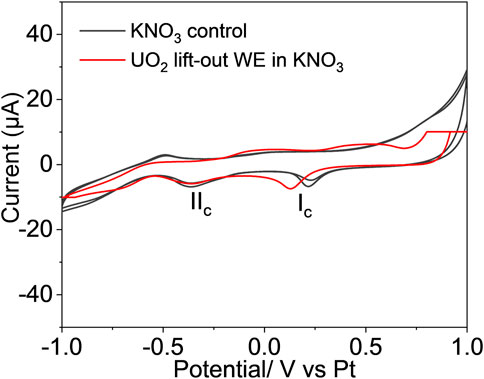
FIGURE 5. The cyclic voltammogram of UO2 WE prepared by the FIB-SEM method (red) was compared to the voltammogram of 0.1 M KNO3 blank control (black), scanned at 20 mV/s.
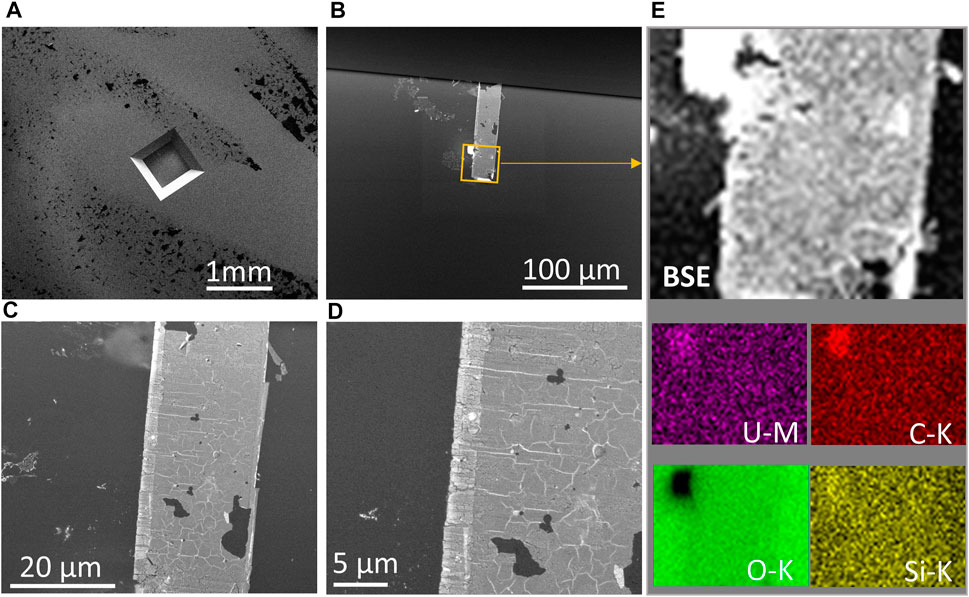
FIGURE 6. (A) In situ liquid E-cell SE image showing corroded UO2 lift-out beneath the Si3N4 detection window. (B) BSE image showing the location of the UO2 lift-out electrode underneath the detection window. (C,D) High magnification views of the UO2 electrode showing a corrosion rind at one side and oxidation through the grains and along the grain boundaries based on the BSE contrast in these regions. (E) Elemental EDS maps of the electrode validate the effective attachment of UO2 even after oxidative dissolution.
In contrast to the initial UO2 lift-out in Figure 1B, BSE images of the attached UO2 lift-out WE after electrochemical measurement clearly show a corrosion rind at one side and oxidized grain boundaries (see Figures 6C, D). Elemental EDS mapping on the portion of UO2 WE verified the effective attachment of the UO2 lift-out after corrosion (Figure 6E). Figure 6A demonstrates that the detection window with a UO2 WE attachment withstood the vacuum during in situ SEM/EDS analysis. Figure 6B shows the location of the UO2 lift-out from the top view of the detection window and the area selected for EDS mapping (Figure 6E).
Although we were able to observe microstructural changes in the lift-out WE while it was in solution with in situ SEM/EDS chemical imaging, the sensitivity of this method requires improvement. Furthermore, the preparation process is time consuming and requires high proficiency in FIB-SEM. Nevertheless, our experience and the promising results gained from this approach provided valuable insights for our subsequent attempts using particle-attached WEs.
3.2 Au-coating method
To overcome the low response of the single lift-out WE, we tested a WE made of micro-sized particles. Figure 7 displays the cyclic voltammograms of the freshly prepared UO2 WE (solid red line) and the same electrode after several CV scans (dashed red line). The blank control containing 0.1 M KNO3 is given by the black line. Two well-resolved oxidation peaks (Ia and IIIa) and three reduction peaks (Ic, IIc, and IIIc) were observed for the freshly prepared UO2 WE in 0.1 M KNO3. The Ia peak at −0.22 V and the IIIc peak at −0.58 V versus the Pt (RE) were only seen in the voltammograms of the E-cell with the UO2 WE (both solid and dashed red lines). Peak Ia corresponds to U (IV) to U (V) oxidation, and peak Ic records the corresponding reduction of U (V) to U (IV), which is in good agreement with prior bulk analysis (Mishra et al., 2016). The amplitudes (i.e., current) associated with Ia and Ic decreased after multiple cyclic sweeps (<20 cycles), suggesting a loss in the concentration of electroactive species, which equates to loss or depletion of UO2 particles during the electrochemical measurements. In contrast, the current intensity of the redox process IIIa and IIIc remained approximately the same before and after multiple CV runs. In fact, the reduction process marked as IIIc is also observed in the 0.1 M KNO3 solution control and is, therefore, attributed to the blank. Consequently, the corresponding IIIa oxidation is attributed to the U in the WE interacting with the NO3− ions/solvent in the blank to undergo a U-assisted reversible redox process. A similar tendency of actinide ions to participate in reversible redox chemistry in the presence of NO3− ions/solvent and facilitate actinide-assisted solvent oxidation was observed for an NpO22+ system, albeit at higher potentials and in bulk solutions (Chatterjee et al., 2017).
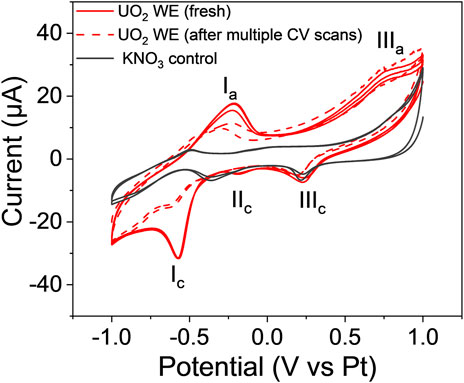
FIGURE 7. Cyclic voltammogram of the fresh UO2 WE (the solid red line) and the voltammogram after multiple CV scans (the dashed red line), compared to the voltammogram of 0.1 M KNO3 blank control (solid black line) at 20 mV/s.
The process IIc is observed in the fresh UO2 sample but disappears after multiple CV scans. A similar process is observed in the 0.1 M KNO3 control, although the process is shifted to a more positive redox potential. While the exact nature of the IIc process is unknown, it is attributed to the blank electrode being perturbed by the UO2 electrode and presumably overlaps with the bulk process as the UO2 particles are depleted or lost due to insufficient attachment during the course of the electrochemical measurements.
SEM imaging indicates that the decrease in Ia and IIIc amplitudes is due to the loss of UO2 particles during the electrochemical measurements. Figure 8 displays BSE images of the intact Au-coated UO2 WE (Figure 8A) and the WE after the CV scans (Figure 8B). The black area marked by the red circle is an example of areas where both UO2 particles and Au coating were removed. The loss of the UO2 mass resulted in a decrease in the current intensities associated with the UO2 redox process, as shown in Figure 7.
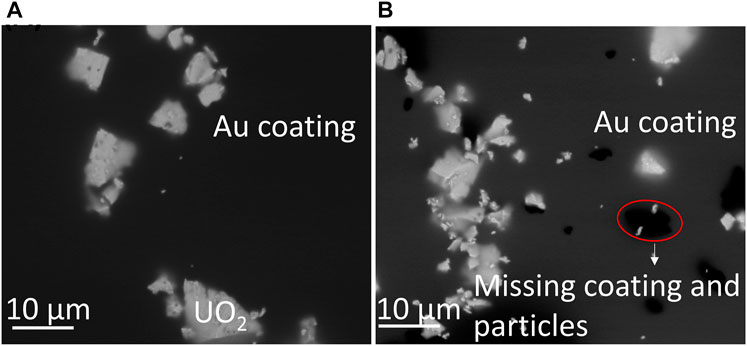
FIGURE 8. BSE images of the UO2 WE prepared by the Au-coating method display the distribution of the fresh WE (A), and (B) the missing particles and partial Au-coating after CV scans, marked by a red circle to show an example.
This approach has confirmed that a WE made of particles is suitable for examining the electrochemical properties of UO2 while highlighting the need to improve the method for attaching the particles to the detection window. The results prepared the way for the successful creation of our patented particle-attached microfluidic electrochemical cell (PAMEC) (Yao and Buck, 2021).
3.3 PVDF method
The adherence of the particle-attached WE to the Si3N4 detection window of the E-cell was greatly enhanced using the conductive PVDF/CB/NMP binder. This method led to the invention of the PAMEC. The PAMEC was loaded with 0.1 M NaClO4 (pH = 9.5). Figure 9A displays the cyclic voltammograms of the UO2 WE while cycling the potential from −1.2 V to 0.3 V and reversing the scan from 0.3 V to −1.2 V vs. Pt RE at a scan rate of 20 mV/s. Multiple sweep segments were conducted to understand the chemical and electrochemical reversibility of the redox processes. The cyclic voltammograms totaling 40 sweep segments of the UO2 WE were compared to the blank control (0.1 M NaClO4). The results showed an oxidation process (Ia) in the forward sweep and one prominent reduction peak (Ic) in the reverse sweep. The peak (Ic) can be attributed to the reduction of films formed on the UO2 surface during anodic oxidation (Ia). A similar process was observed by Sunder et al. (Sunder et al., 1998; Sunder et al., 2004). The potential of Ic increases from −0.91 V to −0.83 V, as does the cathodic current during the subsequent scans, which we attribute to an increase in the concentration of dissolved uranium species produced during oxidation.
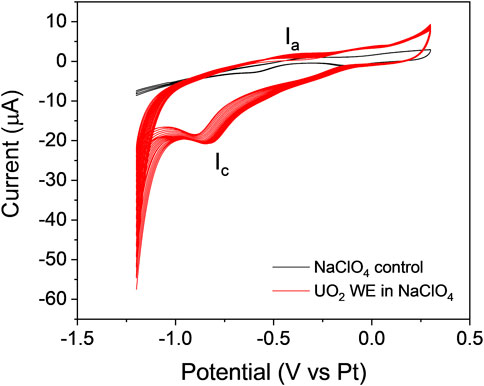
FIGURE 9. Cyclic voltammograms generated by running 40 sweep segments on the UO2 WE prepared by the PVDF method (red line), compared to the blank control 0.1 M NaC1O4 (black line) at a scan rate of 20 mV/s.
In situ SEM/EDS yielded the microstructures and chemical maps of the WE that correspond to the measured electrochemical properties of the system. Figure 10 compares the BSE images and EDS spectra of the UO2 WE when the PAMEC was empty (Figures 10A, C, E) and when it was loaded with the 0.1 M NaClO4 (pH = 9.5) electrolyte solution after CV scans (Figures 10B, D, F). There was no discernable particle loss after multiple CV scans (Figure 10A vs. Figure 10B), despite repetitive scanning and long scan duration intervals. All four images (Figures 10A–D) show that the UO2 particles not only remained fixed to the detection window but also remained at the same position. In addition, in situ EDS analysis on the area shown in Figure 10D detected both U and elements from the electrolyte, that is, Na, Cl, and O (Figure 10F), confirming that the electrolyte solution (0.1 M NaClO4) was well dispersed throughout the UO2 WE, owing to the porous structure of the PVDF/CB network (Nguyen and Kuss, 2020; Ram et al., 2020). The increase in U intensity after CV scans (Figure 10F) compared to the EDS spectra of dry UO2 (Figure 10E) suggests the migration of dissolved uranium species resulting from multiple CV scans (Figure 9), including dissolved uranyl ions from the UO2 particles attached right underneath the detection window and the particles adjacent to the detection window.
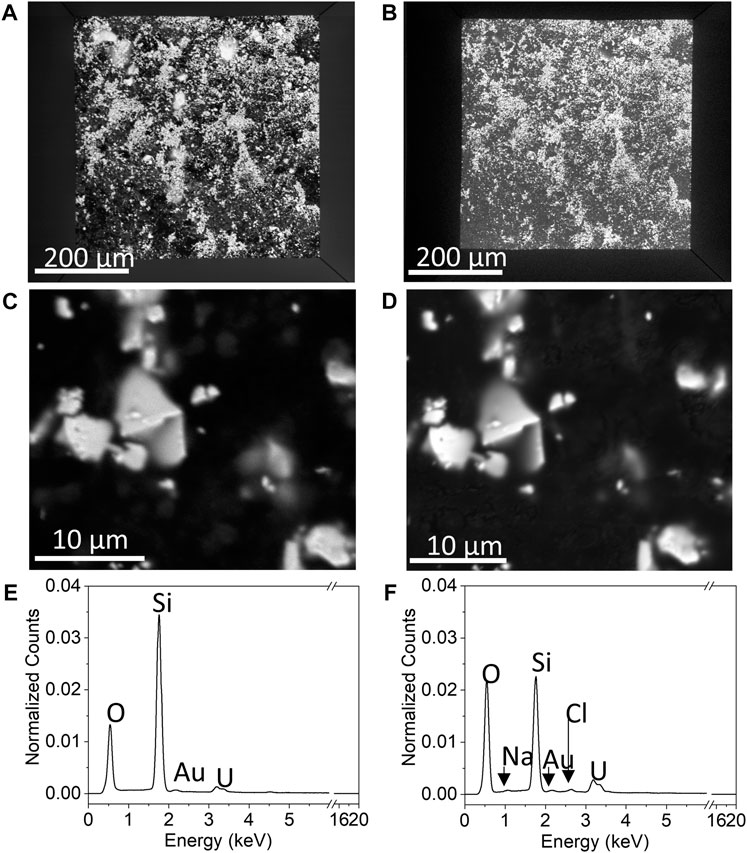
FIGURE 10. SEM imaging illustrating the BSE images of (A) a full view of the detection window when the PAMEC was not loaded with electrolyte, (B) loaded with electrolyte after CV scans, with higher magnification of the same spot on the window when the PAMEC was unloaded, (C) and (D) loaded after CV scans and corresponding EDS spectra (E,F) acquired from the area shown in (C,D), respectively.
The PVDF binder approach is by far the most successful one to fabricate the microgram quantity of materials required for electrochemical analysis and in situ chemical mapping. More validation and verification of this method were published previously (Yao et al., 2022).
4 Conclusion
In this contribution, we described three different techniques (FIB-SEM lift-out, Au-coating, and PVDF binder) for creating a vacuum-compatible, microfluidic electrochemical cell using microgram quantities of UO2. In terms of the electrochemical response, the PVDF method has proven to be the most successful, leading to the creation of a vacuum-compatible PAMEC device. However, the grain morphology is lost, unlike the lift-out method. It involves mixing micrograms of UO2 particles with a PVDF binder, resulting in redox outcomes that are consistent with bulk electrochemical analysis. Additionally, it allows for chemical imaging using in situ SEM/EDS and other multimodal analyses. The development of this PAMEC technique has enabled real-time and operando monitoring of UO2 electrode redox and morphological/chemical changes at the microscale. Consequently, this experimental setup can be used to investigate the stability of SNF under simulated geologic repository conditions. In contrast, the initial preparation and fabrication of micro-sized electrodes from bulk materials, such as SNF, necessitate the use of hot cells for their highly shielded nuclear radiation containment. Stock solutions of the nuclear material that are compatible with allowed fume hood quantities of nuclear materials might also need to be shielded. Subsequent experiments conducted using individual electrodes may not require such rigorous containment measures. This is because only micrograms of materials are needed for each electrode, enabling high-throughput experimental work. It is envisioned that this approach will have broad applications for operando experimentation on spent nuclear fuel systems and material characterization.
Data availability statement
The raw data supporting the conclusion of this article will be made available by the authors, without undue reservation.
Author contributions
Substantial contributions to the conception and design of the work: JY and EB. Electrochemical experiments and E-cell fabrication: JY. Microscopy analysis: JY, ST, SR, DR, and EB. Manuscript drafting: JY. Revision: BM, EI, and SC. All authors contributed to the article and approved the submitted version.
Funding
This work was supported by the U.S. Department of Energy Office (DOE) of Nuclear Energy, through the Office of Spent Fuel and Waste Science and Technology Research and Development Campaign (DOE NE-81) within the Office of Spent Fuel and Waste Disposition. Work was conducted at the PNNL Radiochemical Microscopy Q-suite. PNNL is operated by Battelle under contract DE-AC05-76RL01830.
Acknowledgments
The authors thank Dr. Wes Lawrence, Dr. Mark Nutt, and Ms. Wendy Erikson at the Pacific Northwest National Laboratory (PNNL) for programmatic oversight. Mr. Kyle Maloy and Mr. Alan Cantrell provided radiological support. Dr. Prasad Nair (DOE NE-81) and Dr. Carlos Jove-Colon (Sandia National Laboratory) are thanked for technical discussions.
Conflict of interest
SC was employed by TerraPower LLC.
Authors SC, EB, and DR declared that they were an editorial board member of Frontiers at the time of submission. This had no impact on the peer review process and the final decision.
The remaining authors declare that the research was conducted in the absence of any commercial or financial relationships that could be construed as a potential conflict of interest.
Publisher’s note
All claims expressed in this article are solely those of the authors and do not necessarily represent those of their affiliated organizations, or those of the publisher, the editors, and the reviewers. Any product that may be evaluated in this article, or claim that may be made by its manufacturer, is not guaranteed or endorsed by the publisher.
References
Borók, A., Laboda, K., and Bonyár, A. (2021). PDMS bonding technologies for microfluidic applications: A review. Biosens. (Basel) 11, 292. doi:10.3390/bios11080292
Bruno, J., and Ewing, R. C. (2006). Spent nuclear fuel. Elements 2, 343–349. doi:10.2113/gselements.2.6.343
Chatterjee, S., Bryan, S. A., Casella, A. J., Peterson, J. M., and Levitskaia, T. G. (2017). Mechanisms of neptunium redox reactions in nitric acid solutions. Inorg. Chem. Front. 4, 581–594. doi:10.1039/C6QI00550K
Choi, K. H., Kim, H. S., and Lee, T. H. (1998). Electrode fabrication for proton exchange membrane fuel cells by pulse electrodeposition. J. Power Sources 75, 230–235. doi:10.1016/S0378-7753(98)00116-5
Ewing, R. C. (2015). Long-term storage of spent nuclear fuel. Nat. Mater 14, 252–257. doi:10.1038/nmat4226
Gallaway, J. W., Desai, D., Gaikwad, A., Corredor, C., Banerjee, S., and Steingart, D. (2010). A lateral microfluidic cell for imaging electrodeposited zinc near the shorting condition. J. Electrochem. Soc. 157, A1279. doi:10.1149/1.3491355
King, F., Quinn, M. J., and Miller, N. H. (1999). The effect of hydrogen and gamma radiation on the oxidation of UO2 in 01 mol*(dm)-3 NaCl solution. Sweden: SKB publisher, 1404–0344.
King, F., and Shoesmith, D. W. (2004). Electrochemical studies of the effect of H2 on UO2 dissolution. Sweden: SKB publisher, 1404–0344.
Li, X., Xu, H., and Yan, W. (2016). Fabrication and characterization of PbO2 electrode modified with polyvinylidene fluoride (PVDF). Appl. Surf. Sci. 389, 278–286. doi:10.1016/j.apsusc.2016.07.123
Mantel, T., Benne, P., Parsin, S., and Ernst, M. (2018). Electro-conductive composite gold-polyethersulfone-ultrafiltration-membrane: Characterization of membrane and natural organic matter (NOM) filtration performance at different in-situ applied surface potentials. Membranes 8, 64. doi:10.3390/membranes8030064
Marle, L., and Greenway, G. M. (2005). Microfluidic devices for environmental monitoring. TrAC Trends Anal. Chem. 24, 795–802. doi:10.1016/j.trac.2005.08.003
Mehling, M., and Tay, S. (2014). Microfluidic cell culture. Curr. Opin. Biotechnol. 25, 95–102. doi:10.1016/j.copbio.2013.10.005
Mishra, S., K, S., Rao, C. J., Mallika, C., and Mudali, U. K. (2016). Electrochemical studies on the reduction of uranyl ions in nitric acid-hydrazine media. J. Electroanal. Chem. 776, 127–133. doi:10.1016/j.jelechem.2016.07.002
Moya, A., Gabriel, G., Villa, R., and Javier del Campo, F. (2017). Inkjet-printed electrochemical sensors. Curr. Opin. Electrochem. 3, 29–39. doi:10.1016/j.coelec.2017.05.003
Nguyen, V. A., and Kuss, C. (2020). Review—conducting polymer-based binders for lithium-ion batteries and beyond. J. Electrochem. Soc. 167, 065501. doi:10.1149/1945-7111/ab856b
Ram, R., Soni, V., and Khastgir, D. (2020). Electrical and thermal conductivity of polyvinylidene fluoride (PVDF) – conducting Carbon Black (CCB) composites: Validation of various theoretical models. Compos. Part B Eng. 185, 107748. doi:10.1016/j.compositesb.2020.107748
Sanjay, S. T., Zhou, W., Dou, M., Tavakoli, H., Ma, L., Xu, F., et al. (2018). Recent advances of controlled drug delivery using microfluidic platforms. Adv. Drug Deliv. Rev. 128, 3–28. doi:10.1016/j.addr.2017.09.013
Shoesmith, D. W. (2000). Fuel corrosion processes under waste disposal conditions. J. Nucl. Mater. 282, 1–31. doi:10.1016/S0022-3115(00)00392-5
Shoesmith, D. W., Hocking, W. H., Sunder, S., Betteridge, J. S., and Miller, N. H. (1994). Electrochemical studies of SIMFUELS. J. Alloys Compd. 213-214, 551–553. doi:10.1016/0925-8388(94)90985-7
Shoesmith, D. W., Sunder, S., Bailey, M. G., Wallace, G. J., and Stanchell, F. W. (1984). Anodic oxidation of UO 2 IV. X-ray photoelectron spectroscopic and electrochemical studies of film growth in carbonate-containing solutions. Appl. Surf. Sci. 20, 39–57. doi:10.1016/0378-5963(84)90325-8
Son, J., Buck, E. C., Richers, S. L., and Yu, X.-Y. (2021a). Stamping nanoparticles onto the electrode for rapid electrochemical analysis in microfluidics. Micromachines (Basel) 12, 60. doi:10.3390/mi12010060
Son, J., Buck, E. C., Riechers, S. L., Tripathi, S., Strange, L. E., Engelhard, M. H., et al. (2021b). Studying corrosion using miniaturized particle attached working electrodes and the nafion membrane. Micromachines (Basel) 12, 1414. doi:10.3390/mi12111414
Sunder, S., Miller, N. H., and Shoesmith, D. W. (2004). Corrosion of uranium dioxide in hydrogen peroxide solutions. Corros. Sci. 46, 1095–1111. doi:10.1016/j.corsci.2003.09.005
Sunder, S., Shoesmith, D. W., Bailey, M. G., Stanchell, F. W., and McIntyre, N. S. (1981). Anodic oxidation of UO2: Part I. Electrochemical and X-ray photoelectron spectroscopic studies in neutral solutions. J. Electroanal. Chem. Interfacial Electrochem. 130, 163–179. doi:10.1016/S0022-0728(81)80384-1
Sunder, S., Strandlund, L. K., and Shoesmith, D. W. (1996). Anodic dissolution of UO2 in slightly alkaline sodium perchlorate solutions. IAEA, Canada, 35.
Sunder, S., Strandlund, L. K., and Shoesmith, D. W. (1998). Anodic oxidation and dissolution of CANDU fuel (UO2) in slightly alkaline sodium perchlorate solutions. Electrochimica Acta 43, 2359–2372. doi:10.1016/S0013-4686(97)10174-8
Suresh, R. R., Lakshmanakumar, M., Arockia Jayalatha, J. B. B., Rajan, K. S., Sethuraman, S., Krishnan, U. M., et al. (2021). Fabrication of screen-printed electrodes: Opportunities and challenges. J. Mater. Sci. 56, 8951–9006. doi:10.1007/s10853-020-05499-1
Yao, J., and Buck, E. C. (2021). Provisional patent, particle-attached microfluidic electrochemical cell, 32343.
Yao, J., Lahiri, N., Tripathi, S., Riechers, S. L., Ilton, E. S., Chatterjee, S., et al. (2022a). A microfluidic electrochemical cell for studying the corrosion of uranium dioxide (UO2). RSC Adv. 12, 19350–19358. doi:10.1039/D2RA02501A
Yao, J., Lao, D. B., Sui, X., Zhou, Y., Nune, S. K., Ma, X., et al. (2017). Two coexisting liquid phases in switchable ionic liquids. Phys. Chem. Chem. Phys. 19, 22627–22632. doi:10.1039/C7CP03754F
Yao, J., Ossana, A., Chun, J., and Yu, X.-Y. (2020). In situ liquid SEM imaging analysis revealing particle dispersity in aqueous solutions. J. Microsc. 279, 79–84. doi:10.1111/jmi.12904
Yao, J., Tripathi, S., Ilton, E. S., McNamara, B. K., Lahiri, N., O’Hara, M. J., et al. (2022b). Corrosion of U233-doped uranium oxide using microfluidics methods. Richland, WA: Pacific Northwest National Laboratory, PNNL-33210.
Keywords: microfluidic electrochemical cell, UO2, in situ SEM/EDS, FIB-SEM lift-out, Au coating, electrochemistry, spent nuclear fuel (SNF), PVDF binder
Citation: Yao J, Tripathi S, McNamara BK, Lahiri N, Riechers SL, Chatterjee S, Reilly DD, Ilton ES and Buck EC (2023) Advancing radioactive material research method: the development of a novel in situ particle-attached microfluidic electrochemical cell. Front. Nucl. Eng. 2:1206110. doi: 10.3389/fnuen.2023.1206110
Received: 14 April 2023; Accepted: 07 June 2023;
Published: 22 June 2023.
Edited by:
Yifeng Wang, Sandia National Laboratories (DOE), United StatesReviewed by:
Vladimir Petrov, Lomonosov Moscow State University, RussiaAmy Hixon, University of Notre Dame, United States
Copyright © 2023 Yao, Tripathi, McNamara, Lahiri, Riechers, Chatterjee, Reilly, Ilton and Buck. This is an open-access article distributed under the terms of the Creative Commons Attribution License (CC BY). The use, distribution or reproduction in other forums is permitted, provided the original author(s) and the copyright owner(s) are credited and that the original publication in this journal is cited, in accordance with accepted academic practice. No use, distribution or reproduction is permitted which does not comply with these terms.
*Correspondence: Jennifer Yao, amVubmlmZXIueWFvQHBubmwuZ292; Edgar C. Buck, ZWRnYXIuYnVja0Bwbm5sLmdvdg==