 Parthkumar Rajendrabhai Patel
 Amit Kumar
 A. John Arul1,3
- 1Homi Bhabha National Institute, Training School Complex, Mumbai, India
- 2Safety Research Institute, Atomic Energy Regulatory Board, Mumbai, India
- 3Engineering Physics Group, Indira Gandhi Centre for Atomic Research, Kalpakkam, India
With the growing emphasis on safety in next-generation reactors, along with the necessity to practically eliminate large doses to the public from severe accidents, a mechanistic assessment of such accidents becomes very important problem. The present manuscript attempts to address the source term assessment, focusing on the release behaviour of the aerosol from the roof-slab leak paths post-Core Disruptive Accident (CDA) conditions (known as interface source term or cover gas source term). Following a CDA, after possible Na leak through the gap between rotating plugs and major components, the cover gas space could be in contact with the containment atmosphere through these open leak paths. Additionally, the impact of sodium slug to roof-slab could have caused roof-slab cooling line failure. The present study assesses the release behaviour of the aerosols from the roof-slab leak paths, with respect to aerosol size under various cases of roof-slab cooling line failure. Sodium aerosols are used as representative aerosols for studying the radionuclide (RN) aerosol release behaviour. The assessment indicates that most of the aerosol leaking from roof-slab leak paths are of the diameter between 5 and 25
Highlights
• The release behaviour of aerosols from the cover gas to the RCB post-CDA is studied for the first time.
• Various cases of roof-slab cooling line failure and its effect of release of aerosols from roof-slab leak paths are studied.
• Most of the aerosols leaking roof-slab leak paths are of a size less than 25
• Air ingress from RCB atmosphere was found in annular leak-paths; however, these ingress was limited to annular leak paths only.
1 Introduction
Due to the involvement of multi-physics phenomena modelling, determining the severe accident source term is one of the most complex aspects of reactor design analysis, yet it remains critical for meeting licensing requirements. Historically, these analyses have been performed for postulated bounding accident scenarios, with conservative release fraction assumptions derived either from experimental observations or past reactor experiences (Grabaskas et al., 2015). It was expected that the choice of the bounding accident scenario with conservative assumptions would lead to conservative release fractions.
With the advent of advanced computational resources, mechanistic assessments of the severe accident source term has become desirable, particularly for Gen-IV reactors (Grabaskas et al., 2015). Since Gen-IV Sodium Cooled Fast Reactors (SFRs) are in their early deployment stage, such analyses are expected to provide crucial feedback to safety design systems and aid in improving Severe Accident Management Guidelines (SAMGs). For oxide fuelled pool-type SFRs, Unprotected Loss of Flow Accident (ULOFA) is of interest, where significant core damage is postulated due to the loss of flow caused by the unavailability of both primary pumps and all engineered safety systems. Though such accidents are of low probability (for metal-fuelled pool-type SFRs, conservative ULOF the long-term response is pretty benign (Harish et al., 2009; Grabaskas et al., 2017)), such accidents are postulated for the bounding radionuclide (RN) release estimates and affirming the adequacy of the engineered and passive safety systems.
Following a ULOFA, failure of the roof-slab seals is expected (Velusamy et al., 2011). This failure results in the ejection of approximately 350 kg of sodium, along with RNs released into the primary sodium and cover gas1. This phase is referred to as the “instantaneous interface source term” (refer to Figure 1). Following this phase, the release of RNs would primarily occur through the evaporation of the primary sodium pool, a phase known as the “delayed interface source term,” which may persist for several hours, depending on the plugging time of the roof-slab leak paths (Balard and Carluec, 1996; Berthoud et al., 1987). In addition to the evaporative release, sodium fires may also occur depending on the availability of oxygen in the cover gas due to Reactor Containment Building (RCB) air ingress (Velusamy et al., 2011) (refer Figure 1). In the current manuscript, sodium fires resulting from air ingress into the cover gas have not been considered. Literature related to instantaneous and delayed interface source term is given in the following section.
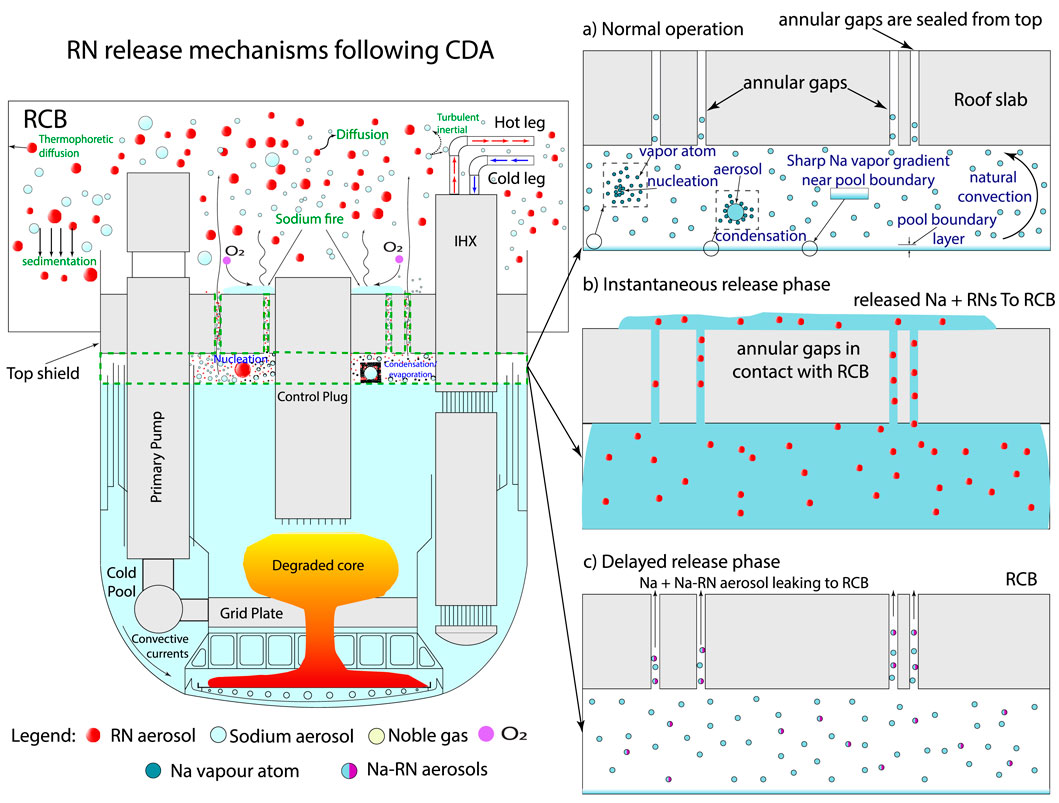
Figure 1. Illustration of RN release mechanisms from the cover gas to the RCB following a CDA. The boundary marked by the green dashed line indicates the cover gas region. (a) Normal operation: During normal operation, the sodium vapour present in cover gas nucleates, condenses, and is transported via natural convection. The resulting aerosol disperses in the cover gas and may also be transported to the annular gaps. (b) Instantaneous release phase: Sodium released through the annular leak paths leads to the release of RN aerosols into the RCB. (c) Delayed release phase: Following sodium release, sodium from the primary pool evaporates, forming sodium aerosols. Due to the high concentration of sodium aerosols, RNs are expected to bind to these Na aerosols.
1.1 Literature of related works
The literature on the interface source term can be broadly classified into two categories: 1) studies related to the determination of the instantaneous source term, and 2) studies related to the determination of the delayed source term. Most experiments concerning both the instantaneous and delayed source terms were conducted in the 1980s (Berthoud et al., 1987; Petrykowski and Longest, 1985).
For the instantaneous interface source term, the experiments primarily focused on RN release during the core bubble expansion and subsequent oscillation phases. Detailed studies on the instantaneous interface source term can be found in various works (Berthoud et al., 1987; Balard and Carluec, 1996).
To date, very limited experimental work has been carried out to understand the delayed release of the RNs post-severe accident, mostly through experiments carried out at NALA, PAVE and NACOWA facilities. These were small-scale facilities [e.g., Minges and Schütz (Minges and Schütz, 1994)] where RN release from hot sodium into an inert gas atmosphere, as well as sodium fires, were examined, effectively simulating delayed source term scenarios in the cover gas.
In the NALA experimental program (Balard and Carluec, 1996; Berthoud et al., 1987), the release behaviour of the Cs, I, Sr, U from hot sodium into an inert gas atmosphere, sodium evaporation, and sodium aerosol behaviour were studied in terms of the enrichment factors2. The experiment series included laboratory-scale (few grams of sodium) to technical-scale experiments (
Minges and Shutz (Minges and Schütz, 1994) studied the release and deposition behaviours of volatile RNs such as Cs and iodine. It was found that the release was proportional to the vapour pressure of the Cs and iodine. This is expected since Cs would be in elemental form in the primary sodium pool and have higher volatility. Additionally, much larger enrichment factors were found in several cold spots of the roof slab.
1.2 Objective and structure of the manuscript
As observed from the literature, except for highly volatile species such as Cs and I, most RN releases from the sodium pool would be similar to sodium aerosols. This is anticipated due to the significantly lower ratio of RNs in the primary sodium inventory (RNs are on the order of kilograms, while the primary sodium inventory is on the order of hundreds of tonnes). Hence, the release of the volatile RN is expected to be tightly bound to sodium evaporation.
In the present manuscript, we mainly study sodium aerosol formation due to evaporation (from the primary sodium pool), nucleation, condensation, and dispersion in the cover gas space, driven by natural convective currents. These aerosols would eventually be released through leak paths in the annular gaps. Since these aerosols are generated through evaporation of the RN-sodium, they would be internally/externally mixed3 and their behaviour will be dictated by the effective density of the aerosol.
Consideration of all RNs with their effective density would be numerically intensive (as there will be multicomponent internally/externally mixed aerosols). For the current analysis, sodium aerosols have been considered as representative to study the release behaviour from the roof-slab leak paths, with a focus on the release characteristics relative to different aerosol sizes.
The present manuscript is an extension of (Patel et al., 2023), where the evolution and transport of the aerosols in cover gas under reactor operation conditions were studied in detail. In that study, extensive validation of the modified Aerosolved code was also provided. In the current manuscript, we analyse the aerosol evolution and transport in cover gas and roof-slab annular leak paths for a CDA resulting from the ULOF sequence. The study brings out the aerosol transport behaviour and quantifies the effective aerosol size released to the RCB from the annular leak paths in the roof slab.
The manuscript is structured as follows: Section 2 offers a concise overview of the governing equations used in the model. Section 3 provides a brief description of the validation experiments conducted by Furukawa et al. (Furukawa et al., 1984). Section 4 outlines the ULOF accident sequence. Section 5 details the geometric aspects of the reference reactor cover gas. Section 6 discusses various release scenarios considered for the assessment, along with boundary conditions and results from the numerical analysis. Finally, Section 7 concludes our key findings.
2 Model description
2.1 Governing equations
Post-CDA, the temperature in the primary sodium pool would be maintained with Safety Grade Decay Heat Removal System (SGDHRS). For the reference reactors, SGDHRS are designed with a frequency of loss of Decay Heat Removal (DHR function ¡
Let us consider
The vapour species are denoted by
The continuity equation for all species can be given as,
Where
The equation for the conservation of momentum in the mixture can be written as:
Where p is system pressure and
T is the temperature of the mixture.
The momentum equation for the particle velocity can be expressed as (Ohira, 2003),
Where,
Where, s is the mass of the aerosol.
The species transport equation for condensed and continuous phases can be given as below,
Where,
Where,
Where,
Where,
3 Validation
Before conducting a detailed assessment for accidental conditions, the modified solver was validated with experiments performed in small-scale cover gas facilities. The detailed results were presented in Patel et al. (Patel et al., 2023). A summary of the validation results is presented in this section for completeness.
As presented in Table 1, two experimental facilities were considered for validation: the SILVERINA cover gas facility (Kumar et al., 2015) and the cover gas facility reported by Furukawa et al. The details of the cover gas facilities can be found in (Kumar et al., 2015) and (Furukawa et al., 1984). The experimentally observed average mass concentration and temperatures were compared with numerically calculated average values. In some experiments reported by Furukawa et al., average temperatures were not provided; however, the numerically calculated values showed good agreement with the average temperatures obtained by averaging the rooftop temperature and the sodium pool temperature, which represent the approximate average temperature in cover gas (Kumar et al., 2016). Post validation, aerosolEulerFoam would be used to analyze aerosol transport in cover gas during accident conditions post CDA. The subsequent section gives a brief summary of the ULOF accident sequence.
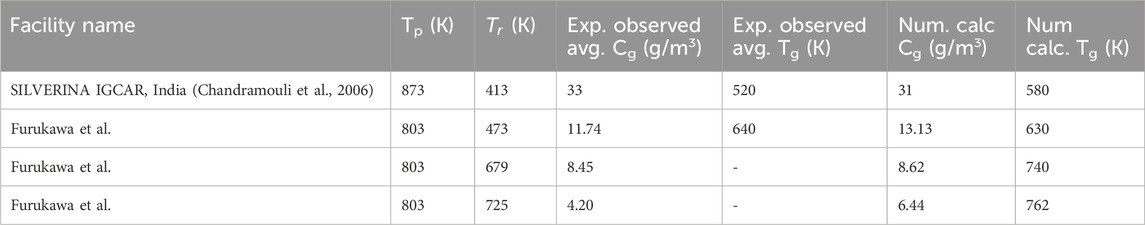
Table 1. Validation of average mass concentration and temperature in scaled down cover gas facilities. For current validation two experimental facilities are considered: 1) SILVERINA cover gas facility (Chandramouli et al., 2006) 2) Facility reported by Furukawa et al. (1984).
4 ULOF accident sequence
For the current analysis, the loss of AC power to both primary pumps, along with the failure of engineered safety features, is considered as the initiating event. Initially, due to the loss of flow and subsequent loss of heat removal from the core, the fuel temperature rises. Due to axial and radial expansion, the overall reactivity would be effectively negative and effective power would decrease (Harish et al., 2009).
As the power-to-flow ratio eventually increases, the temperature of both the fuel and coolant will continue to rise, ultimately causing the fuel element clad to fail and releasing non-condensible fission gases (such as Xe and Kr) from the plenum inventory into the coolant. Relatively volatile RN can be transported to the cover gas space along with the non-condensible fission gas bubbles. This would be the first source of the RN release in the cover gas space.
A subsequently high power-to-flow ratio causes sodium voiding in the central top region of the core, which spreads axially downward and radially outward, leading to positive overall reactivity. This effective positive reactivity increases the power and temperature of the fuel sub-assembly, ultimately causing clad failures and initiating fuel melt in the highly rated fuel channels. This molten fuel can be swept away in the primary pool. Due to uncertainty in the modeling, it is assumed that the all molten fuel slumps, leading to large reactivity insertion, power surge, and eventual core disassembly (Harish et al., 2009). This results in conservative estimates. Up to this stage, several RN can be transported along with non-condensable gases and may also evaporate into the cover gas space along with primary sodium. These RN-sodium aerosols can mechanically deposit on various surfaces of the cover gas space. These deposited aerosols can re-evaporate if temperature changes.
At the end of disassembly, about
This quasi-static pressure acts as the driving force for subsequent sodium release into the containment. For the reference reactor, the amount of sodium expelled into the RCB has been estimated through thermal-hydraulic calculations, assuming quasi-static pressure as the driving force, to be approximately 350 kg (Chellapandi et al., 2003). Moreover, several RNs released to cover gas during the fuel melt phase are likely to be ejected into the containment.
Upon the release of sodium, the instantaneous source of RNs within the RCB would comprise the steady-state cover gas inventory and RNs released during fuel melt phase (referred to as the instantaneous interface source term).
Subsequently, the RN release rate to the containment will depend on both the release rate from the fuel into the coolant and the evaporation rate from the coolant surface, as well as the leak rate through the roof slab (referred to as the delayed interface source term). The present manuscript address delayed interface source term, where characteristics of RN releasing for long term to containment and their release rates are quantified.
5 Geometric detail of the reference reactor cover gas
The cover gas region serves as an inert isolation space, bounded by the surface of the primary sodium pool at the bottom and the bottom plate of the roof-slab at the top. During normal reactor operations, the average temperature of the primary sodium pool is approximately 823 K, while the temperature of the roof-slab bottom plate is maintained at around 393 K through air cooling. The cover gas space is connected to annular gaps within the roof-slab, which are provided for manufacturing tolerances between component penetrations and the roof-slab itself. During reactor operation, the annular gaps between the roof-slab and penetrating components (such as Large Rotating Plug (LRP), and Small Rotating Plug (SRP)) are sealed from the top to avoid any leakage.
For the current assessment, the cover gas geometry is based on that of the Prototype Fast Breeder Reactor (PFBR), with some simplifications. The inner diameter of the cover gas was about 12.9 m. The cover gas (i.e., the space comprising between the primary sodium pool and roof-slab bottom plate) height is about 0.8 m. The roof-slab thickness is about 1.8 m, and its bottom plate surface is in contact with argon cover gas.
Several components, including the Intermediate Heat Exchanger (IHX), Pump, Decay Heat Exchanger (DHX), and Large Rotating Plug (LRP), are mounted on the roof-slab. The annular gaps between these components and the roof-slab vary from 10 mm to 50 mm, depending on the specific penetration. These gaps are primarily provided to accommodate manufacturing tolerances. For the present analysis, a uniform annular gap of 10 mm has been assumed. Additionally, only the major structural penetrations—namely, the IHX, Pump, DHX, and LRP—are considered for the modelling. A detailed annotated geometrical model is illustrated in Figure 2. The details of the computational framework are given in a subsequent section.

Figure 2. (a) Geometrical information for full reference reactor cover gas and roof-slab domain. (b) Domain considered for numerical analysis. The structural penetration in cover gas are not modeled, only fluid domain (i.e., annular gaps) are modeled. Further, for the geometrical simplification, all annular gaps are considered to be 10 mm. The annulus penetration of LRP-SRP and CP annular gaps are not considered.
6 Post-CDA aerosol evolution in cover gas
During severe accidents such as CDA, the impact of a sodium slug on the roof-slab is expected to cause the displacement of components mounted on the roof-slab. Although some of these components may settle back onto the roof slab following sodium release, the leak area through the bearings of LRP and SRP would remain open even after they return to their normal positions. For the reference reactor, these leak paths in the rotating plugs contribute 80% of the total leak paths area. Hence, the cover gas would be in contact with the RCB after sodium release (Velusamy et al., 2011).
The subsequent release of RNs would be influenced by the available oxygen content within the cover gas space. If the oxygen content is insufficient to sustain or ignite a sodium fire, the RN release would primarily occur through sodium evaporation. These sodium-bound RN aerosols would then be transported to the RCB via the leak paths. A typical leak path formed between the LRP and roof-slab is depicted in Figure 3. As shown, the leak paths in the roof-slab contain multiple bends, which may promote inertial deposition. However, for the current analysis, the effect of these bends is neglected, resulting in conservative release estimates.
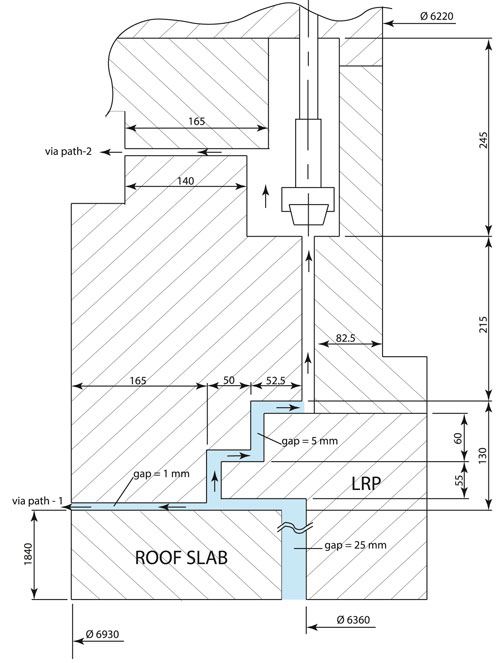
Figure 3. Simplified schematic of leak path from RS-LRP for reference reactor.
In this analysis, it is assumed that RN and sodium release occur through the evaporation of the sodium pool, followed by aerosol formation. These aerosols are then transported and released through the leak paths. This assumption is justified, as the sodium pool would be at a significantly higher temperature compared to the RCB, creating a pressure differential that drives the flow outward (with the cover gas at approximately 12 kPa gauge pressure, higher than the RCB pressure). For modelling the leak behaviour from the roof-slab, sodium aerosols are taken as representative aerosols. This assumption is valid because most of the RN release is expected to be tightly bound to sodium evaporation, and a significant portion of the fission products are dissolved in the liquid sodium aerosol present in the cover gas (Balard and Carluec, 1996).
The roof-slab cooling system consists of several cooling lines injecting the air to maintain the roof-slab bottom plate and annular walls temperature at 393 K. The cooling air enters the top shield at 363 K through inlet pipes and cools the roof-slab bottom plate by impinging it as a jet. The coolant leaving the bottom plates flows in a vertical cooling passage around the component penetration shell to cool the annular walls of the shell (IGCAR, 2010). During CDA, the forces imposed on the internal components and the vertical shells can lead to closure of the vertical cooling passages around the component penetrations leading to failure of heat rejection from the cover gas space.
For the current analysis, we have considered the failure of various sections of roof-slab air cooling system, which fails to heat rejection from the cover gas. The behaviour of the aerosol release from the leak path due to these failures is examined. We have studied the failure of three sections viz., 1) failure of the cooling lines near annular walls of the roof-slab at both pump penetrations leading to failure of heat rejection from these locations, 2) failure of the cooling lines near annular walls of the roof-slab in all component penetrations, and 3) failure of the cooling linear near the roof-slab bottom plate and annular walls of the all the component penetrations, enveloping most of the failure scenarios. All three cases are depicted in Figure 4. The failure of the cooling line is depicted via violet blocks. The details of the boundary conditions for each case are given in the following section.
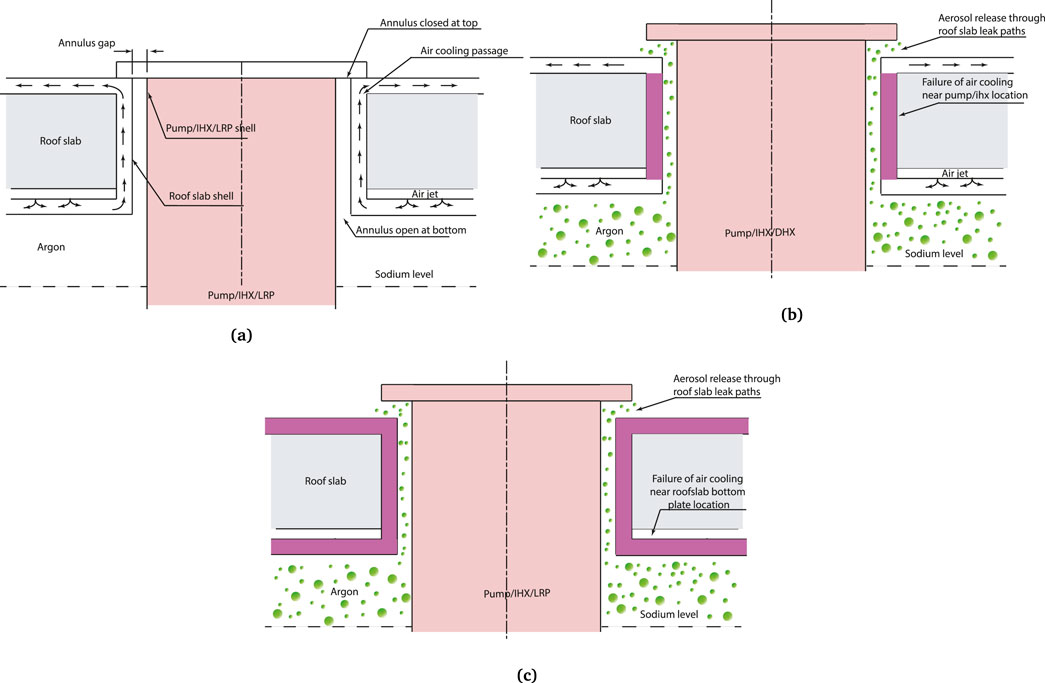
Figure 4. Illustration of cover gas dynamics in roof-slab annular gaps during operation and accident conditions. (a) Illustration of cover gas dynamics during operation conditions. and DHX penetrations (case 1 & 2). (b) Illustration of failure of heat removal to the annular walls of pump/IHX. (c) Illustration of failure of heat removal to roof-slab walls and component penetration annular walls (case-3).
6.1 Boundary condition
The primary sodium pool was subject to a Dirichlet boundary condition (fixedValue). For the side walls of the cover gas region, a Neumann boundary condition (zeroGradient) was imposed. In the absence of explicit temperature data for various component shells, representative pump temperature profiles were assigned to all component shells, as referenced in (Chauhan, 2021; Patel et al., 2023). Furthermore, the temperature boundary conditions for the roof-slab bottom plate and its annular walls were implemented in accordance with the case-specific considerations detailed in Section 6. For example, in case-1, the failure of the cooling lines near the annular wall of the pump is assumed. Hence, adiabatic boundary conditions were applied to the annular walls. Similarly, for the case-2 annular walls of the pump, IHX and DHX were assigned adiabatic boundary conditions. In case-3, adiabatic boundary conditions were applied to all annular walls of the roof-slab and the bottom plate of the roof-slab.
The velocity boundary conditions at the outlet of the annular walls were set to zeroGradient, while no-slip boundary conditions were applied to the cover gas side walls and the roof-slab bottom plate walls. The sodium vapour mass fraction at the roof-slab bottom plate and pool surface is kept constant at one, assuming these surfaces are saturated by sodium vapour. As reported in experiments conducted by A. Anderson (Anderson, 1991), the deposition of aerosol particles onto the cover gas side walls is minimal. Thus, a zeroGradient boundary condition is applied to the cover gas side walls for the aerosol number densities. At the roof-slab bottom plate and annular walls, the number concentration is fixed to zero, assuming complete deposition at the roof-slab bottom plate (Huang and He, 2019). The Neumann boundary condition was applied to define the number densities at the pool surface and the component shell wall within the cover gas, while turbulence was modeled using the standard k-
6.2 Failure of the cooling section near the annular walls of the roof-slab near primary pump penetrations
In the reference reactor, the primary pump is a centrifugal and mechanical pump with about 20 m height housing in the standpipe of the inner vessel penetrating in the cold pool (IGCAR, 2010). During CDA, there is a possibility of deformation of the internal components during core bubble expansion (Chellapandi et al., 2003). The few mm pump displacement would essentially block the cooling lines near the pump annular gaps, leading to a ceasing or reduction in heat rejection from the cover gas to the cooling lines present in roof-slab. Hence, it is necessary to study all possible annular gap cooling section failure scenarios. In the present section, analysis is performed for the failure of the pump annular gap cooling lines. The subsequent section discusses the failure of both the pump and IHX annular gap cooling lines.
Figure 5a shows the total mass flow rates (consisting of dispersed and continuous phases) at each leak path at the rooftop. The highest leak rate is from the LRP-RS leak path

Figure 5. (a) Total mass flow rate from the various leak paths, comprising both aerosol phase and gas phase (argon and sodium vapour). (b) Phase-wise mass flow rate from the leak paths, where the inert phase consists of both argon and sodium vapour. (c) Aerosol size-wise leak rate at the leak-path outlet. The leak rates were determined by multiplying the aerosol mass flux by the leak-path outlet area. In this context, the aerosol leak rate is positive for aerosols with sizes <20
Figure 5b shows mass flow rates for both inert and dispersed phases. As shown in the figure, effective positive mass outflow is for the inert phase only. Whereas, the dispersed phase is having effective negative mass flow rate. The negative mass flow rate might be due to inertia force of the large aerosol particles due to effective downward force. The effective leak rates for the dispersed phase are about 0.02–0.05 g/s for most of the leak paths.
Figure 5b depicts aerosol size-wise mass flow rates at the leak path outlet, which gives better understanding regarding aerosol size leaking out from the leak path. The aerosol size less than
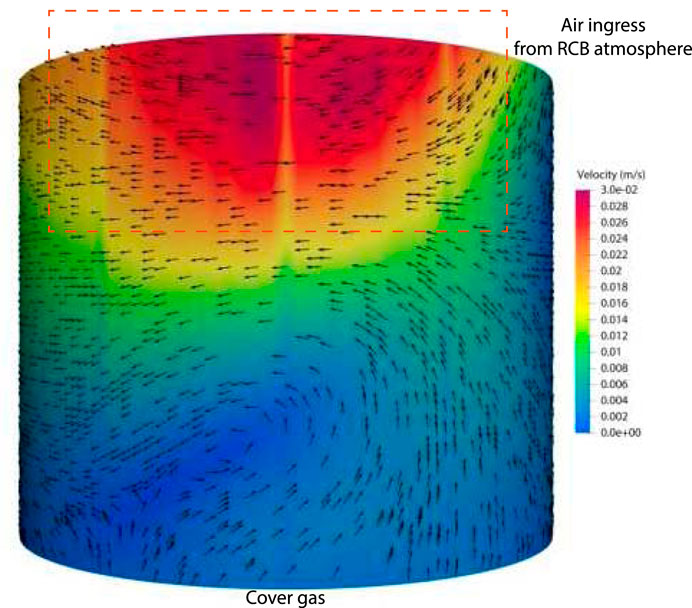
Figure 6. Illustration of air ingress from RCB atmosphere. The RCB air mixing is limited to the annular gaps only. The effective mass flow rate is positive at the outlet.
The average temperature in the cover gas is about 630 K. The average mass concentration in the cover gas region is about 45–50 g/
6.3 Failure of the cooling section near the annular walls of the roof-slab in the all component penetrations
Figure 7a shows the steady state total mass flow rates (considering the contribution from both phases, i.e., the inert and dispersed phases). As shown in the figure, the leak rates are not consistent with the leak path area (the leak rate in some of the DHX leak paths is higher compared to LRP leak paths). To determine the reason behind the lower leak rates from the LRP leak paths compared to the DHX leak paths, the temperature gradient in the annular gaps were compared. From the temperature gradient in the annular gaps, it is seen that LRP, IHX and pump temperature gradients are about 70 k/m. Whereas, DHX temperature gradient is about 100 k/m. This higher temperature gradient could cause higher buoyancy in the annular gaps and eventual higher leak rates in the DHX annular gaps compared to LRP annular gaps. Whereas, for the pump annular gaps failure case, the temperature gradient in the annular gaps is comparable (about 100–120 k/m) to the other annular leak paths, leading to mass flow rates consistent with the leak area. Additionally, there were more convection loops compared to the pump annular gap failure case.
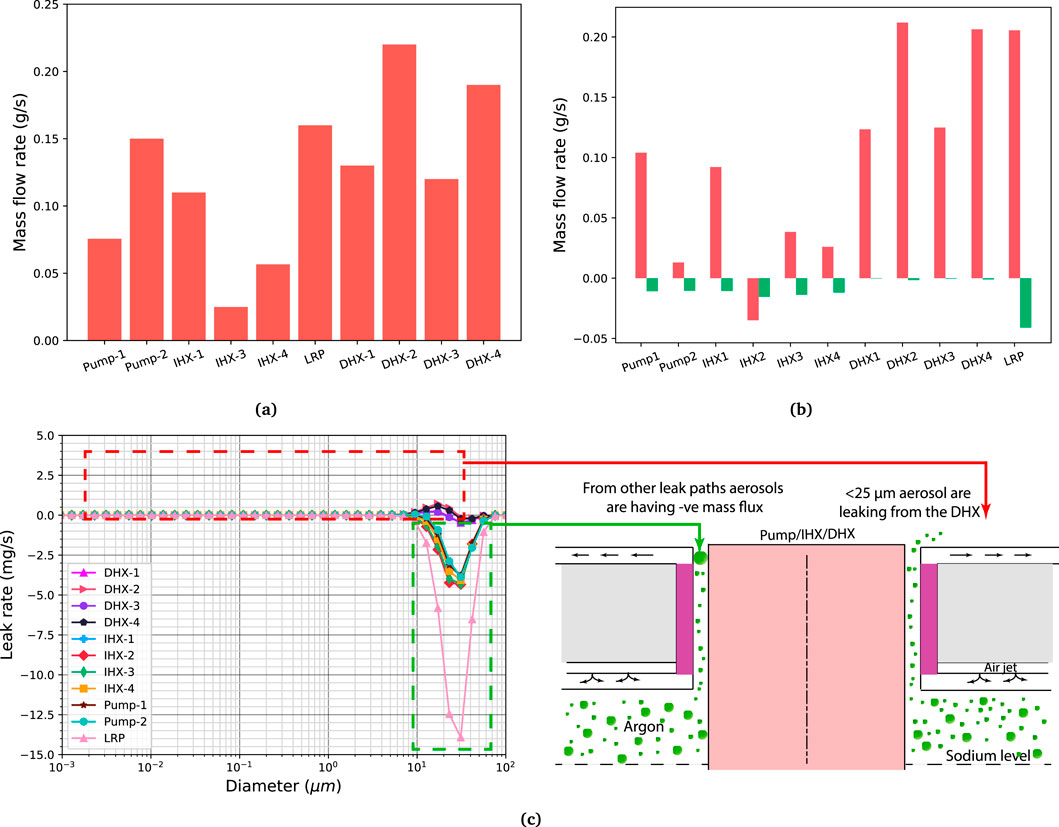
Figure 7. (a) Total mass flow rate from the various leak paths, comprising both aerosol phase and gas phase (argon and sodium vapour). (b) Phase-wise mass flow rate from the leak paths, where the inert phase consists of both argon and sodium vapour. (c) Aerosol size-wise leak rate at the leak-path outlet. The leak rates were determined by multiplying the aerosol mass flux by the leak-path outlet area. In this context, the aerosol leak rate is positive for aerosols with sizes <25
The mass flow rates for the inert and dispersed phases are shown in Figure 7b. As shown in the figure, except for IHX-2, the effective positive mass outflow is for the inert phase only. Whereas, the dispersed phase has effective negative mass flow rates. The effective leak rates for the dispersed phase are about 0.01–0.04 g/s for most of the leak paths.
Figure 7c depicts aerosol size-wise mass flow rates. As shown in the figure, the positive leak rate is seen for only DHX leak paths. Leak rates for other component annular leak paths are negative. The leaking aerosols from the DHX are less than 25
The average temperature in the cover gas is about 640 K. The average aerosol concentration in the cover gas region is about 40 g/
6.4 Failure of the cooling section near the roof-slab bottom plate and annular walls of all the component penetrations
Figure 8a shows the total mass flow rate at the outlet of the leak path. As shown in the figure, the maximum mass flow rate is for the LRP annular leak path (about 2 g/s), which is the highest among all the failure scenarios. The mass flow rate for the pump/IHX leak path is about 0.5 g/s. For DHX, the mass flow rates are about 0.125 g/s. The mass flow rates are consistent with the leak path area. Figure 8b shows the mass flow rates for the dispersed phase and inert phase. The dispersed phase mass flow rates are very low. This might be due to the effective downward force on the larger particles. Figure 8c, shows the aerosol size-wise leak rates for various annular leak paths. The positive leak rates are for aerosol sizes less than 25

Figure 8. (a) Total mass flow rate from the various leak paths, comprising both aerosol phase and gas phase (argon and sodium vapour). (b) Phase-wise mass flow rate from the leak paths, where the inert phase consists of both argon and sodium vapour. (c) Aerosol size-wise leak rate at the leak-path outlet. The leak rates were determined by multiplying the aerosol mass flux by the leak-path outlet area. In this context, the aerosol leak rate is positive for aerosols with sizes <25
The average temperature in the cover gas is about 820 K. This was expected since for this case it is assumed that all annular cooling paths and roof-slab bottom plate cooling sections failed, leading to continuous temperature rise in the cover gas. Eventually, the cover gas space would be in equilibrium with the sodium pool temperature. The average aerosol mass concentration in the cover gas is about 28–30 g/
The present analysis is performed with sodium aerosols as a representative aerosol to the RN-sodium aerosol mixture. Though the present analysis does provide useful insights regarding aerosol behaviour concerning aerosol size and various scenarios involving failure of the different cooling sections in the roof-slab, we believe it is a first step towards multi-component aerosol analysis. It should be noted that the aerosol size is one of the most important parameters governing the aerosol transport behaviour. The above analysis shows that most of the aerosols leaking from the roof-slab leak paths have a size of less than 25
7 Conclusion
This study presents a mechanistic assessment of the delayed interface source term, focusing on post-accident aerosol release through roof-slab leak paths. Sodium aerosols are used as a representative for RN-sodium mixtures to reduce computational complexity. The analysis investigates size-dependent aerosol transport across three failure scenarios viz., 1) roof-slab cooling line failure near primary pump penetrations, 2) failure of cooling line near all component penetrations, and 3) failure of cooling line near all component penetrations and the roof-slab bottom wall.
Simulations reveal that most of the aerosols released through roof-slab leak paths are less than 25
These findings emphasize the critical role of roof-slab coolability in mitigating aerosol release to the RCB post-accident. Maintaining roof-slab bottom plate temperatures within limits is essential to minimize leak rates. Currently, sodium aerosols are used to study the aerosol release behavior from RCB. In future it will be interesting to study multi-component RN-sodium aerosols behavior and its validation with simulated experiment observations.
Data availability statement
The original contributions presented in the study are included in the article/supplementary material, further inquiries can be directed to the corresponding author.
Author contributions
PP: Investigation, Methodology, Software, Validation, Writing – original draft, Writing – review and editing. AK: Conceptualization, Investigation, Supervision, Writing – review and editing. AA: Project administration, Resources, Supervision, Writing – review and editing.
Funding
The author(s) declare that no financial support was received for the research and/or publication of this article.
Conflict of interest
The authors declare that the research was conducted in the absence of any commercial or financial relationships that could be construed as a potential conflict of interest.
Generative AI statement
The author(s) declare that no Gen AI was used in the creation of this manuscript.
Publisher’s note
All claims expressed in this article are solely those of the authors and do not necessarily represent those of their affiliated organizations, or those of the publisher, the editors and the reviewers. Any product that may be evaluated in this article, or claim that may be made by its manufacturer, is not guaranteed or endorsed by the publisher.
Footnotes
1Cover gas refers to the inert isolation layer provided in SFRs.
2The enrichment factor was defined as the ratio of the RN concentration in the released sodium to the RN concentration in the sodium pool.
3A single aerosol particle may be composed of many chemical species and the aerosol may consist of mixed particle of multicomponent aerosols. If all particle in aerosols are of the same chemical composition, the aerosol is said to be internally mixed. If the particles in the aerosol are chemically different, then the aerosol is said to be externally mixed (Friedlander, 2000).
References
Anderson, A. (1991). Studies of aerosol characteristics, heat transfer and mass transfer with application to the cover gas region of sodium cooled Fast reactors. Manchester: University of Manchester. Ph.D. thesis.
Balard, F., and Carluec, B. (1996). “Evaluation of the LMFBR cover gas source term and synthesis of the associated R and D,” in Evaluation of radioactive materials and sodium fires in Fast reactors (Japan).
Berthoud, G., Longest, A. W., Wright, A. L., and Schütz, W. P. (1987). Experiments on liquid-metal fast breeder reactor aerosol source terms after severe accidents. Nucl. Technol. 81 (2), 257–277. doi:10.13182/nt88-a34096
Chandramouli, S., Sakthivel, S., Vijayamohana Rao, P., Gurumoorthy, K., Rajan, K. K., Kalyanasundaram, P., et al. (2006). “Commissioning and operation of SILVERINA sodium loop,” in Proceedings of national conference on operating experience of nuclear reactors and power plants (Mumbai: BARC), 203–209.
Chauhan, A. K. (2021). Thermal analysis of PSP of PFBR. Internal report PFBR/32110/DN/1144/Rev.A, indira gandhi center for atomic research, kalpakkam.
Chellapandi, P., Srinivasan, G. S., and Chetal, S. C. (2013). Primary containment capacity of Prototype Fast Breeder Reactor against core disruptive accident loadings. Nucl. Eng. Des. 256, 178–187. doi:10.1016/j.nucengdes.2012.12.014
Chellapandi, P., Velusamy, K., Chetal, S. C., Bhoje, S. B., Lal, H., and Sethi, V. S. (2003). “08-17/2003-08-22. Analysis for mechanical consequences of a core disruptive accident in prototype fast breeder reactor,” in 17th international conference on structural mechanics in reactor technology (SMiRT 17), 17–22.
Frederix, E., Kuczaj, A., Nordlund, M., Veldman, A., and Geurts, B. (2017). Eulerian modeling of inertial and diffusional aerosol deposition in bent pipes. Comput. and Fluids 159, 217–231. doi:10.1016/j.compfluid.2017.09.018
Frederix, E. M. A. (2016). Eulerian modeling of aerosol dynamics. Netherlands: University of Twente. Ph.D. thesis.
Friedlander, S. K. (2000). Smoke, dust, and haze: fundamentals of aerosol dynamics. 2nd Edition. New York: Oxford University Press.
Furukawa, O., Furutani, A., Hattori, N., and Iguchi, T. (1984). Experimental study of heat transfer through cover gas in the LMFBR. Exp. Study Heat Transf. through Cover Gas LMFBR 1, 451–458.
Grabaskas, D., Bucknor, M., and Jerden, J. (2017). A mechanistic source term calculation for a metal fuel sodium Fast reactor. Argonne, IL: Argonne National Laboratory. (ANL).
Grabaskas, D. S., Brunett, A. J., Bucknor, M. D., Sienicki, J. J., and Sofu, T. (2015). “Regulatory technology development plan sodium fast reactor,” in Mechanistic source term development. ANL-ART–3. Argonne, IL United States: Argonne National Laboratory ANL.
Harish, R., Srinivasan, G., Riyas, A., and Mohanakrishnan, P. (2009). A comparative study of unprotected loss of flow accidents in 500MWe FBR metal cores with PFBR oxide core. Ann. Nucl. Energy 36 (8), 1003–1012. doi:10.1016/j.anucene.2009.06.004
Huang, X., and He, S. (2019). Numerical modelling of cover gas thermal hydraulics in Sodium-cooled Fast Reactors. Nucl. Eng. Des. 355, 110347. doi:10.1016/j.nucengdes.2019.110347
IGCAR (2010). “PFBR final safety analysis report,” in Scientific report internal report, indira gandhi center for atomic research. Kalpakkam.
Kumar, A., Subramanian, V., Krishnakumar, S., Baskaran, R., Chandramouli, S., and Venkatraman, B. (2015). Characterisation of sodium aerosol in cover gas region of SILVERINA loop. Aerosol Air Qual. Res. 15 (5), 1813–1822. doi:10.4209/aaqr.2014.09.0193
Kumar, A., Venkatesan, S., Krishnakumar, S., Ramakrishnan, B., Chandramouli, S., and Balasubramaniam, V. (2016). Studies on geometrical effect on sodium aerosol characteristics in cover gas region. Aerosol Air Qual. Res. 16, 1832–1840. doi:10.4209/aaqr.2016.01.0010
Lucci, F., Frederix, E., and Kuczaj, A. K. (2022). AeroSolved: computational fluid dynamics modeling of multispecies aerosol flows with sectional and moment methods. J. Aerosol Sci. 159, 105854. doi:10.1016/j.jaerosci.2021.105854
Minges, J., and Schütz, W. (1994). Experiments on the enrichment of cesium in the cover gas aerosol of the European Fast Reactor EFR. Nucl. Eng. Des. 147 (1), 17–22. doi:10.1016/0029-5493(94)90251-8
Ohira, H. (2003). Numerical simulation of aerosol behavior in turbulent natural convection: verification of an advanced model. J. Nucl. Sci. Technol. 40 (5), 307–316. doi:10.3327/jnst.40.307
Patel, P. R., Kumar, D. A., and Arul, A. J. (2023). Mechanistic assessment of aerosol transport in an SFR cover gas space under operating condition. Aerosol Sci. Technol. 57 (9), 842–860. doi:10.1080/02786826.2023.2232428
Petrykowski, J. C., and Longest, A. W. (1985). “LMFBR source term experiments in the fuel aerosol simulant test (FAST) facility,” in Proceeding of the international topical meeting on Fast reactor safety (Knoxville, Tennessee, United States: Oak Ridge National Laboratory).
Velusamy, K., Chellapandi, P., Satpathy, K., Verma, N., Raviprasan, G. R., Rajendrakumar, M., et al. (2011). A fundamental approach to specify thermal and pressure loadings on containment buildings of sodium cooled fast reactors during a core disruptive accident. Ann. Nucl. Energy 38 (11), 2475–2487. doi:10.1016/j.anucene.2011.07.002
Nomenclature
CDA Core Disruptive Accident
CFD Computational Fluid Dynamics
DHX Deacay Heat Exchanger
IHX Intermediate Heat Exchanger
LOCA Loss of Coolant Accident
LRP Large Rotating Plug
PFBR Prototype Fast Breeder Reactor
RCB Reactor Containment Building
RN Radionuclide
SAMG Severe accident management guidelines
SFR Sodium cooled Fast Reactor
SGDHRS Safety Grade Decay Heat Removal System
SRP Small Rotating Plug
ULOF Unprotected Loss of Flow
Greek symbols
Subscripts/superscripts
d discrete
i bin index
j Species index
p particle
v vapor
Other symbols
D diffusion coefficient (
g gravitational acceleration (m/
I identity tensor
J Nucleation rate (#/
K Coagulation kernel k thermal conductivity (W/m/K)
n, N aerosol number concentration (#/
p pressure (N/
Re Reynolds number s aerosol mass (kg)
T Temperature of mixture (K)
w(s) Relative velocity of the aerosol with respect to motion of the gas (m/s)
x, y aerosol volume
Keywords: cover gas region, source term, severe accident, OpenFOAM, SFR, CDA, aerosol
Citation: Patel PR, Kumar A and Arul AJ (2025) Mechanistic assessment of aerosol transport in SFR cover gas space post HCDA conditions. Front. Nucl. Eng. 4:1579828. doi: 10.3389/fnuen.2025.1579828
Received: 19 February 2025; Accepted: 18 April 2025;
Published: 23 May 2025.
Edited by:
Mihai A. Diaconeasa, North Carolina State University, United StatesReviewed by:
Yongjun Ye, University of South China, ChinaAydin Karahan, Argonne National Laboratory (DOE), United States
Copyright © 2025 Patel, Kumar and Arul. This is an open-access article distributed under the terms of the Creative Commons Attribution License (CC BY). The use, distribution or reproduction in other forums is permitted, provided the original author(s) and the copyright owner(s) are credited and that the original publication in this journal is cited, in accordance with accepted academic practice. No use, distribution or reproduction is permitted which does not comply with these terms.
*Correspondence: Amit Kumar, YW1pdHBhdGVsQGlnY2FyLmdvdi5pbg==