 Yesim Kutlu1
 Ivan Spasov2Svetlomir Mitkov2
 Pascal Rouxelin1Agustin Abarca1
 Nikola Kolev2Maria Avramova1
 Kostadin Ivanov1,2*
- 1Department of Nuclear Engineering, North Carolina State University, Raleigh, NC, United States
- 2Institute for Nuclear Research and Energy, Bulgarian Academy of Sciences, Sofia, Bulgaria
The advanced thermal-hydraulics sub-channel tool CTF has been in the process of continuous development and improvement by Oak Ridge National Laboratory (ORNL) and North Carolina State University (NCSU). In recent years, there has been considerable progress in code development, including new functionalities, application-specific correlations, various multi-physics applications, built-in pre- and post-processors, improved solvers, parallelization, and extensive testing. VVER applications are part of these activities. NCSU has been cooperating with the Institute for Nuclear Research and Energy (INRNE) on CTF development, verification, and validation for VVER core modeling and simulation. This article presents an overview of these CTF studies for VVER applications. Several test cases are considered, which include pure thermal-hydraulic problems as well as multi-physics simulations at the nodal and pin level. On the single physics side, thermal-hydraulic CTF solutions have been compared against measured data for rod bundle, fuel assembly, and full core, as well as code-to-code vs. FLICA4 solutions. CTF was tested in the simulation of the TVSA-5T VVER mini-assembly experiments and in the full-core steady-state calculation for the ongoing OECD/NEA Rostov-2 benchmark. For the TVSA-5T calculations, CTF was coupled with the uncertainty analysis tool Dakota and utilized to propagate uncertainties of input and boundary conditions to output quantities of interest for thermal-hydraulic parameter investigations. The CTF results and measured data obtained from this experimental setup were compared for validation. To produce reliable pin-resolved reference solutions for multi-physics model testing the high-fidelity continuous energy Monte Carlo-based neutron transport codes MCNP6.2 and Serpent 2.2.0 were separately coupled with the CTF sub-channel code. Coupled models of a VVER-1000 fuel assembly were tested in comparisons between MCNP/CTF and Serpent/CTF results. Coarse-mesh multi-physics solutions for a full core have been obtained with the coupled COBAYA/CTF, COBAYA/FLICA4, and PARCS/CTF codes. These solutions have been compared against steady-state plant data and code-to-code for transients. High-fidelity pin-resolved solutions with SERPENT/CTF serve as reference solutions in a steady state. The outcomes from the various studies of single-physics and multi-physics cases used for CTF verification and validation met the initial expectations both qualitatively and quantitatively. The results of the numerical verification and experimental validation are in good agreement with the corresponding reference data.
1 Introduction
In ensuring the safety of a nuclear reactor design, achieving reliable assessments for both steady-state and transient conditions is a priority. These assessments can be carried out by either experimental work or computational simulations. The high cost involved in full-scale experiments has led to continuous developments of best-estimate codes using the best available modeling and simulation methods that are economically more attractive for many applications.
These so-called “best-estimate” codes have taken the place of traditionally over-conservative approaches by utilizing minimum conservatism in input data and minimizing conservative modeling assumptions. These codes become beneficial when remaining inaccuracies in modeling or numerical errors in the results of calculations are appropriately identified and quantified. Validation and verification processes supplemented by uncertainty estimation are key to providing evidence that a developed code system is suitable for specific use.
CTF is an advanced best estimate code (Salko and Avramova, 2016) that has been continuously developed and maintained by the Reactor Dynamics and Fuel Modelling Group (RDFMG) at North Carolina State University (NCSU) in cooperation with Oak Ridge National Laboratory (ORNL) for thermal-hydraulic (TH) simulations of nuclear reactor vessels with modeling detailed flow and temperature distribution at the sub-channel level. CTF has been verified, validated, and extensively used for steady-state and transient simulations for light-water reactors (LWRs). The United States Department of Energy (U.S. DOE) initiated the Consortium for Advanced Simulation of Light Water Reactors (CASL) program in 2010, and CTF was adopted in the program to account for core thermal-hydraulic modeling and simulation as a complementary part in the Virtual Environment for Reactor Applications Core Simulator (VERA-CS). Some improvements were made to CTF during the CASL program, including, for example, the development of a PWR preprocessor utility for fast input generation, visualization capabilities by generating VTK output files for square lattices, fully distributed memory parallelization, and an automated system testing with built-in test units (Kucukboyaci et al., 2015).
The capabilities of CTF were investigated by (Sung et al., 2015) for a main steam line break (MSLB) accident scenario in a pressurized water reactor (PWR), following the software optimizations and improvements. The departure from nucleate boiling (DNB) predictions obtained for a bundle model was compared to experimental data from the PWR Sub-channel and Bundle Test (PSBT) provided by the Nuclear Power Engineering Corporation (NUPEC) of Japan (Rubin, et al., 2012). The CTF predictions were also compared to the results computed by another thermal-hydraulics code, VIPRE-W, for the same bundle model. The results show that the CTF followed the same trend as experimental data and the VIPRE prediction. Additionally, a Westinghouse 3-loop PWR full core model was developed at a sub-channel level in the same study to evaluate the reactor core power distribution during an MSLB accident assumed to have occurred in one of the three loops. For this case, CTF predicted coolant and fuel conditions like the predictions made by the Westinghouse sub-channel code THINC IV.
CTF has been used in many studies either as a single physics (core thermal-hydraulics) assessment of core designs or as part of a multi-physics calculation used to provide thermal-hydraulic feedback. Some of these applications included code-to-code comparisons for the void distribution exercises found in OECD/NRC PSBT benchmark (Avramova et al., 2021) and in OECD/NRC Boiling Water Reactor Full-Size Fine-Mesh Bundle Test (BFTT) benchmark. The works were carried out for square lattice core geometries representative of PWRs and boiling water reactors (BWRs).
In cooperation with the Institute for Nuclear Research and Energy (INRNE), Bulgarian Academy of Sciences, CTF has also been improved for triangular/hexagonal lattice calculations by implementing critical heat flux correlations and tables, and by the capability to solve fluid conditions considering triangular sub-channel or hexagonal channel descriptions. In (Papadionysiou Marianna et al., 2022) CTF was coupled with the neutron transport code nTRACER for high-fidelity VVER analysis, where CTF was embedded as a library in the nTRACER. CTF provided the temperature profiles of coolant and fuel, along with coolant density to nTRACER in exchange for power profiles calculated by nTRACER. CTF has recently received additional modifications for hexagonal geometry applications for sodium fast reactors (SFRs) by (Takasugi, 2023; Aly Ahmed Mohamed Nabil Hassanein Multi-scale Multi-Physics Modeling of, 2022).
This paper summarizes the cooperation activities between NCSU and the Institute for Nuclear Research and Energy (INRNE), Bulgarian Academy of Sciences, on model improvements, verification and validation, and uncertainty analysis of CTF for triangular/hexagonal lattice calculations in VVER applications.
The authors applied CTF to the VVER geometry and conducted comparative verification and validation (V&V) analyses with measured data and other codes. New multi-physics couplings and test results are reported. Code improvements include enhanced functionalities for the VVER geometry, enhanced computational efficiency, and a VVER-specific closure law based on tables of measured rod bundle data. The CTF functionalities were enhanced by a pre-processor and a post-processor for hexagonal assemblies and triangular lattices, embedded in the source code. CTF parallelization was tested for VVER cores. A new option in DNBR calculation based on a VVER lattice-specific experimental table has been implemented in CTF.
Since the research content of this paper is extensive, here we provide an explanation of why each section is necessary and how they relate to each other.
Section 2 described the theory and models behind CTF and VVER-related modifications introduced, such as implementing critical heat flux correlations and tables, and the capability to solve fluid conditions considering triangular sub-channel or hexagonal channel descriptions.
Section 3 focuses on CTF standalone (single physics) applications, including verification, validation, and uncertainty and sensitivity analysis.
Modifications continue to be made in CTF relating to properties and correlations for hexagonal light water geometries that need to be verified and validated. Under this scope, this paper focuses on demonstrating CTF’s capabilities on hexagonal VVER core models using two versions of CTF - CTF3.5 and CTF4.3 of the code. Contrary to CTF3.5, CTF4.3 includes some additional features such as pre- and post-processing of hexagonal geometry and an improved coupling interface. However, both versions use the same solution methods and include the same modifications for VVER models, such as a new option for DNBR calculation. This added option is based on a VVER lattice-specific experimental table. Thus, using either version does not affect the obtained results. From this point onward, “CTF” will be used to refer to CTF3.5 and/or CTF4.3 for the remainder of the paper.
The typical and specific features of the VVER-1000 hexagonal fuel assemblies of TVSM, TVS-2M, and TVSA types were used for testing the existing and new CTF functionalities for VVER hexagonal fuel assemblies modeling and simulation.
The studies shown herein are mainly divided into two sections: studies done with CTF as a single physics thermal-hydraulics tool and the studies done with CTF in coupled codes developed with various neutronics codes to be used in multi-physics calculations for steady-state and transient calculations.
2 CTF code package
As mentioned above, the thermal-hydraulic best estimate code CTF, developed and maintained by the RDFMG at NCSU in cooperation with ORNL, is a state-of-the-art modernized version of COBRA-TF (Coolant Boiling in Rod Arrays-Two Fluid). CTF solves conservation equations for mass, energy, and momentum for liquid and vapor phases, known as the two-fluid model, for operational and transient conditions, and is capable of modeling both channel-centered and fuel-centered sub-channel models.
A sub-channel is a vertical stack of mesh cells that represents a fluid volume of any kind of vertical flow path, typically defining flow within reactor cores in one of two ways: a fuel-centered sub-channel surrounded by coolant, or a coolant-centered sub-channel with fuel rods located along the boundary. Lateral exchanges between the adjacent sub-channels and axial flow through each sub-channel are considered by the mathematical model. The conservation equations are given in Equations 1–3 for mass, momentum, and energy, respectively, and are solved considering the transition between fluid phases. In Equation 1, the subscript
In Equation 2, the left-hand side represents the change of volume momentum with time and advection of momentum in each direction. The right-hand side, in respective order, represents gravitational force, pressure force, viscous and turbulent shear stress, momentum source, the drag force at the interface between different phases, and momentum transfer caused by turbulent mixing. While presented in the equation, it should be noted that turbulent shear stress is not implemented in CTF. The effects of turbulent mixing are accounted for by turbulent diffusion approximation.
The change of energy with time of phase
The more detailed and expanded version of generalized conservation equations in Cartesian forms are written out explicitly in the CTF Theory Manual (Salko and Avramova, 2016). According to geometry modelled, such as modeling hexagonal or triangular lattices, Equations 1–3 are solved accordingly based on inputs by the user.
CTF has been extensively verified and validated for applications of PWRs and BWRs. More recently, it has been expanded for hexagonal geometry LWRs, with modifications and validation of CTF to analyze VVERs implemented within the last decade. For instance, a recent addition is implemented in CTF based on a VVER lattice-specific experimental table for DNBR calculations. All these improvements have included the development of models, enhanced computational efficiency, as well as enhanced software quality and associated quality assurance procedures and documentation.
Previously, the visualization ability of CTF results for PWR core designs was integrated into the VERA-CS environment with the visualization toolkit (VTK) output option in CTF. Similarly, some recent modifications have been made to CTF to generate VTK output file for VVERs. This option can be enabled by describing coordinates of mesh vertices in the CTF input file. This, however, can be prone to human errors for large geometries to be modelled manually. An existing hexagonal-geometry LWR preprocessor previously developed by Karlsruhe Institute of Technology (KIT) for CTF (Jimenez, 2015) was adapted to automate the input. This CTF preprocessor required modification due to updates in CTF4.3. Since the development of this preprocessor, updates in CTF have changed the input formatting which is accounted for in the adapted version. This led to the highly modified hexagonal lattice bundle pre-processor based on geometry, boundary conditions and nodalizations which provides the necessary information for VTK output generation. The preprocessor manages the bulk of error-prone work relating to geometry and sub-channel connections. Since its initial development, this preprocessor has been extended to full core preprocessing, including the option to generate parallelized CTF inputs, with multiple assemblies and additional sub-channel-to-sub-channel connections to consider interactions between the assemblies (Takasugi et al., 2021).
In addition, modeling and simulation of typical and specific features of several VVER-1000 assembly designs (for example, TVSM, TVS-2M, and TVSA assembly designs) as well as testing of the existing and new functionalities for VVER hexagonal fuel assemblies have been considered throughout this study.
The new additions in CTF were tested by modelling a VVER-1000 reactor core at sub-channel level. Specifications of the ongoing Rostov-2 Benchmark by OECD/NEA (Avramova, et al., 2021) were utilized in this model, considering both Hot Zero Power (HZP) and Hot Full Power (HFP) conditions. Guide and central instrumental tubes were modeled as fuel rods with zero power generation. The active fuel height was divided into 68 axial nodes to prevent large changes between adjacent nodes when considering the axial heights of spacer grids and their locations. Figure 1a shows the coolant density while Figure 1b depicts temperature distributions obtained for HFP conditions in the full core. These results demonstrate the capability to perform full core calculations for a VVER at sub-channel level and illustrate the results using the new VTK output option.
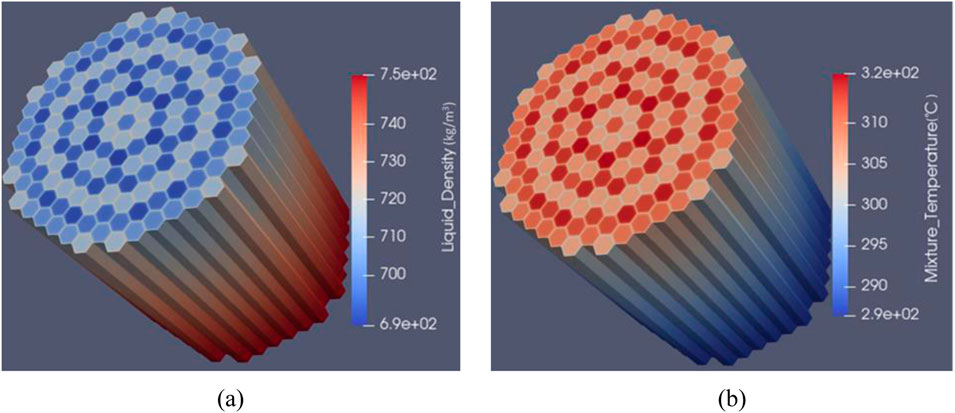
Figure 1. Coolant properties for HFP condition; (a) Coolant density and (b) Coolant temperature, respectively.
3 Single Physics applications
In this section, CTF is utilized standalone as a single physics code. The results obtained on coarse and sub-channel meshes for single assembly and full core are compared with reference data. Results for TVSM, TVSA-5T, and TVS-2M assembly types are discussed.
CTF thermal-hydraulic solutions for VVER-1000 core subsets and full core have been tested against measured data and code-to-code against FLICA4 solutions (Spasov et al., 2014; Mitkov, 2022). FLICA4 (Fillion et al., 2011) is a 3D core thermal-hydraulics code of CEA with sub-channel capabilities.
CTF was also coupled with the statistical analysis tool Dakota to predict the uncertainties in outlet coolant temperatures at each sub-channel by propagating the uncertainties in inlet and boundary conditions for a VVER-type experimental facility consisting of 19 fuel rods.
3.1 Test results for Kozloduy-6 TVSM assemblies and core
3.1.1 Comparison to measured design data
A detailed description of the TVSM assemblies of Kozloduy-6 can be found in (Kolev et al., 2006; Kolev et al., 2007).
Table 1a shows the comparison of the CTF coarse-mesh computed vs. design core pressure drop over the heated length, for a Kozloduy-6 core with TVSM assemblies at hot full power (HFP).
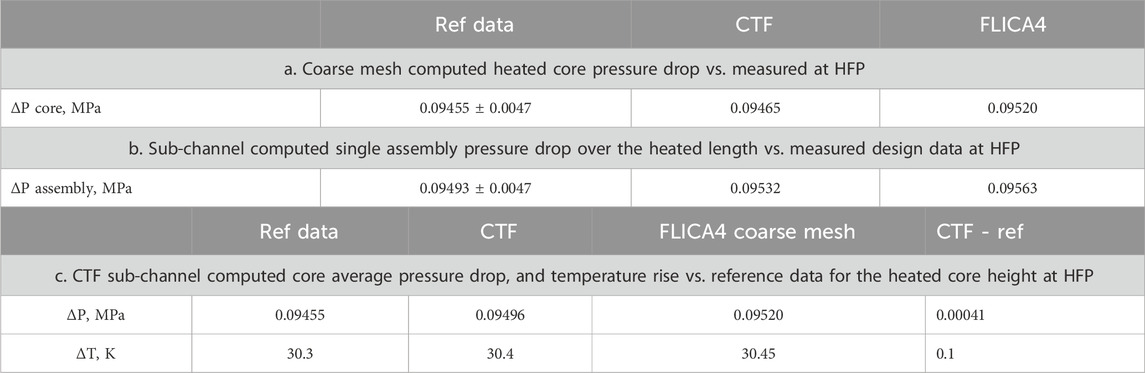
Table 1. Computed vs. measured data at HFP.
Table 1b illustrates the comparison of the CTF sub-channel computed vs. measured assembly pressure drop over the heated length at HFP.
Table 1c shows preliminary full-core sub-channel computed results for the average core pressure drop and temperature rise vs. design reference data. In this calculation, the core average axial power distribution is as obtained from a coupled COBAYA3/COBRA3c calculation (Spasov et al., 2012 ) at hot full power, and the radial core power distribution is assumed uniform. The latter assumption is acceptable as the measured design data (Kozloduy NPP Report, 1987) have been obtained on assembly and core mock-ups with similar conditions.
These results have been obtained with the following modeling assumptions in CTF for discretization and correlation choice:
a) Full-core coarse-mesh CTF solution.
• Two-fluid, three-field quasi-3D flow model with one channel per assembly and inter-assembly cross-flow.
• 30 axial nodes in the heated core.
• 10 radial nodes in the fuel, 1 for the gas gap, and 1 for the cladding.
• Temperature-dependent thermal-physical properties of the fuel and cladding.
• Spacer grids are taken into account by vertical pressure loss coefficients.
• The bypass of 2.2% through the CR guide tubes is accounted for by decreasing the active coolant flow. No heat transfer at the guide tube walls.
• Single-phase mixing coefficient according to Rogers and Rosehart, two-phase multiplier according to Beus.
• Chen’s model of nucleate boiling.
• Westinghouse-3 general-purpose DNB correlation with non-uniform axial power distribution.
b) Single assembly sub-channel CTF solution.
• Two-fluid, three-field flow model.
• Coolant-centered radial mesh with 660 sub-channels per assembly (see Figure 2a). The mesh is non-uniform with triangular cells in the interior and rectangular and trapezoidal cells at the assembly periphery.
• 30 axial nodes in the heated core.
• Fuel model with 9 radial rings in the fuel, one for the gas gap, and one for the cladding.
• Temperature-dependent thermal-physical properties of the fuel and cladding.
• Spacer grids are not explicitly modeled and are considered by vertical pressure loss coefficients.
• The bypass of 2.2% through the CR guide tubes is considered by decreasing the active coolant flow. No heat transfer at the guide tube walls.
• Single-phase mixing coefficient according to Rogers and Rosehart, two-phase multiplier according to Beus
• The horizontal pressure loss coefficient is 0.5.
• The user-defined two-phase mixing coefficient is 0.01.
• Chen’s model of nucleate boiling.
• W-3 general-purpose DNB correlation with non-uniform axial power distribution.
c) Full-core CTF sub-channel solution.
• Non-uniform coolant-centered radial mesh with 660 sub-channels per assembly.
• 30 axial layers in the heated part of the core.
• 3 227 400 cells in the 3D spatial mesh.
• 10 radial rings in the fuel pellet, 1 for the gap, and 1 for the cladding. The central hole is considered. Conduction only in the radial direction is considered.
• Temperature-dependent thermal-physical properties of the fuel and cladding.
• Cross-flow between the sub-channels in each assembly.
• No cross-flow between fuel assemblies, across the inter-assembly water gap (for this preliminary solution).
• The spacer grids are not explicitly modeled. They are taken into account through the vertical pressure loss coefficients.
• Use of rod friction factor correlation.
• The bypass through the water rods is not considered is taken into account by decreasing the active coolant flow.
• The user-defined two-phase mixing coefficient is 0.01.
• The horizontal pressure loss coefficient is 0.32555.
• Chen’s model of nucleate boiling.
• Constant gap conductance coefficient corresponding to burnt fuel and equal to 3070 W/m2 K.
• Radiation heat transfer is not modeled.
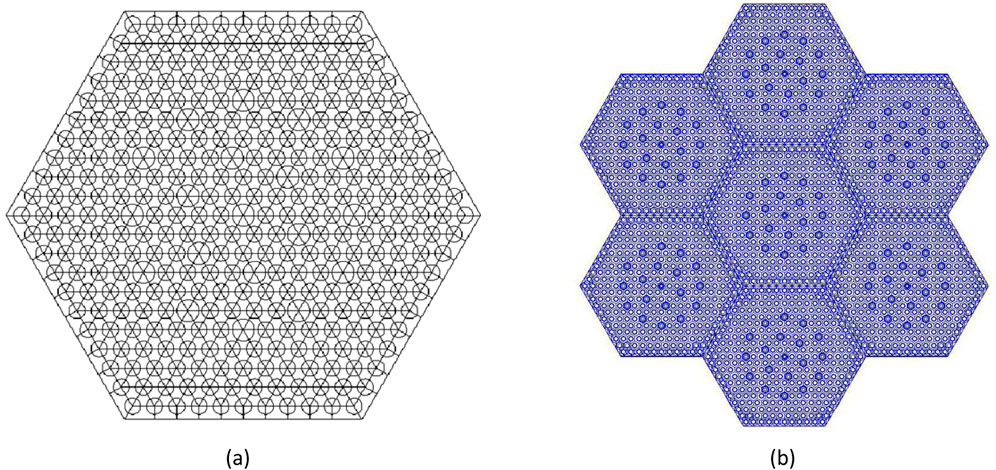
Figure 2. (a) Coolant-centered sub-channel mesh for a VVER-1000 fuel assembly; (b) Mini-core domain of computation.
The FLICA4 results have been obtained with the following modeling assumptions, chosen to be as close to the CTF ones as possible:
• Four-equation, fully 3D flow model
• Uniform mesh-centered triangular mesh with 726 radial cells at sub-channel level
• 30 axial layers in the heated part of the core
• 10 radial rings in the fuel pellet, 1 for the gap, and 1 for the cladding
• Same gap conductance coefficient as in the CTF calculation
• The bypass through the water rods is not considered and is taken into account by decreasing the active coolant flow
• Jens-Lottes model of nucleate boiling and Groeneveld CHF correlation.
The above CTF and FLICA4 modeling assumptions hold for all thermal-hydraulic and coupled neutronic/thermal-hydraulic (N/TH) solutions for Kozloduy-6 cores with TVSM assemblies reported in this study.
The CTF results in Table 1 show good agreement with the reference data and the FLICA4 solutions, both at the assembly-channel and sub-channel level.
3.1.2 VVER assembly thermal-hydraulic benchmark solution
The assembly TH boundary condition problem is derived from the OECD/NEA VVER-1000 MSLB benchmark (Kolev et al., 2016) and is part of the LWR UAM Benchmark, Phase II: Case III-3b (Hou Jason Benchmark for Uncertainty Analysis in Modelling for Design, 2019). The task is to calculate the single assembly thermal-hydraulic parameters on a sub-channel mesh along with the associated uncertainties, given the time-dependent inlet and outlet boundary conditions, and assembly power. In this work, it is used for code-to-code comparison of sub-channel solutions. The boundary conditions include the assembly inlet temperature boundary condition (Figure 3b), the assembly inlet mass flow rate boundary condition, the assembly outlet pressure boundary condition, and the time history of the assembly power (Figure 3a). To obtain a more interesting test with higher vapor void fractions, the original MSLB assembly inlet temperature BC has been modified as shown in Figure 3b, so that the inlet temperature is higher than in the original condition.
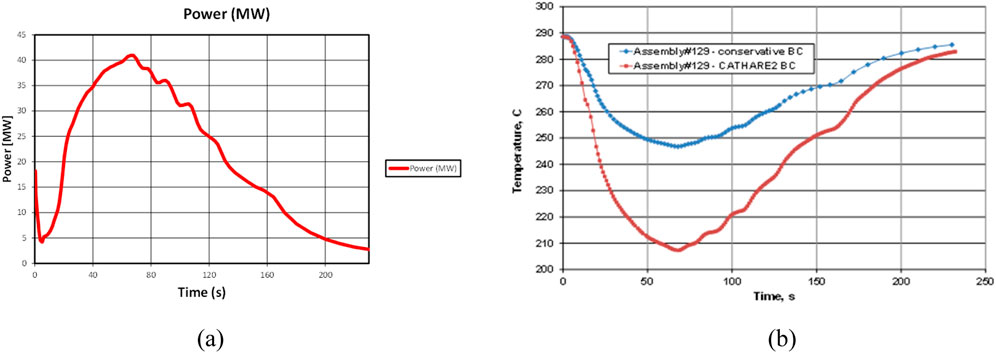
Figure 3. (a) Time history of the assembly power; (b) Assembly inlet temperature boundary condition.
Computed results (Mitkov, 2022) for the vapor void fraction at peak power are illustrated in Figures 4a, b.
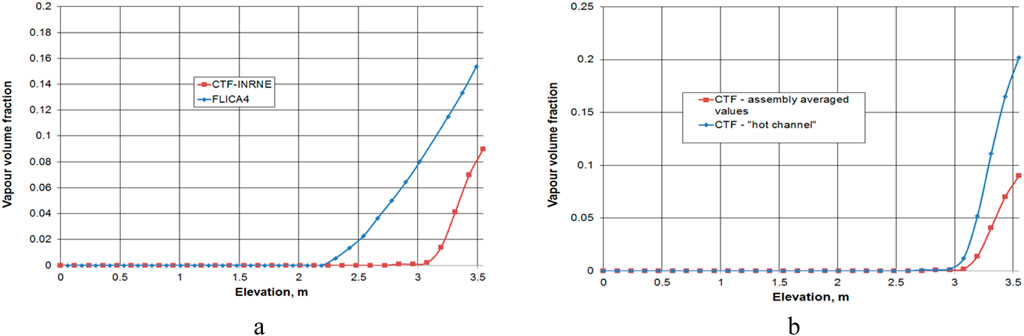
Figure 4. (a) Bundle averaged CTF vs. FLICA4 sub-channel solutions for the void fraction axial distribution at peak power; (b) CTF computed hottest sub-channel vs. bundle averaged CTF sub-channel solutions for the assembly void fraction.
Figure 4a shows the CTF vs. FLICA4 bundle averaged sub-channel computed assembly void fractions. The differences, which are larger in the sub-cooled boiling region, can be explained mainly by the different nucleate boiling models and to some extent by the different flow models. This comparison is only for illustration. The Chen correlation (Chen, 1966) is considered to be more accurate than the Jens-Lottes one (Jens and Lottes, 1951) and is relatively successful for applications with flow parameters as in the above test case. The Jens-Lottes correlation was the only option in the available FLICA4 version. It over-predicts the values of heat transfer coefficients for such flow conditions as it is derived for moderate flow velocity, where there is no suppression of nucleate boiling. The Chen superposition correlation calculates separately the heat transfer coefficients due to forced convection and vapor generation and adds them together: hchen = hfc + hnb. The forced convection term contains a factor Fchen used to account for the enhanced forced convection caused by bubble formation and departure. For sub-cooled nucleate boiling Fchen = 1. The second term contains a suppression factor Schen for forced convective boiling at high velocities where the boundary layer is small and temperature gradients are steep.
In CTF, in addition to the overall heat transfer from the wall to the liquid, the near-wall condensation heat transfer is also taken into account (Salko and Avramova, 2016). The net condensation heat flux is calculated as qcond = qhn - qspl. Here qhn is the heat flux into the liquid considering the condensation of all near-wall bubbles, calculated by the Hancox-Nicoll correlation (Hancox and Nicoll, 1971), and the wall heat transfer to single-phase liquid qspl is obtained by the Dittus Boelter equation (Dittus and Boelter, 1930) with the subcooled liquid properties used in the equation.
A number of modifications of the Chen correlation have been proposed by different authors, mostly by refining the Schen parameter to extend the application range to high heat fluxes and high mass fluxes, see for example, the discussion in (Yan et al., 2015). For rod bundles, the Chen-like and other recent nucleate boiling models are yet to be verified.
Figure 4b shows the CTF computed hottest sub-channel vs. bundle averaged sub-channel solutions for the assembly void fraction. The results illustrate the impact of the higher resolution on the assessment of local TH parameters.
3.1.3 Single assembly vs. mini-core sub-channel solutions
Comparisons of single-assembly and multi-assembly sub-channel solutions for strongly disturbed cores in reactivity transients show that taking into account the environment of the considered assembly is important for the accurate assessment of the local core safety parameters. A computationally efficient way to do this is the solution of mini-core TH problems, extracted from a preceding full-core nodal N/TH calculation.
In the present study, a VVER mini-core of 7 assemblies consisting of the hottest assembly and the surrounding 6 assemblies, as shown in Figure 2b, is considered. A postulated VVER-1000 MSLB accident with 8 stuck rods after scram is assumed, as summarized in Section 3.3 below. The core conditions correspond to the highest return to power after scram. Single hot assembly and mini-core boundary condition (BC) problems are solved with pre-calculated assembly-wise TH BCs and assembly-wise power and axial power distributions as obtained from the full-core nodal solution (see Figure 5a). The axial and radial power distributions are obtained from a coupled COBAYA/CTF transient solution at the nodal level (Mitkov et al., 2018; Mitkov et al., 2021). In this calculation, the radial pin power distribution is approximately taken as at HFP.
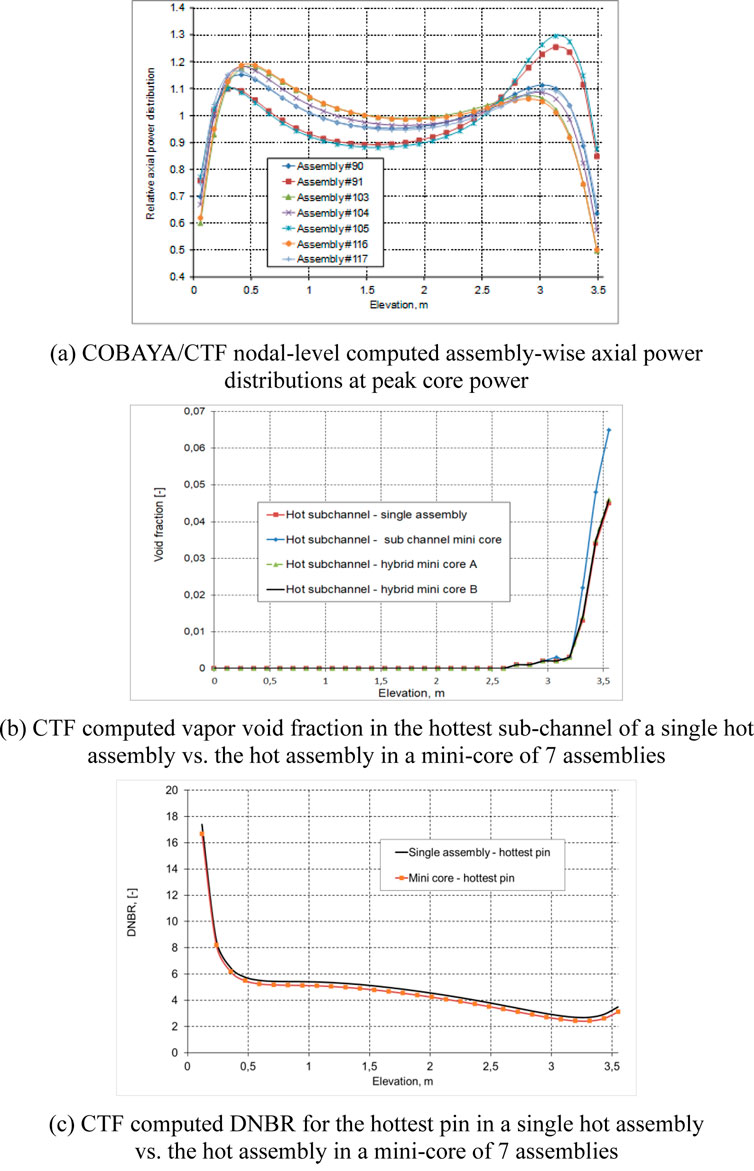
Figure 5. CTF channel and sub-channel results. (a) COBAYA/CTF nodal-level computed assembly-wise axial power distributions at peak core power. (b) CTF computed vapor void fraction in the hottest sub-channel of a single hot assembly vs. the hot assembly in a mini-core of 7 assemblies. (c) CTF computed DNBR for the hottest pin in a single hot assembly vs. the hot assembly in a mini-core of 7 assemblies.
Figures 5b, c below illustrate a comparison of local core parameters obtained from CTF sub-channel TH solutions of single hot assembly vs. 7-assembly mini-core BC problem. The results show more conservative values of the local core safety parameters when the assembly environment is considered.
A more accurate approach would be a further development to solve a coupled pin-cell multi-physics boundary condition problem for the mini-core considered, with lateral assembly boundary conditions extracted from the nodal core solution.
3.2 Test results for the TVSA-T5 experiments
Best estimate codes become more useful where inaccuracies in modelling or numerical errors in result calculations are pointed out. This can be done by combining the best estimate codes with uncertainty analysis. Best Estimate Plus Uncertainty (BEPU) is a procedure to evaluate uncertainties by quantifying the errors in resulting calculations. Under this framework, CTF was coupled with the statistical analysis tool Dakota to predict the uncertainties in outlet coolant temperatures at each sub-channel by propagating the uncertainties in inlet and boundary conditions for a VVER-type experimental facility consisting of 19 fuel rods. Dakota (Adams, et al., 2014) developed by Sandia National Laboratories (SNL), is a software used for optimization and uncertainty quantification using sampling or stochastic expansion methods.
3.2.1 Description of the TVSA-T5 experiments
The coupling of CTF and Dakota was done for the specific application of developing the necessary uncertainty propagation framework for the experimental setup used in Exercise II 3 (6a/6b) of the OECD/NEA Uncertainty Analysis in Modeling (UAM) Light Water Reactor (LWR) Benchmark Phase II (Hou, et al., 2022).
The TVSA-T5 experimental facility was utilized to analyze the local temperature distribution of coolant within fuel rod cells in a scaled-down VVER-type fuel assembly with 19 heated rods. Stainless steel tubes heated by electrical power were used to simulate the heat production of nuclear fuel rods. Experiments were carried out at various inlet coolant temperatures, input powers, pressures and flowrates with measurements taken of coolant temperature at different radial positions at the assembly outlet. The set of conditions selected for testing the developed Dakota/CTF coupling and the experiment coolant temperatures measured at various sensor locations are provided in Table 2, respectively.
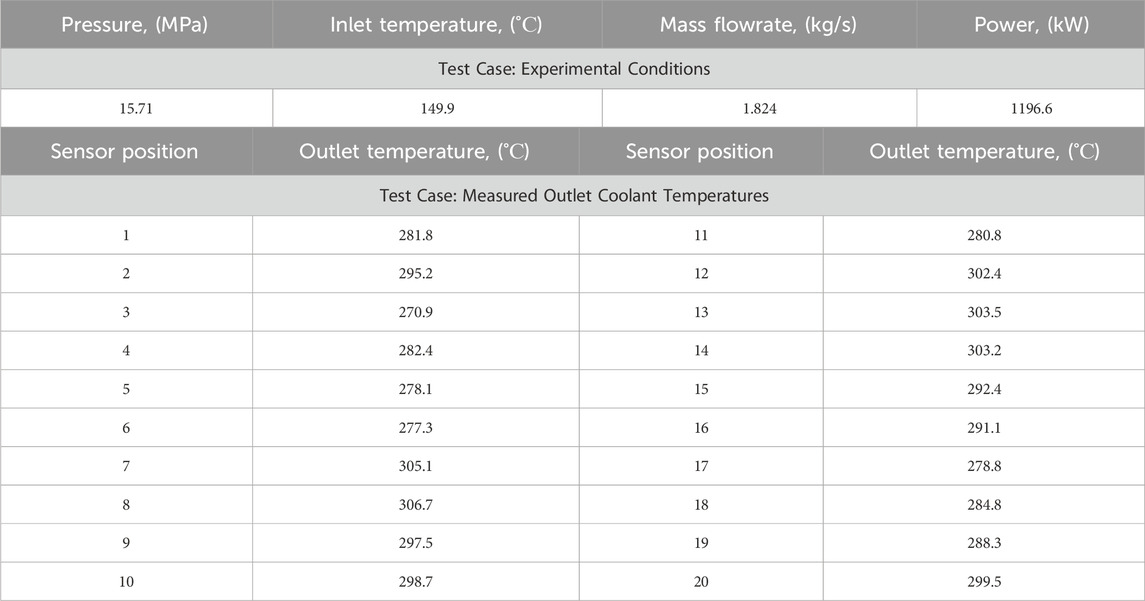
Table 2. Test case: experimental conditions and measured temperatures.
Figure 6a shows the location of rods and temperature sensors. The geometric specifications and axial positions of the spacer and support grids are provided in Figure 6b. The heated length of the experiment is 3000 mm, with spacer grids equally spaced over the axial assembly height.
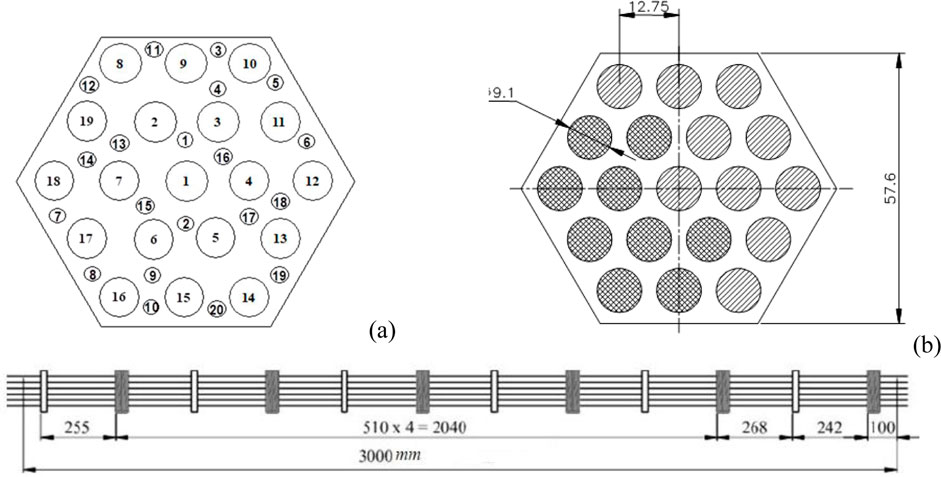
Figure 6. (a) Radial visualization of TBCA-T5 temperature sensor locations; (b) TVSA-T5 geometric characteristics and axial view of spacer and support grids.
The input radial pin power distribution for the test case is given in Table 3, with numbering corresponding to the positions indicated in Figure 6a. The axial power distribution is uniform over the heated length. The total flow area, wetted perimeter, and heated perimeter are also summarized in Table 3.
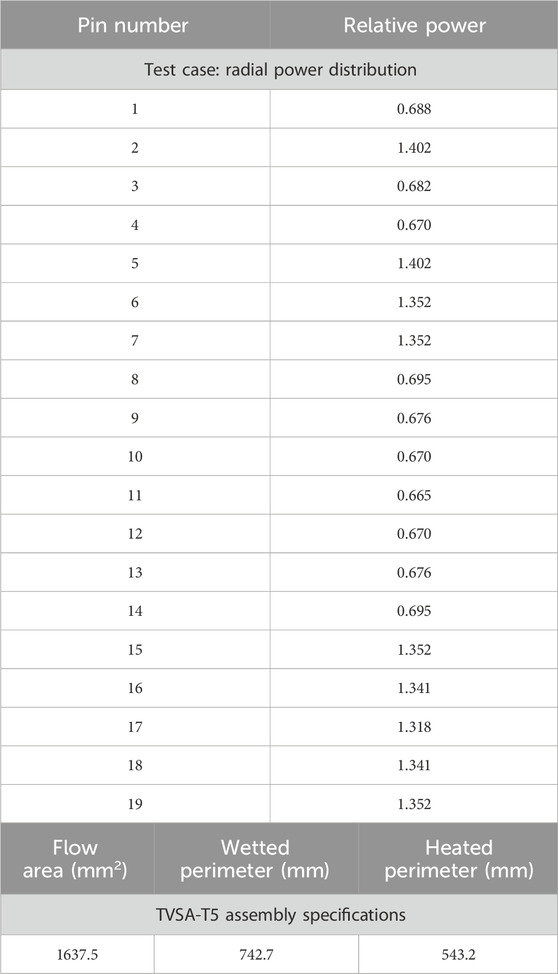
Table 3. Test case parameters.
Preliminary assessments were carried out to demonstrate Dakota/CTF’s capability to propagate uncertainty in input parameters to the coolant temperature at the exit of the assembly outlet. This study investigated the sensitivity to inlet and boundary conditions such as flow rate, inlet coolant temperature, pin power distribution, and system pressure.
3.2.2 Uncertainty analysis framework
The data provided from the experiments at the TVSA-T5 facility were sufficient to generate a model to study nominal steady-state operating conditions. However, the experimental and measurement input uncertainties associated with the data were not finalized at the time of this analysis due to ongoing benchmark specifications development. Instead, variations in core boundary conditions and manufacturing uncertainties available in the UAM Benchmark Phase II (Hou Jason Benchmark for Uncertainty Analysis in Modelling for Design, 2019) for VVER bundle thermal-hydraulics were employed as input uncertainties to demonstrate the methodology and the developed Dakota/CTF implementation.
Table 4 shows the input distributions that were sampled for the inlet and the boundary conditions, and their probability distribution functions, which are bounded in three standard deviations (±3σ). Single values of the system pressure, flow rate, and inlet temperature are sampled for each run. The radial power distribution sampling is performed by considering each rod separately (19 samples per run). Due to CTF requirements that the average relative radial power is equal to 1.0, a script was written to process sampled powers and normalize these before providing these radial powers to CTF.
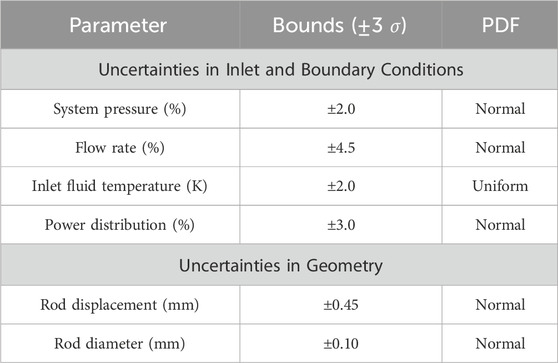
Table 4. Uncertainties in inlet and boundary conditions.
Uncertainties in rod geometry due to manufacturing variations were also considered. Considering these uncertainties in all rod geometries and their individual relative displacements would require many trials to acquire significant results. In this exercise, the displacement of only a single rod and the variation of its outer diameter are sampled, as is assumed for UAM exercises. A corner rod was chosen for uncertainty analysis regarding the displacement and rod diameter since the surrounding sub-channels have different geometries. The applied geometric uncertainties are provided in Table 4, noting that the angle of displacement is also sampled (from a uniform distribution). It is important to propagate the uncertainties to sub-channel inputs such as flow area, wetted perimeter, gap length, and gap width. Because these values are necessary for the CTF input and derived from sampled values of the rod displacement and diameter, a script was written to evaluate these after the sampling of uncertain parameters.
CTF and Dakota were coupled utilizing the black-box interfacing capability of Dakota with supporting Shell scripts to facilitate execution of scripts for intermediate calculations, CTF input generation, CTF execution, and results extraction. The files created to facilitate coupling are as follows.
1. Driver.sh: The primary Shell script that fills input templates, interfaces to other scripts and CTF for execution from Dakota.
2. Process_hdf5.py: Python script utilizing the CTF-SubKit tools to extract quantities of interest (QOIs) from CTF’s HDF5 output.
3. Renormal.f95: Performs the normalization of the perturbed radial power distribution for each sampled set to maintain the average relative radial power distribution at 1.0 after perturbation (requirement for CTF).
4. Rod-disp.f95: Calculates the flow area, wetted perimeter, gap length, and gap width for sub-channels near the displaced rod, considering displacement direction and magnitude as well as changes to the rod diameter.
5. CTF input templates: Several partial CTF inputs correspond to the parts of the CTF input that do not rely on the intermediate calculations of sub-channel/rod parameters. Together with the outputs of renormal.f95 and rod-disp.f95, this is combined to make the full CTF input for each set of sampled parameters.
The workflow between CTF and Dakota is illustrated in Figure 7 where input uncertainties and their distributions were supplied in the Dakota input to be used for sampling input parameters. Each Dakota-sampled parameter set is sent to the driver Shell script, which fills the CTF input templates and runs intermediate calculation scripts before compiling the CTF input. CTF is then executed via Shell script. The coolant temperature at the outlet of the assembly for the given positions of the thermocouples in the experiment, the quantities of interest (QOI) in this analysis, were sent to Dakota from CTF’s output for each sample to be summarized for uncertainty analysis by Dakota.
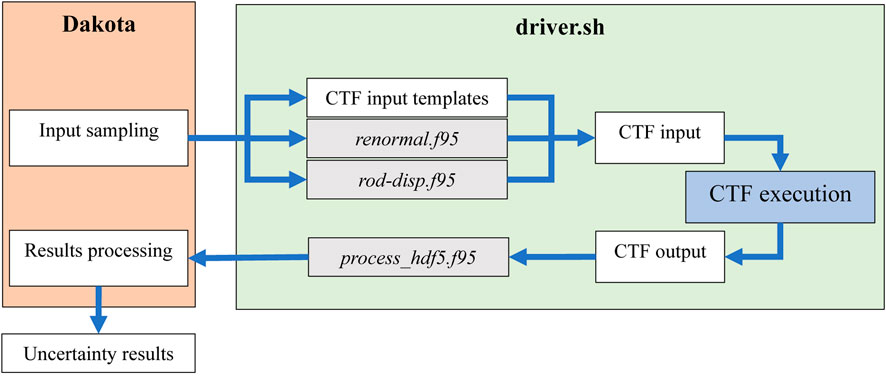
Figure 7. Dakota/CTF coupling flowchart.
This study considers random sampling of input uncertainties for the uncertainty propagation to QOI responses. Random sampling can be done in different ways in Dakota, via Monte Carlo (MC) sampling or Latin Hypercube sampling (LHS). Instead of using MC sampling, this project utilized LHS for the input uncertainties to guarantee coverage of the range of the sample space for the given probability distribution, which also reaches the same precision of the MC sampling but with a smaller cost in sample size.
3.2.3 Sensitivity and uncertainty results
The inlet temperature, flow rate, system pressure, rod displacement (magnitude and direction), rod diameter, and individual relative powers for each of 19 rods are sampled in each of 2000 runs. The effect of each input parameter on the responses (outlet coolant temperatures at specified thermocouple locations) was investigated. Dakota provides asynchronous execution to run multiple evaluations simultaneously. For this case, 50 simultaneous evaluations were run in parallel for the 2000 sample sets. This sample size was found to produce 95% confidence intervals with a relative difference between upper and lower confidence intervals of less than 0.1% in the mean and approximately 6% in the standard deviation of considered output uncertainties.
In addition to providing uncertainty estimates for the outputs based on QOI result data, this random sampling also gives important information regarding sensitivity, summarized by correlation coefficients. Pearson and Spearman correlation metrics are utilized to evaluate the impact of the uncertainties in the input parameter on the QOIs. The Pearson and Spearman correlations are calculated based on Equation 4 where
The Pearson correlation is related to how linearly correlated the input and output are, while the Spearman correlation measures how the input and output are monotonically related. The Spearman rank correlation removes some effects due to outliers and differences in scale. Partial correlation coefficients can be used to isolate the effects of interdependent variables. Although it is recommended that Spearman correlation be used due to its ability to assess correlation based on non-linear relationships, the correlation between the various input parameters and the outlet coolant temperatures is obtained using both Spearman and Pearson metrics.
3.2.3.1 Inlet and boundary condition sensitivities
The correlations between the outlet coolant temperatures corresponding to changes in the inlet coolant temperatures and the flow rate are shown in Figure 8a, b, respectively (note the scale of the axes). Besides, observing that the Pearson and Spearman correlations are close to each other, the outlet coolant temperature is strongly sensitive to uncertainties in both input parameters. As expected, the hottest sub-channels are slightly less sensitive to the inlet temperatures since they are next to rods with high-power generation. However, there is a strong positive correlation in all channels between the inlet and outlet coolant temperatures. Conversely, the coolant flow rate has a strong negative correlation to the outlet coolant temperature. The system pressure is found to have only a small positive correlation to coolant outlet temperatures, as shown in Figure 8c. Apparent differences observed in this figure between the two correlation methods may be attributed to the scale of comparison; relative to the possible sensitivity ranging −1 to 1, they are close to one another.
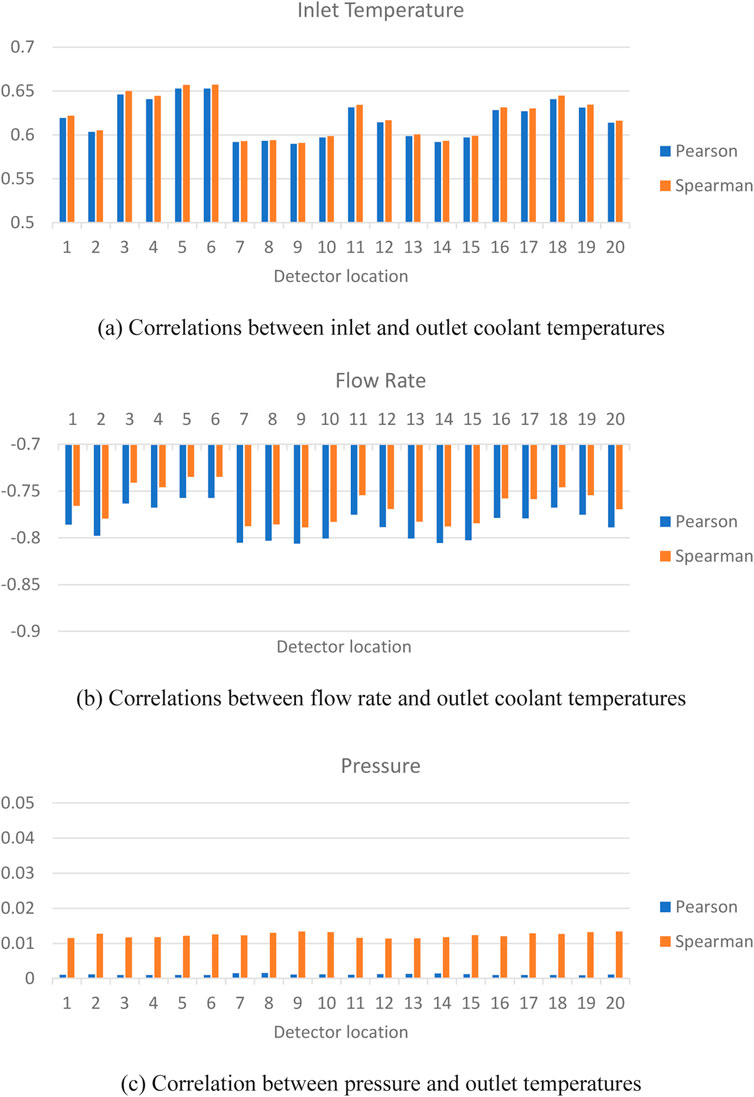
Figure 8. Correlations between boundary conditions. (a) Correlations between inlet and outlet coolant temperatures. (b) Correlations between flow rate and outlet coolant temperatures. (c) Correlation between pressure and outlet temperatures.
Figure 9a shows selected results from the relative power distribution for relative rod power adjustments made in rod #1 (numbering of rods is from left to right, bottom to top of geometry). Though the analysis includes all rods, rod #1 is selected for representative demonstration. The correlation coefficients in all cases are relatively small, however, some important trends are observed. In general, the correlations are positive for nearby detector locations. For example, detector locations #8, #9, and #10 are adjacent to rod #1, which results in a positive correlation between them. Negative correlations to distant detector locations are also observed due to the normalization process, which maintains the average relative power at 1.0. Detector locations #7 and #20 are adjacent to subchannels that are correlated positively with power changes in Rod #1. The Pearson correlation coefficient characterizes the linearity of the data, while the Spearman correlation coefficient considers whether the data has a monotonic trend. These detector locations experience dynamic responses in temperature due to their dependence on competing effects of perturbed heating of rod #1 through the adjacent subchannels and opposite changes to heating in other rods due to normalization. This results in less monotonic behavior than other detector locations, leading to a difference in Pearson and Spearman coefficient signs.
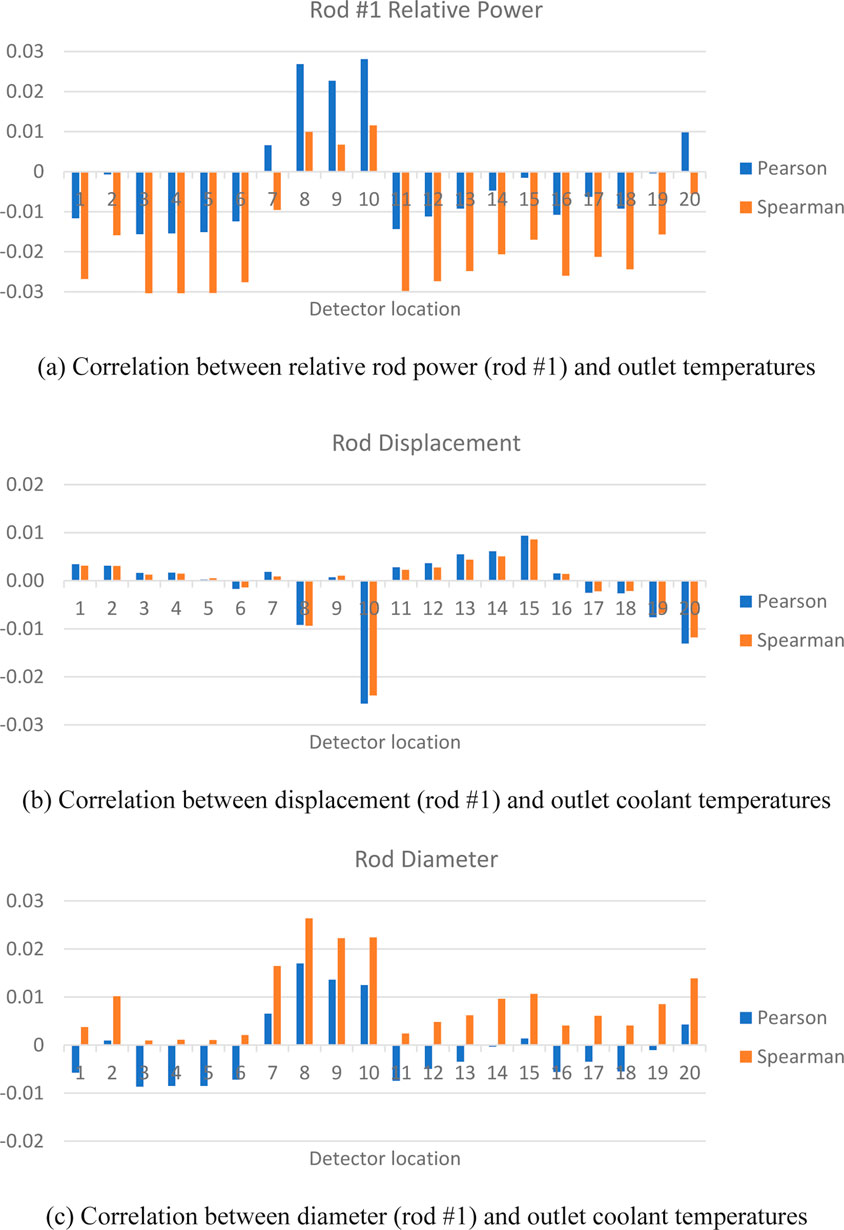
Figure 9. Correlations between rod #1 parameters and outlet coolant temperatures. (a) Correlation between relative rod power (rod #1) and outlet temperatures. (b) Correlation between displacement (rod #1) and outlet coolant temperatures. (c) Correlation between diameter (rod #1) and outlet coolant temperatures.
3.2.3.2 Manufacturing uncertainties
The correlation coefficients relating to geometrical uncertainties are provided in Figures 9b, c. Rod displacement has only a small effect on outlet coolant temperatures, mossly near the displaced rod (#1). Due to the displacement of the rod, changes in sub-channel mixing may result in varied behavior near the displaced rod, which results in non-monotonic behavior. The temperatures at the channels around the rod, which are affected by rod diameter uncertainty (rod #1) are positively correlated to diameter changes of the rod. This indicates that if the rod is wider than the other rods, the flow areas in the adjacent sub-channels are smaller than in the other ones, which causes the relative temperature to rise due to reduced cooling. In similar ways, a larger surface area would also convey more heat from the rod surface to the adjacent coolant. The different trends shown by the Spearman and Pearson approaches seen in Figure 9c can be attributed to non-linearity considered by Pearson, especially at the farthest detector locations, such as locations #3, # 4, #5, #6, and #11. However, these effects are relatively small in scale and can be considered negligible.
3.2.3.3 Output uncertainty distributions
Table 5 summarizes the uncertainty estimates obtained by the analysis of output responses of outlet coolant temperatures for the given measurement locations. The mean values correspond roughly to the power profile, having higher outlet temperatures at locations in the southwest portion of the assembly. Skewness is relatively low; however, significant kurtosis is observed. The kurtosis indicates a flatter-than-normal distribution in the outputs, which may occur because of the uniform distribution sampled for the inlet temperature distribution.
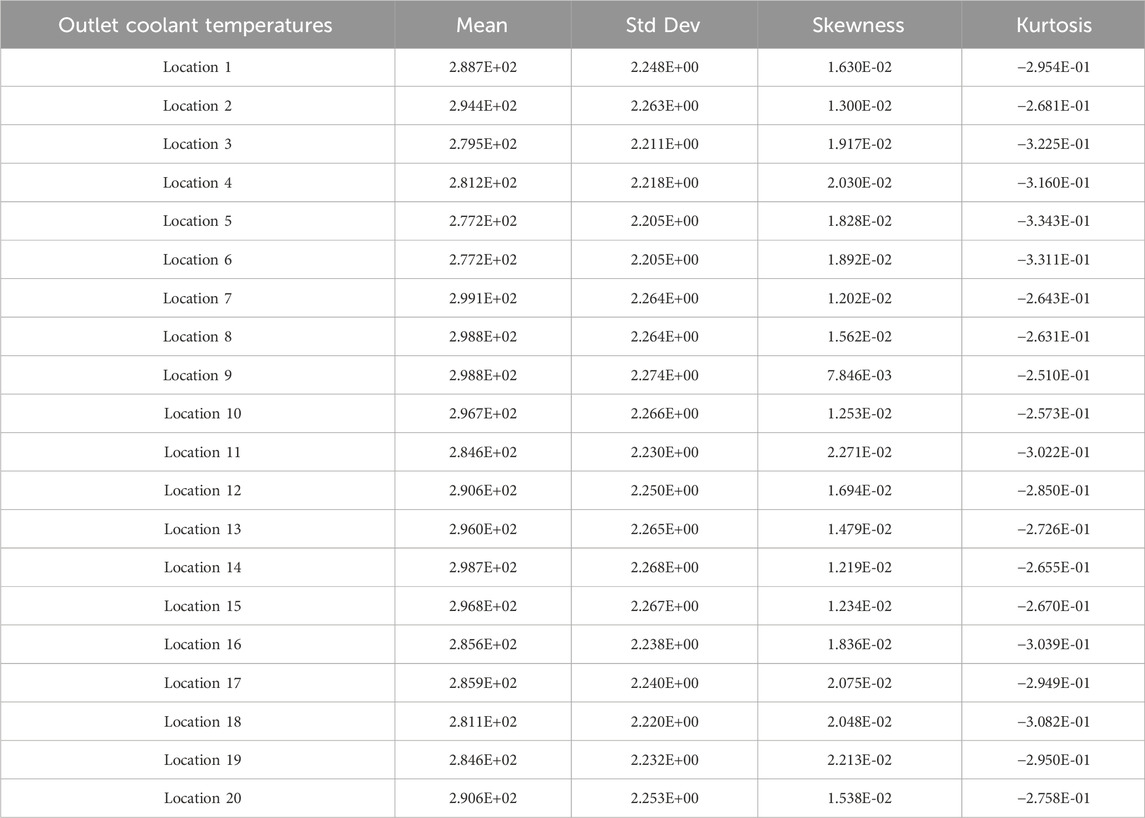
Table 5. Outlet coolant temperature uncertainty estimates.
4 Multi-physics applications
4.1 COBAYA/CTF coupling
The CTF code version has been coupled with the COBAYA core physics simulator developed at the Technical University of Madrid, Spain (Lozano et al., 2008; Lozano et al., 2010). The results obtained with the coupled code COBAYA4/CTF have been compared both with the available measured data as well as with the predictions of COBAYA3/FLICA4 coupled codes. The COBAYA3/FLICA4 coupling (Jimenez, 2009) for hexagonal assemblies is based on the coupling functions in Salome 5 (Chanaron et al., 2015) supplemented by FLICA4 routines. The COBAYA4/CTF coupling (García-Herranz et al., 2017) is based on the MED Coupling libraries in Salome 6 (www.salome-platform.org). The Python script for coupled calculation includes a damping scheme to smooth the power profile and accelerate the convergence. The power at the current time-step (n) is expressed as 0.6*P (tn-1)+0.4*P (tn) (COBAYA team, 2015).
4.1.1 COBAYA/CTF solution vs. Kozloduy-6 steady state plant data
A steady-state COBAYA/CTF solution (Mitkov, 2022) for the radial core power distribution has been compared with plant data for Kozloduy-6 Cycle 8, 270.4 EFPD, at 91% core power. The core is near the end of the cycle and contains once, twice, and three times burnt assemblies. The code coupling is at the nodal/assembly-channel level. The comparison makes part of the experimental validation of the coupled COBAYA/CTF solution along with the 2-group diffusion multi-parameter cross-section library.
The solution has been obtained with a multi-parameter cross-section library in compact NEMTAB format and with some simplifications, as generated for VVER-1000 MSLB benchmarking purposes with portability considerations. The discontinuity factors are implicit, and the reflector parameters are obtained from a 1D model.
Figure 10 shows the comparison of the computed relative assembly powers vs. plant data. The computed keff = 0.99502 which deviates from 1 by 498 pcm. The average absolute deviation in assembly powers is 2.07%, and the max deviation is within the 5% error tolerance of the core monitoring system data. The agreement with the reference is considered to be acceptable in view of the quality of the core monitoring system data and the 1D reflector data in the cross-section library.
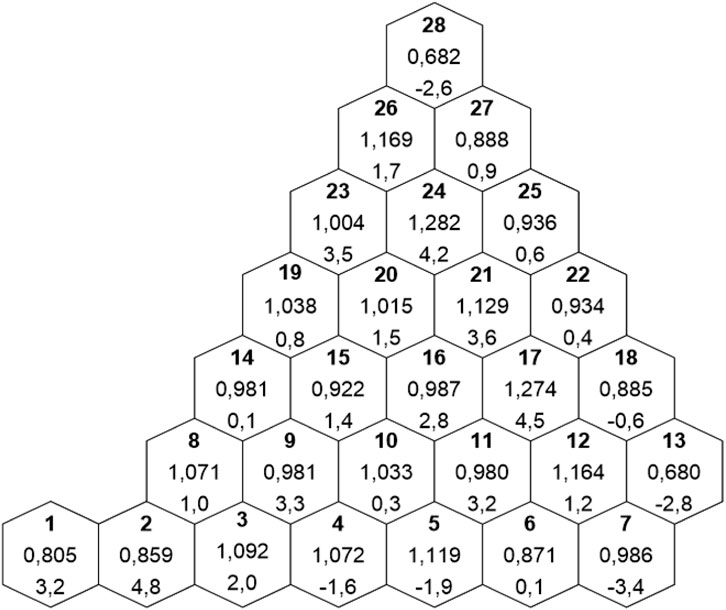
Figure 10. Comparison of COBAYA/CTF computed vs. Kozloduy-6 plant data for the relative assembly powers (δ in %).
4.1.2 OECD NEA VVER-1000 MSLB benchmark (V1000CT-2) solutions
A detailed description of the MSLB test problem is given in the benchmark specifications (Kolev et al., 2006). The reference core is a real Kozloduy-6, Cycle 8, 3-year batch core at 270.4 EFPD. The core contains once, twice, and three times burnt UO2 fuel of initial enrichment 4.23 w/o and 4.4 w/o. The plant transient is initiated at hot full power by a large guillotine-type break of steam line #4 outside the containment, upstream of the steam intercept valve. The steam generator feed-water valve in the faulted loop fails to close on the MSLB signal and remains open. The main coolant pump in the faulted loop fails to trip on the MSLB signal, and all pumps remain in operation. Two peripheral control rod clusters remain stuck out of the core after the scram. The steam generator in the faulted loop continues uncontrolled cooling till the complete evaporation of the secondary water. A cooler sector is formed at the core inlet, with overcooling of up to 80°C.
In this study, we present results from cross-verification by code-to-code comparison of COBAYA/CTF vs. COBAYA/FLICA4 nodal solutions of the core boundary condition problem (see Figures 11a–c). The core TH boundary conditions have been obtained from a validated CATHARE2.5 multi-1D 24-sector reactor vessel TH solution (Spasov et al., 2010; Spasov et al., 2017), using the reactor vessel boundary conditions from the VVER-1000 MSLB benchmark specifications (Kolev et al., 2006). This calculation used a multi-parameter two-group diffusion cross-section library generated by (Petrov et al., 2015) with the APOLLO2 Linear Surface MOC (Santandrea et al., 2008; Sanchez, 2010). For better code testing with higher return to power after scram, a modified option of the cross-section library has been generated by artificially reducing the control rod absorption cross-sections in the library so that the scram worth is reduced by about 50%. With this library, the computed return to power due to the combined action of feedback effects and the contribution of the delayed neutrons reaches 67% of the nominal rated power.
Figure 11. NEA VVER-1000 MSLB benchmark – (a) Core BC problem: Computed time history of the total core power; (b) Dynamic reactivity as computed from the 3D solutions; (c) Dynamic reactivity as computed from the 3D solutions.
The full-core nodal/assembly-channel results of COBAYA/CTF and COBAYA/FLICA4 show good agreement. The small bias is attributed mainly to the different core mixing models in CTF and FLICA4.
The FLICA4 results are obtained with a fully 3D flow model and 3D calculation of the local gradient-driven inter-assembly mixing, but without any turbulence model (turbulence is included in more recent FLICA versions). For hexagonal assemblies, CTF uses a quasi-3D calculation scheme for hexagonal assemblies to obtain the gradient-driven average mass flux between adjacent assemblies, plus a simple turbulent diffusion model.
The mixing models in the two codes have not been specifically tested vs. reference data. CTF and FLICA4 single assembly and full-core calculation models, including their single-phase flow mixing models, have been tested against available measured data for the pressure drop and temperature rise over the heated length (see Table 1). Table 1 illustrates the coarse-mesh CTF and FLICA4 computed results for the core pressure drop as compared with reference data. For both models, the agreement is very good, and the CTF results are a little closer to the reference. The same trend is seen in the sub-channel single-phase calculation results shown in Table 1.
To assess the differences between the predictions of two models, a core mixing numerical experiment at HZP was performed with FLICA4 vs. CTF to simulate the propagation of a VVER core inlet temperature disturbed sector to the core outlet. The disturbance was ΔT = −61.15 K over 1/6 of the core. The FLICA4 results show that the absolute temperature change related to inter-assembly mixing is in the range of 3.0K–4.4K in the sector periphery and 5.9 K in the central assembly. The CTF solution gives mixing-related temperature changes < 3.0 K at the periphery of the disturbed sector (Kolev et al., 2016).
4.1.3 Postulated VVER-1000 MSLB transient with 8 stuck rods
The considered accident scenario is based on an aggravated variant of the pessimistic scenario in the OECD/NEA VVER-1000 MSLB benchmark (V1000CT-2), for the same burnt reference core. In addition to the multiple equipment faults as summarized in Section 4.1.2, eight peripheral control rod clusters–in assembly # 90, 91, 105, 106, 117, 118, 130, 140 are assumed to remain stuck out of the core after scram, all of them in the overcooled sector (marked in beige in Figure 12b). The realistic option of the MSLB cross-section library (Petrov et al., 2015) is used. The scram worth is significantly reduced due to the eight rods stuck out of the core. The task is to solve an MSLB core boundary condition problem using coupled 3D neutronic/thermal-hydraulic codes, given the core thermal-hydraulic boundary conditions as specified for the core-only solution of the V1000CT-2 benchmark.
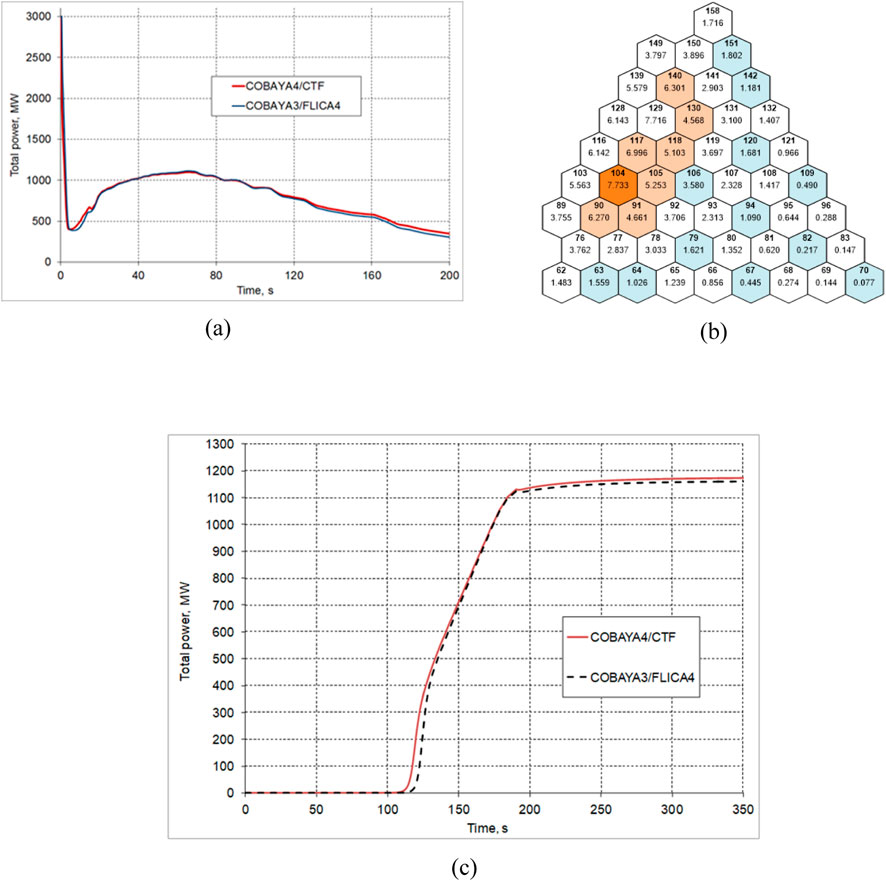
Figure 12. Postulated VVER-1000 MSLB accident with 8 stuck rods: (a) Computed time history of the total core power; (b) COBAYA/CTF computed relative assembly powers; (c) Simulated uncontrolled withdrawal of Kozloduy-6 CR Bank 9 at 2 cm/s - Time history of the total core power.
Figure 12a shows the computed time history of the total power. The peak power after scram is app. 37% of the nominal rated power. The results show a very close agreement of the COBAYA/CTF and COBAYA/FLICA4 solutions.
Figure 12b illustrates the radial core power distribution at the time of maximum return to power. The hottest assembly is #104. The assemblies with fully inserted control rods in the core are marked in blue, and the assemblies with stuck rods–in beige. The core power distribution is strongly disturbed. The hottest subset of the core is near the core periphery. There are large 3D flux deformations and gradients, and local multi-physics effects, which are of interest for fine-mesh higher-resolution analysis. Such a CTF sub-channel thermal-hydraulic analysis of the hottest assembly and a 7-assembly mini-core around it is illustrated in Section 3.1.3, Figures 5a–c of the present paper.
4.1.4 Control rod bank withdrawal
Figure 12c illustrates the comparison of COBAYA4/CTF vs. COBAYA3/FLICA4 solutions for the transient core power in the case of postulated complete withdrawal of Rod Bank 9 at 2 cm/s, starting from the fully inserted position at HZP (Spasov et al., 2018). The reference core is burnt, as described for the MSLB transient analysis. The steady state results agree well, and the computed rod bank worth is nearly the same, 1071 pcm vs. 1080 pcm. The transient total power solutions are in good agreement, with only a small bias due to differences in the thermal-hydraulic models.
4.2 CTF coupling with MCNP and Serpent
Two different couplings between the CTF and Monte Carlo neutronics codes have been developed. First, an MCNP/CTF (Kutlu et al., 2022) coupling was programmed with the latest version of CTF available at the time of development. Later, CTF continued to be improved for VVER applications, and CTF was coupled with Serpent 2.2.0. The following sections discuss the two coupling frameworks and differences between coupling approaches and provide results from coupled CTF calculations.
4.2.1 Coupling schemes
A wrapping driver script was developed to facilitate the external coupling between MCNP (Werner, 2017) and CTF to manage the iterative execution of the codes. The driver script controls the execution explicitly using a fixed-point iteration scheme (Kelly, 2017). This code driver provides all necessary intermediate processing of data, performs iteration checks, and contains scripts for the generation of new input files as a method of data transfer. The focus was to implement the capabilities for steady-state analysis; hence, temporal mapping was left for future work. An input generator for MCNP6.2 was incorporated to simplify and automate the writing of input files used in the data exchange process. The preprocessing of MCNP6.2 inputs also provides an opportunity to generate large-scale models while reducing human errors, which may occur during the development of lengthy input files necessary for pin-wise neutronic models.
A spatial mapping process was conducted between coolant-centered sub-channels in CTF and rod-centered cells in MCNP (Bennett, 2015). The coolant density and temperature are calculated by an area-weighted average before sending to MCNP. According to the subchannel numbering in the CTF model, weighting factors are calculated automatically in the geometry preprocessing based on the subchannel areas, which depend on the location of rods and assembly specifications.
Figure 13 shows a sample of the overlayed rod-centered neutronics model over the coolant-centered CTF model. Equations 5–7 calculate the
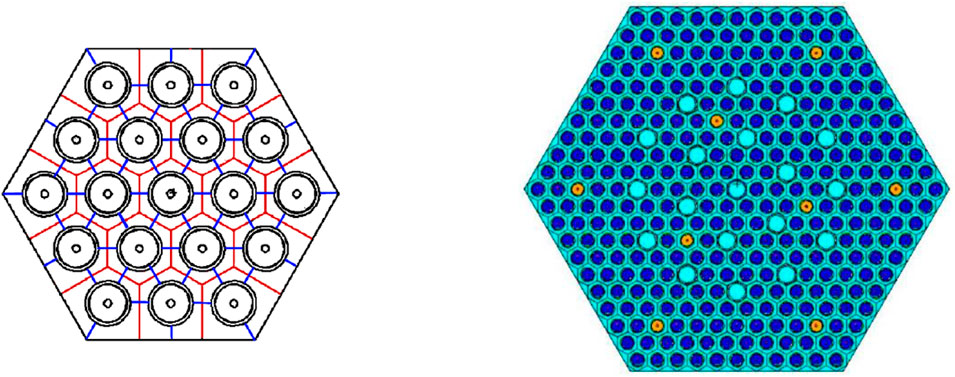
Figure 13. Coolant-centered subchannels (blue) vs. Rod-centered cells (red) – left; VVER-1000 assembly model–right.
The subchannel temperatures are denoted by
The coupled calculation begins with a CTF run to obtain the initial thermal-hydraulic calculations using a uniform power profile. Once completed, the CTF output is read by SubKit, a module included in the CTF utilization package to extract thermal-hydraulic data of interest. The thermal-hydraulic data are processed and used to construct a new input for MCNP. MCNP is then run to provide pin-wise power distribution based on neutron flux tallies. The first power profile obtained is utilized by CTF as an initial power distribution for the coupled iteration. This initialization approach does not require an initial user-input power or temperature distribution and is using instead a uniform power profile at the start. Once the initialization step is complete, CTF and MCNP are run in sequence, and the thermal-hydraulic and neutronic profiles are exchanged through the generation of new input files at each iteration until user-input convergence criteria are met.
A similar initialization process was implemented in the CTF/Serpent. The same CTF input was run with a uniform power profile to provide an initial temperature distribution for Serpent before the main coupled iterations started. The coupled CTF/Serpent code was also created externally, and the data transfer process was conducted via input and output files. However, there are differences between the coupling methodologies. For instance, Serpent has a separate coupled calculation mode that allows updates to Serpent by a Serpent multi-physics interface. Power information is extracted from the Serpent interface following the lattice and pin locations as described in the input, which simplifies the coupling development by maintaining the full core input description and removing the need to develop a Serpent input generator.
The developed Serpent/CTF coupling considered weighted fuel temperatures described in Equation 8, which were sent by the driving script to the multi-physics interface in order to update Serpent (Leppänen et al., 2015) pin cells for evaluation of Doppler broadened cross sections. This is in contrast to the MCNP/CTF coupling, where the radial temperature distribution within fuel rods was processed with a weighting factor for different radial cells within MCNP fuel rods and calculated as part of the developed MCNP input generation process.
In Equation 8,
In both coupled codes, the convergence is monitored based on user-defined criteria, ε, given in Equation 9. The coupling scheme compares feedback fields exchanged between the coupled codes, including flux (power profile), temperatures of fuel and coolant, and coolant density from the current iteration, ‘k+1’, to the previous iteration, ‘k’. ‘X’ is the parameter being checked at each iteration, and ‘i’ represents the associated cell, rod, or sub-channel index.
The main objective in this work was to apply CTF in multi-physics calculations with different neutronics codes. Modeling the same problem and keeping the modeling approaches as much as possible is essential for a meaningful comparison between the two coupled codes. For this reason, the same VVER-1000 assembly was modelled for demonstration, and the results are compared in the following sections.
4.2.2 VVER-1000 assembly model
A VVER-1000 assembly model was developed based on a burnup calculation benchmark (Löetsch, et al., 2010) to test the code couplings. A TVSA 30AV5 fuel assembly was modeled, consisting of 303 fuel rods with 2.99 w/o enriched UO2, nine fuel rods with burnable poison with 2.4 w/o enriched UO2 and 5% Gd2O3 of mass fraction, 18 guide tubes, and one central instrumental tube as shown in Figure 13. The main specifications for the assembly, including geometry and system parameters, can be found in the benchmark documentation. Assembly power and coolant flow rate were calculated as averages from the system parameters. Reflective boundary conditions were considered radially, while black boundary conditions were used at the bottom and the top of the assembly, following axial reflector regions composed of three layers. The assembly was divided into 13 axial nodes along the active fuel length, and spacer grids were considered at each axial level of the CTF model with a fixed loss coefficient. Spacer grids were not considered in the MCNP or Serpent neutronics models. Two radial nodes are modeled in CTF for the fuel pellets. The axial reflector was modeled in MCNP and Serpent with material information as provided in (Löetsch, et al., 2010), and using the ENDF/B-VII.1 cross-section library. For each MCNP and Serpent simulation/coupled iteration, 300 inactive cycles, 1000 active cycles, and 105 particles per cycle were run.
To test the developed coupled codes, the converged test case solutions were compared. The results obtained for k-eigenvalue were also compared to another coupled code evaluation using the Karlsruhe Institute for Technology (KIT) Serpent2/SUBCHANFLOW coupled code (García, 2020) and also compared to the initial (no burnup) benchmark reference solutions (Löetsch, et al., 2010). Refinement of the code and direct comparison with other coupled code systems is desirable, however, these test cases serve as an initial code-to-code comparison.
4.2.3 Results
The following convergence criteria were used for the test case: ε1 = 5.0 × 10⁻³ for power; ε2 = 1.0 × 10⁻³ for coolant temperature, coolant density, and fuel temperature. The convergence was reached after 12 iterations in both coupled codes; convergence of the assessment parameters is presented in Figure 14. Oscillations are observed between some iterations due to successive feedback effects as well as the statistical noise of the stochastic approach used in MCNP and Serpent. However, a sufficiently large number of iterations, as well as the use of the power relaxation methods, ensure convergence.
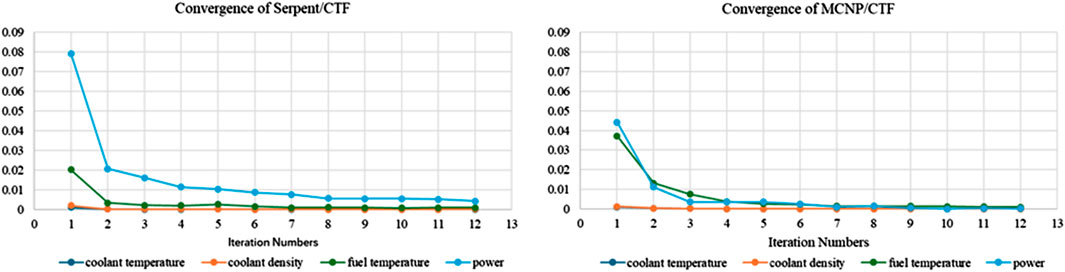
Figure 14. Convergence of coupled calculations with respect to iteration number.
The converged VVER-1000 radial pin power distributions obtained by CTF/MCNP and CTF/Serpent are given in Figures 15a, b. Note that the different color sets were used since the power profiles were hardly dissimilar. The relative pin powers are obtained by integrating the power generated axially over the active rod lengths and normalizing to the average pin power. The fuel rods containing Gd2O3 burnable poison and 2.4 w/o enriched UO2 are observed, as expected, to have low pin powers compared with the 2.99 w/o enriched UO2 fuel rods without burnable poison. The 1/3 radial symmetry of the model is well reflected in the resulting radial power distribution.
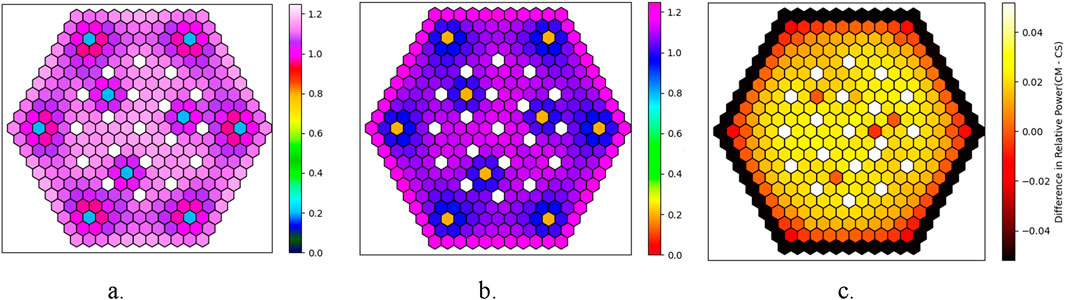
Figure 15. Normalized radial power profiles obtained by (a) CTF/MCNP; (b) CTF/Serpent; (c) Differences in normalized radial pin power estimations obtained by CTF/MCNP and CTF/Serpent (CM-CS).
The difference in radial pin power distributions obtained by comparing the CTF/MCNP (CM) and the CTF/Serpent (CS) is shown in Figure 15c. The differences in estimated power profiles can be attributed to the usage of different neutronics solvers. The axial coolant temperature distributions obtained from CTF/MCNP and CTF/Serpent are compared and shown in Figure 16a, having mostly overlap with the same trend. The average coolant temperature was found to be 318 °C at the outlet of the assembly. The difference between the inlet and the outlet ranges from 25 °C to 30 °C.
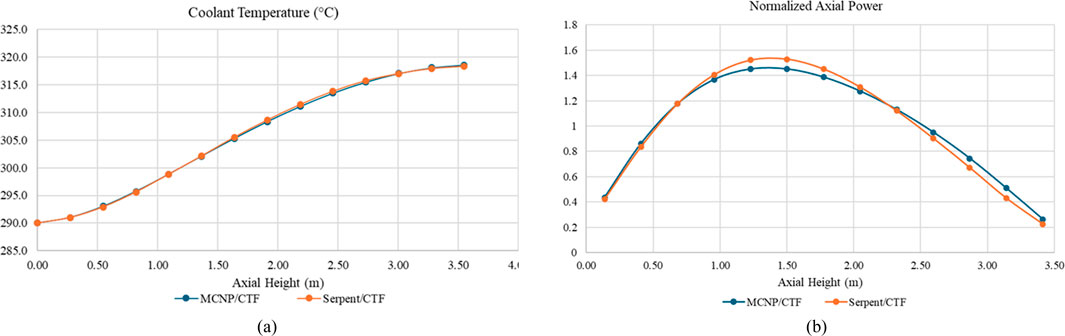
Figure 16. (a) Radially averaged axial coolant temperatures; (b) Normalized axial power profiles.
The converged axial power distributions are compared in Figure 16b. The power profiles from both coupled calculations show a tendency to be bottom-peaked. This outcome is expected since the coolant acts as a better moderator in the lower part of the assembly, ascribed to higher coolant density. In spite of the fact that both CTF/MCNP and CTF/Serpent coupled codes used the ENDF/B-VII.1 cross-section library, the axial power profiles are not exactly matched due to the differences in the couplings mentioned formerly, as well as differences in MCNP and Serpent.
Comparisons of eigenvalues evaluated by the converged coupled results are compared to the benchmark (Löetsch, et al., 2010) - and a Serpent2/SUBCHANFLOW result (García, 2020) in Table 6. The k-eigenvalues chosen from the benchmark for this comparison are those calculated at 0 MWd/tU. The k-eigenvalue was obtained from the Serpent2/SUBCHANFLOW coupled calculation after nine iterations. The relative statistical errors of Serpent2/SUBCHANFLOW, CTF4.0/MCNP6.2, and CTF4.3/Serpent2.2.0 are presented in Table 6. 2000 active cycles with 105 particles were run for the Serpent calculation of the coupled Serpent2/SUBCHANFLOW; note that no information was available regarding the cross-section library utilized in this study. Differences from this solution may, partially, be attributed to the use of different libraries in addition to differences in modeling methodologies.
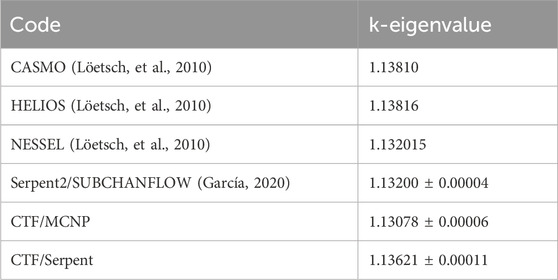
Table 6. Comparison of eigenvalue results.
4.3 PARCS/CTF coupling
4.3.1 Coupling scheme
CTF and the neutronic code PARCS are coupled loosely at the reactor core level for multi-physics modelling at K. Picard iteration has been selected for this coupling; acceleration methods are not currently implemented, however, relaxation of the relative tolerance of CTF is applied. In (Delipei, et al., 2022), the CTF/PARCS framework is used to model exercises of LWR-UAM Phase III, which includes the modeling of the TMI-1, a square lattice PWR design, under various core conditions. In this paper, the coupled code is used for a nodal/assembly-wise model of Rostov-2 full core. Rostov-2 is a VVER-1000 type of reactor that is equipped with TVS-2M hexagonal fuel assemblies.
The United States Nuclear Regulatory Commission (U.S. NRC) code PARCS (Downar et al., 2018) is a 3D neutron kinetics code that can solve steady-state and time-dependent multi-group neutron diffusion equations in both Cartesian and hexagonal geometries. PARCS reads burnup-dependent cross-sections in PMAXS format and can conduct pin power reconstruction if group-dependent flux form functions are included in the cross-section libraries. The pin power reconstruction feature of PARCS has not been utilized in the results shown here and is left for future work. GRS, a Rostov-2 benchmark participant, has created cross-section libraries for the Rostov-2 core model in the NEMTAB format (Henry, 2022) and provided them for testing by other participants. These cross-section libraries have been converted into PMAXS format at NCSU and are used for the coupled PARCS/CTF calculations here.
The CTF/PARCS coupling uses a flexible Message Passing Interface (MPI) communication protocol based on a server–client coupling algorithm. The coupling algorithm facilitates the implementation of a loose coupling method without the necessity of heavy modification in the source codes of CTF and PARCS. Figure 17 shows the coupling scheme where CTF acts as the server and PARCS as the client.
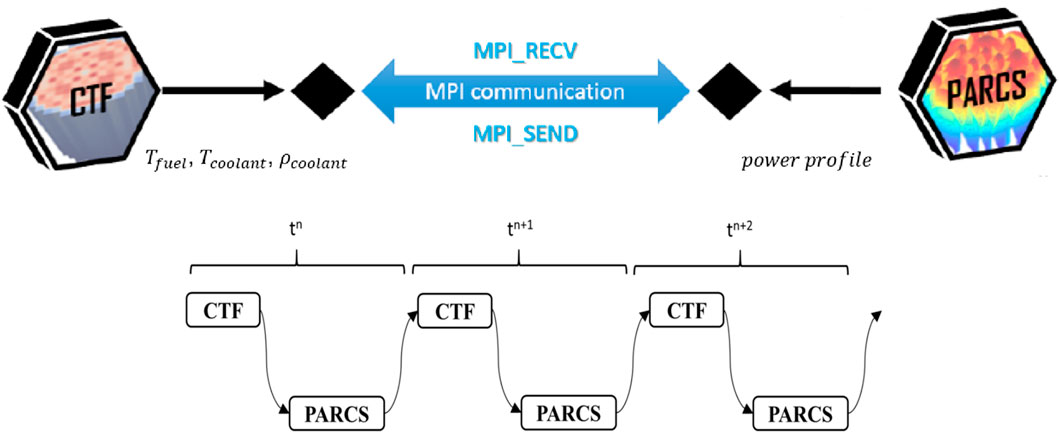
Figure 17. Coupling scheme of CTF/PARCS.
Coupled calculations can be activated via a command line argument in CTF to launch additional MPI processes for client codes, in this case, PARCS. An interface input file needs to be provided so that the information for the client can be launched by the server.
The neutron kinetics coupling class developed in CTF contains protocols to send tagged messages to instruct operations in PARCS, including initializing PARCS, steady-state iteration, depletion step, transient time step, convergence, simulation finalization, and error.
The synchronization of the codes is controlled by MPI standard functions: MPI_SEND and MPI_RECV. The MPI_SEND function is used for writing the outputs/instructions from a buffer. MPI_RECV function is used for reading the corresponding inputs/instructions from the buffer. These MPI send and receive commands result in temporally explicit coupling where one code is performing a calculation while the other code waits for the calculation to finish. Feedback parameters such as fuel temperature, coolant temperature, coolant density, and power are exchanged during each global coupled iteration. Spatial mapping can be done manually by users, or developed auto mapping procedures can be utilized to provide information about the different physical spatial domains. More detailed information regarding the coupling methodology of CTF/PARCS can be found in (Delipei, et al., 2022).
In this work, the PARCS/CTF coupled code is adopted in steady-state mode for the calculation of BOC conditions of the Rostov-2 core.
4.3.2 Full core steady-state VVER model
An OECD/NEA benchmark on Reactivity Compensation of Boron Dilution by Stepwise Insertion of Control Rod Cluster into the VVER-1000 Core (Avramova, et al., 2021) focuses on the comprehensive evaluation and validation of advanced high-fidelity multi-physics simulation codes using transient tests carried out at Unit 2 of the Rostov Nuclear Power Plant (NPP). Rostov-2 is a VVER-1000 type of reactor that is equipped with TVS-2M fuel assemblies and operates on an 18-month fuel cycle.
The benchmark encourages the participants to compare the performance of traditional and high-fidelity multi-physics codes for steady-state, burnup, and transient calculations. Data collected at steady-state conditions and during transient testing provides a wide range of parameters, such as reactor power, coolant temperatures, control rod positions, and boron concentrations. These data collections create pivotal opportunities to ensure the accuracy and reliability of simulation codes, such as CTF/PARCS.
The first exercise of the benchmark, after cross-section generation, requests the calculation of the Hot Zero Power (HZP) state of the core to evaluate the cross-section libraries. The HZP conditions are provided in Table 7a.
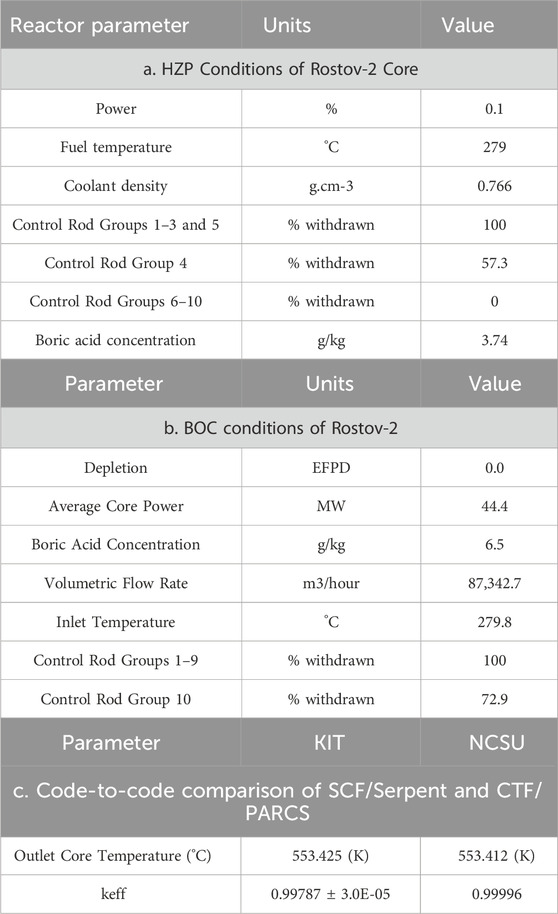
Table 7. Conditions of rostov-2 core simulations.
In the benchmark, the operational history from the Beginning of Cycle (BOC) to the initial state before the experiment is provided, and it is suggested to start the transient from an averaged total core burnup of 36.37 effective full power days (EFPD). Therefore, the first step is to model and test the VVER full core for HZP and BOC conditions, which is used here for verification and validation of the CTF/PARCS coupled code. The BOC conditions are given in Table 7b.
4.3.3 Results
CTF and PARCS inputs were prepared assembly-wise, where each assembly corresponds to a channel in CTF. The TPEN solution method was chosen for PARCS, which is suitable for triangular lattice geometry. Two mapping tables were prepared manually, which were read and utilized to calculate weighted averages of contributing channels to corresponding nodes. The weighting factors in the mapping tables are normalized to 1.0. The Doppler temperature required by PARCS is obtained by using the weighting factors 0.7 and 0.3 for surface and fuel centerline temperatures, once received from CTF, respectively. The coupling interface then reassigns power profiles in CTF after obtaining the power information from PARCS.
From HZP calculation of PARCS/CTF, boric acid concentration was found to be 3.7 g/kg, while CER, a participant of Rostov-2 benchmarks, computed boric acid concentration 3.8 g/kg using a standalone neutronics diffusion code KIKO3DMG. Two results were considered in agreement. For the BOC condition model of Rostov-2, Figure 18a shows the convergence of keff over 19 global coupled iterations.
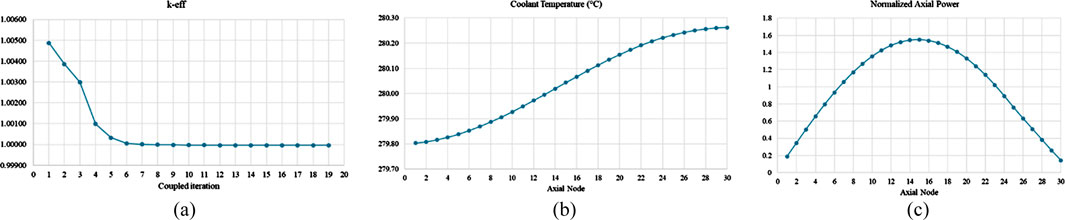
Figure 18. (a) Eigenvalue Convergence during coupled CTF/PARCS calculation for BOC; (b) Axial Core Coolant Temperature Distribution of Rostov-2 core at BOC conditions with fresh fuel; (c) Axial Power Profile of Rostov-2 core at BOC conditions with fresh fuel.
The computed axial core coolant temperature distribution and normalized axial core power profile of the coupled steady state are provided in Figures 18b, c, respectively, where 30 equidistant nodes were modelled in both PARCS and CTF. The coolant temperature shows changes of less than a degree due to the low core power level, while the power distribution follows a cosine shape, which is negligibly bottom peaked. Keep in mind that these results are obtained by modelling 44.4 MW core power in fresh fuel.
Table 7 shows the core outlet temperature and keff comparisons between SCF/Serpent (Beydogan, 2023) and PARCS/CTF for BOC calculations are found to be in good agreement.
5 Conclusions
Coarse-mesh and sub-channel thermal-hydraulic models of VVER-1000 assemblies and the full-core were tested against measured data for the pressure drop and temperature rise, as well as code-to-code vs. FLICA4 solutions. The CTF results agree well with the reference data.
In a preliminary study, CTF vs. FLICA4 sub-channel results for the vapor void fraction in the sub-cooled region of a VVER assembly were compared for illustration. The test case was the LWR UAM Phase II: Case III-3b. CTF used the Chen nucleate boiling model, and FLICA4 used the Jens-Lottes model. In this case, the FLICA4 solution cannot be used as a conditional reference since the Chen correlation is better suited to the flow conditions given. There is a need for further verification of the available and potential new sub-cooled boiling models in CTF for VVER rod bundles.
Coupled COBAYA/CTF vs. COBAYA/FLICA4 full-core nodal solutions were compared for cross-verification. The test cases were a core boundary condition problem of the NEA VVER-1000 MSLB Benchmark (V1000CT-2) and a control rod bank withdrawal test problem. The results are in good agreement, with slight differences attributed mainly to the different flow mixing models.
The impact of the inter-assembly mixing in CTF sub-channel simulations was studied by comparison of a single hot-assembly calculation vs. a 7-assembly mini-core calculation. The assembly powers and boundary conditions were extracted from a full-core nodal calculation of a postulated MSLB accident with 8 stuck control rods. The results show more conservative predictions of the local core safety parameters when the assembly environment is taken into account.
The steady-state VVER-1000 full core was modeled in the latest version of CTF to test the new pre- and post-processing options embedded in CTF. Another study done by CTF for single physics thermal-hydraulics calculation coupled it with the sensitivity and uncertainty tool Dakota to apply to a steady state VVER-like mini assembly model consisting of 19 rods. The coupling of CTF and Dakota was utilized as an uncertainty propagation framework for a model based on a steady state using the experimental setup planned for use in Exercise II-3 (6a/6b) of the OECD/NEA UAM LWR Benchmark Phase II. Uncertainties in inlet temperature, flow rate, pressure, power distribution, and geometry were propagated to outlet coolant temperature for the TBSA-T5 VVER-type experimental bundle case. The focus was to demonstrate the methodology and the CTF/Dakota coupling setup for use in uncertainty analysis. The preliminary results met expectations, and once experimental uncertainties are finalized in the benchmark specifications, the coupling will be used to evaluate uncertainties for various experimental conditions.
MCNP/CTF (Kutlu et al., 2022) and Serpent/CTF were coupled externally to provide a high-fidelity multi-physics tool for hexagonal geometry light water reactor designs, and the initial steady-state multi-physics capabilities of CTF were demonstrated. The coupled codes are managed via wrapping driver scripts, which process spatial mapping and other necessary steps to facilitate the exchange of thermal-hydraulics and neutronics data between MCNP and CTF or Serpent and CTF. The results of a VVER-1000 assembly model calculation were in good agreement with expectations and the reference cases. At present, both coupled codes have only been applied to assembly-scale models. The next step for future work may be to expand and optimize the coupled calculations to tackle full core pin-by-pin simulations. The MCNP and CTF preprocessors integrated in the couplings may be extended to generate full core inputs to enable this functionality.
To decrease the simulation time, introducing a domain decomposition method to simulate full core VVER models on a distributed architecture or reconfiguration to an internal coupling may be necessary. Future work may further include additional developments to extend the scope of the Serpent/CTF coupled code due to the usefulness of the Serpent multi-physics interface. The multi-physics tool can be further optimized and expanded for both cycle depletion and transient applications for pin-level full core calculations.
The focus of this paper is to summarize the cooperation activities between NCSU and the Institute for Nuclear Research and Energy (INRNE), Bulgarian Academy of Sciences, on model improvements, verification and validation, and uncertainty analysis of CTF for triangular/hexagonal lattice calculations in VVER applications. Pure thermal-hydraulic (single physics) as well as multi-physics developments and benchmarking at the nodal/channel and pin/sub-channel level have been discussed. Based on the results described in this paper, users will be confident of applying CTF to VVER design and safety analyses.
Data availability statement
The original contributions presented in the study are included in the article/supplementary material, further inquiries can be directed to the corresponding author.
Author contributions
YK: Investigation, Validation, Visualization, Formal Analysis, Writing – original draft. IS: Validation, Formal Analysis, Data curation, Investigation, Software, Writing – original draft. SM: Validation, Data curation, Resources, Investigation, Writing – original draft. PR: Visualization, Supervision, Writing – original draft, Software. AA: Validation, Methodology, Writing – original draft, Software. NK: Writing – review and editing, Conceptualization, Writing – original draft, Methodology. MA: Supervision, Investigation, Conceptualization, Writing – original draft, Software. KI: Resources, Conceptualization, Funding acquisition, Writing – review and editing, Supervision.
Funding
The author(s) declare that no financial support was received for the research and/or publication of this article.
Conflict of interest
The authors declare that the research was conducted in the absence of any commercial or financial relationships that could be construed as a potential conflict of interest.
The author(s) declared that they were an editorial board member of Frontiers, at the time of submission. This had no impact on the peer review process and the final decision.
Generative AI statement
The author(s) declare that no Generative AI was used in the creation of this manuscript.
Publisher’s note
All claims expressed in this article are solely those of the authors and do not necessarily represent those of their affiliated organizations, or those of the publisher, the editors and the reviewers. Any product that may be evaluated in this article, or claim that may be made by its manufacturer, is not guaranteed or endorsed by the publisher.
References
Adams, B. M., Bauman, L. E., Bohnhoff, W. B., Dalbey, K. R., Eddy, J. P., Ebeida, M. S., et al. (2014). Dakota, a multilevel parallel object-oriented framework for design optimization, parameter estimation, uncertainty quantification, and sensitivity analysis: version 6.0 user’s manual. SANDIA REPORT SAND2014-xxxx.
Aly Ahmed Mohamed Nabil Hassanein Multi-scale Multi-Physics Modeling of (2022). Metallic fuel and thermal hydraulics of sodium fast reactors in a subchannel approach. Raleigh: North Carolina State University.
Avramova, M., Ivanov, K., Velkov, K., Pasichnyk, I., Nikonov, S., Denisova, M., et al. (2021). Benchmark on reactivity compensation with diluted boron by stepwise insertion of control rod cluster into the VVER-1000 core, Specification and Support Data. NEA/EGMPEBV/DOC.
Avramova, M., Velazquez-Lozada, A., and Rubin, A. (2012). Comparative analysis of CTF and trace thermal-hydraulic codes using OECD/NRC PSBT benchmark void distribution database. Hindawi Publ. Corp. Sci. Technol. Nucl. Installations 12. doi:10.1155/2013/725687
Bennett, A. (2015). Development and Testing of a Coupled MCN6/CTF Code. MS thesis. The Pennsylvania State University.
Beydogan, N. (2023). The status of the KIT contribution to the rostov-2 VVER-1000 multi-physics transient benchmark. Baden-Württemberg, Germany: Karlsruhe Institute of Technology (KIT).
Chanaron, B., Ahnert, C., Crouzet, N., Sanchez, V., Kolev, N., Marchand, O., et al. (2015). Advanced multi-physics simulation for reactor safety in the framework of the NURESAFE project. Ann. Nucl. Energy 84, 166–177. doi:10.1016/j.anucene.2014.12.013
Chen, J. C. (1966). Correlation for boiling heat transfer to saturated fluids in convective flow. Industrial Eng. Chem. Process Des. Dev. 5, 322–329. doi:10.1021/i260019a023
Delipei, G., Rouxelin, P., Abarca, A., Hou, J., Avramova, M., and Ivanov, K. (2022). CTF-PARCS core multi-physics computational framework for efficient lwr steady-state, depletion and transient uncertainty quantification. Energies 15 (14), 5226. doi:10.3390/en15145226
Dittus, F. W., and Boelter, L. M. K. (1930). “Heat transfer in automobile radiators for the tubular type,” in Publications in engineering 2 (Berkeley: University of California), 443–461.
Downar, T., Xu, Y., Seker, V., and Hudson, N., (2018). PARCS v3.3. 0 - U.S. NRC core neutronics simulator user manual. University of Michigan, U.S. Nuclear Regulatory Commission.
Fillion, Ph., Bergeron, A., Gallo, D., Gregoire, O., Richebois, E., Royer, E., et al. (2011). “FLICA4 users guide,” in CEA saclay report.
García, M., Ferraro, D., Valtavirta, V., Tuominen, R., Imke, U., Leppänen, J., et al. (2020). Serpent2-SUBCHANFLOW pin-by-pin modelling capabilities for VVER geometries. Ann. Nucl. Energy 135 (106955), 106955. doi:10.1016/j.anucene.2019.106955
García-Herranz, N., Cuervo, D., Sabater, A., Rucabado, G., Sánchez-Cervera, S., and Cas tro, E. (2017). Multi-scale neutronics/thermal-hydraulics coupling with COBAYA4 code for pin-by-pin PWR transient analysis. Nucl. Eng. Des. 321, 38–47. doi:10.1016/j.nucengdes.2017.03.017
Hancox, W. T., and Nicoll, W. B. (1971). A general technique for the prediction of void distributions in nonsteady two-phase forced convection. Int. J. Heat Mass Transf. 14, 1377–1394. doi:10.1016/0017-9310(71)90186-4
Henry, R. (2022). Perin yann and travleev anton generation of group constants at GRS for the rostov-2 benchmark PHYSOR 2022: international conference on physics of reactors. Pittsburgh, USA: American Nuclear Society - ANS.
Hou, J., Delipei, G., Blyth, T., Porter, N., Avramova, M., Ivanov, K., et al. (2022). Benchmark for Uncertainty Analysis in Modelling (UAM) for Design, Operation, and Safety of LWRs, Volume II: Specifications and Support Data for the Core Cases (Phase II). NEA/NSC/DOC.
Hou Jason Benchmark for Uncertainty Analysis in Modelling (UAM) for Design (2019). Operation and safety of LWRs, volume II: specifications and support data for the core cases.
Jens, W. H., and Lottes, P. A. (1951). “Analysis of heat transfer, burnout, pressure drop and density data for high-pressure water,” Tech. Rep.ANL-4627. doi:10.2172/4421630
Jimenez, J. (2009). COBAYA/FLICA4 coupling in Salome 5: EURATOM NURISP Project, Technical note. UPM.
Jimenez (2015). Jimenez javier and Sanchez victor KIT results for the hot assembly BC problem using COBRA-TF and SUBCHANFLOW. Available online at: https://publikationen.bibliothek.kit.edu/230104048/3817031.
Kelly, D. J., Kelly, A. E., Aviles, B. N., Godfrey, A. T., Salko, R. K., and Collins, B. S. (2017). MC21/CTF and VERA multiphysics solutions to VERA core physics benchmark progression problems 6 and 7. Nucl. Eng. Technol. 49, 1326–1338. doi:10.1016/j.net.2017.07.016
Kolev, N. P., Aniel, S., Royer, E., Bieder, U., Popov, D., and Topalov, Ts. (2007). VVER-1000 Coolant transient benchmark Phase II (V1000CT-2), Vol.1, Final specifications of the VVER-1000 vessel mixing problem. Paris: NEA/NSC/DOC(2007)22 ©OECD 2010.
Kolev, N.P., Petrov, N., Donov, J., Angelova, D., Aniel, S., Royer, E., et al. (2006). VVER-1000 Coolant transient benchmark Phase II (V1000CT-2), Vol.2, Final specifications of the VVER-1000 MSLB problem. Paris: NEA/NSC/DOC(2006)6 ©OECD 2010.
Kolev, N. P., Spasov, I., Zheleva, N., Todorova, G., Petrov, N., Mitkov, S., et al. (2016). Higher-resolution VVER MSLB simulation - final report on latest results from reference and advanced cases. NURESAFE D14.41 Report, EURATOM.
Kucukboyaci, V., Sung, Y., and Salko, R. (2015). “Cobra-TF Parallelization and Application to PWR Reactor Core Subchannel DNB Analysis,” in ANS MC2015 - Joint International Conference on Mathematics and Computation (M&C), Supercomputing in Nuclear Applications (SNA) and the Monte Carlo (MC) Method, Nashville, TN, April 19–23, 2015.
Kutlu, Y. (2021). Development of a coupled code between MCNP6 2 and CTF4.0 for VVER applications [MS thesis], nuclear engineering department. North Carolina State University- Raleigh.
Kutlu, Y., Rouxelin, P., Avramova, M., and Ivanov, K. (2022). “Development of a high-fidelity coupling between MCNP6.2 and CTF4.0 for VVER applications,” Proceedings of International Conference on Physics of Reactors 2022 (PHYSOR 2022), Pittsburgh, PA, May 15–20, 2022, 1802–1811. doi:10.13182/PHYSOR22-37770
Leppänen, J., Pusa, M., Viitanen, T., Valtavirta, V., and Kaltiaisenaho, T. (2015). The Serpent Monte Carlo code: status, development and applications in 2013. Ann. Nucl. Energy 82, 142–150. doi:10.1016/j.anucene.2014.08.024
Löetsch, A., Khalimonchuk, V., and Kuchin, A. (2010). “Corrections and additions to the proposal of a benchmark for core burnup calculations for a WWER-1000 reactor,” in Proceedings of the twentieth symposium of atomic energy research.
Lozano, J.-A., García-Herranz, N., Ahnert, C., and Aragonés, J. M. (2008). The analytic nodal diffusion solver ANDES in multi-groups for 3D rectangular geometry: development and performance analysis. Ann. Nucl. Energy 35, 2365–2374. doi:10.1016/j.anucene.2008.07.013
Lozano, J. A., Jiménez, J., García-Herranz, N., and Aragonés, J. M. (2010). Extension of the analytic nodal diffusion solver ANDES to triangular-Z geometry and coupling with COBRA-IIIc for hexagonal core analysis. Ann. Nucl. Energy 37, 380–388. doi:10.1016/j.anucene.2009.12.001
Mitkov, S. (2022). Simulation studies of VVER-1000 core processes for reactor safety analysis. Sofia: Institute for Nuclear Research and Nuclear Energy. PhD Thesis.
Mitkov, S., Spasov, I., and Kolev, N. (2021). Thermal-hydraulic analysis of a VVER1000 core in MSLB conditions, E3S Web Conf., Proc. 26th Sci. Conf. Power Eng. Power Mach. (PEPM), Sozopol, Bulg. E3S Web Conf. 327, 01013, doi:10.1051/e3sconf/202132701013
Mitkov, S., Spasov, I., and Kolev, N. P. (2018). “Simulation of a hypothetical MSLB core transient in VVER-1000 with several stuck rods,”, 83. München: Carl Hanser Verlag, 389–395. doi:10.3139/124.110910
Papadionysiou Marianna (2022). Coupling of nTRACER to COBRA-TF for full core high-fidelity analysis of VVERs//ANS international conference on physics of reactors 2022 (PHYSOR 2022). Pittsburgh, PA : ANS, 586–595.
Petrov, N., Spasov, I., Sanchez-Cervera, S., and Garcia-Herranz, N. (2015). Nodal level XS library v2 for VVER parameterized for MSLB. NURESAFE D14.25b-Rev2 Report, EURATOM.
Rubin, A., Schoedel, A., and Avramova, M. (2012). OECD/NRC benchmark based on NUPEC pressurized water reactor sub-channel and bundle tests (PSBT) - Volume I: Experimental database and final problem specifications. Nuclear Science NEA/NSC/DOC(2012)1.
Sanchez, R., Zmijarevi, I., Coste-Delclaux, M., Masiello, E., Santandrea, S., Martinolli, E., et al. (2010). APOLLO2 Year 2010. Nucl. Eng. Technol. 42 (5), 474–499. doi:10.5516/net.2010.42.5.474
Santandrea, S., Sanchez, R., and Mosca, P. (2008). A linear surface characteristics approximation for neutron transport in unstructured meshes. Nucl. Sci. Eng. 160 (1), 23–40. doi:10.13182/nse07-69
Spasov, I., Kolev, N., Zheleva, N., Todorova, G., Jimenez, J., Herrero, J.J., et al. (2012). VVER MSLB Benchmark solutions with CRONOS/FLICA and COBAYA/FLICA. NURISP– D3.1.3.3a Rep, EURATOM.
Spasov, I., Ivanov, P., and Kolev, N. (2018). Simulation of a rod-ejection transient in VVER-1000 with COBAYA4-CTF. Compt. rend. Acad. bulg. Sci. 71 (3), 325–334. doi:10.7546/CRABS.2018.03.03
Spasov, I., Kolev, N. P., Donov, J., and Sabotinov, L. (2010). “CATHARE multi-1D modeling of coolant mixing in VVER-1000 for RIA analysis,” Sci. Tecnology Nucl. Installations (open access), 2010 1–11. doi:10.1155/2010/457094
Spasov, I., Mitkov, S., and Kolev, N. (2014). “Sub-channel FLICA4 and COBRA-TF input models qualified for VVER,” in NURESAFE D14.23 report, EURATOM.
Spasov, I., Mitkov, S., Kolev, N. P., Sanchez-Cervera, S., Garcia-Herranz, N., Sabater, A., et al. (2017). Best-estimate simulation of a VVER MSLB core transient using the NURESIM platform codes. Nucl. Eng. Des. 321, 26–37. doi:10.1016/j.nucengdes.2017.03.032
Sung, Y., Kucukboyaci, V., Cao, L., and Salko, R. (2015). “COBRA-TF evaluation and application for PWR steam line break DNB analysis,” Proceedings of NURETH-16Conference, Chicago, IL, United States.
Takasugi, C., Martin, N., Yoon, S., Bays, S., Avramova, M., and Ivanov, K. (2021). Development of a thermal hydraulic model for the versatile test reactor using the CTF subchannel code”, Proceedings of Mathematics & Computation (M&C) 2021, Virtual Meeting, 2274–2283.
Takasugi, C. (2023). Improvement of high-to-low fidelity multi-physics modeling for sodium-cooled fast reactor cores. PhD Dissertation. Raleigh: North Carolina State University.
Werner, C. J. (2017). MCNP® USER’S MANUAL, code version 6.2 October 27, 2017 Manual Rev. 0, LA-UR-17-29981.
Keywords: VVER, CTF, sub-channel, multi-physics, uncertainty
Citation: Kutlu Y, Spasov I, Mitkov S, Rouxelin P, Abarca A, Kolev N, Avramova M and Ivanov K (2025) CTF development, verification, and validation for VVER core thermal-hydraulics and multi-physics modeling and simulation. Front. Nucl. Eng. 4:1594698. doi: 10.3389/fnuen.2025.1594698
Received: 16 March 2025; Accepted: 23 May 2025;
Published: 01 August 2025.
Edited by:
Deokjung Lee, Ulsan National Institute of Science and Technology, Republic of KoreaReviewed by:
Hyoung Kyu Cho, Seoul National University, Republic of KoreaYunje Cho, Korea Atomic Energy Research Institute (KAERI), Republic of Korea
Copyright © 2025 Kutlu, Spasov, Mitkov, Rouxelin, Abarca, Kolev, Avramova and Ivanov. This is an open-access article distributed under the terms of the Creative Commons Attribution License (CC BY). The use, distribution or reproduction in other forums is permitted, provided the original author(s) and the copyright owner(s) are credited and that the original publication in this journal is cited, in accordance with accepted academic practice. No use, distribution or reproduction is permitted which does not comply with these terms.
*Correspondence: Kostadin Ivanov, a25pdmFub3ZAbmNzdS5lZHU=