 Manish Kumar1,2*
 Manish Joshi3
 Anubhav Kumar Dwivedi2,4
 Sidyant Kumar5
 T. Saud2
 Arshad Khan3
 Gaurav Mishra2Nandan Saha6Sunil Ganju7
 S. N. Tripathi8
 B. K. Sapra3
- 1Department of Electronics and Telecommunication, TKIET, Warananagar, Maharashtra, India
- 2National Aerosol Facility, IIT Kanpur, Kanpur, India
- 3Radiological Physics and Advisory Division, Bhabha Atomic Research Centre, Mumbai, India
- 4Civil and Environmental Engineering, University of Michigan, Ann Arbor, MI, United States
- 5Department of Aerospace Engineering, IIT, Kanpur, India
- 6Reactor Safety Division, Bhabha Atomic Research Centre, Mumbai, India
- 7Department of Atomic Energy, Mumbai, India
- 8Department of Civil Engineering and Sustainable Energy Engineering, IIT, Kanpur, India
The study of the transport and deposition characteristics of aerosol particles in test sections is a component of the probabilistic safety assessment of nuclear reactors under severe accident scenarios. The deposited particles may become resuspended under favorable conditions, thus affecting the source term estimates. The objective of the present study was to perform experiments on a straight test pipe section 4 m long under deposition and resuspension phases. Zinc oxide metal particles generated from a plasma torch aerosol generator (PTAG) were used as the test aerosols. Deposition phase experiments were performed at a total carrier gas flow rate of 180 Lmin-1, whereas the flow was increased to 1265 Lmin-1 for the resuspension phase. Thermophoresis as an effect of PTAG enthalpy-governed temperature gradients was seen to dominate the deposition phase. The effects of varying Reynold numbers in different volume sections were reflected in a higher resuspended-to-deposited-mass-ratio in the downstream direction. A profile of deposited and resuspended masses was interpreted for the resuspension time of 20 min. Experimentally obtained characteristics were also compared with numerical results from simulations performed with the SOPHAEROS module of the Accidental Source Term Evaluation Code (ASTEC). This study, performed at the National Aerosol Facility (NAF), Indian Institute of Technology, Kanpur, India, indicates the need of more research on aerosol resuspension effects as this impacts the estimation accuracy of the source term.
1 Introduction
Nuclear energy is a viable long-term energy source given its abundance, nil contribution to global warming, and reliability. The main safety concern of operating a nuclear reactor for electricity generation is the possibility of design-based and other accidents. Given the psychological impact of any nuclear accident, advanced technologies have been adopted to make reactor operation failsafe and mitigate the consequences in the worst case of a failure. The melting of a reactor core under severe accident conditions has been a priority in reactor accident research studies. Understanding the phenomenology of an accident, engineering safety features, and taking corrective action after an unforeseen scenario have always been enhanced by information gained after accidents like Three Mile Island (1979), Chernobyl (1986), and most recently, Fukushima (2011), Sehgal (2011). In a core meltdown scenario, radioactive fission products and structural materials may be released into the atmosphere in aerosol form. These aerosols can then be transported by advective currents up to thousands of kilometers from the release point (Pöllänen et al., 1995). Concentrations of aerosol particles during a reactor accident can be as high as 100
Understanding deposition and resuspension phenomena are important for source term evaluation under a severe reactor accident scenario. The deposition and resuspension of aerosol particles in reactor component sections in such cases determines the release of radioactivity into the environment. Radionuclides are less likely to be retained in the circuit when they are resuspended; when they are discharged directly into the environment in bypass sequences, the phenomena are of particular importance. The deposition of aerosol particles depends on factors like temperature gradient, gravitational settling, nature of flow, and aerosol geometries. The nature of the deposited layer (mono- or multi-layer), aerodynamic forces, deposited particle properties, and surface features are the parameters that affect resuspension processes. During a turbulent flow, the deposited layer of particles loses its ability to adhere to surfaces and becomes resuspended in flow. This happens when the aerodynamics forces (lift and drag) acting on the particle become larger than cohesive and adhesive forces for particle–surface interactions. Depending upon its size, gravitational force, and aerodynamic force strength, peeled-off aerosol particles follow a rolling motion or a combination of lifting and rolling in the resuspension phase. These mechanisms are modeled in two categories: force-and-moment balance models and energy balance models (Gradoń, 2009). Micro-videography-based investigation by Ibrahim et al. (2003) showed the rolling of particles and subsequent particle-to-particle collisions as two main mechanisms of detachment from the deposited surface, with rolling as the primary contributor. This phenomenon is particularly relevant in reactor components such as vacuum breaker lines, steam generator (SG) tubes, and decay heat removal piping, where deposited materials can re-entrain into the gas flow during system depressurization or emergency cooling operations. Aerosol retention during steam generator tube rupture (SGTR) severe accidents is significantly higher in a flooded steam generator than in a dry one (Lind et al., 2020). Mechanical resuspension within the reactor coolant system (RCS) is particularly important in bypass scenarios such as SGTR as it can directly contribute to the source term. It may occur due to events like core quenching from delayed emergency core cooling system (ECCS) activation, core collapse into residual water at the vessel bottom, or rapid RCS depressurization Parozzi (1992). Additionally, resuspension can happen under high-velocity turbulent gas flows, even under steady flow rates.
In the context of reactor accident aerosol research, specific studies have been conducted in different facilities around the world. Several large-scale experimental campaigns have played a foundational role in shaping our understanding of aerosol behavior in light-water reactor (LWR) severe accidents. The LWR Aerosol Containment Experiments (LACE), conducted at HEDL in Richland and coordinated by Oak Ridge National Laboratory, investigated aerosol retention under containment-scale thermal-hydraulic conditions and provided critical validation data for codes such as MELCOR and CONTAIN (Wright et al., 1986). The CODEX-Aerosol program, conducted at the KFKI Atomic Energy Research Institute, explored aerosol generation and resuspension during simulated reactor core degradation using small-scale fuel bundles. Aerosol emissions—monitored in oxidizing and steam environments—showed strong correlations with temperature rise and fuel cladding oxidation, highlighting the role of chemical speciation and morphology in transport behavior (Pintér Csordás et al., 2000; Hózer et al., 2006). The Aerosol Code Evaluation/Radioactive Tracer Facility (ACE/RTF) experiments further focused on iodine volatility and resuspension under high radiation fields and varying containment pH. These studies demonstrated that iodine speciation becomes independent of initial chemical form due to radiolytic interconversion and that stainless steel versus epoxy surfaces significantly affect sorption behavior. The series also highlighted modeling gaps in organic iodide prediction, surface reactivity, and radiation-induced transformations. Additionally, the Mod-Advanced Corium Experiments (MACE) program under ACE Phase D provided data on heat transfer during molten core–concrete interaction and the generation of aerosols and gases during quenching events—relevant for containment pressure and source term evaluation (Kupferschmidt et al., 1992; Sehgal and Spencer, 1992). Aerosol behavior under severe accident conditions has been studied by performing small and large-scale experimental programs such as PHEBUS FP (Gonfiotti and Paci, 2018; Kissane and Drosik, 2006), DEMONA (Liljenzin et al., 1990), WAVE (Hidaka et al., 2000), DRAGON (Suckow and Guentay, 2008), STORM (De los Reyes et al., 1999), THAI (Gupta et al., 2015), Falcon (Beard et al., 1992), and Wind (Maruyama et al., 1999; Freitag et al., 2018; Freitag et al., 2020). Such studies in context of the Indian Pressurized Water Reactor Program (IPHWR) have been conducted in the National Aerosol Test Facility (NATF) at the Bhabha Atomic Research Centre, India (Sapra et al., 2008; Modi et al., 2014; Dwivedi et al., 2019). To the best of our knowledge, there has been no research into the resuspension phenomenon in such medium- or large-scale facilities under dry conditions. The Indian Institute of Technology (IIT) Kanpur, has recently established the National Aerosol Facility (NAF), which aims to investigate the spatial and temporal evolution of metal oxide aerosols in simple and complex geometries incorporating the study of the deposition and resuspension behavior of aerosols in dry and wet conditions for the context of the IPHWR program. Studies such as the hygroscopic nature of nuclear-accident-relevant cesium-bound compounds (Mishra et al., 2019a; Mishra et al., 2019b), characterization of aerosol generator system (Dwivedi et al., 2020), and the methodology to perform measurements of droplet (Kumar et al., 2022) have been recently performed at NAF.
This study focuses on the deposition and resuspension characteristics of zinc metal oxide aerosol particles in a circular cross section straight piping system of stainless steel at NAF. The choice of a plasma torch aerosol generator (PTAG) as an aerosol generation system ensures that the characteristics of the aerosol particles in the test sections remain as needed for simulating the accident conditions. The choice of zinc oxide (ZnO) aerosols as the test material was based on a combination of operational and physical factors. Metal powders are mostly preferred in PTAGs (Venkatramani, 2002), resulting in controlled and stable aerosol generation, and zinc metal powder fulfils this requirement. In past, studies at NATF (Sapra et al., 2008) and NAF (Dwivedi et al., 2020) have been helpful in optimizing PTAG parameters for experiments such as the current study. In addition, resuspension and thermophoresis are mostly physical phenomena, so they accurately simulate the experiential behavior of any chemical/radioactive species as long as the size and concentration is normalized with respect to the demand conditions.
Despite extensive research on aerosol behavior in nuclear containments, a significant gap remains in understanding deposition and resuspension phenomena within reactor piping systems, especially under temperature gradients and dynamic flow conditions that arise during severe accidents. While existing models include resuspension modules, their validation is often limited to idealized geometries or small-scale test data. This study addresses that gap by conducting large-scale experimental simulations in a stainless-steel pipe representing a segment of reactor primary system piping using measured gas/wall temperatures and flow velocities as inputs. The central hypothesis is that thermal gradients and flow transitions directly govern deposition and resuspension dynamics and that models like SOPHAEROS can reproduce these effects when provided with realistic boundary conditions. The objective is twofold: first, to advance the physical understanding of aerosol behavior under accident-relevant thermal-hydraulic conditions, and second to evaluate the predictive capability of SOPHAEROS under such conditions. The study is designed to contribute to international efforts to refine source term predictions, improve safety code validation, and generate data relevant to severe accident management in light water reactors.
2 Materials and methods
2.1 Test section
The deposition and resuspension experiments were carried out in a test section of NAF. Various components of that facility—powder feeder, plasma torch aerosol generator (PTAG) system, gas delivery system, chiller, and aerosol instrumentation—were utilized in these experiments. Zinc metal oxide particles, generated by PTAG by feeding a controlled supply of zinc powder from the powder feeder (model- MEC PF-3350) to the plasma zone, were used as “test aerosols” during these experiments. For deposition and resuspension analysis, a stainless steel pipe with an internal diameter of 7.62
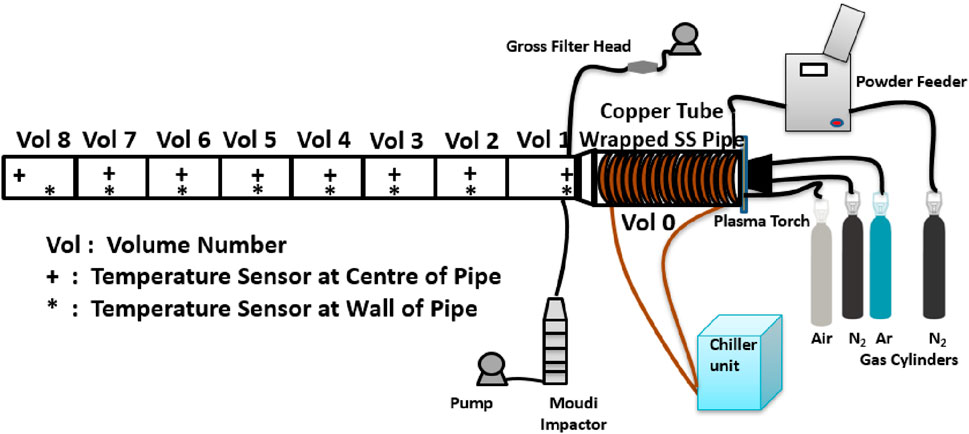
Figure 1. Experimental setup of the depositional phase.
For the resuspension phase of experiment, a 1
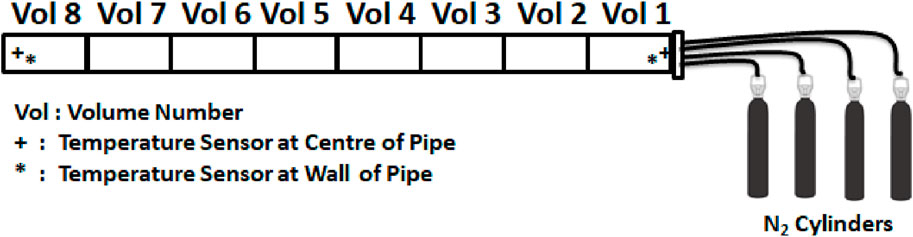
Figure 2. Experimental setup of the resuspension phase.
The gross filter sampler and MOUDI were operated at a flow rate of 30
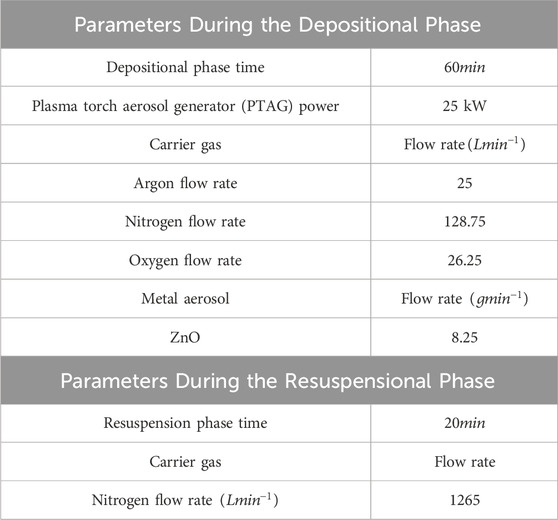
Table 1. Parameters used for experiment
2.2 Experimental procedure
The experiment was divided into two parts: the deposition phase and the resuspension phase. Pilot tests were carried out prior to the main experiments to optimize the aerosol generation parameters such as powder feed rate, plasma torch operating power, and carrier gas flow rate. The pilot experiments helped determine optimal duration and sampling flow rates for the experiment, ensuring that the aerosol instrumentation (MOUDI, PTAG flame nozzle, etc.) was not clogged while also ensuring adequate deposition on the impactor filter papers and in the test section. Aerodynamic diameter measurements using the impactor account for particle shape, density, and drag coefficient. Thus, while shape was not measured separately, it was incorporated in the aerodynamic behavior observed through the impactor. Table 1 lists the parameters used in all experiments. Before each experimental run, the entire test section was manually cleaned with a lint-free damp cloth, followed by flushing with HEPA-filtered air for 15 min using a centrifugal blower. This ensured a near-zero background aerosol concentration, confirmed by blank gross filter samples. Zinc oxide aerosols were generated continuously for 60 min at a controlled feed rate of 8.25 g/min. A stabilization period of 60 s after plasma torch ignition ensured a steady aerosol flow before particle injection into the test section. All measurement instruments used in the study were calibrated to ensure the accuracy and reliability of the results. The MOUDI was calibrated by the manufacturer using standard aerosol size reference particles. The gravimetric mass balance used for filter weighing was auto-calibrated and cross-checked using certified standard weights. The thermocouples employed for wall and gas temperature measurements were factory-calibrated against a certified mercury thermometer. Due to the large-scale and destructive nature of the experiment, full repeatability was not feasible. However, quality assurance was ensured through internal consistency checks and careful pre- and post-sampling filter weighing using a high-precision microbalance. The relative uncertainty in temperature measurements, as per the manufacturer’s specification, ranged from
The log-normal particle size distribution, with a mass mean aerodynamic diameter (MMAD) of 0.5
The resuspension phase of the experiment was performed the next day. This phase of the experiment was carried out with a carrier gas flow rate of 1265
As it was not possible to measure the deposited mass of aerosols in the test section and resuspended in the same aerosol, the experiment was divided into two phases: deposition and resuspension. In the deposition phase, aerosols were deposited in the test sections, scrubbed manually, and measured gravimetrically. In the resuspension phase, the aerosols were first deposited under same input parameters and run time that were used in the depositional phase, and then these aerosols were resuspended under the mentioned flow condition. This method was verified from the pilot experiments and found to be suitable.
3 Numerical approach
This work used numerical simulations performed with Aerosol Source Term Evaluation Code (ASTEC) to compare experimental and theoretical results. ASTEC, jointly developed by the French Institut de Radioprotection et de Sûreté Nucléaire (IRSN) and the German Gesellschaft für Anlagen und Reaktorsicherheit mbH (GRS), is used for simulating an entire severe accident sequence in a nuclear water-cooled reactor from an initiating event. It has been used for several studies/applications in varied contexts, such as source term estimation, probabilistic safety assessment, accident management, and phenomenological interpretations (Chatelard et al., 2014). The modular flexibility of ASTEC helps researchers design experiments for studying standalone as well as integral mechanisms that target specific reactor component systems (RCS) and/or a certain phase of the accident sequence. The SOPHAEROS module of ASTEC is intended to simulate major fission product vapor and aerosol phenomena in the RCS, composed of a 1D series of control volumes (Cousin et al., 2008).
The SOPHAEROS module solves aerosol and vapor transport equations using a volume-based iterative approach. Each control volume represents a segment of the physical pipe and is solved sequentially at every step using an implicit Newton–Raphson scheme. In each volume, SOPHAEROS first determines the vapor-phase chemical equilibrium based on the mass of elements and species transferred from the previous iteration. It then constructs a matrix system that includes fluxes and source terms related to key physical phenomena: homogeneous and heterogeneous nucleation, condensation/evaporation, coagulation, sorption, deposition, and mechanical resuspension. These fluxes are evaluated based on both volatile and non-volatile species. The model tracks aerosol and vapor mass in five physical states: (1) volatile species in the vapor phase; (2) suspended non-volatile aerosols; (3) volatile species condensed on walls; (4) deposited aerosols; (5) sorbed vapor species on surfaces. Aerosols are also divided into multiple particle size classes, allowing for dynamic updates due to coagulation and deposition processes. At each step, the solver balances source terms (from aerosol input, inter-volume transport, and surface interactions), linear transport and deposition rates, and nonlinear terms (such as coagulation and condensation). The resulting nonlinear system is solved using an iterative Newton update, with convergence achieved based on changes in mass across all tracked states and size bins. This approach allows SOPHAEROS to capture the evolving aerosol size distribution and deposition behavior along the pipe under varying thermal and flow conditions using experimentally measured temperatures and flow rates as fixed boundary conditions.
In this study, only the SOPHAEROS module of ASTEC was available and utilized in the standalone mode. As a result, no thermal-hydraulic calculations were performed using CESAR (the module responsible for two-phase thermal hydraulics in full ASTEC simulations). Instead, the wall and gas temperature profiles (Figure 4) obtained experimentally during the deposition phase were directly supplied as input boundary conditions in each control volume. These fixed temperatures influenced deposition and resuspension phenomena through thermophoresis and vapor equilibrium models but were not dynamically computed. The key aerosol parameters given as input to the code are MMAD = 0.5
SOPHAEROS is a lumped-parameter code that employs a one-dimensional (1D) axial representation of the system in which the physical test pipe is modeled as a sequence of control volumes. While this approach allows for the simulation of axial aerosol transport and thermophoretically driven deposition, it inherently lacks the ability to capture three-dimensional (3D) flow characteristics, such as radial velocity gradients, parabolic profiles, and circumferential non-uniformities that naturally arise in pipe flow. Unlike full 3D computational fluid dynamics (CFD) codes such as RELAP5-3D or ANSYS Fluent, SOPHAEROS does not resolve detailed boundary layer development or wall shear stress distributions. As a result, while it cannot predict localized hot spots or asymmetrical deposition patterns, it can reasonably approximate overall deposition trends and axially averaged mass distributions. This dimensional simplification may introduce some uncertainties, particularly in entrance regions with steep gradients. However, when supplied with accurate thermal and flow boundary conditions, SOPHAEROS is capable of providing good agreement with experimental data and valuable insights into aerosol transport behavior.
Coagulation is an important phenomenon for the interaction and growth of aerosol particles. The coagulation of particles increases their size and hence enhances their deposition. The SOPHAEROS module integrates these phenomena in the aerosol dynamic equation. These depositional mechanisms are discussed in the subsequent sections. The mass balance equation for intra-volume mechanisms and inter-volume transport develops a nonlinear system which is solved by adopting an implicit numerical approach. All the phenomena are computed in each control volume. An implicit method of solution allows coupling between the condensation/evaporation of vapor on/from wall and aerosol dynamical processes (nucleation, agglomeration/coagulation, and drifts) which are solved in each control volume. The aerosol distribution is modeled using a sectional approach. In all aerosol size classes, the same species composition is taken into account. This section discusses the mathematical framework of the SOPHAEROS module adopted for performing theoretical simulation.
3.1 Coagulation
Coagulation/agglomeration is the process by which particles are chemically or physically bonded together, resulting in coagulated particles. These coagulated particles tend to settle down more quickly than their parent particles since they are larger in size.
There are three basic mechanisms for aerosol coagulation to consider the following:
a) Brownian coagulation
b) gravitational coagulation
c) turbulent coagulation.
These mechanisms are discussed below.
3.1.1 Brownian coagulation
The model for the calculations of Brownian coagulation kernels in continuum flow regime is discussed in Loyalka (1976) and Williams and Loyalka (1991).
In this model, coagulation kernel between particle size classes i and j can be written as follows (Equation 1):
—where
3.1.2 Gravitational coagulation
The coagulation kernel between particle size classes i and j is calculated using the below Equation 3 (Pruppacher and Klett, 2012):
—where:
3.1.3 Turbulent coagulation
The turbulent coagulation kernel (Equation 7) is based on a quadratic combination of the shear turbulent (sh) (Equation 5) and inertial turbulent (in) kernels (Equation 6) and follows the Saffman–Turner approach ((Levich and Tobias, 1963) Williams and Loyalka, 1991). For shear turbulence, the kernel can be written as
–where
The following relationship determines the inertial turbulent coagulation kernel
A quadratic combination yields the resulting turbulent coagulation kernel and is given by
3.1.4 Resultant coagulation
In the case of simultaneously active mechanisms, all the above four coagulation kernels must be examined in order to calculate the resultant coagulation kernels (Equation 8).
A linear and quadratic combination produces the resulting coagulation kernel:
The coagulation kernels
3.2 Deposition mechanism
Gravitational settling, laminar diffusion deposition, and thermophoresis are the primary mechanisms responsible for aerosol deposition. The models for the deposition process used by the SOPHAEROS module of the ASTEC are discussed below.
3.2.1 Gravitational settling
Gravitational settling is the accumulation of particles under the influence of gravity. Since the mass of an aerosol particle is small, the corresponding settling velocity can be termed the “Stokes velocity” (Equation 9).
When the drag force of the fluid on the particle is precisely equal and contrary to the force of gravity, the Stokes velocity is calculated using the equation below.
The settling velocity is given by Equation 10 below
The corresponding settling rate is given in below Equation 11
—where:
3.2.2 Laminar diffusion
For
Then, two ratios (Equation 16 and 17) based on the values of h are considered:
The laminar diffusion deposition velocity is given by Equation 18
Its corresponding deposition rate is given by Equation 19
—where:
3.2.3 Thermophoretic deposition
An aerosol particle in a gas experiences a force in the direction of reducing temperature if a temperature gradient occurs in that gas. The aerosol particles migrate toward the wall surface and bind to it due to the higher temperature of the gas relative to the wall surface temperature; this is known as thermophoretic deposition. The Talbot formulation (Talbot et al., 1980) is used to calculate thermophoretic deposition velocity (Equation 20):
The corresponding deposition rate is given in Equation 21
—where:
3.3 Resuspension
Aerosol transport is a function of carrier fluid, aerosol deposition, and aerosol resuspension. Resuspension restores deposited aerosols to the fluid system as resuspended aerosols are again available to transport with the fluid and may contribute to an increase in the source term. Dry deposited aerosol is easier to resuspend than wet. The Reynolds number plays a vital role in the resuspension of aerosol. Numerically defined, the resuspension force
For wall/ceiling surfaces, it is given by
For bottom surfaces, it is given by
For resuspension forces
The empirical constants
ASTEC’s SOPHAEROS module calculates resuspension using the force balance model by default. The first statistical force balance model considering the effect of various forces on a deposited particle in a turbulent boundary layer was proposed by Cleaver and Yates (1973). If the vector sum of aerodynamic forces acting on a surface is greater than the adhesive forces detaching the particle from the surface, the aerosol is resuspended from the surface. The term “adhesive forces” refers to any of the forces that cause particles to adhere to depositing surfaces, such as gravitational forces, inter-molecular forces such as van der Waals interactions such as cohesive and adhesive force (Katainen et al., 2006), and chemical bonds such as hydrogen bonds (Krupp and Sperling, 1966). The resuspension rate formula is based on several results (Parozzi, 1992; Wright et al., 1984; Fromentin, 1989). The resuspension rate is measured at the bottom and wall surfaces of each wall where particle resuspension is to be considered for each particle species and particle size class.
3.3.1 Adhesive forces
Adhesive forces are categorized into gravitational, cohesive, and frictional forces. These forces cause aerosol to stick and form a layer. Gravitational settling occurs only in the direction of gravity; thus, gravitational force
—where:
Cohesive forces
—where:
the SOPHAEROS module uses the default value of
Frictional forces
where
3.3.2 Aerodynamic forces
The aerodynamic forces comprise the drag force
—where the shear stress
—where:
Turbulent burst randomly contributes to the resuspension of particles. The model is based on the measurement of the frequency distribution of its occurrence and is given in Equation 30. The data have been estimated from experiments for clean fluid flow conditions as a function of friction velocity
—where:
The default value model constant in the SOPHAEROS module is taken from Parozzi et al. (1995).
4 Results and discussion
The experiments were conducted in two stages: depositional and resuspensional. Pilot experiments were used to establish the inlet concentration during the depositional phase and carrier gas flow rate during the resuspension phase. The mass concentration of inlet particles was kept at approximately 5
4.1 XRD analysis
The crystalline phase of the deposited metal oxide particles on the inner wall of the test volumes was determined using X-ray diffraction (XRD). A Cu K
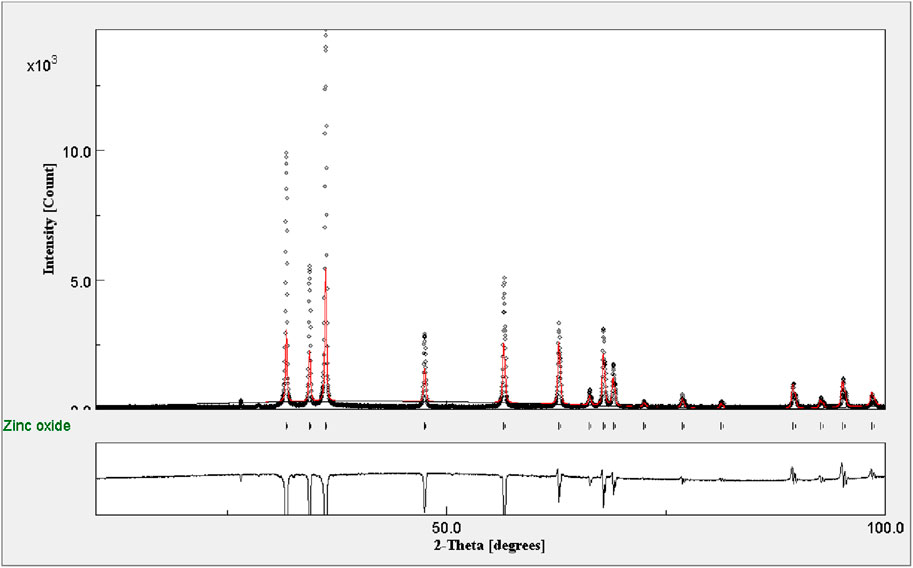
Figure 3. XRD plot of deposited aerosol particle.
4.2 Temperature profiles
The temperature of the plasma torch’s carrier gas is determined by the plasma torch’s operating power: the greater the operating power, the higher the carrier gas temperature. The operating power of PTAG used in this experiment was 25 kW. Figure 4 shows the temperature profile of the test sections during the depositional phase. Thermophoretic deposition is driven by the thermal gradient between the carrier gas and the inner wall of the test sections, so the wall temperature and carrier gas temperature were measured in each test section and are shown in Figures 4a,b, respectively. The continuous recirculation of cold water through the copper-wrapped tube significantly reduced the temperature of volume 0. Through threading, the volume 1 pipe was assembled to volume 0. The optimum heat transmission by conduction was possible with this metal-to-metal link. As the wall temperature of volume 0 was low, so the temperature of the wall of volume 1 was also low, but the convection mode of heat transfer from high-temperature carrier gas significantly increased the temperature of the volume 1 wall. In the experiment, it was observed that the wall temperature of volume 0 was significantly lower than the wall temperature of volume 1. Furthermore, volumes 2 and 1 were assembled through the thread, allowing optimum conduction heat transfer between the wall. The temperature difference between the carrier gas and the wall caused heat dissipation which further reduced the temperature of the carrier gas in volume 2. Thus, as shown in Figures 4a,b, the wall temperature of volumes 1 and 2 was almost the same, but the carrier gas temperature of volume 2 was significantly lower than that of volume 1. As flow moved downstream of volume 2, the wall temperature of the downstream volumes reduced significantly with the reduction in carrier gas temperature due to heat dissipation. The abrupt increase in wall temperature became gradual after 750
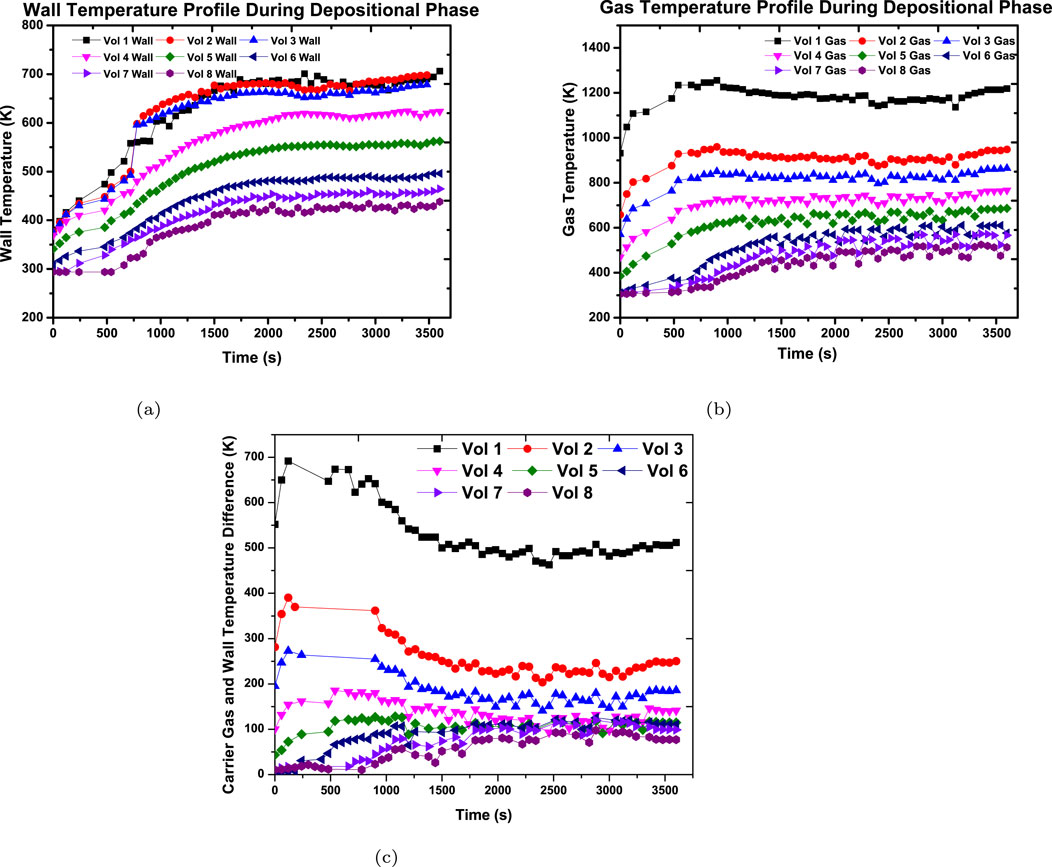
Figure 4. Temperature profile of test section. (a) Wall temperature. (b) Gas temperature. (c) Temperature difference.
4.3 Carrier gas properties
Carrier gas velocity was kept low during the depositional phase to sustain a laminar flow as the resuspension of deposited aerosol particles is negligible in a laminar flow field (Parozzi et al., 1995). Table 2 shows the carrier gas velocity and Reynolds number calculated by ASTEC at the end of the depositional phase. As discussed in the previous section, gas temperature reduced from volume 1 to volume 8. Carrier gas obeys the perfect gas law; thus a reduction in gas temperature dominated the pressure drop phenomenon in the constant cross section pipe, ultimately causing a rise in gas density. For a pipe with a constant cross section, the law of mass conservation states that with no mass addition or subtraction, velocity is inversely proportional to the density of gas. In this experiment, the rise in density led to a reduction in the velocity of the carrier gas. Moreover, the temperature drop indicated a rise in viscosity, as per the kinetic theory of ideal gases. The velocity effect was dominated by the combination of density and viscosity; because of this, the Reynolds number went up on moving down the axial length of the test section, from volume 1 to volume 8.
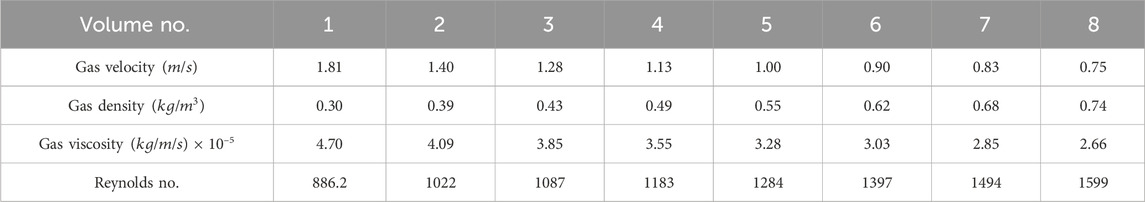
Table 2. Carrier gas properties during depositional phase.
Since resuspension begins to at a high gas velocity during a turbulent flow, the inlet velocity of carrier gas is critically important. As mentioned in Parozzi et al. (1995), gas mass flow rate increases to more than 30 kg/s as a result of the core fall into the bottom plenum of the vessel, corresponding to hot leg and surge line velocities of over 3 m/s and 20 m/s, respectively. For this experiment during the resuspension phase, the inlet velocity of carrier gas was set at 4.58
4.4 Aerosol characteristics during deposition and resuspension
4.4.1 Depositional phase
Figure 5 shows the cumulative mass percentage of the zinc oxide aerosol particles deposited at different stages of the MOUDI measured at the inlet of the test section during the deposition phase. The MMAD was found to be 0.5
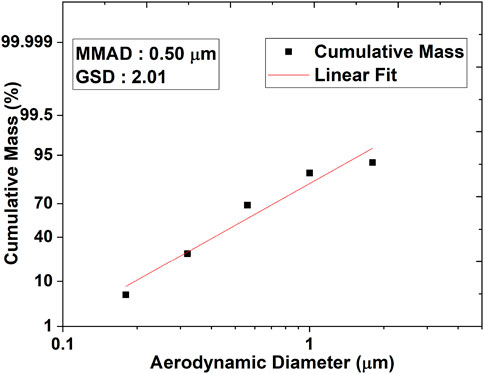
Figure 5. Cumulative mass percentage of zinc particle aerosols.
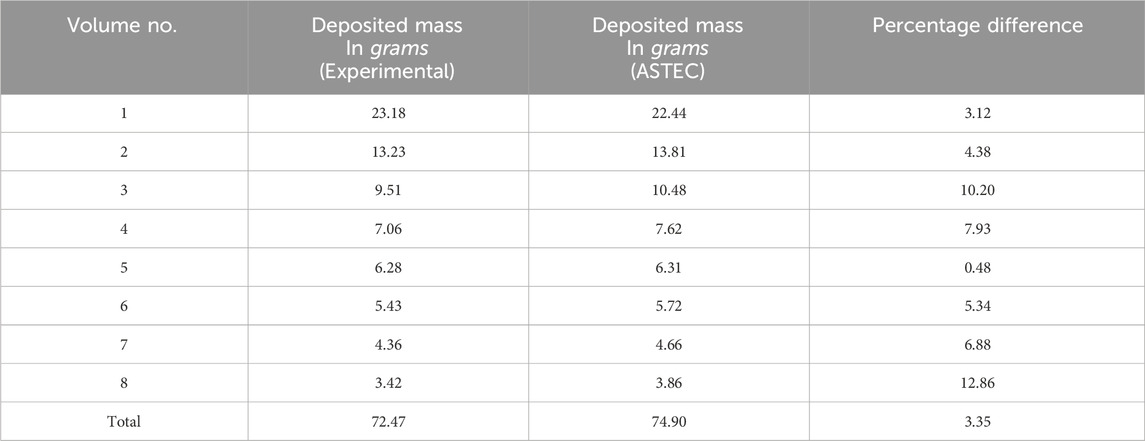
Table 3. Mass deposited after the depositional phase.
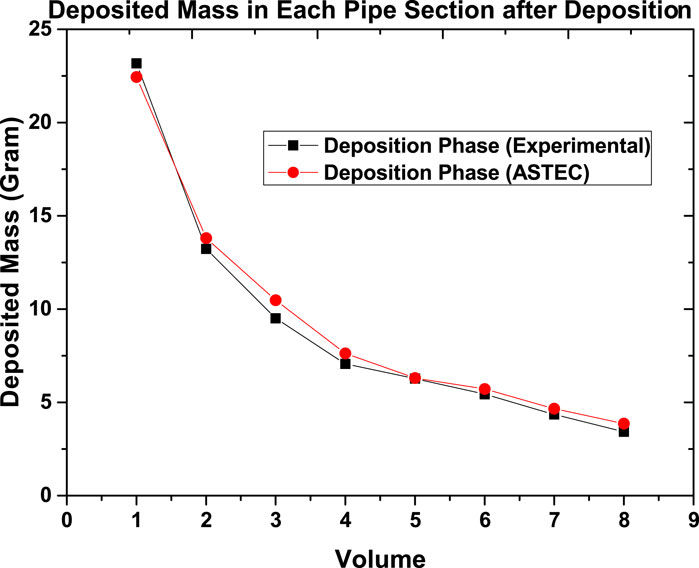
Figure 6. Deposited mass in each test section after the depositional phase.
The initial aerosol size distribution was characterized by an MMAD of 0.5
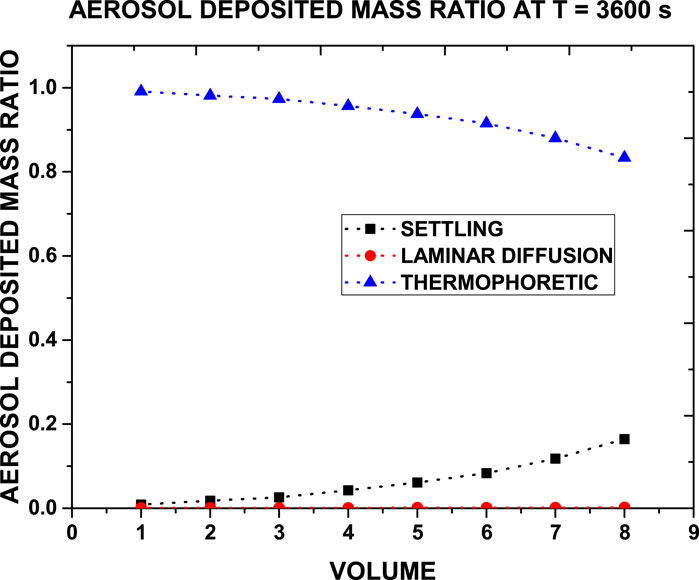
Figure 7. Aerosol deposited mass ratio for different depositional mechanism.
4.4.2 Resuspension phase
The mass of the aerosols deposited in each volume of the test section, both experimentally and as computed by ASTEC after the resuspension phase, is shown in Table 4. During the resuspension phase,
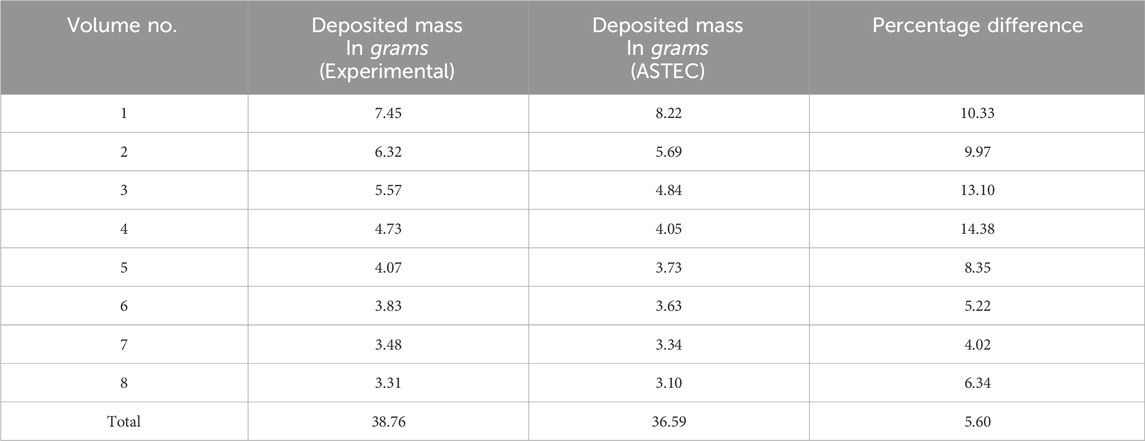
Table 4. Mass deposited after the resuspension phase.
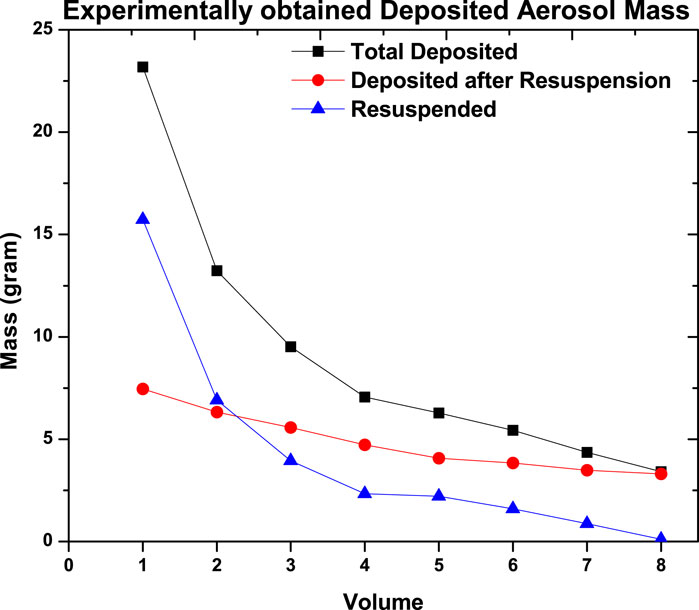
Figure 8. Experimentally obtained deposited and resuspend mass of aerosol.
In overcoming the adhesive forces of the deposited aerosols, the carrier gas lost its kinetic energy while stripping the deposited aerosol from the surface of volume 1. Furthermore, the kinetic energy of the carrier gas decreased as it transported the resuspended aerosols, resulting in a decrease in carrier gas velocity. As the carrier gas flowed downstream, the striping effect diminished, resulting in a reduction in the mass of resuspension of deposited aerosol. This diminishing striping effect caused a larger mass of deposited aerosol to remain deposited after volume 1, as shown in 8.
ASTEC underpredicted the deposited aerosol mass after resuspension (overpredicting the mass of resuspended aerosols) in all volumes of the test section except volume 1 (Figure 9). The carrier gas was fed directly into test volume 1 through seven separate tubes. As already mentioned, ASTEC is a one-dimensional code, so the source of difference can be the absence of an actual velocity profile as the initial condition.
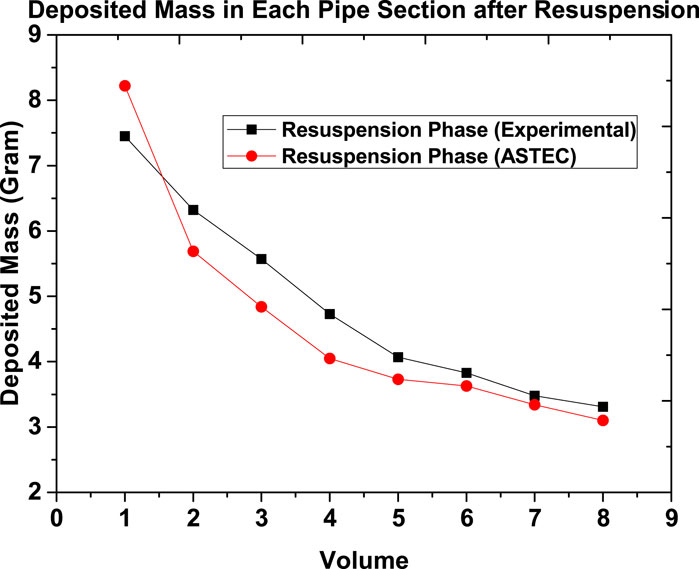
Figure 9. Deposited mass in each test section after the resuspension phase.
Figure 10 shows the ratio of resuspended aerosol mass to that of deposited aerosol mass. It can be clearly observed that the mass of resuspended aerosol decreased from volumes 1 to 8 in the experiment as well as computation. The trends of the ratio are clearly in good agreement. However, there are slight quantitative differences between the ratio of mass obtained from the experiment and the ASTEC code. This may be because of the input of the actual velocity profile during the resuspension phase. Figure 10 shows that the mass of the resuspended aerosol is more than that of the deposited aerosol at the beginning of the test section. On moving downstream along the test section, these resuspended aerosol masses decrease and become less than that of the deposited mass of aerosol. This phenomenon is attributed to loss of kinetic energy of the carrier gases (as mentioned above).
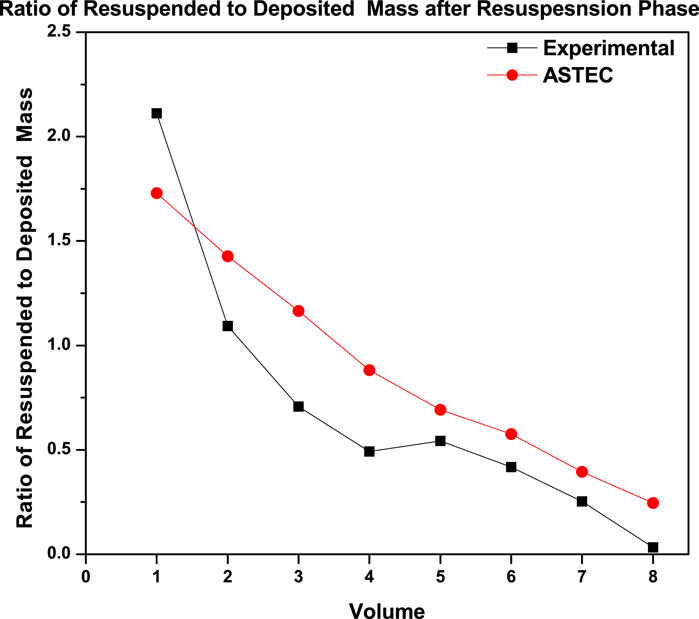
Figure 10. Ratio of resuspended to deposited aerosol mass after the resuspension phase.
4.5 Evolution of deposited aerosol mass during deposition and resuspension phase
The deposited mass in the test section with respect to time, as estimated by ASTEC, is shown in Figure 11. In Figure 11a, aerosol deposition occurred at a higher rate within 750 s of the experiment. This is consistent with Figure 4, wherein a higher gas-to-wall temperature gradient is evident within this timeframe. Once the gradient reduced and saturated, the slope of the curve decreased due to lesser thermophoresis deposition and became constant. Within 3,600 s of this experimental phase, the deposited mass increased to 72.47 g, In contrast, the mass of deposited particles reduced constantly during the resuspension phase, becoming 38.76 g from 72.47 g during an experimental duration of 20 minutes as can be seen in Figure 11b. It can thus be concluded that the default force balance model for resuspension in the SOPHAEROS module (Cousin et al., 2008) is highly dependent on the duration of the resuspension process.
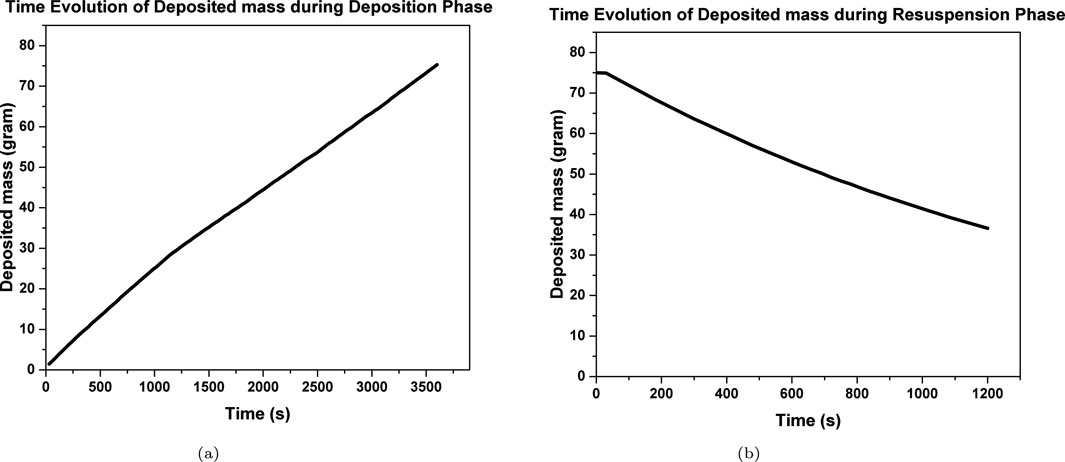
Figure 11. Computationally obtained time evolution of deposited aerosol mass. (a) Deposition phase. (b) Resuspension phase.
5 Summary and conclusion
At the National Aerosol Facility of the Indian Institute of Technology, Kanpur, India, an experiment was conducted to investigate the deposition and resuspension of zinc oxide aerosol under dry environment conditions in a circular cross-section straight stainless steel pipe. The test aerosols were generated using a plasma torch aerosol generator by introducing zinc metal powder into the plasma flame, wherein aerosolization occurred via the evaporation–condensation technique. The XRD analysis confirmed the formation of zinc oxide particles with no traces of zinc metal powder. The deposition phase of the experiment took place at a high temperature gradient laminar flow, while resuspension took place at a zero thermal gradient turbulent flow. The experimental results are also compared with the computational results from the SOPHAEROS module of the ASTEC code.
During the deposition phase of the experiments, the temperature gradient between the bulk gas and wall temperature was measured in all eight test volumes of the test section. It was seen that the temperature gradient increased initially and then reduced after approximately 750 s, finally saturating to an equilibrium value. Higher temperature gradient results in higher thermophoresis, which was also captured by code simulation and thermophoresis, was found to be the major deposition process. Overall, the experimentally measured reduction of deposited mass in subsequent volumes was seen to match the ASTEC predicted results. In the resuspension phase, the striping of deposited aerosol and the transportation of resuspended aerosol caused mitigation in the kinetic energy of the carrier gas. The reduction in kinetic energy caused less stripping of deposited aerosol in the downstream test section. However, visual observation from the open end of the test section during the experiment revealed that the majority of the resuspension took place within a few seconds of the start of the resuspension process. Thus, it can be concluded that the default force balance model for resuspension in the SOPHAEROS module is highly dependent on the duration of the resuspension process. The trends obtained experimentally and computationally for the deposition and resuspension phases are in good agreement. However, quantitatively, the ASTEC result shows slight deviation from the experimental results. The main reason for these deviations could be due to the 1D-coded ASTEC limiting the use of the actual flow profile as the initial condition of the simulation. These results provide a good foundation for large-scale experiments and the development of severe accident simulation codes.
This study provides insights into aerosol behavior in nuclear-relevant pipe geometry under thermal gradient-driven deposition and high-flow resuspension. The experimental results serve not only to elucidate the dominant transport and interaction mechanisms but also to support the evaluation of SOPHAEROS predictions. While the model performs well in capturing overall trends when supplied with accurate thermal and velocity inputs, further development and validation, especially in resolving 3D effects, remain areas for future research.
Data availability statement
The original contributions presented in the study are included in the article/supplementary material, further inquiries can be directed to the corresponding author.
Author contributions
MK: Writing – original draft, Writing – review and editing. MJ: Writing – review and editing. AD: Writing – review and editing. SK: Writing – review and editing. TS: Writing – review and editing. AK: Writing – review and editing. GM: Writing – review and editing. NS: Writing – review and editing. SG: Writing – review and editing. ST: Writing – review and editing. BS: Writing – review and editing.
Funding
The author(s) declare that financial support was received for the research and/or publication of this article. The authors gratefully acknowledge the financial support provided by the Board of Research in Nuclear Science (BRNS), Department of Atomic Energy (DAE), Government of India to conduct this research under project no. 36(2,4)/15/01/2015-BRNS.
Conflict of interest
The authors declare that the research was conducted in the absence of any commercial or financial relationships that could be construed as a potential conflict of interest.
Generative AI statement
The author(s) declare that no Generative AI was used in the creation of this manuscript.
Publisher’s note
All claims expressed in this article are solely those of the authors and do not necessarily represent those of their affiliated organizations, or those of the publisher, the editors and the reviewers. Any product that may be evaluated in this article, or claim that may be made by its manufacturer, is not guaranteed or endorsed by the publisher.
References
Beard, A. M., Bennett, P. J., Bowsher, B. R., and Brunning, J. (1992). The Falcon programme: characterisation of multicomponent aerosols in severe nuclear reactor accidents. J. Aerosol Sci. 23, 831–834. doi:10.1016/0021-8502(92)90540-c
Chatelard, P., Reinke, N., Arndt, S., Belon, S., Cantrel, L., Carenini, L., et al. (2014). Astec v2 severe accident integral code main features, current v2. 0 modelling status, perspectives. Nucl. Eng. Des. 272, 119–135. doi:10.1016/j.nucengdes.2013.06.040
Cleaver, J. W., and Yates, B. (1973). Mechanism of detachment of colloidal particles from a flat substrate in a turbulent flow. J. Colloid Interface Sci. 44 (3), 464–474. doi:10.1016/0021-9797(73)90323-8
Cousin, F., Dieschbourg, K., and Jacq, F. (2008). New capabilities of simulating fission product transport in circuits with astec/sophaeros v.1.3. Nucl. Eng. Des. 238 (9), 2430–2438. doi:10.1016/j.nucengdes.2008.03.018
de los Reyes Castelo, A., Capitão, J. A., and De Santi, G. (1999). International standard problem 40 aerosol deposition and resuspension. JRC EUR, 18708.
Dwivedi, A. K., Khan, A., Tripathi, S. N., Joshi, M., Mishra, G., Nath, D., et al. (2019). Aerosol depositional characteristics in piping assembly under varying flow conditions. Prog. Nucl. Energy 116, 148–157. doi:10.1016/j.pnucene.2019.04.007
Dwivedi, A. K., Kumar, M., Mishra, G., Joshi, M., Khan, A., Tiwari, N., et al. (2020). Optimization of controlling parameters of plasma torch aerosol generator and characteristics of synthesized metal oxide aerosols in context of naf program. Prog. Nucl. Energy 123, 103311. doi:10.1016/j.pnucene.2020.103311
Fluke, R. J., Edward, J. B., Weaver, K. R., and Evans, G. J. (1992). Advanced containment experiments (ace): evaluation of pre-test code calculations of iodine behaviour in the radioiodine test facility.
Freitag, M., Kljenak, I., Jankowski, T., Risken, T., Kostka, P., Götz, L., et al. (2018). Benchmark exercise th-27 on natural convection with steam injection and condensation inside the extended Thai facility. Ann. Nucl. Energy 116, 90–104. doi:10.1016/j.anucene.2018.02.027
Freitag, M., von Laufenberg, B., Colombet, M., and Klauck, M. (2020). Measurements of the impact of carbon monoxide on the performance of passive autocatalytic recombiners at containment-typical conditions in the Thai facility. Ann. Nucl. Energy 141, 107356. doi:10.1016/j.anucene.2020.107356
Fromentin, A. (1989). Particle resuspension from a multi-layer deposit by turbulent flow (No. PSI–38). Wuerenlingen: Paul Scherrer Inst. (PSI).
Gonfiotti, B., and Paci, S. (2018). Stand-alone containment analysis of phébus FPT tests with ASTEC and MELCOR codes: the FPT-2 test. Heliyon 4 (3), e00553. doi:10.1016/j.heliyon.2018.e00553
Gormley, P. G., and Kennedy, M. (1948). Diffusion from a stream flowing through a cylindrical tube. Proceedings of the royal irish academy. Section A: mathematical and physical sciences. 52. 163–169. Available online at: http://www.jstor.org/stable/20488498.
Gradoń, L. (2009). Resuspension of particles from surfaces: technological, environmental and pharmaceutical aspects. Adv. Powder Technol. 20 (1), 17–28. doi:10.1016/j.apt.2008.10.009
Gupta, S., Schmidt, E., von Laufenberg, B., Freitag, M., Poss, G., Funke, F., et al. (2015). Thai test facility for experimental research on hydrogen and fission product behaviour in light water reactor containments. Nucl. Eng. Des. 294, 183–201. doi:10.1016/j.nucengdes.2015.09.013
Hidaka, A., Shibazaki, H., Yoshino, T., and Sugimoto, J. (2000). Deposition of cesium iodide particles in bends and sections of vertical pipe under severe accident conditions. J. Aerosol Sci. 31 (9), 1045–1059. doi:10.1016/S0021-8502(00)00038-0
Hózer, Z., Maróti, L., Windberg, P., Matus, L., Nagy, I., Gyenes, G., et al. (2006). Behavior of vver fuel rods tested under severe accident conditions in the codex facility. Nucl. Technol. 154 (3), 302–317. doi:10.13182/nt06-a3735
Ibrahim, A. H., Dunn, P. F., and Brach, R. M. (2003). Microparticle detachment from surfaces exposed to turbulent air flow: controlled experiments and modeling. J. Aerosol Sci. 34 (6), 765–782. doi:10.1016/S0021-8502(03)00031-4
Kamiya, K., Ozasa, K., Akiba, S., Niwa, O., Kodama, K., Takamura, N., et al. (2015). Long-term effects of radiation exposure on health. Lancet 386 (9992), 469–478. doi:10.1016/S0140-6736(15)61167-9
Katainen, J., Paajanen, M., Ahtola, E., Pore, V., and Lahtinen, J. (2006). Adhesion as an interplay between particle size and surface roughness. J. Colloid Interface Sci. 304 (2), 524–529. doi:10.1016/j.jcis.2006.09.015
Kissane, M. P., and Drosik, I. (2006). Interpretation of fission-product transport behaviour in the Phébus FPT0 and FPT1 tests. Nucl. Eng. Des. 236 (11), 1210–1223. doi:10.1016/j.nucengdes.2005.10.012
Kottapalli, K., and Novosselov, I. V. (2019). Experimental study of aerodynamic resuspension of rdx residue. Aerosol Sci. Technol. 53 (5), 549–561. doi:10.1080/02786826.2019.1587377
Krupp, H., and Sperling, G. (1966). Theory of adhesion of small particles. J. Appl. Phys. 37 (11), 4176–4180. doi:10.1063/1.1707996
Kumar, S., Mishra, G., Kumar, M., Kumar Dwivedi, A., Saud, T., Khan, A., et al. (2022). Response of pdpa to optical materials and thickness of test section window. Measurement 197, 111317. doi:10.1016/j.measurement.2022.111317
Kupferschmidt, W. C. H., Evans, G. J., Jobe, D. J., Melnyk, A. J., Portman, R., Palson, A., et al. (1992). The advanced containment experiments (ace) radioiodine test facility experimental program. 253–267.
Lerko, M., Valets, I., Lev, A, Igarashi, Y., and Romanenko, O. (2021). Simulation study of radionuclide atmospheric transport after wildland fires in the chernobyl exclusion zone in April 2020. Atmos. Pollut. Res. 12 (3), 193–204. doi:10.1016/j.apr.2021.01.010
Levich, V. G., and Tobias, C. W. (1963). Physicochemical hydrodynamics. J. Electrochem. Soc. 110 (11), 251C. doi:10.1149/1.2425619
Liljenzin, J. O., Collen, J., Schock, W., and Rahn, F. J. (1990). “Report from the marviken-v: demona: lace workshop,” in Proceedings of the workshop on aerosol behaviour and thermal–hydraulics in the containment, CSNI report, 176.
Lind, T., Campbell, S., Herranz, L. E., Kissane, M., and Song, J. H. (2020). A summary of fission-product-transport phenomena during sgtr severe accidents. Nucl. Eng. Des. 363, 110635. doi:10.1016/j.nucengdes.2020.110635
Loyalka, S. K. (1976). Brownian coagulation of aerosols. J. Colloid Interface Sci. 57 (3), 578–579. doi:10.1016/0021-9797(76)90237-x
Maruyama, Y., Shibazaki, H., Igarashi, M., Maeda, A., Harada, Y., Hidaka, A., et al. (1999). Vapor condensation and thermophoretic aerosol deposition of cesium iodide in horizontal thermal gradient pipes. J. Nucl. Sci. Technol. 36 (5), 433–442. doi:10.1080/18811248.1999.9726226
Mezaki, Y., Kato, S., Nishikawa, O., Takashima, I., Tsubokura, M., Minowa, H., et al. (2019). Measurements of radiocesium in animals, plants and fungi in Svalbard after the fukushima daiichi nuclear power plant disaster. Heliyon 5 (12), e03051. doi:10.1016/j.heliyon.2019.e03051
Mishra, G., Tripathi, S., Saud, Dr. T., Joshi, M., Khan, A., and Sapra, B. (2019a). Study on ccn activity of fission product aerosols (csi and csoh) and their effect on size and other properties. Atmos. Res. 236, 104816–12. doi:10.1016/j.atmosres.2019.104816
Mishra, G., Kumar Mandariya, A., Tripathi, S. N., Mariam, M. J., Khan, A., Sapra, B. K., et al. (2019b). Hygroscopic growth of csi and csoh particles in context of nuclear reactor accident research. J. Aerosol Sci. 132, 60–69. doi:10.1016/j.jaerosci.2019.03.008
Modi, R., Khan, A., Joshi, M., Ganju, S., Singh, A. K., Srivastava, A., et al. (2014). Metal oxide aerosol dry deposition in laminar pipe flow at high thermal gradients and comparison with sophaeros module of astec reactor accident analysis code. Ann. Nucl. Energy 64, 107–113. doi:10.1016/j.anucene.2013.09.032
Parozzi, F. (1992). Computer models on fission product and aerosol behaviour in the LWR primary coolant system–part II: fission product and aerosol transport. CEC–JRC Ispra Site, EUR, 14676, 730.
Parozzi, F., Alonso, A., Bolado, R., Hontanon, E., Capitao, J. A., and Drossinos, Y. (1995). Aerosol physical resuspension under lwr severe accident conditions. Luxembourg: EUR.
Pintér Csordás, A., Matus, L., Czitrovszky, A., Jani, P., Maróti, L., Hózer, Z., et al. (2000). Investigation of aerosols released at high temperature from nuclear reactor core models. J. Nucl. Mater. 282 (2-3), 205–215. doi:10.1016/s0022-3115(00)00400-1
Pöllänen, R., Toivonen, H., Lahtinen, J., and Ilander, T. (1995). Transport of large particles released in a nuclear accident.
Pruppacher, H. R., and Klett, J. D. (2012). Microphysics of Clouds and Precipitation: reprinted 1980. Springer Science and Business Media.
Sapra, B. K., Mayya, Y. S., Khan, A., Sunny, F., Ganju, S., and Kushwaha, H. S. (2008). Aerosol studies in a nuclear aerosol test facility under different turbulence conditions. Nucl. Technol. 163 (2), 228–244. doi:10.13182/NT08-A3983
Sehgal, B. R. (2011). Nuclear safety in light water reactors: severe accident phenomenology. 1st Edn. Academic press
Sehgal, B. R., and Spencer, B. W. (1992). ACE program phase D: melt attack and coolability experiments (MACE) program. 2. OECD (NEA) CSNI Specialist Meeting on Molten Core Debris-Concrete Interactions, 353–364. Available online at: https://inis.iaea.org/records/0sf9r-xgw95.
Shahidi, F., and Brown, J. A. (1998). Carotenoid pigments in seafoods and aquaculture. Crit. Reveiws Food Sci. 38 (1), 1–67. doi:10.1080/10408699891274165
Sher, R., Hoover, M. D., Newton, G. J., and Rahn, F. J. (1994). Aerosol behavior in nuclear facilities. Trans. Am. Nucl. Soc. 70 (CONF-940602).
Suckow, D., and Guentay, S. (2008). The dragon aerosol research facility to study aerosol behaviour for reactor safety applications.
Talbot, L., Cheng, R. K., Schefer, R. W., and Willis, D. R. (1980). Thermophoresis of particles in a heated boundary layer. J. Fluid Mech. 101, 737–758. doi:10.1017/S0022112080001905
Tang, P., Kita, K., Igarashi, Y., Satou, Y., Hatanaka, K., Adachi, K., et al. (2022). Atmospheric resuspension of insoluble radioactive cesium-bearing particles found in the difficult-to-return area in fukushima. Prog. Earth Planet. Sci. 9 (1), 17–15. doi:10.1186/s40645-022-00475-6
Venkatramani, N. (2002). Industrial plasma torches and applications. Curr. Sci. 83 (3), 254–262. Available online at: http://www.jstor.org/stable/24106883.
Williams, M. M. R., and Loyalka, S. K. (1991). Aerosol science: theory and practice with special applications to nuclear industry. New York: Pergamon Press.
Wright, A. L., Pattison, W. L., King, J. Y., and Dodson, R. (1984). Series-2 aerosol resuspension test data summary report. Oak Ridge, Tennessee: Oak Ridge National Laboratory.
Wright, A. L., Wilson, J. H., and Arwood, P. C. (1986). TN (USA) Oak Ridge National Lab. Pretest aerosol code comparisons for lwr aerosol containment tests la1 and la2.
Keywords: ASTEC, deposition, metal aerosol, plasma torch aerosol generator, resuspension
Citation: Kumar M, Joshi M, Dwivedi AK, Kumar S, Saud T, Khan A, Mishra G, Saha N, Ganju S, Tripathi SN and Sapra BK (2025) Study of the deposition and resuspension phase of aerosol particles in a straight test pipe. Front. Nucl. Eng. 4:1617991. doi: 10.3389/fnuen.2025.1617991
Received: 25 April 2025; Accepted: 31 July 2025;
Published: 05 September 2025.
Edited by:
Mihai A. Diaconeasa, North Carolina State University, United StatesReviewed by:
Yongjun Ye, University of South China, ChinaYahya A. Alzahrani, North Carolina State University, United States
Copyright © 2025 Kumar, Joshi, Dwivedi, Kumar, Saud, Khan, Mishra, Saha, Ganju, Tripathi and Sapra. This is an open-access article distributed under the terms of the Creative Commons Attribution License (CC BY). The use, distribution or reproduction in other forums is permitted, provided the original author(s) and the copyright owner(s) are credited and that the original publication in this journal is cited, in accordance with accepted academic practice. No use, distribution or reproduction is permitted which does not comply with these terms.
*Correspondence: Manish Kumar, bWFuaXNoMTAua3VtYXJAeWFob28uaW4=