 Matthew H. Carpenter1*
 Emily N. Stark1
 Daniel G. McNeel1
 Stefania Dede1Christopher J. Godt2Eli S. R. Kurtz1Daniel E. Jackson1
 Travis J. Tenner3Benjamin E. Naes3Kimberly N. Wurth3Gregory L. Wagner4
 Mark P. Croce1
- 1Los Alamos National Laboratory, NEN-1 (Safeguards Science and Technology), Los Alamos, NM, United States
- 2Los Alamos National Laboratory, C-AAC (Actinide Analytical Chemistry), Los Alamos, NM, United States
- 3Los Alamos National Laboratory, C-NR (Nuclear and Radiochemistry), Los Alamos, NM, United States
- 4Los Alamos National Laboratory, MPA-11 (Materials Synthesis and Integrated Devices), Los Alamos, NM, United States
Nuclear forensics relies on the integration of complementary signatures to constrain the origins and history of materials. Outcomes benefit from the timeliness and precision of the disparate methods that form typical analysis chains. Sample forms are often either minute in quantity or contain signatures like morphology or composition heterogeneity encoded on a microscale, so many analysis techniques focus on resolving signatures on ever-smaller length scales. The new hyperspectral x-ray imaging (HXI) instrument developed at Los Alamos National Laboratory seeks to improve the information available from scanning electron microscopy (SEM) x-ray spectrum analysis through superior spectral energy resolution vs. typical energy dispersive spectroscopy (EDS) systems in common use in nuclear forensics and other microanalysis fields. Based on arrays of transition-edge sensor (TES) microcalorimeter detectors, this instrument achieves a typical energy resolution of 7 eV full-width at half-maximum (FWHM) at 2 keV, opening new possibilities in trace element detection/analysis and chemical state determination through spectral shape shifts. We present here some of the first applications of the HXI instrument to actinide samples and discuss potential maturation of this nascent technology for future analysis pipelines.
1 Introduction
Microscale analysis is a cornerstone of nuclear forensics due to the evolution of the analytical techniques that enable spatially resolved chemical analysis that only require nanograms of material (Straub et al., 2021). The utility of a given technique or combination of methods depends on the compromise between sample preservation (whether the sample is consumed in measurement or may be used for further analysis afterward), measurement speed, spatial resolution, and type of information measured or derived.
Specifically in environmental swipe analysis for nuclear forensics, there are two main analytical approaches for detecting trace actinide materials: bulk analysis and particle analysis. Bulk analysis generally involves complete dissolution of the sample followed by chemical separation and mass spectrometry, typically using thermal ionization mass spectrometry (TIMS) or inductively coupled plasma mass spectrometry (ICP-MS) to determine long-lived radionuclides. In contrast, particle analysis isolates and examines individual particles from swipes (commonly using secondary ionization mass spectrometry (SIMS)), offering detailed insights into isotope ratios, morphology, and structure which can reveal specific nuclear activities (Mayer et al., 2013). Applied to real-world samples, SIMS analysis allows selective identification of actinide-bearing particles among large quantities of non-actinide material, provides reliable and detailed information about the morphology, as well as the elemental and isotopic compositions of these particles, thus supporting nuclear safeguards by detecting signatures indicative of material diversion (Kraiem et al., 2011).
Another important tool in the forensics analysis pipeline is scanning electron microscopy (SEM), a powerful imaging technique known for its exceptional spatial resolution (∼1 nm). In this application, SEM is mostly used for non-destructive imaging and morphological analysis of nuclear material prior to analysis with downstream methods. Pairing SEM with energy-dispersive x-ray spectroscopy (EDS) enables detailed elemental analysis at nano-to microscale levels that can identify particle size, shape, composition and processing history (Straub et al., 2021). This combination of morphological and elemental analysis enables multiple lines of study, for example, chemical characterization of products from UF6 hydrolysis (Wagner et al., 2015), assessing weathering or storage changes of materials under differing storage conditions (Tamasi et al., 2017), or characterizing uranium aerosols collected at different stages of a nuclear fuel fabrication plant (Hansson et al., 2017). Samples may be prepared for SEM analysis on substrates compatible with downstream process like SIMS, or the SEM may be instrumented with micromanipulators to pick individual particles for subsequent TIMS analysis (Straub et al., 2021). The high-vacuum environment and energy deposition from the electron beam may affect sample state such that this technique is destructive for fragile samples (Straub et al., 2021), but for many robust environmental samples the form is unaltered and SEM can be considered a non-destructive analysis. Whether SEM analysis is considered destructive or non-destructive therefore depends on the sample being measured and the goals of the analysis pipeline (i.e., whether the preparation for SEM analysis is compatible with downstream methods).
The reason why non-destructive chemical state measurements on individual particles are desirable is that they can be used as a signature of processing method or environmental exposure/weathering and can potentially improve accuracy of downstream methods like mass spectrometry that require matrix or elemental abundance corrections. A method developed to determine the chemical states and isotopic compositions of individual particles without dissolution or other chemical alteration is micro-Raman spectroscopy (MRS). This technique is often coupled with SIMS for particle isotopic analysis (Yomogida et al., 2017; Pointurier et al., 2024) to fill out the forensics pipeline. Initially, the use of SEM-EDS is required to identify actinide-bearing particles. Following identification, a micro-manipulation technique may be used to relocate particles for sequential MRS and SIMS analysis. By optimizing the laser power, MRS measurements can be performed non-destructively for some samples. MRS spatial resolution is limited to the order of 1 µm due to the wavelength of the excitation laser light, allowing single-particle sampling and probing of heterogeneity of larger samples on that length scale.
Finally, a common thread among all microscale analyses of individual particles is the ability to characterize many (1000s or more) particles to identify different populations. A single particle is usually not sufficient to draw relevant conclusions, instead groups of particles with well-defined characteristics are desired. The motivation for developing the hyperspectral x-ray imaging (HXI) detector system is to improve the quality and type of information that may be derived from particles earlier in the analysis pipeline in ways that are compatible with other standardized particle analysis methods. Such a system needs high enough efficiency to make particle population measurement feasible during the SEM analysis stage and deliver more useful information (whether chemical or elemental) than currently achievable at that stage with spatial resolution and/or mapping capabilities comparable to EDS and MRS analysis. HXI is built around a superconducting microcalorimeter x-ray detector coupled to a SEM that achieves an order of magnitude better energy resolution than standard EDS with full spectral bandwidth and similar efficiency. This higher resolving power and efficiency can lower the detection threshold for many elements, improve elemental ratio analytical precision, and allow probing of chemical state through analysis of subtle perturbations in the x-ray emission spectrum.
2 Instrumentation
2.1 Microcalorimeter detectors
Microcalorimeter detectors are a class of radiation detectors that measure the energy of individual photons through the thermal energy deposited in the detector following absorption. The theoretical performance achievable by these types of detectors is determined by several parameters including the heat capacity of the absorber, the thermal conductivity of the connection between the absorber and the thermal bath, and the type of sensor used to measure the temperature change in the absorber due to the heat energy (Irwin et al., 1996). Among the types of sensors used for microcalorimeters, superconducting transition edge sensors (TESs) have enjoyed the widest deployment and research effort to date due to their engineering flexibility and maturity of design.
To maximize the signal and instrument response (and therefore the energy resolution), these detectors are typically operated at very low temperatures to take advantage of the proportional relationship between specific heat and temperature (allowing larger absorbers of a given heat capacity) as well as reduce thermal noise. In the case of TES-based microcalorimeters, the operating temperature is chosen somewhere below the superconducting-to-normal transition of the TES, which may be 1.4 K for aluminum-based TESs, around 0.5 K for Al/Mn bilayers, or below 0.1 K for Mo/Cu or Mo/Au bilayer devices. These operating temperatures increase the complexity, size, and cost of systems based on these detectors but with the benefit of better than an order of magnitude energy resolution compared to semiconductor-based detectors with similar broadband operation. Adjusting the heat capacity and other device parameters allows tuning for a variety of applications, from gamma-rays (Hoover et al., 2011) to x-rays at synchrotrons (Doriese et al., 2017) or in electron microscopes (Irwin et al., 1996; Newbury et al., 2002). However, the physical size of the detector active area is bound by the absorber used and the heat capacity required to achieve desired performance metrics, so typical microcalorimeter detectors are physically small, thus requiring arrays of many detectors (or “pixels”) to achieve reasonable detector active area.
Major challenges to the broader deployment of microcalorimeters have been scaling the size of arrays of individual detector pixels with commensurate wiring heat load and readout complexity as well as scaling the processing and calibration of these large arrays of detectors with non-linear response. Recent advances in multiplexing techniques including microwave-based frequency-domain multiplexing (Gard et al., 2018) have been key to building and operating systems with more than 100 detectors (pixels) to approach traditional Ge- or Si-based semiconductor detector efficiencies.
2.2 HXI instrument
The HXI instrument is a custom-designed integration of a TES array microcalorimeter detector with a commercial SEM (Carpenter et al., 2021) designed with materials science and particularly actinide science as a primary goal. It is not the first TES-based microcalorimeter detector connected to a SEM, however it represents a generational increase in efficiency (due to the number of detector pixels and cryogenic duty cycle) and flexibility (due to the different types of pixels implemented) to pass the performance threshold needed for practical, routine applications.
The integration of the HXI instrument and the SEM is shown in Figure 1A. The TES operating temperature of 65 mK is maintained by a BlueFors SD cryogen-free dilution refrigerator which can maintain operating temperature pseudo-indefinitely (weeks to months), a major advantage over prior generations of SEM-TES systems which typically used magnetic cooling with finite operational temperature hold times on the order of 1–4 days. A separate vacuum system is maintained from the SEM and HXI by means of a vacuum “snout”, shown in Figure 1B (computer model rendering) and Figure 1C (interior view of the SEM with installed HXI) with a Luxel Lex-HT vacuum window which transmits x-rays efficiently down to around 0.2 keV. The snout assembly has additional magnetic and thermal shields nominally at 50 K and 3 K to protect the detector array package, with thin (100 nm) aluminum windows (or IR filters) to admit x-rays while blocking blackbody infrared radiation. This snout interfaces with the standard wavelength-dispersive spectrometer (WDS) port of the JEOL JSM-7200F SEM, allowing the microcalorimeter detector array to be inserted close to the SEM sample stage to maximize detector x-ray geometric efficiency. The TES sensor array consists of three different sizes of absorber, arranged in a pixelated array with each size optimized for a different energy range (Carpenter et al., 2021). The 128 intermediate-energy (medium) pixels were used for this work and are sensitive to x-ray energies up to 8 keV with energy resolution of 7 eV FWHM at 2 keV and pixel size of 240 μm × 480 μm (Carpenter et al., 2021). The HXI instrument operates as an energy-dispersive detector, collecting the full energy spectrum with individual photon counting but with WDS-equivalent resolution.
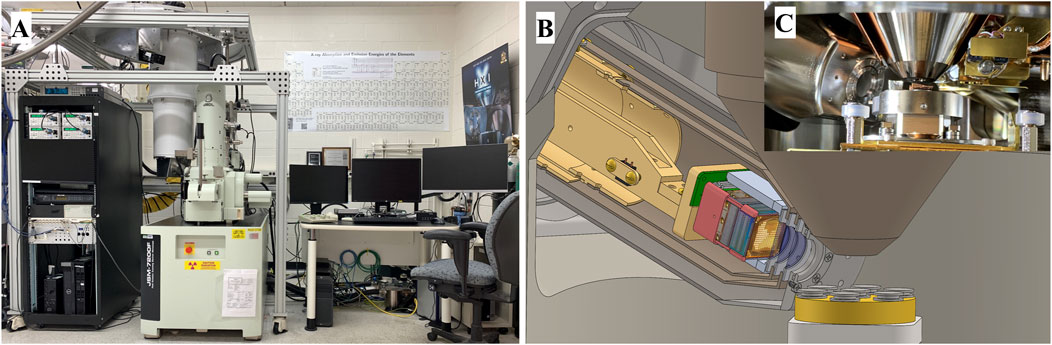
Figure 1. (A) Photograph of the commissioned HXI system built around a JEOL JSM-7200F SEM. The frame structure supports the dilution refrigerator cryostat (large white vertical cylinder to the left of the SEM column) separately from the SEM while allowing precise positioning of the cryostat to align the detector snout. (B) Cutaway rendering of the HXI detector cryostat fully inserted into the SEM chamber adjacent to the conical objective lens. A 7-pin-stub sample holder is depicted on the sample stage. (C) Photo of the commissioned HXI snout inserted into the sample chamber viewed through the load lock. A 7-pin-stub holder is in operating position below the objective lens.
The current data acquisition scheme requires post-processing of saved triggered pulse records through a custom software stack using optimal filtering, multiple drift-correction steps, and automated pixel co-adding/alignment prior to energy calibration (Yoho et al., 2020), however real-time pulse processing, spectral display, and mapping capabilities are under current development through active projects. Due to the complexity of managing the dozens of active pixels, processed data is stored in event mode (single photon records) to allow post-processing drift correction and energy re-calibration as needed. This increases the data volume but has potential benefits beyond instrument performance such as time-dependent spectral analysis. Mapping control of the SEM in coordination with HXI acquisition is in its second generation. The first generation controlled the SEM only through the manufacturer-provided application programming interface (API) with limited spatial resolution control and a large communication overhead which limited the effective mapping duty cycle to around 20% of the operating time. Still, this API-based control generated the first elemental maps presented in this paper. The current generation under active development uses a National Instruments data acquisition card acting as a scan generator to control the SEM directly and receive the electron detector signal, similar to typical commercial EDS systems, and achieving similar speed and efficiency. We anticipate full real-time processing and mapping integration comparable with standard commercial EDS functionality by the end of this year.
3 HXI applications
3.1 Spectral performance: elemental analysis
The energy resolution HXI achieves across broadband energy provides two distinct advantages over current SEM-based technologies: lower elemental detection thresholds and potential measurement of chemical state signatures. The material science community benefits from both of these improvements to characterize environmental samples to determine their origin and history. In this section we present examples of improved elemental discrimination and sensitivity enabled by HXI.
Figure 2 depicts example HXI x-ray emission spectra measured from collected natural environmental particles measured with a SEM accelerating voltage of 7 keV. The HXI spectra shown have a full-width at half-maximum (FWHM) of 7 eV at 2 keV (compared to 110 eV for the simultaneous EDS spectra in dotted orange). Figure 2A and B show particles from a sample collected from a benign, natural setting—a canyon on Los Alamos National Laboratory’s campus. EDS can clearly identify Y and Nb as the primary constituents of this sample using the Lα1 (L3M5 in IUPAC notation) lines, and through peak fitting it can also identify the Lβ1 (L2M4) lines that can act as confirmation of elemental presence but ultimately does not increase the information extracted from the EDS spectrum. Comparatively, HXI can direct observe emission lines from Er, Yb, W, Ta, Na, Mg, Zr, and more that are not otherwise visible with EDS, as well as other elements like Nd, Sm, Gd, and Dy that may be inferred but are blended with the other trace elements. In the 2.8–3.8 keV energy range shown in Figure 2B, HXI is able to directly observe small amounts of Th and U and distinguish between them in the presence of other common elements like K and Ca, where EDS is unable to resolve them completely. Note the presence of the aluminum K absorption edge and post-edge fine structure oscillations in the spectrum between 1.5 and 1.7 keV due to the multiple aluminum IR-blocking filters, more discernable in Figure 3 in the following section. This feature may increase uncertainty in elemental concentration analysis for elements in this region like Lu and W. Careful calibration with suitable reference concentration standards will be required for elements in this band.
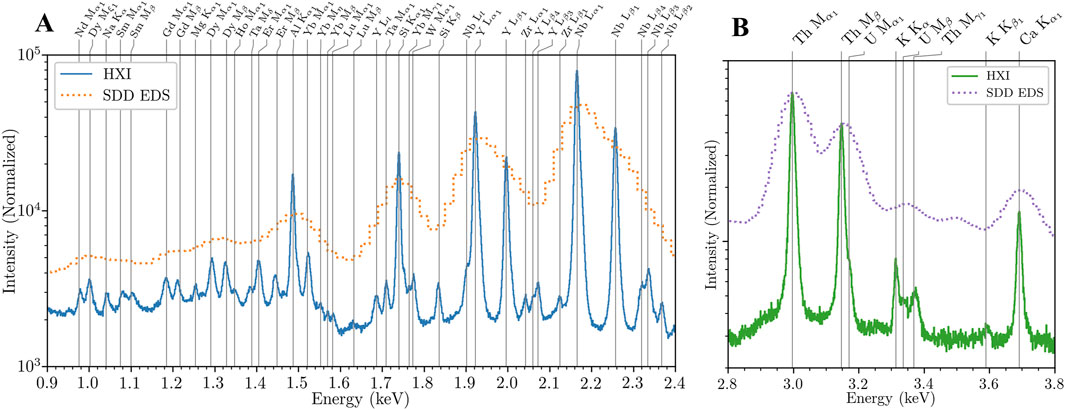
Figure 2. HXI spectral capabilities. (A) Spectrum of an environmental particle comparing HXI (blue) to EDS (dashed orange) spectra. With 7 eV FWHM resolution, HXI differentiates many trace rare earth elements that are not detectable with typical EDS. (B) Actinide M region of another collected naturogenic particle containing Th, K, Ca, and a small amount of U discernable with HXI that is otherwise not discernable with EDS.
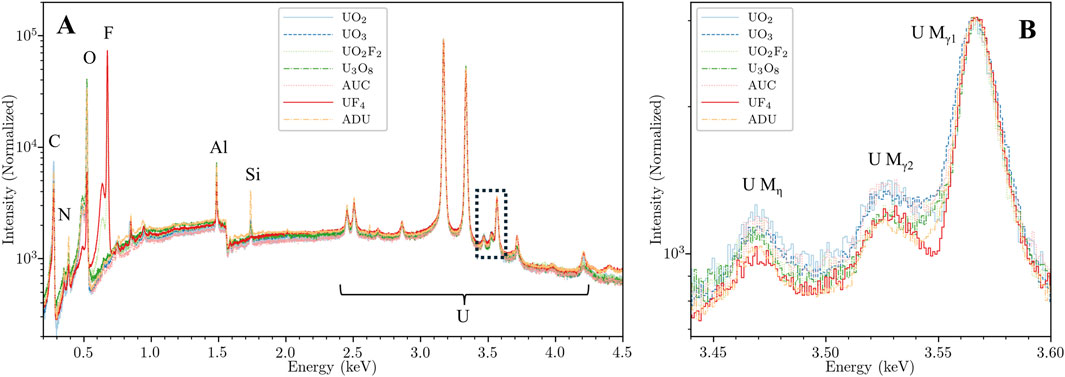
Figure 3. (A) Full bandwidth, normalized spectra of selected uranium reference compounds measured with HXI. Aside from the prominent fluorine peak at 0.677 keV they appear similar in elemental composition with low background or impurities. (B) Zoomed view of the narrow region around the U Mγ and Mη complex between 3.45 and 3.60 keV indicated by the black box in (A), with background subtraction and re-normalization to the U Mγ1 peak. Note the difference in spectral shapes and intensities around the U Mγ2 peak due to chemical perturbation of the many unresolvable satellite lines.
Understanding the full elemental compositions of such samples is key for identifying if they are naturogenic (naturally occurring) rare-earth-bearing particles versus anthropogenic particles (originating from artificial processes). Discriminating naturally-occurring actinide-bearing material from human-origin material (from, e.g., an unplanned release from a nuclear power plant) can provide assurance that a facility is operating within its envelope and proof of environmental stewardship. The lower elemental detection limit enabled by this high energy resolution will also allow greater discrimination between false positives and real signatures for downstream analysis, making more efficient use of more expensive or time-consuming techniques.
3.2 Chemical state analysis
Chemical state analysis is a more subtle measurement than elemental concentration. While elemental ratios may be computed from atomic data, relative peak areas, and a detector efficiency model (either empirical or theoretical), the spectrum is perturbed in more subtle ways by changes in atomic/molecular orbitals by bonding, oxidation, and chemical environment. These changes cannot reliably be predicted using current understanding of the physical phenomena and thus we investigate empirically rather than from theoretical modelling. Some emission lines are essentially unchanged across a wide swath of chemical states, while others show changes in the form of peak centroid shifts, peak height changes, or other distortions in unresolved “satellite” peaks in the vicinity of primary peaks. For initial study of the applications relevant to HXI, we measured a series of uranium compounds corresponding to different stages of the uranium fuel cycle (Pastoor et al., 2021). In waste remediation applications, the ability to differentiate chemical species may provide more specific measure of environmental affinities and propagation pathways of released compounds.
The uranium reference compounds were either synthesized for this work or acquired from legacy stock at Los Alamos National Laboratory. The compounds selected include UO2, UO3, UO2F2, UF4, U3O8, ammonium diuranate (ADU), and ammonium uranyl carbide (AUC). The legacy compounds are UF4 and UO2F2, while UO2, UO3, and U3O8 were synthesized following previously published methods (Tamasi et al., 2016). Ammonium diuranate and ammonium uranyl carbonate were synthesized by the addition of metered uranyl nitrate solution to ammonium hydroxide and of ammonium carbonate, respectively, while stirring at room temperature. The resulting ADU and AUC precipitates were centrifuged, rinsed and dried with methanol. Several mg of each dry powder were fixed onto carbon tape adhered to ½-inch Ted Pella Inc. aluminum SEM pin stubs in an inert atmosphere and transferred to the HXI laboratory in doubly-sealed tubes with argon atmosphere. The samples were exposed briefly to air during mounting to the SEM sample puck, but are otherwise stored under rough vacuum purged with pure nitrogen in between measurement cycles to maintain oxidation state and slow aging. Spectra were acquired at low SEM magnification to integrate over the bulk, with the SEM accelerating voltage at 7 kV, high beam current settings, and a wide-open aperture.
The broadband spectra from the seven compounds are shown in Figure 3A, all normalized to the U Mα peak at 3.171 keV. The spectra are overall uniform and appear similar at this zoom level save for the prominent F K peak at 0.677 keV in the two fluorine-containing samples. Many U M lines are visible between 2.5 and 4.3 keV as indicated in the figure, but again appear indistinct from one another at this zoom. However, when inspecting the region between 3.4 and 3.6 keV in Figure 3B, we can identify notable differences in spectral shape between the compounds. The Figure 3B region, referred to here as the “U Mγ region” due to the prominence of the U Mγ1 (M3N5) and U Mγ2 (M3N4) lines, has been renormalized to the U Mγ1 (M3N5) peak following subtraction of a linear background beneath the complex of lines and offsetting to a common threshold to allow visualization in log-y space. This normalization emphasizes the changing ratios of the three primary lines with canonical labels in this region, but it is also apparent that there are unresolved satellite transitions between the U Mγ1 (M3N5) and U Mγ2 (M3N4) peaks that contribute to the shifting shape in that region. The U Mγ2 (M3N4), and U Mγ1 (M3N5) peaks all have intrinsic linewidths around 12–15 eV (Zschornack, 2006) or around twice the resolution of HXI, so the shapes are not broadened considerably by instrument response. Compared to the Mα (M5N7) or Mβ (M4N6) peaks, these peaks arise from transitions from orbitals relatively closer to the valence level: 4d3/2 and 4d5/2 for the Mγ2 (M3N4) and Mγ1 (M3N5), respectively. We have confirmed these shifts are reproducible and not due to statistical variance, which allows us to leverage this signature for chemical state classification of an unknown uranium compound by comparing it to the existing library spectra.
3.3 Mapping capabilities
As outlined in Section 2.2, spatial mapping with HXI is currently in its second generation of development. Both generations currently log the SEM position as a function of time and apply spatial tagging to each photon detection event during post-processing. The first generation (SEM control through the API) was used to demonstrate mapping applications where the high resolution of HXI enables differentiation of species that would be difficult or impossible with typical EDS resolution. Figure 4A is an elemental map of a mixed oxide powder sample containing SiO2 and WO2 oxides. The spectrum around the Si K region in Figure 4C shows how the W Mα (M5N7) peak at 1.775 keV is resolvable from the Si Kα (KL3) peak at 1.74 keV, allowing complete separation of Si/W in the map where EDS would experience total blending between the two. While EDS could map the W separately at the W L lines, it will still give spurious correlation with Si due to the overlap around 1.75 keV. Figure 4B is another first-generation map of a mixed powder sample of four compounds: Na2CO3, NH4Cl, CaF2, and Fe2O3. HXI is able to spatially separate the CaF2, and Fe2O3 in the upper right corner where there would normally be overlap between the fluorine K line at 0.677 keV and the Fe L lines at 0.705 and 0.718 keV, as seen in the spectrum in Figure 4E. These two constructed examples are contrived but serve to demonstrate the higher spatial precision and separation enabled by this class of energy resolution.
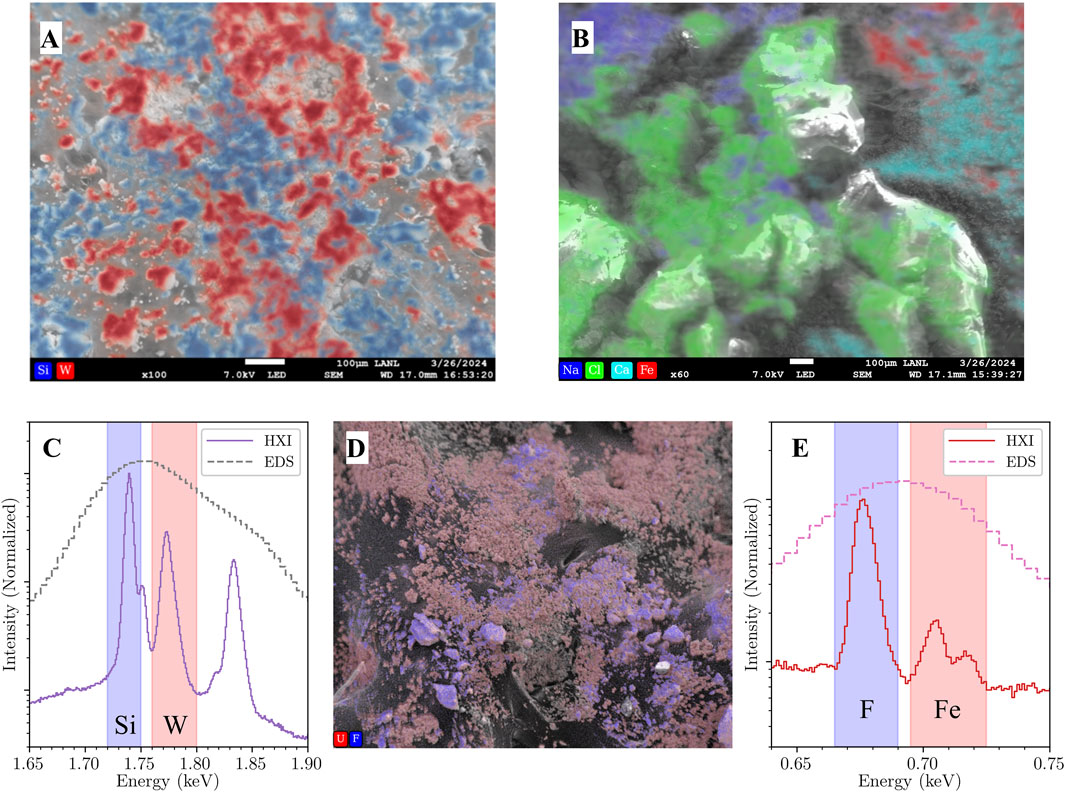
Figure 4. HXI mapping capabilities. (A) Smoothed elemental map of SiO2 (blue) and WO2 (red)mixed powder sample acquired with HXI demonstrating clear separation between the two compounds. This is not possible with standard EDS due to the adjacency of the Si K and W M peaks around 1.75 keV. (B) Elemental map of a mixed compound sample of Na2CO3, NH4Cl, CaF2, and Fe2O3. Fe (red) and Ca (light blue) are clearly differentiated in the upper right of the map, impossible with standard EDS due to the adjacency of the F K line (0.677 keV) and Fe L lines (0.705 and 0.718 keV). (C) Comparison of spectra from HXI (solid purple) vs. commercial EDS (dashed gray) from image (A). Regions of interest used to generate the Si and W HXI maps are shaded blue and red, respectively. (D) Elemental map of mixed UO2/UO2F2 sample acquired with full SEM scan generation at 1,280 × 1,024 point resolution. The SEM image underlying the U (red) and F (blue) maps is acquired simultaneously with the HXI mapping data to allow post-processing image drift correction if required. (E) Comparison of spectra from HXI (solid maroon) vs. commercial EDS (dashed magenta) from image (B). Regions of interest used to generate the F and Fe HXI maps are shaded blue and red, respectively.
The second generation mapping system using a custom-built scan generator is still in early development but has recently produced its first test maps. A map of mixed UO2/UO2F2 powder is shown in Figure 4D, with fluorine highlighted in blue against the red uranium. This map was acquired at a low magnification of 75x for testing and is the sum of 3 frames. Aside from scan generation flexibility and performance increases, this generation also measures and records the SEM electron signal (whether secondary or backscattered) simultaneous with the mapping control, yielding a SEM image with each map frame. Future development will use these image frames to track electron beam drift during measurement to allow for post-acquisition image drift correction, a common EDS mapping issue at high magnification on insulating or semi-conductive samples. As mapping with HXI is in its relative infancy, these results represent progress towards combining spatial control with chemical state analysis as the technique develops.
3.4 CMX-7 analysis
The HXI instrument team participated in the 7th Collaborative Materials Exercise (CMX-7) held by the Nuclear Forensics International Technical Working Group (ITWG) in Spring 2022. This exercise centered around 4 uranium samples, labeled ES-1 through ES-4, with a narrative history and were analyzed using multiple workflows at LANL over the course of 2 months. This exercise took place relatively early in the HXI instrument lifecycle, having been fully commissioned only 2 months prior. The goal of the HXI measurements was to assess the speed and ability of HXI to determine (or at least bound) the chemical state of sample particles in a form compatible with LG-SIMS analysis. As this was a demonstration of a new technology, the samples prepared for were not used subsequently for LG-SIMS to avoid disruption of the overall analysis pipeline.
Samples ES-1, ES-2, and ES-4 were prepared by suspending solid aliquots in methanol and depositing droplets onto a 1-inch Si wafer substrate. After drying, this yielded a small concentration of particles near the center of the wafer fixed by static/Van der Waals forces. The wafers were then mounted on 1-inch SEM pin stub holders from Ted Pella Inc. As sample ES-3 formed large flakes on the order of 100 µm in size, it was prepared by pressing flakes into an indium foil affixed to a 1-inch Pella pin stub followed by carbon coating to alleviate beam charging. These preparation methods are standard methods used in SIMS analysis and are used here to demonstrate compatibility of HXI with SIMS as a downstream analysis method. All samples were inspected and photographed under optical microscope prior to loading into the HXI SEM via load lock.
The HXI analysis of the samples proceeded in several steps. A commercial EDS detector (Oxford, UltiMax) was used to confirm the presence of uranium in particles of interest and identify candidate particles for HXI study (Figures 5A–D). The SEM is zoomed in to a particle-dense region (Figures 5E,G) or into a sub-region of a large candidate particle (Figures 5F,H) for HXI spectrum acquisition with the aperture set to 0 (fully stopped out) at an accelerating voltage of 7 kV. Acquisition time on each particle was approximately 1 h, or the time required to acquire 40 million total counts across the HXI array. For this study, time constraints prevented acquisition from multiple particles on each sample. After spectra had been collected for each of the four samples, HXI measured the spectra from several reference compounds created for the project under the same conditions and with similar count totals. Figure 5I depicts the full x-ray spectrum from each ES sample normalized to the U Mα peak at 3.171 keV. A spectrum of ES-1 measured with the Oxford EDS detector is also shown for comparison. All spectra display high uranium purity with C, N, and O peaks visible from 0.3–0.5 keV and a prominent Si K peak at 1.74 keV from the Si substrate of 3 of the samples. Sample ES-2 has a small Na K peak at 1.04 keV, while sample ES-3 has very weak indium L peaks around 3.29 and 3.49 keV, respectively from the indium foil mounting of that sample. Figure 5J shows detail of the U Mγ (M3N4,5) region with all four spectra re-normalized to this region by subtracting a linear background below the complex of lines and normalizing to the U Mγ1 (M3N5) peak while preserving the background threshold for display clarity in log-Y space. The In Lβ1 (L2N4) peak in ES-3 is weakly visible. Samples ES-2 and ES-4 are nominally identical, while ES-1 and ES-3 each have slightly different shapes in the critical 3.52–3.55 keV region near the U Mγ2 (M3N4) peak.
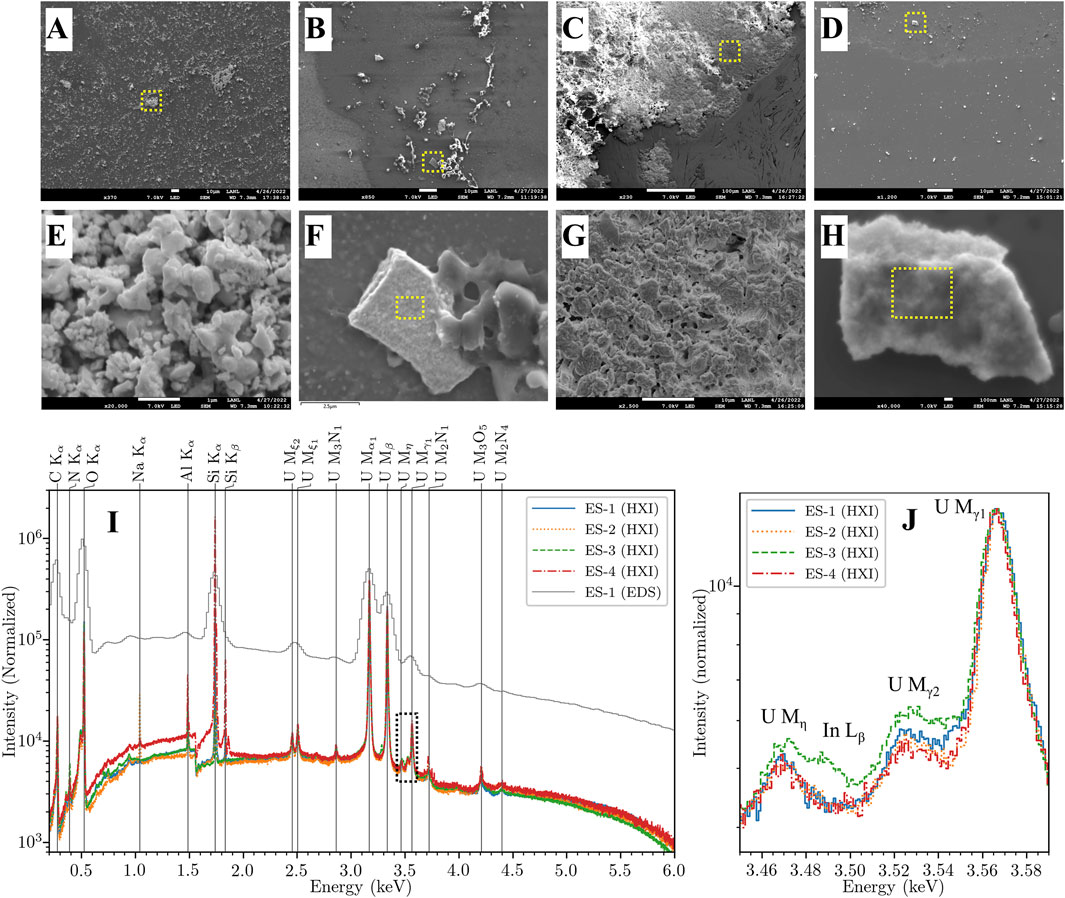
Figure 5. (A-D) SEM images of CMX-7 samples ES-1 through ES-4 at low zoom. Dotted regions indicate approximate zoomed regions shown in next row. (E) Spectral acquisition region of sample ES-1. (F) Zoomed view showing particle analyzed for ES-2. The approximate acquisition region is indicated with a dotted box. (G) Spectral acquisition region of sample ES-3. (H) Zoomed view showing particle analyzed for ES-4. The approximate acquisition region is indicated with a dotted box. (I) CMX-7 sample spectra normalized to the U Mα (M5N7) peak, with EDS spectrum of ES-1 for comparison. The dotted region highlights the U Mγ (M3N4,5) region used for chemical analysis. (J) Re-normalized HXI spectra of CMX-7 zoomed in around the U Mγ (M3N4,5) complex between 3.44 and 3.64 keV. The region around the U Mγ2 (M3N4) peak from 3.52–3.55 keV is the most affected by chemical state. ES-2 and ES-4 appear nominally identical, while ES-3 has a small In Lβ1 (L2N4) peak from its indium foil substrate.
Chemical assignment of each sample is accomplished through comparison with the reference compound spectra discussed in Section 3.1. We are limited by the current selection of reference compounds, however the nearest matches can potentially give insight into the sample’s oxidation state, coordination, or ligand species through comparison. Figures 6A–D show the renormalized U Mγ region spectra for the four samples overlaid on the reference compound spectra with the closest visual reference spectrum match plotted in bold for comparison. From this initial visual inspection, we pair ES-1 with U3O8, ES-3 with UO3, and ES-2 and ES-4 with ADU.
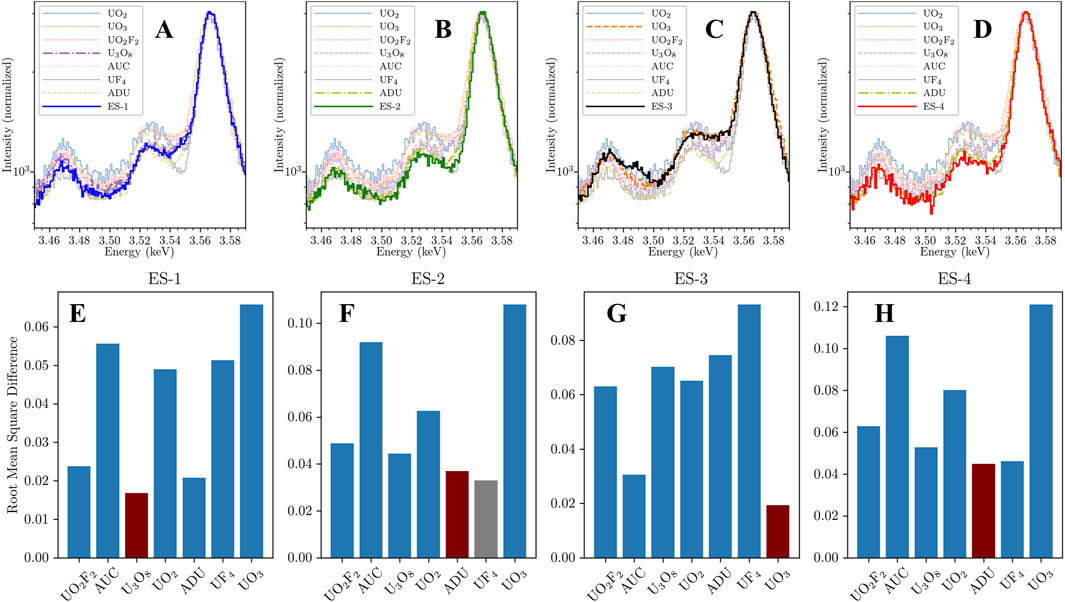
Figure 6. (A–D) Visual comparison of CMX-7 samples ES-1 through ES-4 to reference compounds from Figure 3. ES-1 (A) is most similar to U3O8, ES-3 (C) to UO3, and ES-2 (B) and ES-4 (D) are very similar to each other and most align with ammonium diuranate (ADU). (E–H) Computed similarity between ES-1 through ES-4 to reference compounds (lower is better match). The rms difference agrees with the visual assignments in (A) through (D) except for ES-2 in (F), where UF4 scores slightly higher than ADU. However, the absence of a fluorine peak in Figure 5I excludes UF4 from consideration and it is assigned to ADU.
Several analytical approaches are under development to create the highest confidence and accuracy in chemical state classification, particularly for considering developing chemical state mapping capability where classifications may be made with much lower counting statistics. Some of these approaches include methods that are robust to background subtraction and normalization (for example, correlation-based methods) and others include methods from unsupervised machine learning (for example, vector similarity metrics). The optimal method will likely be a combination of both classes of approaches, as the background in this area is significant due to nearby, high-yield uranium peaks. Since the CMX-7 samples were measured for traditional spectrometry purposes rather than hyperspectral imaging, we can leverage the higher statistics and use a simple difference function. We calculate the root-mean-square-difference between the unknown sample and each of the library spectra after background subtraction and normalization in the 3.52–3.55 keV region. A low difference metric indicates a close match between the unknown particle and a reference sample.
The classification results are seen in Figures 6E–H, where the ultimate classification is shown in dark red. This rudimentary method identified ES-1 as U3O8, however ADU has a similar, albeit higher, difference score. ES-2 was originally designated as UF4 but ultimately classified as ADU due to the lack of a fluorine peak at 0.677 keV in the broadband spectrum (Figure 3A). ES-3 was classified as UO3 with high confidence, and ES-4 was classified as ADU. ES-4 also could have been classified as UF4 except for the lack of F, similar to ES-2. These computational classifications align with visual matching and offer a robust, objective way to classify an unknown uranium particle.
Comparing these results with prior publications shows we lack the correct reference compounds but are able to draw relevant conclusions. The ITWG published in their December 2022 newsletter (Curry et al., 2022) that the compounds are “a depleted uranium vanadium alloy, a depleted uranium metal, uranyl nitrate created from the uranium metal and a uranium oxide created from the uranyl nitrate” corresponding to ES-2, ES-4, ES-3, and ES-1, respectively. The vanadium content of the purported uranium-vanadium alloy is very low, reported below 1 ppm and would not be detectable by EDS or HXI. A study with x-ray diffraction (XRD) and MRS of all four samples (Lorincik et al., 2024) found mixed oxides (UO3 and UO22+ hydrate) for ES-1, UO2 for ES-2, uranyl nitrate hydrate for ES-3, and UO2 for ES-4. For the metal samples, it is apparent that the particle surfaces have oxidized considerably prior to measurement for both HXI and Lorincik et al., both from the assignments and the pillowy morphology apparent in Figures 5F,H. The specific oxidation state assigned will be affected by weathering and handling conditions prior to analysis. The U2O72- ion, with its mixed U oxidation states between U(IV) and (V) is a reasonable proxy for the native oxide present on the metal chips’ surfaces. The spectral similarity between ES-2 and ES-4 also points to similar environmental aging between both samples prior to HXI analysis. For ES-1, the mixed oxide/uranyl hydride would produce a blended spectrum between those two species that may be similar the U3O8 reference with its mixed U(V)/(VI) oxidation states.
Elemental information can be used during chemical state classification in highly controlled ways, as demonstrated here. We used elemental abundance to confirm a chemical classification, rather than using elemental ratios to determine chemical state. Put another way, the presence of uranium and fluorine in the same particle does not imply uranium fluoride, as the fluorine could be environmental. However, a compound cannot be a uranium fluoride if there is no fluorine collocated with the uranium. Uranium fluoride implies uranium and fluorine, but uranium and fluorine does not imply uranium fluoride. This highlights the necessity for high energy resolution across the broad energy range to correctly identify uranium chemical speciation, which cannot be done with WDS or EDS.
Additional methods that are currently under development for chemical state classification using limited data include cosine similarity and a correlation approach. Cosine similarity analysis treats the normalized spectra as vectors, and computes the cosine of the angle between the unknown and each reference spectrum. From preliminary Monte Carlo simulations this method requires fewer counting statistics than the simple difference metric used above, however it is more reliant on accurate background subtraction and normalization. Alternatively, a correlation method between the unknown and each reference spectrum is more robust to normalization but loses some of the peak height signatures. Both methods, as well as more Bayesian model mixing to account for the presence of more than one speciation, are being investigated.
4 Conclusion
The measurements presented here are the earliest of their respective types (uranium chemical state and HXI mapping capabilities) and as such represent early-phase data with this instrument. Further development is needed both in the compound reference library as well as the analysis methods and algorithms for speed, accuracy, and uncertainty quantification. With that caveat, this work does represent an important step toward the maturation and viability of this technology for nuclear forensics. The < 10 eV energy resolution greatly improves the separation of actinides in mixed-actinide samples over standard EDS and should allow more precise determination of actinide elemental ratios in the single-digit weight% range and possibly below.
Naturally, the advantages of this improved performance over standard EDS are not confined to actinide speciation or nuclear forensics applications—any field of study utilizing SEM EDS may benefit. Higher energy resolution translates to lower trace element detection thresholds for metallurgy, semiconductor materials science, geology, and more. The separate vacuum system of HXI is compatible with low-vacuum (or environmental) operating modes available in most modern SEM systems, opening the door to liquid-phase studies for biology or chemical catalysis. Chemical state measurement via x-ray emission spectroscopy is less sensitive or selective than, e.g., x-ray absorption spectroscopy performed at a synchrotron, however the widespread deployment of SEM instruments makes this a potentially more accessible technique for routine analysis in an industrial or academic setting.
Chemical state mapping requires a much higher statistical threshold to generate map assignments compared to elemental mapping due to the more subtle spectral features that distinguish chemical compounds from one another and is under current development at this time. Initial mapping work with direct SEM API control lacked the performance necessary to feasibly collect enough counts in a given region to allow chemical assignment, however improvements to the duty cycle through scan generation have recently passed the required threshold required to make chemical maps feasible. The potential application space for this technology will likely benefit from a more tailored approach of automated particle identification and spectral acquisition vs. blind mapping of a full image field. From initial Monte-Carlo studies, we calculate the threshold time needed to distinguish uranium compounds from one another using the U Mγ (M3N4,5) region to be around 15 s, with longer count times leading to higher precision. This is the current goal of the HXI development program, with full image chemical mapping being a step along the path towards that end. The initial results presented here lay the foundation for further forensics applications and development towards a mature system ready for integration with standard nuclear forensics analysis pipelines.
Data availability statement
The raw data supporting the conclusions of this article will be made available by the authors, without undue reservation.
Author contributions
MHC: Conceptualization, Data curation, Funding acquisition, Investigation, Methodology, Project administration, Software, Supervision, Visualization, Writing – original draft. ES: Data curation, Formal Analysis, Investigation, Methodology, Resources, Visualization, Writing – review and editing. DM: Conceptualization, Data curation, Funding acquisition, Investigation, Methodology, Software, Visualization, Writing – original draft. SD: Data curation, Investigation, Writing – original draft. CG: Software, Visualization, Writing – review and editing. EK: Software, Visualization, Writing – review and editing. DJ: Software, Visualization, Writing – review and editing. TT: Investigation, Resources, Writing – review and editing. BN: Investigation, Resources, Writing – review and editing. KW: Investigation, Project administration, Writing – review and editing. GW: Investigation, Resources, Writing – review and editing. MPC: Conceptualization, Funding acquisition, Investigation, Methodology, Project administration, Supervision, Writing – original draft, Writing – review and editing.
Funding
The author(s) declare that financial support was received for the research and/or publication of this article. Research presented in this article was supported by the Laboratory Directed Research and Development Program of Los Alamos National Laboratory under project numbers 20190002DR and 20240550MFR.
Acknowledgments
Participation in the CMX-7 exercise was supported by the US Department of Energy National Nuclear Security Administration Office of Technical Nuclear Forensics. LA-UR-25-24238.
Conflict of interest
The authors declare that the research was conducted in the absence of any commercial or financial relationships that could be construed as a potential conflict of interest.
Generative AI statement
The author(s) declare that no Generative AI was used in the creation of this manuscript.
Publisher’s note
All claims expressed in this article are solely those of the authors and do not necessarily represent those of their affiliated organizations, or those of the publisher, the editors and the reviewers. Any product that may be evaluated in this article, or claim that may be made by its manufacturer, is not guaranteed or endorsed by the publisher.
Supplementary material
The Supplementary Material for this article can be found online at: https://www.frontiersin.org/articles/10.3389/fnuen.2025.1621780/full#supplementary-material
References
Carpenter, M. H., Stein, B., Koehler, K. E., Fontes, C. J., Smith, C. M., Wagner, G. L., et al. (2021). Hyperspectral X-Ray imaging: progress towards chemical analysis in the SEM. IEEE Trans. Appl. Supercond. 31 (5), 1–6. doi:10.1109/TASC.2021.3075087
Curry, M., Wallenius, M., Mayer, K., and Schwantes, J. (2022). “ITWG nuclear forensics update no. 25 (december 2022),” in International technical working group on nuclear forensics. Available online at: https://www.nf-itwg.org/newsletters/ITWG_Update_no_25.pdf.
Doriese, W. B., Abbamonte, P., Alpert, B. K., Bennett, D. A., Denison, E. V., Fang, Y., et al. (2017). A practical superconducting-microcalorimeter X-Ray spectrometer for beamline and laboratory science. Rev. Sci. Instrum. 88 (5), 053108. doi:10.1063/1.4983316
Gard, J. D., Becker, D. T., Bennett, D. A., Fowler, J. W., Hilton, G. C., Mates, J. A. B., et al. (2018). A scalable readout for microwave SQUID multiplexing of transition-edge sensors. J. Low Temp. Phys. 193 (3–4), 485–497. doi:10.1007/s10909-018-2012-2
Hansson, E., Pettersson, H. B. L., Fortin, C., and Eriksson, M. (2017). Uranium aerosols at a nuclear fuel fabrication plant: characterization using scanning electron microscopy and energy dispersive X-Ray spectroscopy. Spectrochim. Acta Part B At. Spectrosc. 131 (May), 130–137. doi:10.1016/j.sab.2017.03.002
Hoover, A. S., Hoteling, N., Rabin, M. W., Ullom, J. N., Bennett, D. A., Karpius, P. J., et al. (2011). Large microcalorimeter arrays for high-resolution X- and gamma-rayspectroscopy. Nucl. Instrum. Methods Phys. Res. Sect. A Accel. Spectrom. Detect. Assoc. Equip. 652 (1), 302–305. doi:10.1016/j.nima.2010.09.154
Irwin, K. D., Hilton, G. C., Wollman, D. A., and Martinis, J. M. (1996). X-Ray detection using a superconducting transition-edge sensor microcalorimeter with electrothermal feedback. Appl. Phys. Lett. 69 (13), 1945–1947. doi:10.1063/1.117630
Kraiem, M., Richter, S., Kühn, H., Stefaniak, E. A., Kerckhove, G., Truyens, J., et al. (2011). Investigation of uranium isotopic signatures in real-life particles from a nuclear facility by thermal ionization mass spectrometry. Anal. Chem. 83 (8), 3011–3016. doi:10.1021/ac103153k
Lorincik, J., Sihelska, K., Vesela, D., Elantyev, I., Rezankova, K., Aparicio, C., et al. (2024). Participation of Czech laboratories in isotopic, structural, and elemental characterization of uranium nuclear forensic samples within the 7th collaborative material exercise. J. Radioanalytical Nucl. Chem. 333 (7), 3675–3684. doi:10.1007/s10967-023-09336-y
Mayer, K., Wallenius, M., and Varga, Z. (2013). Nuclear forensic science: correlating measurable material parameters to the history of nuclear material. Chem. Rev. 113 (2), 884–900. doi:10.1021/cr300273f
Newbury, D., Wollman, D., Nam, S. W., Hilton, G., Irwin, K., Small, J., et al. (2002). Energy dispersive X-Ray spectrometry by microcalorimetry for the SEM. Mikrochim. Acta 138 (138/3-4,139/1-4), 265–274. doi:10.1007/s006040200030
Pastoor, K. J., Scott Kemp, R., Jensen, M. P., and Shafer, J. C. (2021). Progress in uranium chemistry: driving advances in front-end nuclear fuel cycle forensics. Inorg. Chem. 60 (12), 8347–8367. doi:10.1021/acs.inorgchem.0c03390
Pointurier, F., Berthy, F., and Marie, O. (2024). Correlative morphological, elemental and chemical phase analyses at the micrometric scale of powdered materials: application to nuclear forensics. Vib. Spectrosc. 134 (September), 103729. doi:10.1016/j.vibspec.2024.103729
Straub, M. D., Arnold, J., Fessenden, J., and Kiplinger, J. L. (2021). Recent advances in nuclear forensic chemistry. Anal. Chem. 93 (1), 3–22. doi:10.1021/acs.analchem.0c03571
Tamasi, A. L., Cash, L. J., Tyler Mullen, W., Ross, A. R., Ruggiero, C. E., Scott, B. L., et al. (2016). Comparison of morphologies of a uranyl peroxide precursor and calcination products. J. Radioanalytical Nucl. Chem. 309 (2), 827–832. doi:10.1007/s10967-016-4692-x
Tamasi, A. L., Cash, L. J., Tyler Mullen, W., Pugmire, A. L., Ross, A. R., Ruggiero, C. E., et al. (2017). Morphology of U3O8 materials following storage under controlled conditions of temperature and relative humidity. J. Radioanalytical Nucl. Chem. 311 (1), 35–42. doi:10.1007/s10967-016-4923-1
Wagner, G. L., Kinkead, S. A., Paffett, M. T., Rector, K. D., Scott, B. L., Tamasi, A. L., et al. (2015). Morphologic and chemical characterization of products from hydrolysis of UF6. J. Fluor. Chem. 178 (October), 107–114. doi:10.1016/j.jfluchem.2015.07.004
Yoho, M. D., Koehler, K. E., Garner, S. E., Vo, D. T., and Croce, M. P. (2020). Automated Co-Adding and energy calibration of large array microcalorimeter data with zero sample knowledge. Nucl. Instrum. Methods Phys. Res. Sect. A Accel. Spectrom. Detect. Assoc. Equip. 969 (April), 164056. doi:10.1016/j.nima.2020.164056
Yomogida, T., Esaka, F., and Magara, M. (2017). Chemical state and isotope ratio analysis of individual uranium particles by a combination of micro-raman spectroscopy and secondary ion mass spectrometry. Anal. Methods 9 (44), 6261–6266. doi:10.1039/C7AY01815K
Keywords: SEM, EDS, x-ray emission spectroscopy, nuclear fuel cycle, microcalorimeter spectrometer
Citation: Carpenter MH, Stark EN, McNeel DG, Dede S, Godt CJ, Kurtz ESR, Jackson DE, Tenner TJ, Naes BE, Wurth KN, Wagner GL and Croce MP (2025) Hyperspectral x-ray imaging mapping capabilities for nuclear forensics. Front. Nucl. Eng. 4:1621780. doi: 10.3389/fnuen.2025.1621780
Received: 01 May 2025; Accepted: 28 July 2025;
Published: 03 September 2025.
Edited by:
Kattathu Mathew, Oak Ridge National Laboratory (DOE), United StatesReviewed by:
René Bes, University of Helsinki, FinlandNathalie Wall, University of Florida, United States
Copyright © 2025 Carpenter, Stark, McNeel, Dede, Godt, Kurtz, Jackson, Tenner, Naes, Wurth, Wagner and Croce. This is an open-access article distributed under the terms of the Creative Commons Attribution License (CC BY). The use, distribution or reproduction in other forums is permitted, provided the original author(s) and the copyright owner(s) are credited and that the original publication in this journal is cited, in accordance with accepted academic practice. No use, distribution or reproduction is permitted which does not comply with these terms.
*Correspondence: Matthew H. Carpenter, bWNhcnBlbnRlckBsYW5sLmdvdg==