 Katherine A. Schreiber1*
 Katrina E. Koehler1,2
 Mark P. Croce1
 Emily N. Stark1Daniel G. McNeel1
 Matthew H. Carpenter1
 David J. Mercer1E. Paige Abel3Brian Archambault4Leah Arrigo4
 Grey Batie4Daniel T. Becker5Douglas A. Bennett6Brian M. Bucher3
 Stefania Dede1Joseph Fowler6Johnathon D. Gard5
 David Glasgow7K. C. Goetz7Craig Gray7Catalin Harabagiu4Jianwei Hu7
 Mark W. Keller6J. A. Ben Mates6Christine Mathew1,8Galen C. O’Neil6Nathan J. Ortiz6Luca Pagani4Bruce D. Pierson4Daniel R. Schmidt6Rico U. Schoenemann1Edward Seabury3Daniel S. Swetz6Joel N. Ullom5,6Sophie L. Weidenbenner1Ammon N. Williams3
- 1Los Alamos National Laboratory, Los Alamos, NM, United States
- 2Houghton University, Houghton, NY, United States
- 3Idaho National Laboratory, Idaho Falls, ID, United States
- 4Pacific Northwest National Laboratory, Richland, WA, United States
- 5University of Colorado Boulder, Boulder, CO, United States
- 6National Institute of Standards and Technology, Boulder, CO, United States
- 7Oak Ridge National Laboratory, Oak Ridge, TN, United States
- 8Texas A&M University, College Station, TX, United States
Ultra-high energy resolution microcalorimeter gamma-ray spectroscopy—with energy resolution 5 to 10 times better than observed in spectra obtained by commercial-off-the-shelf high purity germanium detectors—is an enabling technology for ultra-precise isotope identification and quantification. Microcalorimeter gamma spectroscopy complements measurements requiring high-accuracy mass spectrometry, a costly, destructive analysis technique, and may offer benefits over mass spectrometry in the future. Microcalorimeter detectors are fabricated from superconducting materials and operate at ultra-low temperatures (<0.1 K), properties which permit measurement of spectra with peak full width half maximum (FWHM) of less than 100 eV at 100 keV. The microcalorimeter collaboration between Los Alamos National Laboratory, National Institute of Standards and Technology, and University of Colorado, Boulder has deployed three microcalorimeter gamma-ray spectrometers to nuclear facilities and analytical laboratories so far. These are the Spectrometer Optimized for Facility Integrated Applications (SOFIA), a portable system that can be moved to any facility, and two instruments called the High Efficiency and Resolution Microcalorimeter Spectrometers (HERMES) intended for permanent installation at Idaho National Laboratory and Pacific Northwest National Laboratory. Each spectrometer was customized to satisfy requirements for their specific applications. This work describes samples examined by microcalorimeter gamma-ray spectrometers, including recently irradiated materials, nuclear material from various stages of the fuel cycle, and medical isotope products. It also highlights useful signatures from actinide and fission product gamma-rays that are otherwise infeasible to observe or use for analysis without costly chemical separations and mass spectrometric assay. Microcalorimeter technology provides additional spectral signatures to existing techniques to better constrain the origin and intended use of nuclear and radioactive materials.
1 Introduction
Advances in energy resolution in gamma-ray spectrometer technology over time have resulted in increasingly accurate, detailed, and precise nondestructive analysis of nuclear and radioactive material. Sodium iodide (NaI) spectrometers are known for portability and ease of use, but for many applications requiring high accuracy, high purity germanium (HPGe) spectrometers are required. HPGe detectors provide resolution as low as 550 eV full width half maximum (FWHM) spectral peaks near 100 keV (Mirion Technologies., 2023). Gamma spectroscopy is indeed a useful technique for nondestructive assay (Mayer et al., 2013; Keegan et al., 2016). Even so, the accuracy and precision of nuclide analysis by gamma spectrometry is still limited, and destructive analysis is typically necessary to attain the precision required of material characterization (Mayer et al., 2013; IAEA, 2015; IAEA, 2022). Mass spectrometers, for example, are workhorses of nuclear analytical laboratories. Chemical separation is necessary to prepare the samples for some vital techniques by mass spectrometry, such as multicollector inductively coupled plasma mass spectrometry (ICP-MS). This can add hours or days to the amount of time required to complete quantification of nuclides within a sample.
To more rapidly answer questions about the origin of the sample under analysis with the requisite accuracy, more precise nondestructive techniques are desirable to complement or better inform destructive measurements. Ultra-high energy resolution gamma-ray spectrometry, enabled by microcalorimeters, provides an avenue for such measurements. Microcalorimeter gamma-ray spectrometry, or simply gamma-ray microcal or μcal, uses highly sensitive detector arrays to attain peak FWHM as low as 53 eV for peaks near 100 keV—nearly an order of magnitude better energy resolution than available via state-of-the-art non-destructive gamma-ray analysis techniques including traditional HPGe gamma spectrometry, Compton suppression, and gamma-gamma coincident spectroscopy (Ullom and Bennett, 2015). Such resolution enables identification of nuclides which are obscured as unresolvable gamma-ray peak interferences or by the Compton continuum produced by high-intensity sources present in the sample. It also facilitates lower uncertainties in counting gamma-rays of a given energy than in an HPGe spectrum of comparable counting statistics. Well-resolved peaks may be counted by merely summing the counts within a region of interest (ROI), but for overlapping peaks, the lower FWHM corresponds to lower uncertainty in performing Gaussian fits (Hoover et al., 2009; Hoover et al., 2013; Hoover et al., 2014). Lower uncertainty in calculating peak areas can translate to lower uncertainties in isotopic calculations. In fact, the uncertainty in such calculations is often limited by uncertainties in literature nuclear data, and not the microcal peak areas (Yoho et al., 2020a; Becker et al., 2023). The improved resolution also offers better precision from reduced variation in fitting or background continuum subtraction. Attaining satisfactory uncertainty and repeatability in nuclide activities as rapidly as possible is necessary to expedite facility operations and nuclear material investigations. This work provides an overview of microcal gamma-ray spectra obtained from a diverse array of samples. It is intended as a review of applications for which microcal may have an analytical benefit by demonstrating spectral features which are more well-resolved than in lower resolution gamma-ray detectors. These spectra invite opportunities for detailed studies and analysis of the most valuable spectral signatures. By enabling higher accuracy and precision, nondestructive analysis of nuclear material, gamma-ray microcal may prove to be a useful tool for many material characterization applications.
2 Instrumentation
2.1 Gamma-ray microcalorimeters
Microcalorimeters attain ultra-high energy resolution by operating in an extremely low temperature, low noise environment. Transition edge sensors (TESs) are among the most technologically mature microcalorimeters and have enabled ultra-high energy resolution gamma spectroscopy (Irwin et al., 1996; Bennett et al., 2012; Ullom and Bennett, 2015). The TES microcalorimeter is designed to detect small temperature changes caused by absorption of a single gamma-ray photon in an absorber coupled to the TES. A schematic is shown in Figure 1a. The temperature increase changes the resistance of the TES, allowing the absorbed gamma ray to be measured as a change in current, producing an electrical pulse. The pulses can then be measured and binned into high resolution spectra.
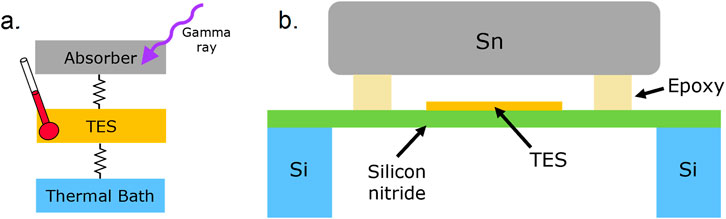
Figure 1. (a) Schematic thermal circuit for a TES and separate absorber connected to a thermal bath. Heat from absorption of the incident gamma ray flows to the TES, which serves as a sensitive thermometer, before eventually flowing to the bath. (b) Schematic cross section (not to scale) showing the Si wafer and silicon nitride membrane supporting the TES and Sn absorber mounted on epoxy posts.
A TES is a microfabricated device made of superconducting materials, with a superconducting critical temperature between 100 mK and 150 mK. This temperature can be tuned by adjusting the composition of Mo/Cu or Mo/Au bilayers used to form the TES. In the gamma microcals described here, the TES is placed on a silicon nitride membrane, as shown in Figure 1b., allowing the thermal conductance to the bath to be adjusted, thereby tuning the time constant for recovery after absorption of a photon. When in operation, the TES is voltage-biased so its resistance lies within the narrow superconducting transition region. The current change from an absorbed photon is then measured by a superconducting quantum interference device (SQUID) (Mates et al., 2017; Gard et al., 2018) that acts as a highly sensitive current amplifier, enabling low-noise readout of the pulse due to the incident photon. Because of the sensitivity of the superconducting transition to magnetic fields, cryogenic magnetic shielding must be placed around the TESs and SQUIDs.
Because a TES pulse is limited by thermal time constants, which are relatively slow compared to electrical time constants, the practical count rate for a TES microcalorimeter gamma-ray spectrometer is comparatively low. For a single TES pixel, exceeding 20 counts per second per pixel tends to degrade the ultra-high energy resolution. A typical measurement may have count rates from 5–10 counts per second per pixel, giving overall detector count rates of a few thousand counts per second for an array of several hundred pixels. Although current TES designs produce pulses tens of milliseconds long, upgrades to pixel design are expected to increase pulse speed by a factor of five or more.
In order to maintain high resolution and have good detection efficiency, a TES absorber must have a small heat capacity, yet have reasonable stopping power for the gamma rays of interest. High energy resolution requires minimizing both temperature and heat capacity (Ullom and Bennett, 2015). Currently, typical gamma-ray absorbers are made of tin, which has low heat capacity at operating temperature and fair stopping power for gamma rays. A single gamma-ray TES absorber is 1.3 mm by 1.3 mm in area, and 0.5 mm thick. Such an absorber has fair (>10%) efficiency from approximately 20 keV–300 keV, with maximum efficiency around 100 keV (54%). The Sn absorber is located above the TES and is attached to the membrane by thermally conductive posts.
Because of the small area of a single TES and the slow temporal rate of thermal conduction, arrays of hundreds of TESs have been developed to increase overall efficiency (Hoover et al., 2011; Winkler et al., 2015; Mates et al., 2017). The readout of such a large array can be accomplished by microwave multiplexing. This technique avoids the necessity for hundreds of cables connecting to the TES arrays by instead sending hundreds of microwave tones to the array on a single line. Each TES microcalorimeter is coupled to an individual microwave resonator on a common microwave feedline, in such a way that changing current through a TES changes the frequency of the corresponding resonator. These changing resonance frequencies can be read out simultaneously, allowing signals from hundreds TES detectors to be multiplexed onto a single pair of coaxial cables (Mates et al., 2017).
Pulses are recorded on an individual pixel basis each time a trigger threshold is exceeded, and these records are subjected to several pulse processing techniques before being used to generate a spectrum for each pixel (Fowler et al., 2016; Becker et al., 2019; Yoho et al., 2020b). First, pulses whose shape do not meet the requisite criteria are cut (e.g., electronic noise spikes and piled-up pulses). The pulse height is then extracted by applying an optimal filter to each pulse. After this, a drift correction algorithm is applied to the filtered pulse heights for each pixel. Then the spectra from each individual pixel are co-added using peak matching techniques. The final spectrum is energy calibrated using known reference peaks. Because all full pulse records are saved and processed into event-mode data, binning into energy is done during analysis after processing. Typically, spectra are binned into 32,768 channels, with 0.01 keV/channel. This is the case for all microcal spectra in this paper. These analysis techniques for filtering, drift correcting, and co-adding are under research and development for optimal performance.
2.2 Spectrometer Optimized for Facility Integrated Applications (SOFIA)
SOFIA is the first deployed microcalorimeter gamma spectrometer (Croce et al., 2022). SOFIA consists of an array of 256 TES pixels housed within a compact cryostat designed for easy transportation (Figure 2). The cryostat housing the TES array is an adiabatic demagnetization refrigerator (ADR) (Pobell, 2007). It, like each of the TES-based gamma spectrometers described in this paper, is a liquid-cryogen-free system. They are cooled to approximately 4 K by helium pulse tube refrigeration. This involves a compressor connected to the cryostat by pressurized helium lines several meters long. The ability to cool to the TES operating temperature, which is below 100 mK, is provided by the adiabatic magnetization and demagnetization of a paramagnetic salt (Pobell, 2007). The TES array remains at the operating temperature for 1–2 days before the array stage warms up towards 4 K. The system must then be regenerated by running the magnetization and demagnetization cycle again, a process which takes approximately 2 hours. The regeneration process interrupts measurements being taken, which is a disadvantage of ADRs.
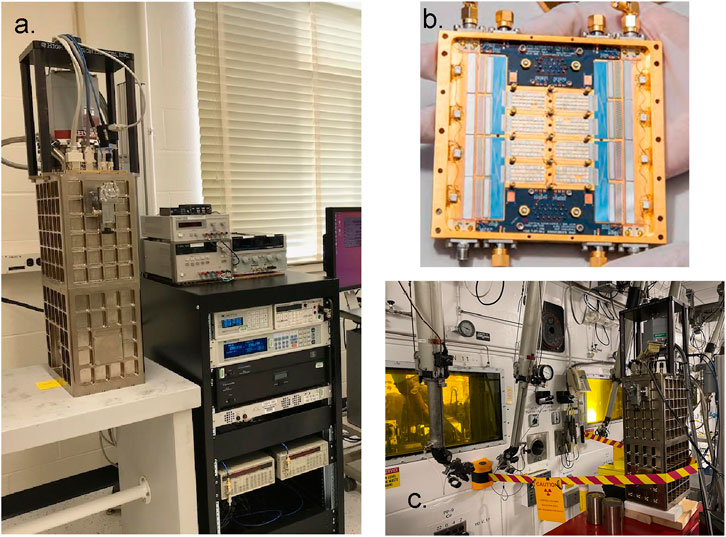
Figure 2. (a) SOFIA with associated electronics rack. (b) 256-pixel microcalorimeter detector array. Eight chips of TES pixels are seen in the center of the array box. (c) SOFIA at the ORNL IFEL hot cells measuring irradiated nuclear fuel through a collimated port in the cell.
ADRs can be constructed with a relatively small form factor. In the case of SOFIA, the cryostat, pulse tube compressor, and electronics rack can be transported in the back of a pickup truck. The compressor requires 220 V of single-phase power, commonly attainable in many scientific and industrial facilities. Additionally, while many compressors require chilled water for cooling, SOFIA’s compressor is air-cooled, further simplifying facility requirements. SOFIA’s portability has enabled measurement campaigns at multiple locations, including the High Flux Isotope Reactor (HFIR) and Irradiated Fuel Examination Laboratory (IFEL) at Oak Ridge National Laboratory.
2.3 High Efficiency and Resolution Microcalorimeter Spectrometer, 400 pixels (HERMES-400)
The High Efficiency and Resolution Microcalorimeter Spectrometer (HERMES)-style instrument marks several differences from SOFIA, giving it greater detection efficiency and longer uninterrupted measurement time (Schreiber et al., 2023). The HERMES-400 spectrometer has approximately 400 TES pixels. The microcalorimeter array reflects an updated form factor from the array within the SOFIA instrument. There are four modules, called microsnouts, each with 96 pixels on the end and readout chips mounted on the sides (Figure 3a). This modular design allows multiple microsnouts to be tiled together to form an array with a large detector active area. The four microsnouts are facing downward on a spring-loaded mount (Figure 3b). This aids in reducing vibrational coupling to the TES pixels, which is detrimental to performance.
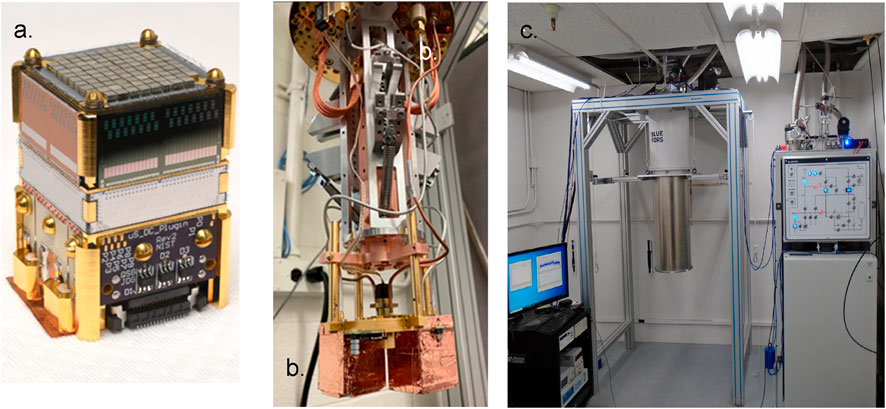
Figure 3. (a) Microsnout array with a 20 mm square array of 96 TES pixels on the top, readout chips along the sides, and electrical connections near the bottom. (b) Microsnout mount, with two copper wrapped microsnouts seen at the bottom of the mount. (c) HERMES-400 dilution refrigerator at INL MFC ARL. Photo is shown in Schreiber et al., 2023.
The cryostat used for HERMES-400 (Figure 3c) is a dilution refrigerator from BlueFors (Pobell 2007). As with the ADR, the system cools to < 4K via a helium pulse-tube cryocooler. A mixture of He-3 and He-4 is then condensed within the system and circulated until it cools below 100 mK. The advantage of the dilution refrigerator over the ADR is that it may continuously remain at operating temperature as long as the liquid helium mixture is circulating. Measurements do not need to be paused in order to regenerate the cooling process, as in the case of magnetizing and demagnetizing an ADR paramagnetic salt. The dilution refrigerator has a much larger spatial and facility requirement footprint, however. It is not easily portable, requiring a large frame approximately 2 m tall, and separate gas handling unit with pumps for the He-3/He-4. Chilled water for cooling the pulse tube compressor and 480 V three-phase power are required. Liquid nitrogen for trapping air and moisture impurities, which would freeze and block the liquid He-3 and He-4 circulation, is also needed. Therefore, unlike the portable SOFIA, HERMES instruments are intended for permanent installation in an analytical facility. HERMES-400 is installed at the Idaho National Laboratory Material and Fuel Complex Analytical Research Laboratory (MFC ARL).
HERMES-400 will play a role in analysis of nuclear fuels and reactor materials researched at INL. In particular, many advanced fuels like tristructural isotropic (TRISO) fuel (Demkowicz et al., 2019) and, in the near future, molten salts, come through the lab for pre- and post-irradiation analysis. The ARL also analyzes a wide variety of fuel and other nuclear material routinely, for example, mixed oxide (MOX) fuels, different uranium metal alloy fuels, and high-assay low-enriched uranium (HALEU). Many of these applications will be discussed in Section 3.
2.4 High Efficiency and Resolution Microcalorimeter Spectrometer, 700 pixels (HERMES-700)
The HERMES-700 instrument leveraged much of the design experience obtained from development of the HERMES-400 instrument and included additional improvements in design to increase efficiency and reduce vibration induced noise (Schreiber et al. 2024). HERMES-700 (Figure 4) is intended to have seven microsnouts for a total of approximately 700 pixels. It is also installed for long-term use in an analytical facility, the Radiochemical Processing Laboratory at Pacific Northwest National Laboratory. Like HERMES-400, the cryogenic infrastructure is a dilution refrigerator from BlueFors. To reduce issues with vibration observed in HERMES-400, a 200 kg aluminum mass was installed on top of the frame for vibrational damping. Additionally, rather than a spring-loaded mount with downward facing microsnouts, the microsnouts face sideways in HERMES-700. The mount is clamped around rods which are wrapped in Kevlar cord. The Kevlar provides damping while the mount reduces the degrees of freedom of motion compared to the spring mount, providing a more mechanically and vibrationally stable system. Further, the side-facing geometry of the microsnouts enables a wider range of measurement configurations compared to the downward facing microsnouts. Dilute solutions can be placed directly against the cryostat face, while very active samples can be moved away to an appropriate distance.
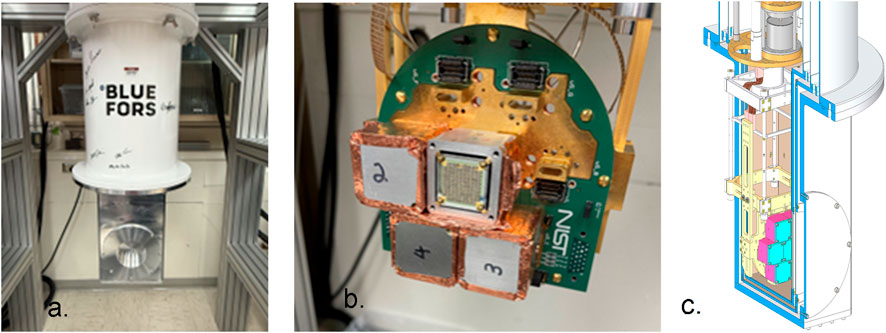
Figure 4. (a) HERMES-700 at PNNL. (b) Photo of 4 of the 7 microsnouts installed in the HERMES-700 system (c) CAD rendering of assembled 7-snout system in a cutaway model of the cryostat.
At the time of writing, HERMES-700 employs four microsnouts for a total of 384 pixels. When complete, HERMES-700 will house seven total microsnouts arranged in a honeycomb format. This arrangement of microsnouts is an especially suitable measurement geometry for 4-inch diameter filter paper sources (Burnett and Miley, 2021). Figure 4 illustrates the CAD modeled structure of the microcalorimeter, internal assembly, and completed system.
3 Applications of gamma-ray microcalorimetry
3.1 Rapid identification of short-lived isotopes
The enhanced resolution of the microcalorimeter gamma-ray detector allows for identification of radionuclides with a precision that is difficult to achieve with lower-resolution detectors. This presents a powerful capability for investigations requiring rapid turnaround measurements. Microcalorimeter gamma-ray spectroscopy enables observation of key isotope signatures without requiring chemical separation and destructive analysis, particularly relevant for short-lived radionuclides that decay away before chemical separation and subsequent measurements can be performed.
Microcalorimeter gamma-ray measurements have illustrated capabilities for rapid radionuclide characterization in the case of recently irradiated materials. Microcalorimeter gamma-ray spectra have been obtained for irradiated materials at short time scales after irradiation performed at two reactor facilities: the Training, Research, Isotopes, General Atomics (TRIGA) reactor at Washington State University (WSU), (Schreiber et al. 2024) and the High Flux Isotope Reactor (HFIR) at Oak Ridge National Laboratory.
3.1.1 Irradiation at Washington State University TRIGA reactor
At the WSU TRIGA reactor, a 2.2 mg piece of 93.15% enriched uranium foil was irradiated for 2 h at 500 kW to produce 5.37 × 10¹³ fissions as determined through gamma analysis of peak fission products. Following irradiation, the sample was transported to PNNL for dissolution with 10 mL of 3M HNO3 and subsequently screened to determine the total sample activity. From this stock solution, an aliquot equivalent to 1 × 10¹² fissions was prepared and dried down by evaporation onto a 2.2225 cm diameter filter paper and laminated in Kapton tape. The filter paper was shipped to LANL and measured by SOFIA and HPGe detectors beginning 4 days after the irradiation. Figure 5 presents the measured spectrum derived from microcalorimetry (black) and a low-energy germanium detector (brown).
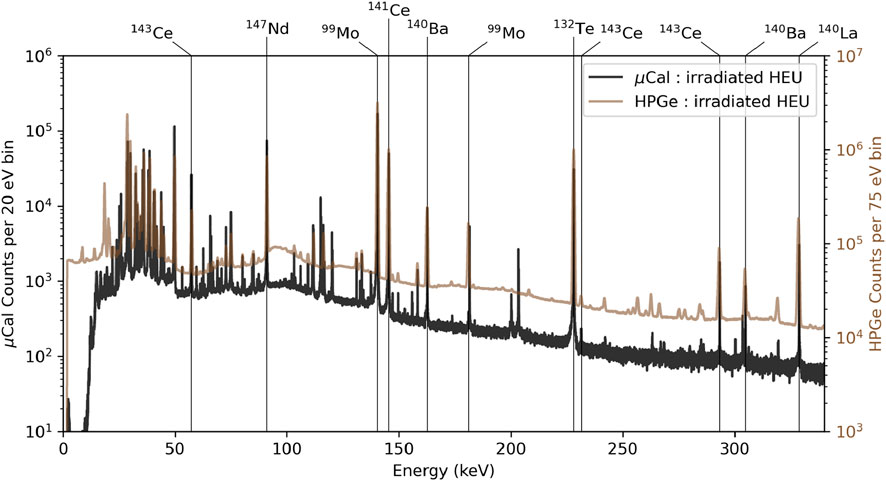
Figure 5. Gamma-ray spectra (SOFIA microcal in black; HPGe in brown) of fission products collected after irradiation in WSU’s TRIGA reactor.
Key interferences of short-lived isotopes were resolved using the microcalorimeter that would otherwise be infeasible using germanium. Figure 6 illustrates the peak separation of Ba-140 and Ce-144, which have half-lives of 12.751(4) days and 284.91(5) days, and gamma rays at 132.687(1) keV and 133.515(2) keV, respectively. Figure 7 illustrates clear separation of the Sm-153 gamma-line, a crucial, refractory wing fission product with elevated sensitivity to the energy of the incident, fission inducing neutron. Figures 6, 7 are expanded views of the spectrum in Figure 5. Quantification of fission product activity by gamma-ray microcal was not calculated from this measurement. Measurement of the sample alongside a well-characterized isotopic standard, or measurement in an efficiency calibrated geometry, would be necessary to extract these values. Efficiency calculations for quantification are an ongoing research focus for our collaboration, and further discussion is provided in Section 3.4.

Figure 6. The 130 keV–135 keV region of the spectrum in Figure 5 shows clear separation of the Ba-140/Ce-144 signature in the SOFIA microcal spectrum (black) compared to the planar HPGe spectrum (brown). The escape peak at 134.2 keV is a microcal detector artifact from a Sn Kβ1 X-ray escaping from the Ba-140 162.66 keV peak.
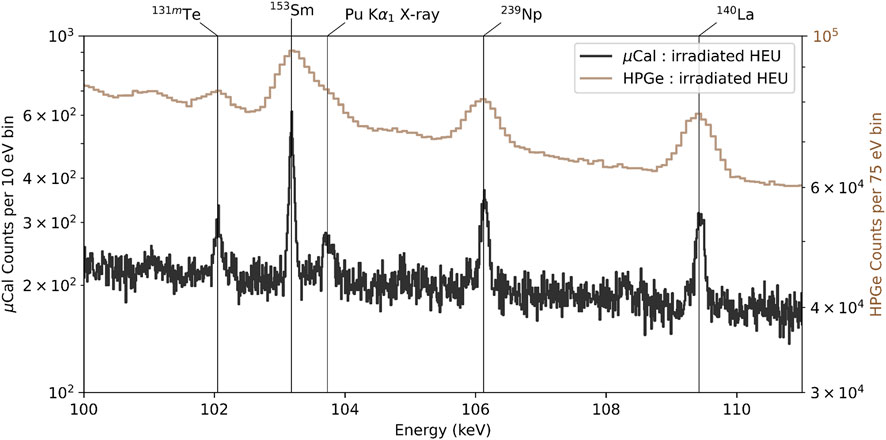
Figure 7. The 100 keV–111 keV region of the spectrum from Figure 5 shows clear separation in the SOFIA microcal spectrum of the Te-131 m, Sm-153, and Pu X-rays from the Np-239 decay.
3.1.2 Irradiation at Oak Ridge National Laboratory HFIR
At HFIR, SOFIA was placed in the Neutron Activation Analysis laboratory adjacent to the reactor, and samples were immediately measured after irradiation via transport by pneumatic tube. The spectra obtained represent the microcalorimeter measurements taken with the shortest amount of time after irradiation to date. Targets of natural uranium (NU), plutonium standards, and mixtures of the two were irradiated during the 511 cycle (February 2025) and immediately measured with the SOFIA microcalorimeter. The NU and Pu targets were irradiated for 90 s when the reactor flux was approximately 4.3 × 10¹³ n/cm2·s in the pneumatic transfer tube that passes just outside of the permanent beryllium reflector. Irradiation times for the uranium and plutonium mixtures were reduced to 60 s to compensate for a 22% increase in the neutron flux that routinely occurs later in HFIR cycles. All samples were measured starting approximately 30–45 s post-irradiation. SOFIA observed between 4,000 and 8,000 counts per second on the full TES array at the beginning of the measurement, with the counts dying to less than 100 counts per second after about 45 min.
The irradiations at HFIR enabled observation of temporally dynamic low energy gamma signatures from short-lived fission products. Figure 8 shows the half-life estimates for each energy bin between 0 and 100 keV using an NU target. Each bin was evaluated, rather than each peak, because it is difficult to define regions of interest (ROIs) for individual unresolved peaks with short half-lives. The spectrum shown vertically in Figure 8 was created from the first 5 minutes of the measurement. Dark, opaque dots represent high-confidence half-life estimates, ranging from 275 s to 26 min. Further analysis is underway for radionuclide identification, nuclear data studies, and U/Pu quantification.
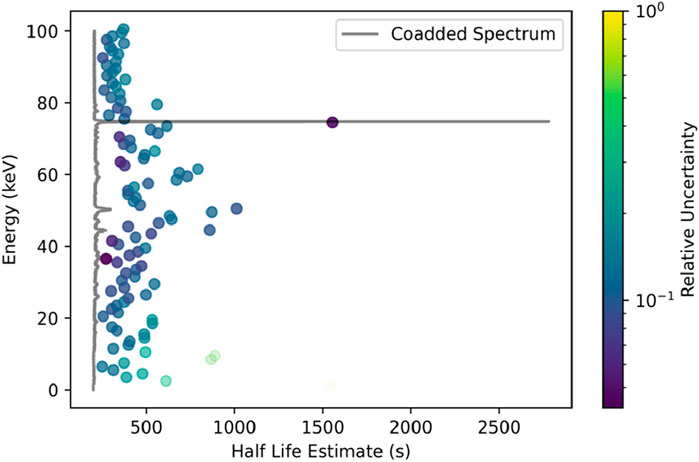
Figure 8. Scatter plot of calculated half-lives of isotopes observed at given energies from uranium samples irradiated at HFIR, measured by the SOFIA microcal instrument.
3.1.3 Medical isotope: Actinium-225
Another interesting application for short-lived isotope characterization is within the field of medical isotopes. In particular, Ac-225, with half-life of 9.92 days, has become a promising targeted-alpha therapy treatment for cancer (Thiele and Wilson, 2018). Ac-225 is scarce, historically produced through extraction from a Th-229 “cow” in only a handful of laboratories. The Th-229 alpha decays to Ra-225 with a 7340-year half life, which then beta decays to Ac-225 (14.9-day half life). Accelerator-based methods are in use to vastly increase production (John, 2019). However, Ac-227 is an impurity which inevitably arises in accelerator production, with a half-life of 21.8 years. The presence of Ac-227 is problematic because it can accumulate in the liver, causing long-term damage to healthy cells. Characterizing the Ac-227 in Ac-225 for targeted alpha therapy is therefore important. An opportunity for gamma-ray microcal is to discern the extremely weak Ac-227 signatures. Figure 9 compares microcal gamma-ray spectra from an actinium sample obtained through accelerator-based methods and an actinium sample separated from a Th-229 cow. A gamma-ray peak from Th-227, a daughter of Ac-227, is highlighted in a spectrum from a sample obtained through accelerator production of actinium for targeted alpha therapy, which is distinctly not seen in the traditional Th-229 cow technique. None of these features are discernible in the HPGe spectrum. Using microcalorimeter decay energy spectroscopy, the signatures of Ac-227 were quantified (Tollefson et al., 2021), and the current results suggest gamma-ray microcal measurements are likewise a useful technique for medical actinium characterization.

Figure 9. Spectra of actinium samples produced by an accelerator and a Th-229 cow. The Th-227 peak at 50.13 keV can be clearly seen in the accelerator-produced actinium sample (black) as a result of creating the Ac-227 contaminant. This signature cannot be resolved in the HPGe spectrum (brown). The signal-to-noise ratio (SNR) of the shaded region is used to predict how many counts in this peak are needed for various quantification precision levels. Black and blue traces are microcal spectra obtained by SOFIA.
One of the main advantages of having such high energy resolution with microcal measurements is that small peaks can be seen due to the high signal to noise ratio. We can approximate the relative statistical uncertainty of the peak as follows:
3.2 Uranium and plutonium isotopic composition
3.2.1 Uranium enrichment
Yet another application of gamma-ray microcal is for highly precise enrichment measurements. As high-assay low-enriched uranium (HALEU) fuel becomes more central in the development of advanced nuclear reactors, precision in enrichment measurements becomes more crucial (IAEA, 2020). HALEU may have enrichments up to 20%, while 20% enrichment and above is considered highly enriched uranium (HEU). For HALEU enriched over 19%, therefore, uncertainty must be low enough to determine with confidence that the material does not in fact fall into the highly enriched category. Gamma-ray techniques are frequently used already for nondestructive enrichment calculations. Precision may be enhanced by gamma-ray microcal, because it resolves more peaks which can be used in the enrichment calculation. The region from 89 keV to 94 keV is particularly rich with closely spaced peaks (Figure 10), which are well-resolved by microcal. These spectra are from uranium standards NBS031 (0.31% U-235) and NBL0005-20 (20% U-235). For NBS031, the microcal measurement was 130,000 s, and the HPGe measurement 3,265 s live time. For NBL0005-20, the microcal measurement was 120,000 s and the HPGe was 1,075 s live time. The high energy resolution also distinguishes the shape of x-ray peaks from that of gamma-ray peaks: x-rays have a Lorentzian line shape, while gamma-rays have a Gaussian profile. For gamma-ray microcal enrichment calculations, a fixed-response analysis method (Sampson et al., 1989; Vo, 2021) is under development (Becker et al., 2023). The technique computes the relative efficiency curve to extract a calculation of enrichment. For this, multiple peaks are needed for fitting across an extended energy range. The greater number of well-resolved uranium and thorium peaks will provide more points for the relative efficiency curve calculation. Further, reduced statistical uncertainty in the narrower peak areas of microcal spectra compared to HPGe are expected to contribute to reduced uncertainty in the isotopic percentage calculation. This is discussed in greater detail below for the case of Pu isotopics.
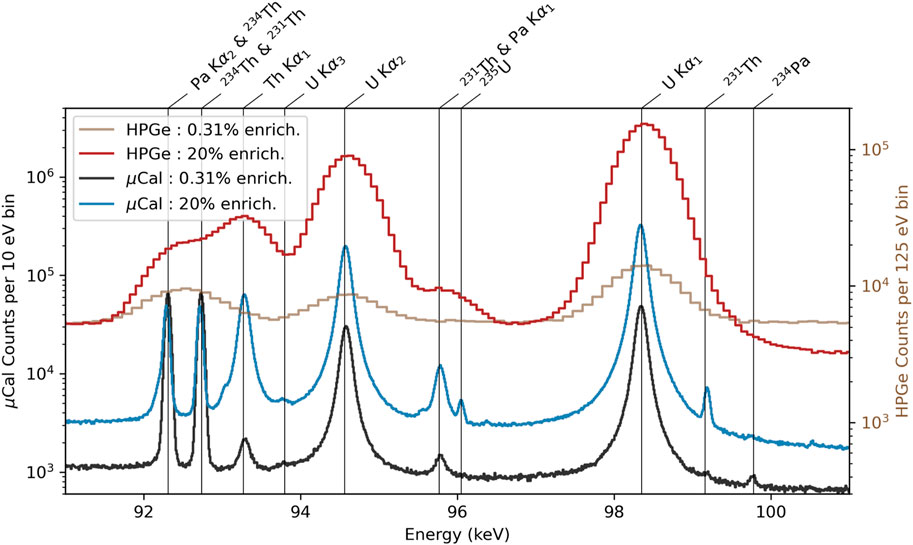
Figure 10. Uranium, thorium, and protactinium peaks displayed for two enrichments in SOFIA microcal spectra (black and blue) compared to HPGe spectra (dark brown and light brown). This energy region is rich with peaks that may be used for enhanced enrichment calculations.
The HPGe spectra shown here and throughout the paper are, in general, not necessarily taken at the same time or with the same measurement geometry as the microcal spectra, unless otherwise specified. All spectra are only intended to illustrate examples in which a microcal spectrum may prove particularly useful over an HPGe spectrum due to the higher number of peaks resolved.
3.2.2 U-238 direct gamma rays
For samples older than about 6 months old, uranium isotopic composition calculation by gamma-ray spectrometry relies on daughter products of U-238, particularly Pa-234 m. For samples where the uranium is freshly separated from daughter products, the sample is not yet in secular equilibrium, and gamma rays emitted directly by U-238 are needed. There are only two direct gamma rays from U-238 at 49.55 keV and 113.5 keV. These peaks are difficult to resolve with lower-resolution detectors due to their low branching fractions (0.064 photons per 100 decays and 0.0102 decays per 100 decays, respectively) and interference from nearby peaks. However, they are visible using gamma-ray microcal, as seen in Figure 11, which shows the 113-keV region of the same microcal and HPGe spectra of NBS031 as in Figure 10. Microcal is expected to enable more precise enrichment measurements for freshly separated uranium. In this spectrum, the number of gamma-rays in the 113.5 keV peak at the 1% and 10% level with approximately 20,000 and 1,400 counts, respectively, over the light blue region in Figure 11. In this 130,000-s spectrum measuring depleted uranium, this peak area was quantified with approximately 7% statistical uncertainty.
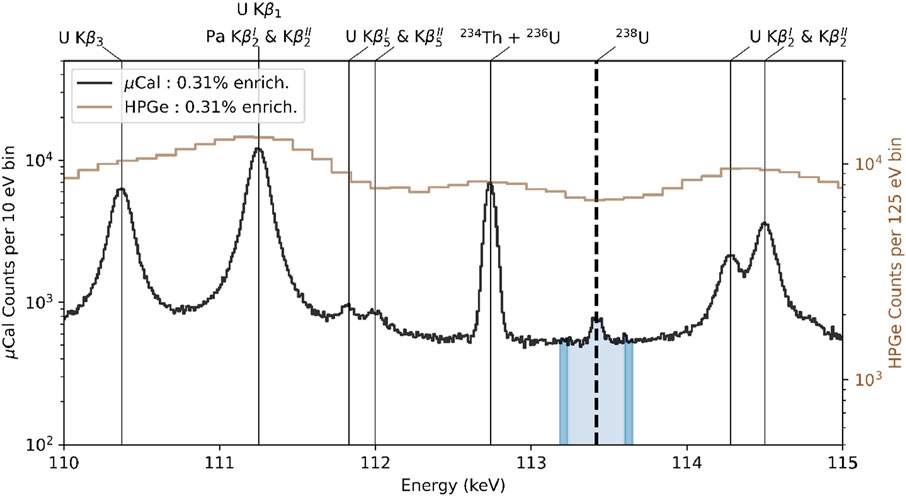
Figure 11. Depleted uranium spectrum for SOFIA and HPGe from uranium standard NBS031, showing the U-238 gamma ray distinguished at 113.5 keV among other spectral features. The background below the peak (light shaded region, 5 FWHM) is approximated using the dark shaded region to predict how many counts in this peak are needed for various quantification precision levels. (In IUPAC notation: Kβ3 = K-M2, Kβ1 = K-M3, KβI2 = K-N3, KβII2 = K-N2, KβI5 = K-M5, KβII5 = K-M4).
3.2.3 Plutonium isotopics
The high resolution of gamma-ray microcal enables highly resolved plutonium spectra. This is valuable to calculations of plutonium isotopic ratios with increased precision. Figure 12 displays highly resolved plutonium peaks for several different burnups in the plutonium standard CBNM series compared to a HPGe spectrum. These peaks are used in the fixed response analysis method calculations for calculation of the percentage of each Pu isotope within the sample (Sampson et al., 1989; Vo 2021; Becker et al., 2023). High resolution of peaks enables lower statistical uncertainty in peak area calculations. Peaks may be well separated enough to allow a region of interest (ROI) calculation to count the number of photons measured within a peak, which results in a lower uncertainty than peak fitting. For peaks which still require fitting to a Gaussian or Lorentzian profile due to neighboring peak interferences, statistical uncertainty still tends to be reduced due to the narrower peak shape of a microcal peak compared to HPGe.

Figure 12. Spectra of plutonium standards from the CBNM series of varying burnups, measured by SOFIA (black, blue, and teal) and by HPGe (brown). The labeled peaks are those used for isotopic analysis.
Improvement in statistical uncertainty in calculation of the peak area ratios for isotopes of Pu showed as much as a factor of 5.3 improvement over the statistical uncertainty obtained from peak areas in HPGe (Hoover et al., 2014). The lower statistical uncertainty was most notable for closely spaced peaks such as those from Pu-238 and Pu-239, and less notable for peaks which are already prominent and well-isolated in HPGe spectra such as Pu-241 and Pu-239.
Again, like the HPGe spectra throughout this paper, the HPGe spectrum in Figure 12 is meant to be a representative example to demonstrate the greater richness of peaks observed in a microcal spectrum. Quantitative analysis of HPGe peak areas is not performed in this paper. The quantitative comparisons between HPGe and microcal discussed here are derived from the cited works (Hoover et al., 2014; Yoho et al., 2020a) and not the spectra shown.
Calculation of the isotopic percentages requires not only the peak areas, but also nuclear data, namely, half-lives and gamma-ray emission probabilities. For many gamma-ray peaks in U and Pu, it has been found that the limiting factor in uncertainty is the gamma-ray emission probability (Yoho et al., 2020a). There are therefore opportunities for gamma-ray microcal to improve the uncertainty nuclear data by measuring well-characterized isotopic standards and using the microcal peaks to calculate more precise values for the gamma-ray emission probabilities. Initial implementations of this analysis for Pu isotopic standards improved uncertainties for several gamma-ray emission probabilities by up to a factor of 3.5 times lower than the National Nuclear Data Center (NNDC) uncertainty values (Yoho et al., 2020a). The uncertainty budgets for the top seven most improved branching ratios from (Yoho et al., 2020a) are given in Figure 13. This figure shows the areas of uncertainty with most room for improvement in microcal measurements. For each of the gamma rays investigated, the largest contributions to uncertainty were the fixed branching ratios of other gamma rays used in the calculation and Poisson statistics. This highlights that even these seven branching ratios can be measured more precisely with longer measurements and higher count rates, which should become more feasible as work progresses to make transition edge sensors faster and arrays of pixels larger. There is also ongoing work to improve atomic data, notably x-ray lineshapes and energies (Wessels et al., 2023). The field of neutron activation analysis is also identified as an area from which reduced uncertainty in gamma-ray energies would be highly beneficial. Microcal offers significant potential for improving nuclear and atomic data for other applications.
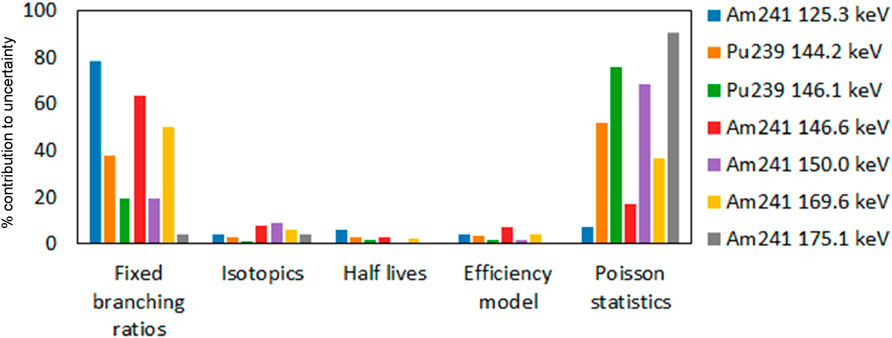
Figure 13. The uncertainty budget for seven branching ratios most improved by microcal measurements (Yoho et al., 2020a). The y-axis represents what percent of the reported uncertainty on the branching ratio from a given isotope comes from a particular origin (categories on the x-axis). This plot demonstrates the potential for significantly more improvement with longer run times and a reduction of the dependent branching ratio uncertainties.
Another signature well-suited for microcalorimeter gamma-ray measurements is that of Np-237 (Croce et al., 2021). The Np-237 peak has the energy of 86.48 keV and can be well-resolved from the neighboring peak originating from Pa-233, its daughter. This, along with the ability to observe well-resolved U-238 peaks, presents a potential for gamma-ray radiochronometry. The parent-to-daughter ratios of U-238/Pa-234 m and Np-237/Pa-233 are useful radiochronometry ratios (Mayer et al., 2013). This avenue has not yet been explored with gamma-ray microcal, but future work exploring the precision and uncertainty limits of the technique is anticipated.
Finally, opportunities for observing other rarely-observed peaks abound in gamma-ray microcal spectra of Pu. These include observations of weak Pu-242 gamma-ray peaks (Teti et al., 2023; Mercer et al., 2022) and a previously unseen peak triplet in Am-241 (Koehler et al., 2021).
3.3 Nuclear fuel signatures
Gamma-ray microcal has also been demonstrated for determining characteristics of nuclear fuels, including burnup, cooling time, and other key signatures that may help indicate the origin of the fuel and type of reactor in which it was irradiated.
3.3.1 U/Pu ratio
A significant signature enabled by microcal is the ability to estimate the uranium to plutonium ratio in spent fuel from x-ray signatures. Uranium and plutonium fluorescence x-ray peak areas are correlated to the amount of uranium and plutonium in the sample. Taking the ratio of the areas of the x-ray peaks is a way to extract the U/Pu ratio within the sample (Rasmussen and Cohan., 1962; Rudy et al., 2006). The U/Pu ratio is an important indicator for burnup of the fuel (Mayer et al., 2013). The longer the fuel has been irradiated, the higher the burnup, and the higher the ratio of plutonium to uranium will be, as the uranium captures more and more neutrons and transmutes to plutonium.
In the Advanced Gas Reactor (AGR) experiments (Pham et al., 2021), tristructural isotropic (TRISO) fuel, a type of advanced reactor fuel (Demkowicz et al., 2019), was irradiated at the INL Advanced Test Reactor. Gamma-ray microcal spectra were obtained for dissolved TRISO and for solid TRISO fuel compacts. Figure 14a shows a 60,000-s spectrum obtained by SOFIA of the U Kα1 (K-L3), Pu Kα1, and Pu Kα2 (K-L2) x-rays in irradiated TRISO compact 2–633. The item has a burnup of 7.46% fissions per initial metal atom (FIMA) and was measured after a cooling time of 134 months. Both Pu x-rays in particular are observable in the microcal spectrum due to the lower signal to noise ratio enabled by microcal. For comparison, a 3387-s live time HPGe spectrum of TRISO compact 5–223 is shown. This item has even higher burnup (14.33% FIMA), and therefore a higher percentage of plutonium than the 2–633 item, and was measured after a cooling time of 38 months. However, the HPGe Pu Kα2 peak in particular is obscured by the neighboring U Kα1. In this microcal spectrum, the X-rays could be quantified at the 1% and 10% level with approximately 40,000 counts and 3,400 counts, respectively. In this spectrum, for example, we are able to quantify the Pu Kα1 peak with approximately 2% statistical uncertainty. The calculation of the x-ray peak ratios is therefore enabled.
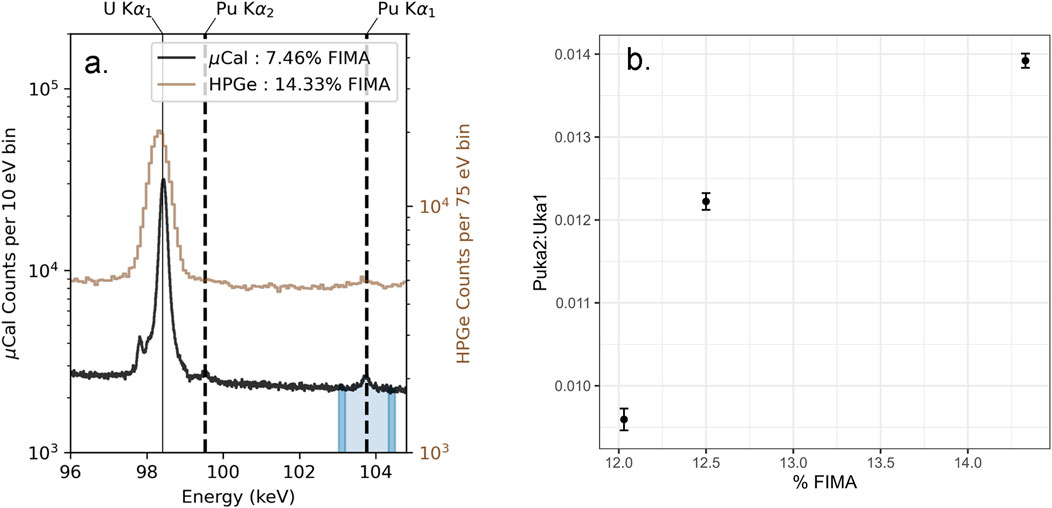
Figure 14. (a) SOFIA microcalorimeter spectrum for irradiated AGR 2 TRISO compact 2–633 (7.46% FIMA) and HPGe spectrum for irradiated AGR 5/6/7 TRISO compact 5–223 (14.33% FIMA). The U Kα1, Pu Kα1, and Pu Kα2 peaks are indicated. The background below the peak (light shaded region, 5 FWHM) is approximated using the dark shaded region to predict how many counts in this peak are needed for various quantification precision levels. (b) The ratio of the Pu Kα2 x-ray peak area to the U Kα1 peak area, plotted as a function of burnup expressed in fissions per initial metal atom (% FIMA).
The Pu Kα2/U Kα1 is a particularly useful ratio, as the peaks are close in energy, and there is negligible variation in the efficiency curve between measurements, so the peaks may be meaningfully compared. A plot of the Pu Kα2/U Kα1 peak ratios as a function of burnup in fissions per initial metal atom (FIMA) is provided in Figure 14b. Because the intensity of the x-ray is related to the amount of material present, the peak area ratio of Pu Kα2/U Kα1 should be related to the ratio of Pu/U in the fuel. There is an increasing trend, as may be expected, due to the increasing formation of Pu with increased burnup. More work will be needed, however, to explain the exact shape of the curve. Further studies on more materials across a greater range of reactor conditions will help to fill in points on the curve and extract a functional form. From a complete set of data across many burnups, it may be possible to predict burnup from the ratio of the x-ray peak areas, previously only feasible with destructive techniques. We do not find a trend for the Pu Kα1/U Kα1 values. We believe that across the wider energy range, there is more variation in the efficiency, and therefore a simple Pu Kα1/U Kα1 ratio is less meaningful without accounting for the efficiency.
The intensity of U and Pu x-rays can also be an indicator for the concentration of U and Pu in a source. U and Pu x-rays are prominent in microcal spectra of irradiated AGR compacts, for example, but are not seen in dilute solutions. In dilute solution, the U, Pu, and beta-emitting fission products are much less concentrated. Therefore, self-fluorescence of the U and Pu x-rays and x-ray fluorescence induced by the beta emissions are both much less probable. Such an x-ray signature obtained from a sample of unknown origin provides evidence as to the density and U/Pu concentration within the sample, helping to quickly discern the sample form.
3.3.2 Cooling time indicators
Highly resolved gamma-ray peaks from fission products also have great potential for indicators about the fuel origin. Eu-154 and Eu-155 are strong candidate isotopes for use in calculation of cooling time, or time since irradiation (Croce et al., 2023). Eu-154 has already been used in ratios with other isotopes to estimate cooling time and burnup (Favalli et al., 2016). Gamma-ray microcal enables potentially more accurate measures of cooling time through comparison of Eu-154 with Eu-155, because a nearby Eu-155 peak is also resolvable (Schreiber et al., 2023). For example, HERMES-400 obtained a 600,000-s spectrum from electrorefiner salt solution (Frederickson and Yoo., 2023), a solution containing fission products from spent fuel separated from uranium and transuranic products. Notable interferences of Eu-155 from Np-239 near 106 keV were resolved, which may allow for a better estimate of the Eu-155 concentration in the sample (Figure 15). The Eu-155 peak at 105.3 keV could be quantified at the 1% and 10% level with approximately 18,000 counts and 1,200 counts, respectively. In this spectrum, we are able to quantify this peak with approximately 3.5% statistical uncertainty. This peak area may be compared to the peak area of Eu-154 at 123.07 keV for cooling time estimates. For comparison of visible peaks, a 14,400-s live time HPGe spectrum of the same item, measured 70 days earlier, is shown. In general, gamma-ray microcal could become a tool to monitor material through all steps of nuclear fuel cycle operations, including potential reprocessing operations such as electrorefinery. The rich quantity of gamma rays in spent fuel materials provides a variety of signatures that could be useful in material tracking.
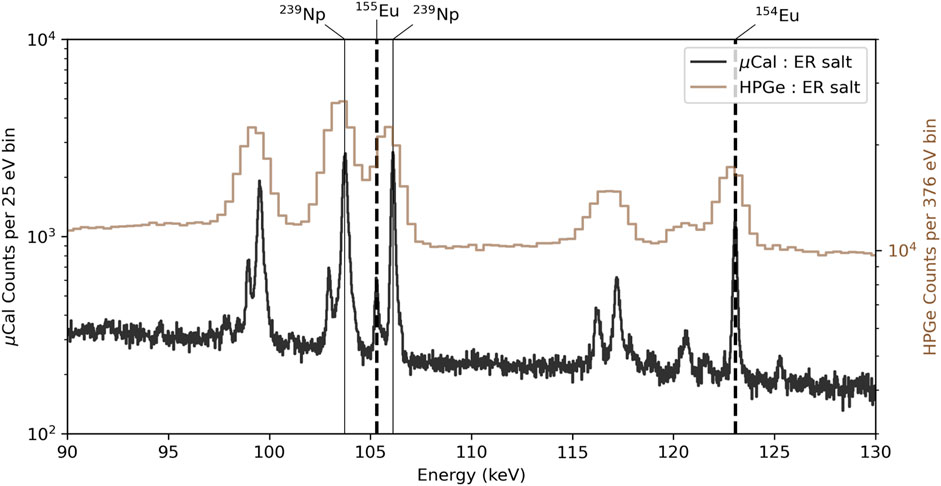
Figure 15. Electrorefiner salt solution spectra obtained at INL by HERMES-400 demonstrating resolution of interferences by microcal, notably for Eu-155 and Np-239.
3.4 Ongoing work: efficiency calculations
Calculation of the measurement efficiency is an essential component for extracting activity or isotopic ratios from the spectra displayed. A fixed response analysis technique for computing relative efficiency can be used in some cases to extract isotopic ratios, as described in Yoho et al., 2020a. A technique to be used for general measurements would involve the co-measurement of an efficiency standard along with the sample of interest. This standard would have a well-characterized isotopic composition, so that the peak areas for this standard can be used for a relative efficiency calculation and applied towards the quantification of isotopes for the sample in question. This technique has not yet been explored for the spectra shown in this paper, but is an area of immediate future study.
Absolute efficiency calculations for quantification of nuclide activities are another component of research and development for our collaboration. The technique is challenging, but important even in conventional gamma-ray spectroscopy (Burdeinyi et al., 2020; Patra et al., 2024), typically involving detector modeling. The technique is even more challenging with gamma-ray microcal due to the pixelated TES nature of the detectors. Work to quantify absolute efficiency curves for the microcal detectors is ongoing. Using HERMES-700 at PNNL, modeling and sample holders for reproducible sample placement are being implemented to address these considerations. A custom Bosch frame was added to the system and 3D printed sample holders designed to facilitate careful, repeatable placement of samples for analysis (Figure 16). A precision GEANT4 model of the system was also established to support instrument performance assessments and measurement predictions.
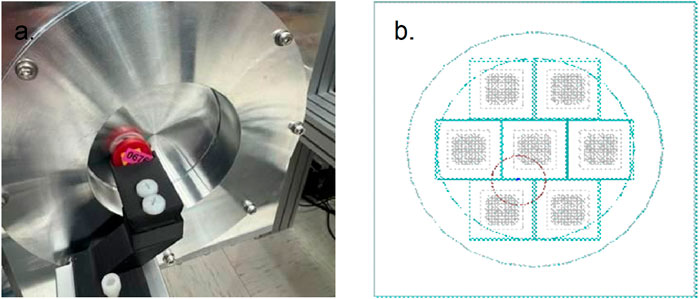
Figure 16. (a) Photo of the 3D printed Eckert & Ziegler type D sealed source sample holder. (b) GEANT4 CAD rendering of the sample counting geometry.
A portable germanium detector can also be positioned juxtaposed to the microcal spectrometer to provide a secondary measurement resource of samples and to evaluate the microcalorimeter spectral response relative to a well-known, calibrated system. Dead-time and detector efficiency variations due to pulse filtering and noise in the microcalorimeter complicate quantitative analysis, and comparing measured spectra in-situ to a well-known instrument is one method for addressing these uncertainties. We expect to further explore this method in future measurements.
4 Discussion
Advances in instrumentation and analysis are now enabling the application of passive, nondestructive microcalorimeter gamma-ray spectroscopy to a wide variety of sample types across the nuclear fuel cycle and radionuclide analysis applications. The ultra-high energy resolution and improved peak-to-background ratios can provide more information than conventional gamma spectroscopy with high-purity germanium detectors. In analytical laboratories, microcalorimeter gamma-ray spectrometry may complement destructive analyses either by pre-screening samples or providing additional information to inform other measurement techniques. For example, inter-element isotope ratios or those with isobaric interferences may be measured with different systematic uncertainties and potentially similar precision to mass spectrometry. This includes ratios of Np-237 and Am-241/243 to total Pu, or Pu-238 in the presence of large quantities of U-238.
Gamma-ray microcal enables higher-precision nondestructive isotopic analysis and the use of more spectral signatures to better characterize nuclear and radioactive material in addition to the opportunity to improve nuclear and atomic data. Continued advancement in array size, data acquisition techniques, and operational stability are underway to bring the benefits of this technology to industry. Implementation in analytical laboratories is expected to improve confidence in results and analysis capacity for wide-ranging applications.
Data availability statement
The raw data supporting the conclusions of this article will be made available by the authors, without undue reservation.
Author contributions
KS: Writing – original draft, Writing - review and editing, Conceptualization, Formal Analysis, Investigation, Methodology. KK: Writing – original draft, Writing – review and editing, Formal Analysis. MC: Writing – original draft, Writing – review and editing, Conceptualization. ES: Formal Analysis, Investigation, Writing – original draft. DM: Writing – review and editing. MC: Writing – review and editing. DM: Writing – review and editing, EA: Writing – review and editing. BA: Writing – review and editing. LA: Writing – review and editing. GB: Writing – review and editing. DB: Writing – review and editing. DB: Writing – review and editing. BB: Writing – review and editing. SD: Writing – review and editing. JF: Writing – review and editing. JG: Writing – review and editing. DG: Writing – review and editing. KG: Writing – review and editing. CG: Writing – review and editing. CH: Writing – review and editing. JH: Writing – review and editing. MK: Writing – review and editing. JB: Writing – review and editing. CM: Writing – review and editing. GO: Writing – review and editing. NO: Writing – review and editing. LP: Writing – review and editing. BP: Writing – original draft, Writing – review and editing. DS: Writing – review and editing. RS: Writing – review and editing. ES: Writing – review and editing. DS: Writing – review and editing. JU: Writing – review and editing. SW: Writing – review and editing. AW: Writing – review and editing.
Funding
The author(s) declare that financial support was received for the research and/or publication of this article. Research presented in this article was supported by the U.S. Department of Energy Office of Nuclear Energy Material Protection, Accountancy, and Control Technology (MPACT) Program, Office of Nuclear Energy Advanced Reactor Safeguards and Security (ARSS) Program, and the National Nuclear Security Administration Office of Defense Nuclear Nonproliferation Research and Development.
Acknowledgments
Support from INL MFC Analytical Laboratory staff, ORNL IFEL staff, ORNL HFIR staff, LANL TA-55 staff, and PNNL Radiological Processing Laboratory and Washington State University staff were greatly appreciated in coordinating sample preparation and measurement. Many years of TES development at NIST/CU Boulder have also gone into these detectors, and we thank many researchers acknowledged for their work.
Conflict of interest
The authors declare that the research was conducted in the absence of any commercial or financial relationships that could be construed as a potential conflict of interest.
Generative AI statement
The author(s) declare that no Generative AI was used in the creation of this manuscript.
Any alternative text (alt text) provided alongside figures in this article has been generated by Frontiers with the support of artificial intelligence and reasonable efforts have been made to ensure accuracy, including review by the authors wherever possible. If you identify any issues, please contact us.
Publisher’s note
All claims expressed in this article are solely those of the authors and do not necessarily represent those of their affiliated organizations, or those of the publisher, the editors and the reviewers. Any product that may be evaluated in this article, or claim that may be made by its manufacturer, is not guaranteed or endorsed by the publisher.
References
Becker, D. T., Alpert, B. K., Bennett, D. A., Croce, M. P., Fowler, J. W., Gard, J. D., et al. (2019). Advances in analysis of microcalorimeter gamma-ray spectra. IEEE Trans. Nucl. Sci. 66, 2355–2363. doi:10.1109/tns.2019.2953650
Becker, D. T., Bennett, D. A., Carpenter, M. H., Croce, M. P., Keller, M. W., Koehler, K. E., et al. (2023). “SAPPY: a new software pipeline for analysis of gamma-ray spectra produced by microcalorimeter and high-purity germanium detectors,” in Proceedings of the 2023 INMM & ESARDA Joint Virtual Annual Meeting.
Bennett, D. A., Horansky, R. D., Schmidt, D. R., Hoover, A. S., Winkler, R., Alpert, K., et al. (2012). A high resolution gamma-ray spectrometer based on superconducting microcalorimeters. Rev. Sci. Instrum. 83, 093113. doi:10.1063/1.4754630
Burdeinyi, D., Kutnii, D., Vanzha, S., Levenets, V., and Turkin, A. (2020). A new nondestructive iterative method for forensics characterization of uranium-bearing materials by HRGS. Appl. Radiat. Isotopes 166, 109433. doi:10.1016/j.apradiso.2020.109433
Burnett, J. L., and Miley, H. S. (2021). Performance characterization of the Radionuclide Aerosol Sampler/Analyzer air sampler during a high-activity release event. Nucl. Instrum. Methods Phys. Res. Sect. A Accel. Spectrom. Detect. Assoc. Equip. 985, 164650. doi:10.1016/j.nima.2020.164650
Croce, M. P., Becker, D. T., Koehler, K. E., and Ullom, J. N. (2021). Improved nondestructive isotopic analysis with practical microcalorimeter gamma spectrometers. J. Nucl. Material Manag. 49 (3), 108–113. doi:10.48550/arXiv.2104.03376
Croce, M. P., Becker, D. T., Bennett, D. A., Boyd, S. T. P., Cantor, R. H., Carpenter, M. H., et al. (2022). “Nuclear facility experience with the SOFIA ultra-high-resolution microcalorimeter gamma spectrometer,” in Proceedings of the 2022 INMM Annual Meeting.
Croce, M. P., Mercer, D., Schreiber, K. A., McNeel, D., Carpenter, M. H., Schoenemann, R., et al. (2023). “Characterization of dissolved high-burnup nuclear fuel with microcalorimeter, high purity germanium, and cadmium zinc Telluride gamma spectroscopy,” in Proceedings of the 2023 INMM & ESARDA Joint Virtual Annual Meeting.
Demkowicz, P. A., Liu, B., and Hunn, J. D. (2019). Coated Particle fuel: historical perspectives and current progress. J. Nucl. Mater. 515, 434–450. doi:10.1016/j.jnucmat.2018.09.044
Favalli, A., Vo, D., Grogan, B., Jansson, P., Liljenfeldt, H., Mozin, V., et al. (2016). Determining initial enrichment, burnup, and cooling time of pressurized-water-reactor spent fuel assemblies by analyzing passive gamma spectra measured at the Clab interim-fuel storage facility in Sweden. Nucl. Instrum. Methods Phys. Res. Sect. A Accel. Spectrom. Detect. Assoc. Equip. 820, 102–111. doi:10.1016/j.nima.2016.02.072
Fowler, J. W., Alpert, B. K., Doriese, W. B., Joe, Y.-I., O’Neil, G. C., Ullom, J. N., et al. (2016). The practice of pulse processing. J. Low Temp. Phys. 184 (1), 374–381. doi:10.1007/s10909-015-1380-0
Frederickson, G. L., and Yoo, T.-S. (2023). Engineering scale pyroprocessing activities in the United States. Nuclear Regulatory Commission Report. Task Order 31310022F0031. Idaho National Laboratory.
Gard, J. D., Becker, D. T., Bennett, D. A., Fowler, J. W., Hilton, G. C., Mates, J. A. B., et al. (2018). A scalable readout for microwave SQUID multiplexing of transition-edge sensors. J. Low Temp. Phys. 193 (3–4), 485–497. doi:10.1007/s10909-018-2012-2
Hoover, A. S., Bacrania, M. K., Hoteling, N. J., Karpius, P. J., Rabin, M. W., Rudy, C. R., et al. (2009). Microcalorimeter arrays for ultra-high energy resolution x-and gamma-ray detection. J. Radioanal. Nucl. Chem. 282, 227–232. doi:10.1007/s10967-009-0223-3
Hoover, A. S., Hoteling, N., Rabin, M. W., Ullom, J. N., Bennett, D. A., Karpius, P. J., et al. (2011). Large microcalorimeter arrays for high-resolution X- and gamma-ray spectroscopy. Nucl. Instrum. Methods Phys. Res. Sect. A Accel. Spectrom. Detect. Assoc. Equip. 652 (1), 302–305. doi:10.1016/j.nima.2010.09.154
Hoover, A. S., Winkler, R., Rabin, M. W., Vo, D. T., Ullom, J. N., Bennett, D. A., et al. (2013). Determination of plutonium isotopic content by microcalorimeter gamma-ray spectroscopy. IEEE Trans. Nucl. Sci. 60 (2), 681–688. doi:10.1109/TNS.2013.2249091
Hoover, A. S., Winkler, R., Rabin, M. W., Bennett, D. A., Doriese, W. B., Fowler, J. W., et al. (2014). Uncertainty of plutonium isotopic measurements with microcalorimeter and high-purity germanium detectors. IEEE Trans. Nucl. Sci. 61 (4), 2365–2372. doi:10.1109/TNS.2014.2332275
IAEA (International Atomic Energy Agency) (2015). IAEA nuclear security series No. 2-G (Rev. 1): nuclear forensics in support of investigations implementing guide.
IAEA (International Atomic Energy Agency) (2020). Advances in small modular reactor technology developments
IAEA (International Atomic Energy Agency) (2022). STR-368 Rev. 1.1: international target values for measurement uncertainties in safeguarding nuclear materials.
Irwin, K. D., Hilton, G. C., Wollman, D. A., and Martinis, J. M. (1996). X-ray detection using a superconducting transition-edge sensor microcalorimeter with electrothermal feedback. Appl. Phys. Lett. 69 (13), 1945–1947. doi:10.1063/1.117630
John, K. (2019). US DOE tri-lab production effort to provide accelerator-produced 225ac for radiotherapy: 2019 update J. Nucl. Med. 60. doi:10.1016/j.jmir.2019.11.009
Keegan, E., Kristo, M. J., Toole, K., Kips, R., and Young, E. (2016). Nuclear forensics: scientific analysis supporting law enforcement and nuclear security investigations. Anal. Chem. 88 (3), 1496–1505. doi:10.1021/acs.analchem.5b02915
Koehler, K. E., Yoho, M. D., Carpenter, M. H., Croce, M. P., Mercer, D. J., Smith, C. M., et al. (2021). New experimentally observable gamma-ray Emissions from 241Am nuclear decay arXiv:2103.15893
Mates, J. A. B., Becker, D. T., Bennett, D. A., Dober, B. J., Gard, J. D., Hays-Wehle, J. P., et al. (2017). Simultaneous readout of 128 X-ray and gamma-ray transition-edge microcalorimeters using microwave SQUID multiplexing. Appl. Phys. Lett. 111 (6), 062601. doi:10.1063/1.4986222
Mayer, K., Wallenius, M., and Varga, Z. (2013). Nuclear forensic science: correlating measurable material parameters to the history of nuclear material. Chem. Rev. 113 (2), 884–900. doi:10.1021/cr300273f
Mercer, D. J., Winkler, R., Koehler, K. E., Becker, D. T., Bennett, D. A., Carpenter, M. H., et al. (2022). Quantification of 242Pu with a microcalorimeter gamma spectrometer. arXiv:2202, 02933. doi:10.48550/arXiv.2202.02933
Mirion Technologies (2023). U-LEGe: ultra-low energy germanium detector. Available online at: https://www.mirion.com/products/technologies/spectroscopy-scientific-analysis/gamma-spectroscopy/detectors/hpge-detectors-accessories/u-lege-ultra-low-energy-germanium-detectors.
Patra, S., Mani, A. M., Kumar, S., and Tripathi, R. (2024). Interrogating a mixed actinide basket using high-resolution γ-ray spectrometry: a nuclear forensic perspective on possible smuggling scenarios. Anal. Chem. 96 (7), 2857–2865. doi:10.1021/acs.analchem.3c03779
Pham, B. T., Palmer, J. J., Marshall, D. W., Sterbentz, J. W., Hawkes, G. L., and Scates, D. M. (2021). AGR 5/6/7 irradiation test final as-run report.
Rasmussen, N. C., and Cohan, M. D. (1962). Analysis of radiations from spent fuel elements using a bent-Crystal Spectrograph. Trans. Am. Nucl. Soc. 5 (1), 24.
Rudy, C., Chesson, K., Hoover, A., Rabin, M., and Ullom, J. N. (2006). Determination of Pu in spent fuel assemblies using self-fluorescent X-rays. Trans. Am. Nuc. Soc. 95, 61.
Sampson, T. E., Nelson, G. W., and Kelley, T. A. (1989). FRAM:A versatile code for analyzing the isotopic composition of plutonium from gamma-ray pulse height spectra. Los Alamos National Laboratory Report LA-11720-MS.
Schreiber, K. A., Wessels, A. L., McNeel, D. G., Keller, M., Croce, M. P., Carpenter, M. H., et al. (2023). “Ultra-high energy resolution microcalorimeter gamma ray spectrometer for high precision nuclear fuel cycle research,” in Proceedings of the 2023 INMM & ESARDA Joint Virtual Annual Meeting (IEEE).
Schreiber, K. A., McNeel, D. G., Keller, M., Croce, M. P., Carpenter, M. H., Schönemann, R. U., et al. (2024). “Ultra-high energy resolution gamma spectroscopy of fission products from freshly irradiated material,” in Proceedings of the 2024 INMM Annual Meeting.
Teti, E., Becker, D. T., Bennett, D. A., Carpenter, M. H., Croce, M., De Castro, K., et al. (2023). “Quantification of 242 Pu with a microcalorimeter gamma spectrometer,” in Proceedings of the 2023 INMM & ESARDA Joint Virtual Annual Meeting.
Thiele, N. A., and Wilson, J. J. (2018). Actinium-225 for targeted α therapy: coordination chemistry and current chelation approaches. Radiopharmaceuticals 33, 336–348. doi:10.1089/cbr.2018.2494
Tollefson, A. D., Smith, C. M., Carpenter, M. H., Croce, M. P., Fassbender, M. E., Koehler, K. E., et al. (2021). Appl. Radiat. Isotopes 172, 109693. doi:10.1016/j.apradiso.2021.109693
Ullom, J. N., and Bennett, D. A. (2015). Review of superconducting transition-edge sensors for x-ray and gamma-ray spectroscopy. Supercond. Sci. Technol. 28, 084003. doi:10.1088/0953-2048/28/8/084003
Wessels, A., Becker, D. T., Bennett, D. A., Carpenter, M. H., Croce, M., Fowler, J. W., et al. (2023). “Using gamma-ray microcalorimeters to lower uncertainty in non-destructive analysis measurements through improvement of nuclear reference data,” in Proceedings of the 2023 INMM & ESARDA Joint Virtual Annual Meeting.
Winkler, R., Hoover, A. S., Rabin, M. W., Bennett, D. A., Doriese, W. B., Fowler, J. W., et al. (2015). 256-pixel microcalorimeter array for high-resolution γ-ray spectroscopy of mixed-actinide materials. Nucl. Instrum. Methods Phys. Res. Sect. A Accel. Spectrom. Detect. Assoc. Equip. 770, 203–210. doi:10.1016/j.nima.2014.09.049
Yoho, M. D., Koehler, K. E., Becker, D. T., Bennett, D. A., Carpenter, M. H., Croce, M. P., et al. (2020a). Improved plutonium and americium photon branching ratios from microcalorimeter gamma spectroscopy. Nucl. Inst. Methods Phys. Res. A 977, 164307. doi:10.1016/j.nima.2020.164307
Yoho, M. D., Koehler, K. E., Garner, S. E., Vo, D. T., and Croce, M. P. (2020b). Automated co-adding and energy calibration of large array microcalorimeter data with zero sample knowledge. Nucl. Instrum. Methods Phys. Res. Sect. A Accel. Spectrom. Detect. Assoc. Equip. 969, 164056. doi:10.1016/j.nima.2020.164056
Keywords: gamma-ray spectrometry, nuclear fuel cycle, microcalorimeter spectrometer, nuclear forensics and safeguards, isotope identification
Citation: Schreiber KA, Koehler KE, Croce MP, Stark EN, McNeel DG, Carpenter MH, Mercer DJ, Abel EP, Archambault B, Arrigo L, Batie G, Becker DT, Bennett DA, Bucher BM, Dede S, Fowler J, Gard JD, Glasgow D, Goetz KC, Gray C, Harabagiu C, Hu J, Keller MW, Ben Mates JA, Mathew C, O’Neil GC, Ortiz NJ, Pagani L, Pierson BD, Schmidt DR, Schoenemann RU, Seabury E, Swetz DS, Ullom JN, Weidenbenner SL and Williams AN (2025) Applications of ultra-high resolution microcalorimeter gamma-ray spectrometry. Front. Nucl. Eng. 4:1654123. doi: 10.3389/fnuen.2025.1654123
Received: 26 June 2025; Accepted: 22 August 2025;
Published: 11 September 2025.
Edited by:
Amy Hixon, University of Notre Dame, United StatesReviewed by:
René Bes, University of Helsinki, FinlandOrlando Quaranta, Argonne National Laboratory (DOE), United States
Takahito Osawa, Japan Atomic Energy Agency, Japan
Copyright © 2025 Schreiber, Koehler, Croce, Stark, McNeel, Carpenter, Mercer, Abel, Archambault, Arrigo, Batie, Becker, Bennett, Bucher, Dede, Fowler, Gard, Glasgow, Goetz, Gray, Harabagiu, Hu, Keller, Ben Mates, Mathew, O’Neil, Ortiz, Pagani, Pierson, Schmidt, Schoenemann, Seabury, Swetz, Ullom, Weidenbenner and Williams. This is an open-access article distributed under the terms of the Creative Commons Attribution License (CC BY). The use, distribution or reproduction in other forums is permitted, provided the original author(s) and the copyright owner(s) are credited and that the original publication in this journal is cited, in accordance with accepted academic practice. No use, distribution or reproduction is permitted which does not comply with these terms.
*Correspondence: Katherine A. Schreiber, a3NjaHJlaWJlckBsYW5sLmdvdg==