 Shenyang Hu
 Yulan Li
 R. Matthew Asmussen
- Pacific Northwest National Laboratory, Richland, WA, United States
A mesoscale model is developed to study silver (Ag) dissolution in Cast Stone (CS) matrix containing silver mordenite (AgM) particles. The model captures microstructure-dependent thermodynamic and kinetic properties, including multispecies diffusion, redox reactions, and Ag precipitation. Simulations show that Ag-rich precipitate formation at the AgM/CS interface slows dissolution by reducing chemical potential gradients and diffusivity, while oxidation reactions enhance Ag release by increasing retention around unreacted reagents (e.g., slag, cement). Smaller AgM particles dissolve more rapidly due to shorter diffusion paths. This model offers a mechanistic framework to assess how microstructure and redox chemistry influence Ag retention and can be integrated with geochemical speciation models for multiscale performance evaluation of nuclear waste forms.
1 Introduction
The long-term disposal of radioactive waste at the U.S. Department of Energy’s Hanford Site involves the management of over 50 million gallons of chemically complex and radioactive wastes (Asmussen et al., 2020). The Hanford Waste Treatment and Immobilization Plant is designed to treat and immobilize these wastes through vitrification. However, significant volumes of solid secondary waste (SSW) will be generated from waste processing, vitrification, off-gas management, and supporting activities. One such SSW stream is a silver mordenite (AgM) sorbent used for radioiodine capture in the high-level waste vitrification facility. These I-laden AgM sorbent particulates are planned to be stabilized (microencapsulated) in cementitious waste forms for disposal in the Integrated Disposal Facility (IDF) at Hanford. In addition, AgM has been shown to be effective at the capture of iodine from liquid waste streams, although such an application is not yet planned for use. If used for liquid capture, the I-laden AgM would also require stabilization for disposal. One candidate waste form formulation that has been studied for this application is Cast Stone (CS), a ternary blend of 47 wt% ground granulated blast furnace slag (BFS), 45 wt% of fly ash (FA) and 8 wt% ordinary Portland cement (OPC, although replacement with Portland lime cement is likely in future studies). In cementitious systems such as Cast Stone (comprising BFS, FA, and OPC), the pore water (PW) typically exhibits high alkalinity (pH ∼12–13) and reducing conditions (low Eh). Under such conditions,
Accurately representing the long-term performance of these cementitious matrices for the isolation of radionuclides is required in performance assessment, such as the IDF performance assessment (LEE and Site, 2018). Previous studies (Emmanuel and Berkowitz, 2007; Emmanuel et al., 2010; Liu and Jacques, 2017) have identified pore size-dependent solubility as a key factor influencing precipitation and porosity evolution during mineral dissolution in porous media, with pores smaller than 0.1 μm exhibiting markedly altered solubility behavior. Cast Stone, like other cementitious materials, exhibits a wide pore size distribution, ranging from approximately 10 μm down to sub-nanometer scales (as small as 0.5 nm) (Jennings et al., 2002). Much of this porosity is associated with the calcium silicate hydrate (C-S-H) gel phase, often referred to as gel porosity (Taylor, 1997).
Experimental studies have demonstrated that both the formation of silver-rich layers at the AgM/pore water interface and the grout composition play critical roles in governing redox behavior and iodine retention (Inagaki et al., 2008; Li et al., 2019). Microstructural characterization of CS with embedded AgM particles further revealed highly inhomogeneous distributions of silver and iodine: silver tends to segregate at particle interfaces, whereas iodine is largely absent in these regions. These findings underscore the complex interplay among dissolution, redox reaction, and transport processes in multiphase systems (Yamagata et al., 2022).
Despite the importance of these mechanisms, prior assessments of long-term performance have often relied on simplifying assumptions and limited material-specific data (Asmussen et al., 2020). Current efforts therefore focus on developing mechanistically informed models that more accurately represent SSW behavior in cementitious matrices under disposal conditions.
Dissolution modeling of waste forms, particularly glass and crystalline ceramics, has long employed kinetic models based on transition state theory, incorporating the effects of solution saturation, temperature, and Eh/pH. Geochemical modeling tools such as the Grambow-Müller model, GRAAL (Frugier et al., 2008; Fournier et al., 2018), and the immobilized low-activity waste glass corrosion model have been widely applied to simulate the long-term dissolution behavior of nuclear waste glass. Similarly, geochemical speciation models (Chen et al., 2021; Chen et al., 2023a; Chen et al., 2023b; Arnold et al., 2017) have been developed to quantify the influence of oxidation and carbonation on radionuclide release rates from cementitious waste forms. However, most existing models are point-source representations, constrained by limited data and computational capacity, and unable to capture microstructural heterogeneity or localized thermodynamic or kinetic variability—features particularly critical in systems containing embedded reactive phases such as AgM. Advances in experimental characterization and computational capabilities now enable the development of predictive, spatially resolved models.
Mesoscale approaches provide a promising pathway for capturing the effect of heterogenous microstructures and spatially varying material properties on waste form performance. Building on work at the Center for Hierarchical Waste Form Materials Energy Frontier Research Center (EFRC), mesoscale simulations can resolve coupled multi-physics phenomena—including diffusion, leaching, interfacial reactions, microstructural evolution, and electrochemical potential gradients—within representative volumes of porous materials (Li et al., 2022a; Li et al., 2022b). These models provide critical insights into the spatiotemporal evolution of species concentrations, electrochemical environments, and effective material properties, while also generating virtual datasets that support upscaling, inform higher length scale mechanistic models, and enable uncertainty quantification for performance assessments.
In this study, we present a mesoscale phase-field (PF) model of Ag dissolution from AgM granules embedded in the CS formulation [9]. By incorporating microstructure-dependent thermodynamic and kinetic properties, the model enables detailed analysis of dissolution, diffusion, redox reaction, and precipitation kinetics. This approach provides a mechanistic basis for understanding microstructural and property evolution in systems where mean-field assumptions fail, ultimately enhancing the predictive capability of macroscale models for long-term cementitious waste form performance.
2 Methods
2.1 Description of the mesoscale phase-field model
Figure 1 illustrates the complex microstructure and elemental distribution within CS samples containing embedded silver mordenite (AgM) granules. The samples presented were prepared using the CS blend (47 wt% BFS, 45 wt% FA, 8 wt% OPC) mixed with water and I-laden Ag-mordenite (silver exchanged zeolite, Sigma Aldrich) at 20 vol%. The samples were cured for 28 days at > 90% relative humidity. The fabrication and characterization of AgM granules embedded in the CS formulation follow the procedures described in Ref. Chen et al., 2023a, where the experimental details are provided. As shown in Figures 1A–D, each millimeter-scale AgM granule is composed of micrometer-scale AgM grains separated by pores. The surrounding CS—including FA, BFS, and pores—exhibits structural features with a wide range of sizes. Figure 1E presents the spatial distribution of dissolved silver, highlighting the formation of a distinct Ag-rich layer approximately 100 μm thick at the AgM/CS interface. Silver concentrations also vary markedly among FA particles, BFS inclusions, and the surrounding porous matrix. The sample displayed in Figure 1E contained iodine as well, however due to the prominent overlap between Ca (major component of the grout matrix and zeolite) and I (present at ppm amount) in the X-ray energy spectrum, I is not a reliable measurement via EDS. Yamagata et al. (2022) showed that for similar samples, I is present at the interface behind the Ag migration using time-of-flight secondary ion mass spectroscopy (TOF-SIMS), which can resolve the Ca/I signal challenge. This spatial heterogeneity suggests significant local variations in electrochemical potential and in the rates of silver dissolution and subsequent reactions across the multiphase system.
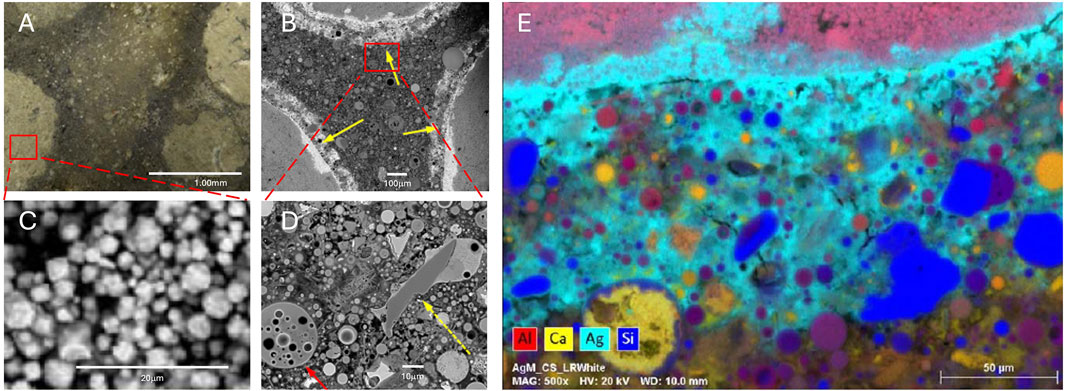
Figure 1. (A–D) Optical and scanning electron microscopy/backscattered electron images of microstructures in CS containing AgM granules. (A) AgM particles embedded in CS; (B) The yellow arrow points the AgM/CS interface; (C) Zoomed-in view of a AgM granule showing mesoscale pores and AgM polycrystalline grains; (D) Zoomed-in view of porous CS showing macroscale pores and FA and BFS particles; the red arrow points to a spherical FA particle while the dashed yellow arrow points to a BFS particle; and (E) elemental energy dispersive X-ray spectroscopy dot map near the interface between an AgM granule and CS shown in (D).
To capture the heterogeneous properties of the material, the mesoscale model of silver dissolution incorporates key microstructural features, including the average sizes and volume fractions of AgM, FA, and BFS particles, as well as the porosity of both CS and AgM granules. The model simplifies the microstructure and assumes the coexistence of five distinct phases: AgM, FA, BFS, the porous CS matrix, and Ag precipitates.
Within the mesoscale PF framework, two sets of field variables are used to describe the spatial and temporal evolution of chemical species and microstructure. The first set comprises concentration fields,
The Ag lattice is taken as the reference frame for the system. Initially, the normalized total silver concentration within Ag is defined as
These equilibrium values are governed by the intrinsic thermodynamic properties of each phase and are sensitive to environmental conditions such as temperature, pH, Eh, and local aqueous chemistry. Pore structure, including pore size, may also influence local equilibria. Experimentally determined sorption and desorption coefficients (
The order parameter field,
In the mesoscale PF framework, microstructure evolution is governed by the minimization of the system’s total free energy. The dynamics of the non-conserved order parameters,
where
In contrast, the evolution of conserved concentration fields,
Here,
The total free energy
Here,
The function
The total concentration of each species at position
It is assumed that the chemical free energy,
All model parameters—such as the gradient energy coefficient
2.2 Phase-dependent thermodynamic and kinetic properties
The thermodynamic and kinetic properties of species
To capture these inhomogeneities, two shape functions are introduced based on the order parameters
•
•
Using these shape functions and the mixture rule (Kim, 2007), the spatially varying thermodynamic and kinetic properties in the multiphase system can be effectively described.
Here,
In conventional geochemical modeling (Fang et al., 2003; Chen et al., 2021), chemical reactions are often assumed to reach equilibrium instantaneously–implying an effectively infinite reaction rate. However, in the present model, finite reaction kinetics are explicitly considered. In Equations 14, 15,
These reaction rates depend not only on the local concentration fields and microstructure but can also be modified by additional local environmental conditions, such as pH and Eh, to better reflect reactive transport behavior in heterogeneous systems. It is important to note that the reaction rate coefficients appear with opposite signs in the evolution Equation 2 of
2.3 Nucleation scheme
Ag precipitates are represented in the PF model using an order parameter,
In the simulations, a simplified heterogeneous nucleation scheme is implemented using two model parameters: the critical concentration
1. At every
2. At these sites, initialize nuclei by setting
3. Repeat steps (1) and (2) periodically.
This scheme allows for the continuous introduction of Ag precipitate nuclei during the simulation. The fate of each nucleus—whether it grows or dissolves—is governed by the local thermodynamic driving forces for phase transformation.
2.4 Simulation input parameters
In solving the evolution equations (Equations 1, 2), all the thermodynamic and kinetic properties are normalized using characteristic quantities: the characteristic energy density,
Here,
Here,
The free energy coefficients
Assuming the dimensionless model parameter
The chemical free energy coefficient
These data can be used to construct the chemical free energy functional
The chemical potential increment
The diffusivity
The reaction rate coefficient
In this work, model parameters were estimated using available data and reasonable assumptions. The fundamental thermodynamic and kinetic parameters used in Equation 16 are listed in Table 1 while Table 2 summarizes the normalized model parameters for parametric studies.
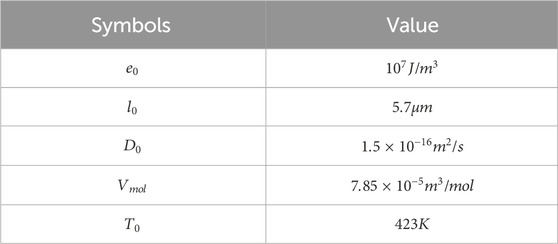
Table 1. Fundamental thermodynamic and kinetic parameters used in Equation 16.
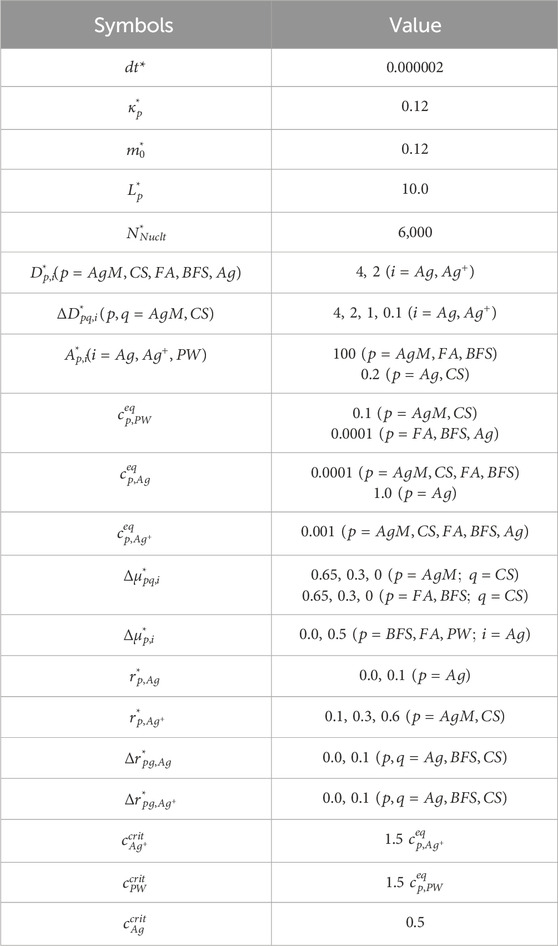
Table 2. Normalized model parameters for parametric studies.
2.5 Simulation setup and boundary conditions
The developed mesoscale model for Ag dissolution is formulated in three dimensions; however, to reduce computational cost, simulations are conducted in a quasi-three-dimensional domain. Specifically, the simulation cell is thin along the y-direction and extended in the x- and z-directions. The physical dimensions of the simulation domain are
To generate the initial microstructure, a multiphase phase-field grain growth model is employed, based on specified microstructural features such as the volume fractions of different phases and average particle sizes (Moelans, 2011). In the multiphase phase-field grain growth model, order parameters that vary smoothly from 0 to one represent different phases (AgM grains, FA, BFS, and CS). The volume fraction of each phase is calculated by integrating the regions where the corresponding order parameter values exceeds 0.5. For AgM particles, the mesopore volume fraction is included by accounting for regions where the AgM order parameter is below 0.8, representing the space between AgM grains. Figure 2 shows a representative simulation domain that includes a large AgM particle at the center, along with smaller FA and BFS particles embedded in a porous CS matrix. The volume fractions of AgM, FA, BFS and porous CS matrix are approximately 30%, 12.6%, 23.8%, and 33.6%, respectively. The mesopore volume within AgM accounts for 16% of the total volume of the AgM particle.
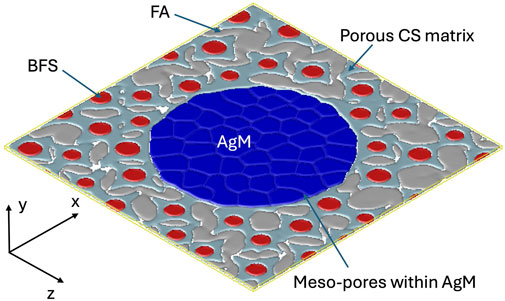
Figure 2. Schematic of the simulation cell, illustrating a AgM particle, FA inclusions, BFS particles, a porous CS matrix and meso-pores within the AgM particle. The AgM particle is represented as a cluster of smaller AgM grains. The volume fractions of AgM, FA, and BFS in the CS matrix are approximately 30%, 12.6%, and 23.8%, respectively. The mesopore volume within AgM is about 16% of the total volume of the AgM particle.
Ag dissolution simulations are conducted under batch experiment conditions. It is assumed that the PW within the porous CS matrix rapidly reaches a saturated concentration, denoted as
The large AgM particle is modeled as a polycrystalline structure composed of numerous smaller AgM grains [1], with meso-pores—submicron-sized voids—existing between them. During Ag dissolution, PW is assumed to infiltrate these meso-pores and microchannels within the AgM grains, where it reacts with AgM to release dissolved Ag. The dissolved Ag then diffuses, segregates, and forms Ag precipitates. Additionally, Ag may undergo oxidation depending on the local chemical environment. The detailed dissolution mechanisms have been discussed in prior literature [7]. Accordingly, a constant concentration
Table 3 summarizes the initial and equilibrium concentrations used in the simulations, which are employed to validate the model’s predictive capabilities. Nonetheless, more accurate experimental data are needed to enable quantitatively predictive simulations of leaching behavior, especially for defining initial and boundary conditions.

Table 3. Initial concentrations.
2.6 Numerical method
In the simulations, the normalized equations (Equations 1, 2) are solved using the Fastest Fourier Transform in the West (FFTW) library, combined with a semi-explicit numerical scheme (Chen and Shen, 1998). To model Ag precipitation, a nucleation algorithm is employed in which nuclei are introduced once the local Ag concentration exceeds a critical threshold. By solving these equations, the temporal and spatial evolution of the concentration fields,
3 Results
Using the model, we conducted a comprehensive parametric study to validate its predictive capabilities. To characterize the kinetics of Ag dissolution, we defined two key quantities:
In equations (Equations 23, 24), the denominator is the total amount of
3.1 Influence of Ag chemical potential at interfaces on dissolution behavior
The chemical potential of
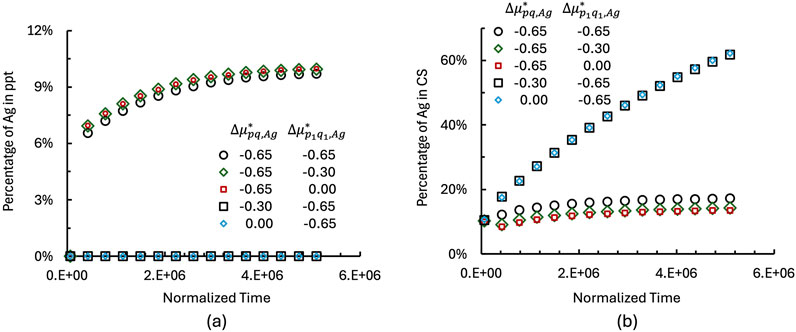
Figure 3. Temporal evolution of
As shown in Figure 3a, no Ag precipitates form at the AgM/CS interface when
In the simulations, it is assumed that the diffusivity of Ag and Ag+ in the Ag-rich layer or in the Ag precipitates decreases with increasing Ag concentration, as described by:
Here,
The sum of Ag in Ag precipitates and in CS represents the total dissolved Ag. For example, at a normalized time of 5,820,000, the amount of dissolved Ag reaches approximately 63% for the case where
Figures 4a,c present the distribution of the Ag concentration at a normalized time of 5,820,000 under different interfacial chemical potential conditions. In Figure 4a, a high Ag concentration is observed at the interface between AgM and CS when the interfacial chemical potential difference is set as
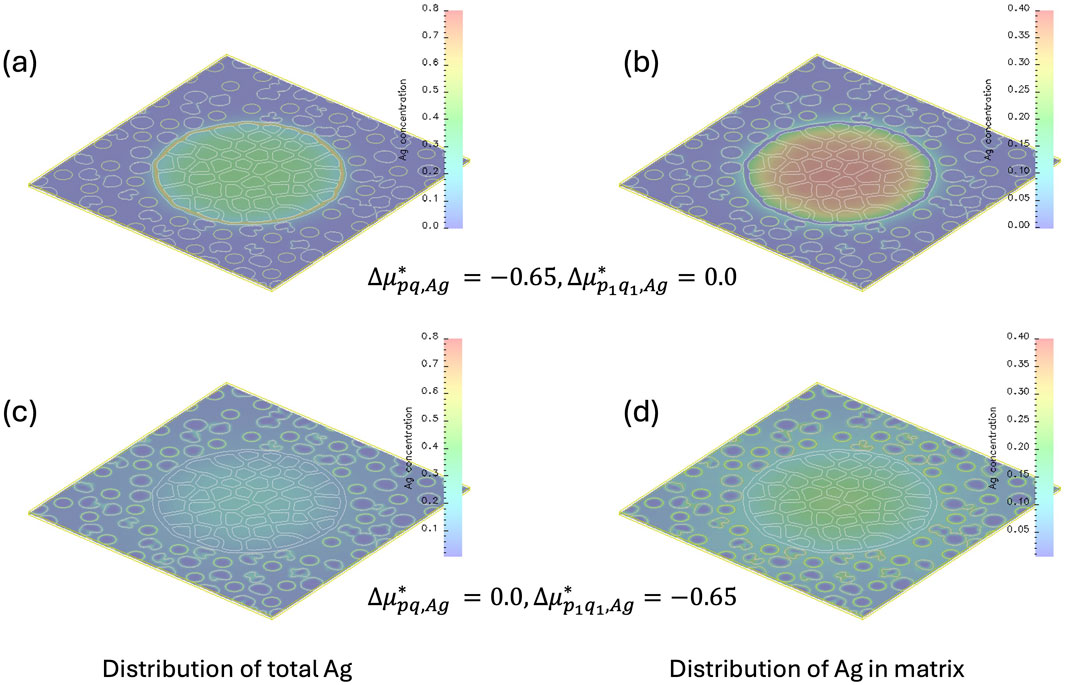
Figure 4. Distribution of Ag concentration within the Ag precipitate and CS matrix. Panels (a,b) correspond to the case where
To better visualize the distribution of Ag in the CS matrix, excluding the Ag precipitates, Figures 4b,d show the Ag concentration with values set to zero inside the Ag-rich precipitates. In Figure 4b, a diffusion field is visible within the CS matrix, but no Ag segregation is present at the FA/BFS/CS matrix interface due to
These results demonstrate that Ag distribution is highly sensitive to interfacial chemical potential conditions, as has been seen in experimental testing of AgM-CS sample compared with non-reducing formulation (Yamagata et al., 2022). The inhomogeneous chemical potential of Ag at the interfaces among AgM, BFS, FA, and CS leads to heterogeneous segregation and precipitation of Ag. This highlights the model’s ability to effectively capture the influence of interfacial chemical potential gradients on both the thermodynamic driving forces and kinetic processes governing Ag dissolution, segregation, and precipitation.
3.2 Influence of redox reaction rates on Ag dissolution
The redox reactions
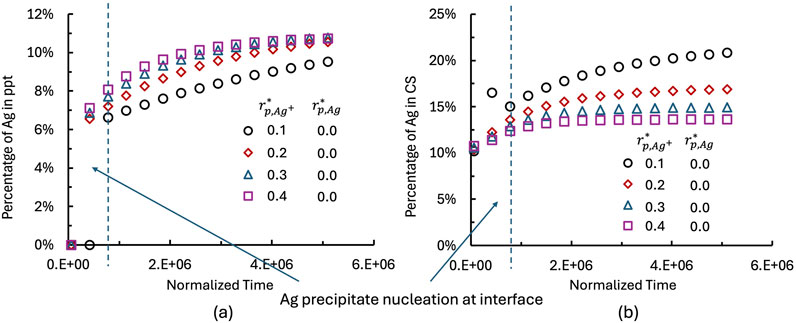
Figure 5. Effect of reaction rates on the temporal evolution of
When the reduction reaction rate is set to
In a purely diffusion-controlled process, Ag dissolution driven by a concentration gradient would lead to a dissolved Ag fraction that scales linearly with
Figure 6 presents the temporal evolution of
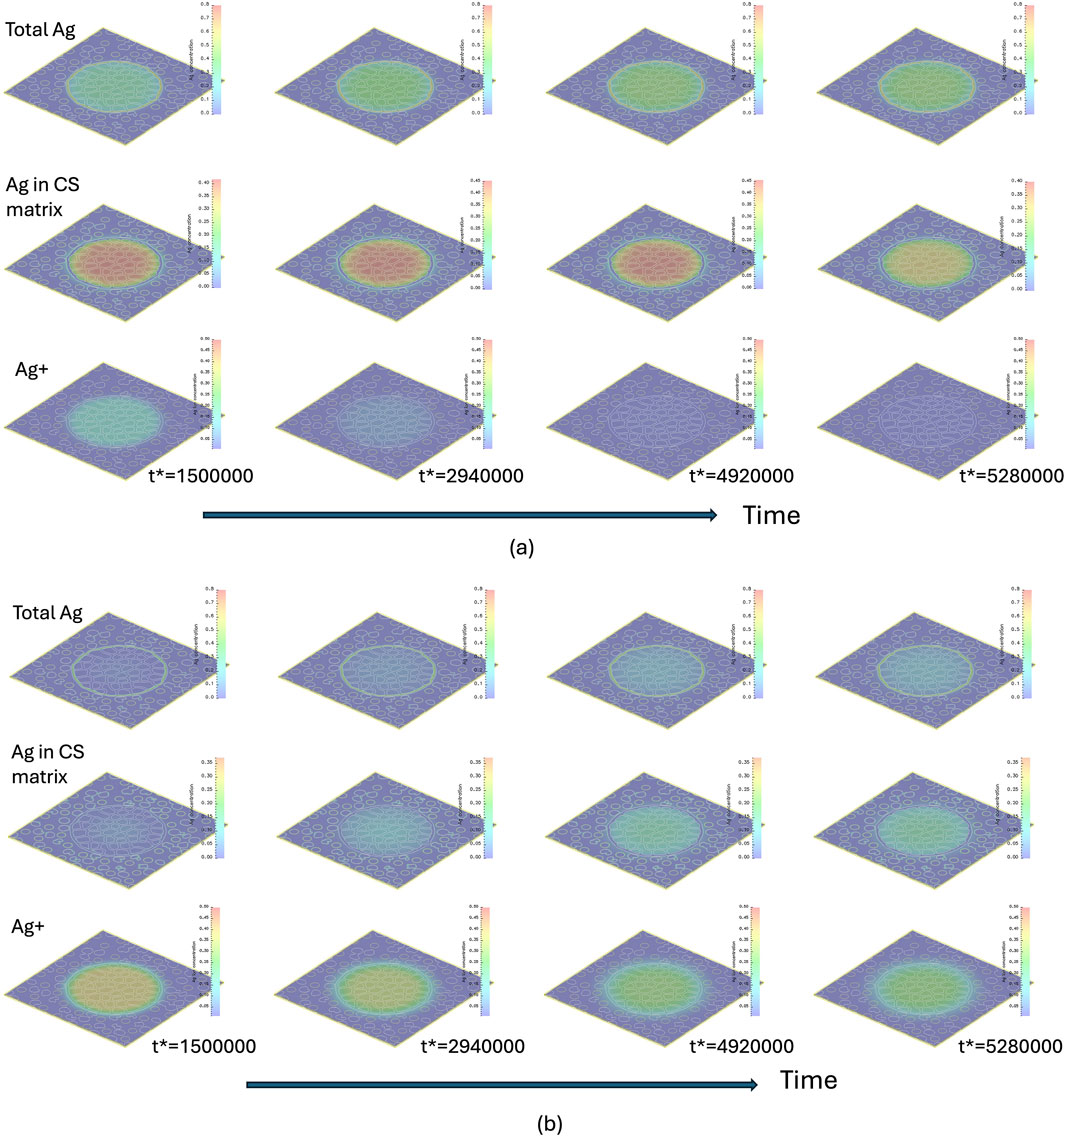
Figure 6. Temporal evolution of
The concentration profiles in Figure 6, along with the increased precipitation rate of Ag at early times in Figure 5a for
3.3 Effect of AgM particle size on Ag dissolution
The size of the AgM particle influences the diffusion length and kinetics of Ag dissolution. Figure 7 illustrates the effect of AgM particle size on Ag dissolution behavior. The particle radius
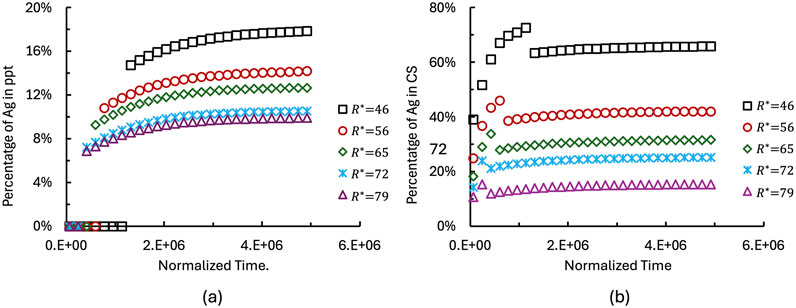
Figure 7. Effect of AgM particle size on the temporal evolution of
3.4 Effect of heterogeneous diffusivity on Ag dissolution behavior
The diffusivity of
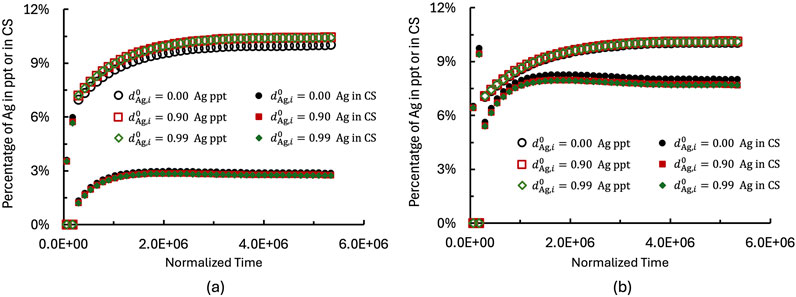
Figure 8. Effect of species diffusivity (
Compared to Figure 8a, the higher
Once the Ag-rich layer forms at the AgM/CS interface, however, it reduces Ag diffusivity as described in Equation 25, leading to Ag accumulation within the layer and a suppressed Ag flux across it. As shown in Figure 8a, Ag accumulation within the layer becomes more sensitive to Ag dissolution into the CS matrix as
Analysis of Ag and Ag+ content evolution in the CS matrix reveals that Ag+ dissolution dominates the overall kinetics. Overtime, the dissolution kinetics slows down and gradually approaches equilibrium, with the dissolution rate tending toward zero. This behavior is attributed to the formation and growth of an Ag-rich layer, which block the PW diffusion, reduces the chemical gradient and lowers both reaction rates and overall driving force for species transport.
Comparing Figure 8a with Figure 8b demonstrates that 1) increased diffusivity in meso- and macro-pores enhances Ag dissolution into the CS matrix prior to Ag rich layer formation; 2) the diffusivity of species in Ag rich layer has only a minor effect on the dissolution kinetics, even when reduced by nearly two orders of magnitude (from
These findings underscore the importance of species-specific diffusivities and redox reaction rates in governing dissolution behavior, which depends critically on the dominant flux pathways of each species.
3.5 Effect of Ag retention within BFS on Ag dissolution
In cementitious systems such as CS (comprising BFS, FA, and OPC), the PW typically exhibits high alkalinity (pH ∼12–13) and reducing conditions (low Eh). Under such conditions,
In the model, the reduction of
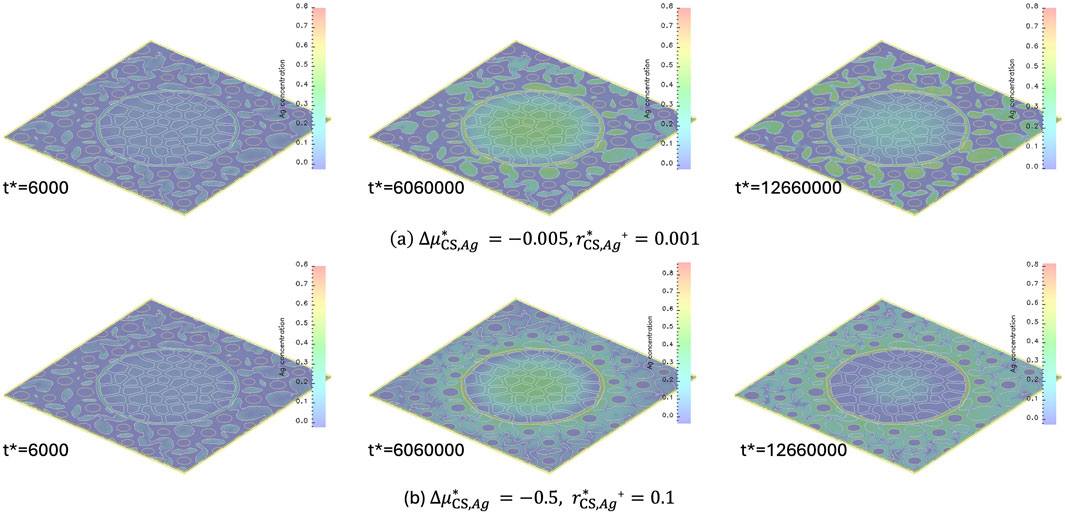
Figure 9. Temporal and spatial evolution of Ag concentration. (a)
Increasing
The Ag concentration profiles in Figure 9 highlight the role of phase-specific chemical potential and reduction kinetics in determining Ag segregation and retention. Variations of these properties among FA, BFS, and OPC significantly influence the spatial distribution and immobilization of Ag within the CS matrix.
Figure 10 shows the temporal evolution of
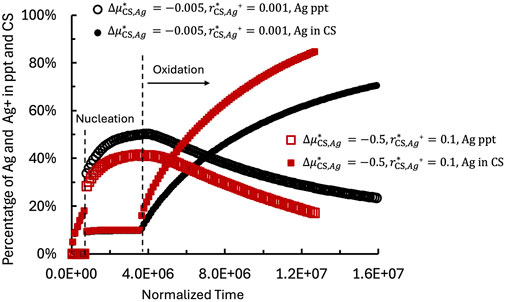
Figure 10. Temporal evolution of
According to Equation 15, the dissolution of Ag precipitates occurs when the local Ag concentration at the Ag precipitate/CS interface (
During the growth of Ag precipitates, the Ag concentration at the precipitate/CS interface continues to increase. Once it exceeds the critical concentration
Comparison of the two modeled cases reveals that the system with
These results demonstrate that the oxidation reaction facilitates Ag dissolution by increasing the retention capacity of BFS and the CS matrix and accelerating the transport of Ag species from the source.
4 Conclusion
In this work, a mesoscale model was developed to describe Ag dissolution in a CS cementitious waste form containing AgM particles. The model accounts for phase-dependent thermodynamic and kinetic properties and includes the following key capabilities:
1. For given microstructure features—such as the volume fractions and average particle sizes (and/or morphology) of BFS, FA, and OPC phases—the model can generate a three-dimensional microstructure to realistically represent the CS waste form.
2. It incorporates multiphysics processes, including: a) multispecies diffusion (
3. The model captures spatially heterogeneous thermodynamic behavior by incorporating microstructure-dependent chemical potentials and reaction energy barriers.
4. It also accounts for inhomogeneous kinetic properties, including microstructure-dependent diffusivities and reaction rates for different species and phases.
This mesoscale model was applied in a parametric study to explore the impact of microstructural and physicochemical properties on Ag dissolution. The key findings are as follows: 1) Formation of Ag-rich precipitates at the AgM/CS interface reduces both the chemical potential gradient within AgM particles and the diffusivity of species in Ag-rich precipitates. This effect slows down the overall dissolution kinetics of Ag; 2) The oxidation reaction accelerates Ag dissolution by enhancing Ag retention in BFS and OPC phases and increasing the transport flux of Ag species from the AgM source; and 3) Particle size significantly affects dissolution rates: smaller AgM particles exhibit faster dissolution kinetics under equivalent thermodynamic and kinetic conditions, due to shorter diffusion paths and higher surface area.
These parametric studies demonstrate the mesoscale model enables quantitative assessment of how microstructure, thermodynamics, and kinetics influence Ag dissolution behavior. However, for predictive modeling of real systems, it is essential to link model parameters to experimentally determined thermodynamic and kinetic properties.
Geochemical speciation models have been widely used to study the performance of nuclear waste forms in macroscale. The thermodynamic and kinetic data from such models can inform parameter selection in the mesoscale framework. Moreover, local outputs from geochemical modeling—such as pH, Eh, and species concentrations—can serve as boundary conditions for mesoscale simulations.
Future work will focus on coupling mesoscale and macroscale approaches to address critical questions: When do mean-field models fail in heterogeneous materials? When are microstructure-dependent corrections essential for accurate macroscale predictions? How do mean-field models predict the migration of other contaminants and radionuclides? Answering these questions will enable improved multiscale modeling of nuclear waste forms, enhancing confidence in long-term performance assessments.
Data availability statement
Data will be made available upon request to the authors.
Author contributions
SH: Conceptualization, Methodology, Formal Analysis, Writing – review and editing, Writing – original draft. YL: Writing – review and editing, Validation, Data curation, Investigation, Software. RA: Project administration, Funding acquisition, Resources, Writing – review and editing, Conceptualization.
Funding
The authors declare that financial support was received for the research and/or publication of this article. This work was supported by the U.S. Department of Energy, the Network of National Laboratories for Environmental Management and Stewardship (NNLEMS) funding program. Pacific Northwest National Laboratory is a multiprogram national laboratory operated by Battelle Memorial Institute for the U.S. Department of Energy under DE-AC05-76RL01830. Computations were performed on the Deception cluster at Pacific Northwest National Laboratory.
Conflict of interest
The authors declare that the research was conducted in the absence of any commercial or financial relationships that could be construed as a potential conflict of interest.
Generative AI statement
The authors declare that no Generative AI was used in the creation of this manuscript.
Any alternative text (alt text) provided alongside figures in this article has been generated by Frontiers with the support of artificial intelligence and reasonable efforts have been made to ensure accuracy, including review by the authors wherever possible. If you identify any issues, please contact us.
Publisher’s note
All claims expressed in this article are solely those of the authors and do not necessarily represent those of their affiliated organizations, or those of the publisher, the editors and the reviewers. Any product that may be evaluated in this article, or claim that may be made by its manufacturer, is not guaranteed or endorsed by the publisher.
References
Allen, S. M., and Cahn, J. W. (1979). A microscopic theory for antiphase boundary motion and its application to antiphase domain coarsening. Acta Metall. 27, 1085–1095. doi:10.1016/0001-6160(79)90196-2
Arnold, J., Duddu, R., Brown, K., and Kosson, D. S. (2017). Influence of multi-species solute transport on modeling of hydrated Portland cement leaching in strong nitrate solutions. Cem. Concr. Res. 100, 227–244. doi:10.1016/j.cemconres.2017.06.002
Asmussen, R., Rod, K., Saslow, S., Lonergan, C., Neeway, J., Johnson, B., et al. (2020). Development and characterization of cementitious waste forms for immobilization of granular activated carbon, silver mordenite, and HEPA filter media solid secondary waste. PNNL-28545.
Cahn, J. W. (1961). On spinodal decomposition. Acta Metall. 9, 795–801. doi:10.1016/0001-6160(61)90182-1
Cantrell, K., Jh Westsik, J., Serne, R., Um, W., and Cozzi, A. (2016). Secondary waste cementitious waste form data package for the integrated disposal facility performance assessment.
Chen, L. Q., and Shen, J. (1998). Applications of semi-implicit Fourier-spectral method to phase field equations. Comput. Phys. Commun. 108, 147–158. doi:10.1016/s0010-4655(97)00115-x
Chen, Z., Zhang, P., Brown, K. G., Branch, J. L., VAN DER Sloot, H. A., Meeussen, J. C. L., et al. (2021). Development of a geochemical speciation model for use in evaluating leaching from a cementitious radioactive waste form. Environ. Sci. and Technol. 55, 8642–8653. doi:10.1021/acs.est.0c06227
Chen, Z., Zhang, P., Brown, K. G., VAN DER Sloot, H. A., Meeussen, J. C. L., Garrabrants, A. C., et al. (2023a). Evaluating the impact of drying on leaching from a solidified/stabilized waste using a monolithic diffusion model. Waste Manag. 165, 27–39. doi:10.1016/j.wasman.2023.04.011
Chen, Z., Zhang, P., Brown, K. G., VAN DER Sloot, H. A., Meeussen, J. C. L., Garrabrants, A. C., et al. (2023b). Impact of oxidation and carbonation on the release rates of iodine, selenium, technetium, and nitrogen from a cementitious waste form. J. Hazard. Mater. 449, 131004. doi:10.1016/j.jhazmat.2023.131004
Emmanuel, S., and Berkowitz, B. (2007). Effects of pore-size controlled solubility on reactive transport in heterogeneous rock. Geophys. Res. Lett. 34. doi:10.1029/2006gl028962
Emmanuel, S., Ague, J. J., and Walderhaug, O. (2010). Interfacial energy effects and the evolution of pore size distributions during quartz precipitation in sandstone. Geochimica Cosmochimica Acta 74, 3539–3552. doi:10.1016/j.gca.2010.03.019
Fang, Y., Yeh, G.-T., and Burgos, W. D. (2003). A general paradigm to model reaction-based biogeochemical processes in batch systems. Water Resour. Res. 39. doi:10.1029/2002wr001694
Flach, G. P., Kaplan, D. I., Nichols, R. L., Seitz, R. R., and Serne, R. J. (2016). Solid secondary waste data package supporting hanford integrated disposal facility performance assessment. United States.
Fournier, M., Frugier, P., and Gin, S. (2018). Application of GRAAL model to the resumption of international simple glass alteration. npj Mater. Degrad. 2, 21. doi:10.1038/s41529-018-0043-4
Frugier, P., Gin, S., Minet, Y., Chave, T., Bonin, B., Godon, N., et al. (2008). SON68 nuclear glass dissolution kinetics: current state of knowledge and basis of the new GRAAL model. J. Nucl. Mater. 380, 8–21. doi:10.1016/j.jnucmat.2008.06.044
Inagaki, Y., Imamura, T., Idemitsu, K., Arima, T., Kato, O., Nishimura, T., et al. (2008). Aqueous dissolution of silver iodide and associated iodine release under reducing conditions with FeCl2 solution. J. Nucl. Sci. Technol. 45, 859–866. doi:10.3327/jnst.45.859
Jennings, H. M., Thomas, J. J., Rothstein, D., and Chen, J. J. (2002). “Cements as porous materials,” in Handbook of porous solids.
Kim, S. G. (2007). A phase-field model with antitrapping current for multicomponent alloys with arbitrary thermodynamic properties. Acta Mater 55, 4391–4399. doi:10.1016/j.actamat.2007.04.004
Kim, S. G., Kim, W. T., and Suzuki, T. (1999). Phase-field model for binary alloys. Phys. Rev. E 60, 7186–7197. doi:10.1103/physreve.60.7186
Lee, K. P., and Site, H. (2018). Performance assessment for the integrated disposal facility. Washington: Washington River Protection Solutions, INTERA Inc.
Li, D., Kaplan, D. I., Price, K. A., Seaman, J. C., Roberts, K., Xu, C., et al. (2019). Iodine immobilization by silver-impregnated granular activated carbon in cementitious systems. J. Environ. Radioact. 208-209, 106017. doi:10.1016/j.jenvrad.2019.106017
Li, Y., Hu, S., Hilty, F. W., Montgomery, R., Park, K. C., Martin, C. R., et al. (2022a). Leaching model of radionuclides in metal-organic framework particles. Comput. Mater. Sci. 201, 110886. doi:10.1016/j.commatsci.2021.110886
Li, Y., Hu, S., Montgomery, R., Grandjean, A., Besmann, T., and Loye, H.-C. Z. (2022b). Effect of charge and anisotropic diffusivity on ion exchange kinetics in nuclear waste form materials. J. Nucl. Mater. 572, 154077. doi:10.1016/j.jnucmat.2022.154077
Liu, S., and Jacques, D. (2017). Coupled reactive transport model study of pore size effects on solubility during cement-bicarbonate water interaction. Chem. Geol. 466, 588–599. doi:10.1016/j.chemgeo.2017.07.008
Moelans, N. (2011). A quantitative and thermodynamically consistent phase-field interpolation function for multi-phase systems. Acta Mater. 59, 1077–1086. doi:10.1016/j.actamat.2010.10.038
Moelans, N., Blanpain, B., and Wollants, P. (2008). Quantitative analysis of grain boundary properties in a generalized phase field model for grain growth in anisotropic systems. Phys. Rev. B 78, 024113. doi:10.1103/physrevb.78.024113
Thomas, G. F. (1987). Diffusional release of a single component material from a finite cylindrical waste form. Ann. Nucl. Energy 14, 283–294. doi:10.1016/0306-4549(87)90131-9
VAN De Walle, A., and Ceder, G. (2002). Automating first-principles phase diagram calculations. J. Phase Equilibria 23, 348–359. doi:10.1361/105497102770331596
Westsik, J. J. H., Serne, R. J., Pierce, E. M., Cozzi, A. D., Chung, C., and Swanberg, D. J. (2013). Supplemental immobilization cast stone technology development and waste form qualification testing plan PNNL.
Keywords: silver dissolution, Cast Stone, mesoscale modeling, microstructure effects, and nuclear waste forms
Citation: Hu S, Li Y and Asmussen RM (2025) Mesoscale phase-field modeling of silver dissolution in Cast Stone with AgM granules. Front. Nucl. Eng. 4:1693242. doi: 10.3389/fnuen.2025.1693242
Received: 26 August 2025; Accepted: 16 October 2025;
Published: 24 November 2025.
Edited by:
Yuankai Yang, Forschungszentrum Juelich, GermanyReviewed by:
Sajid Iqbal, Korea Advanced Institute of Science and Technology (KAIST), Republic of KoreaTao Wu, Huzhou University, China
Copyright © 2025 Hu, Li and Asmussen. This is an open-access article distributed under the terms of the Creative Commons Attribution License (CC BY). The use, distribution or reproduction in other forums is permitted, provided the original author(s) and the copyright owner(s) are credited and that the original publication in this journal is cited, in accordance with accepted academic practice. No use, distribution or reproduction is permitted which does not comply with these terms.
*Correspondence: Shenyang Hu, U2hlbnlhbmcuaHVAcG5ubC5nb3Y=