 Maria Cristina Savastano1,2‡
 Claudia Fossataro1,2*†‡Matteo Mario Carlà1,2Chiara Fantozzi1,2
 Benedetto Falsini1,2
 Alfonso Savastano1,2Clara Rizzo3Raphael Kilian3Stanislao Rizzo1,2,4
- 1Ophthalmology Unit, Fondazione Policlinico A. Gemelli, IRCCS, Rome, Italy
- 2Ophthalmology Unit, Università Cattolica del Sacro Cuore, Rome, Italy
- 3Ophthalmology Unit, University of Verona, Verona, Italy
- 4Consiglio Nazionale della Ricerca (CNR), Istituto di Neuroscienze, Pisa, Italy
Objectives: To analyze the choriocapillaris vessel density (CVD) of eyes at different stages of Age-related Macular Degeneration (AMD) with Optical Coherence Tomography Angiography (OCTA).
Methods: This is a prospective observational cross-sectional study on 21 age-matched healthy eyes and 84 eyes with AMD (i.e., early AMD, late AMD, Geographic Atrophy [GA], and disciform scar AMD). OCTA was used to automatically measure the CVD (%), on both the whole macula and the foveal area, in a layer going from 9 µm above to 30 µm below the Bruch’s membrane. Furthermore, in the GA subgroup, the extension of the Ellipsoid Zone (EZ) interruption and the area of macular chorio-retinal atrophy was analyzed.
Results: Macular CVD was significantly lower in the GA, late AMD and disciform scar AMD-subgroups compared to controls (respectively, p=0.0052; p<0.0001; p=0.0003), whereas it did not significantly vary in the early AMD group (p=0.86). A significant difference between the early AMD and both the late AMD and the disciform scar AMD subgroups was also found (p=0.0009 and 0.0095, respectively). When comparing the foveal CVD of healthy and AMD eyes, a significant difference was found with every AMD subgroup (early AMD, p=0.011; GA, p<0.0001; late AMD, p<0.0001; disciform scar AMD, p<0.0001). Furthermore, in the GA subgroup, the CVD had an inverse correlation with both the extension of the EZ-interruption (p=0.012) and with the calculated chorio-retinal atrophic area (p=0.009).
Conclusions: OCTA could play a crucial role in the categorization of AMD, allowing for the evaluation of gradual flow impairment at different stages of the disease. Moreover, the detection of a decreased macular and foveal CVD may shed light on the pathogenesis of AMD.
Introduction
Age-related macular degeneration (AMD) is the most prevalent cause of permanent visual loss in the elderly (1). The recent introduction of Optical Coherence Tomography Angiography (OCTA) has allowed to deepen our understanding of the retinal vasculature and its pathological changes, shedding light on the pathogenesis of many retinal vascular diseases, such as AMD. By Employing OCTA, retinal specialists are able to detect choroidal neo-vascularizations (CNVs), and to analyze their architecture as well as their response to anti vascular endothelial growth factor (anti-VEGF) intravitreal injections (2–5).
Several metabolic factors and cytokines, whose release seems to be promoted by an increased distress of the retinal pigment epithelium (RPE), are involved in the origin of macular neovascularization (MNV) in AMD (6). The role of the choroid and particularly the choriocapillaris (CC) in the pathophysiology of AMD is still controversial. From clinical and histological investigations, it seems like choroidal changes and choroidal vascular impairment are linked to the emergence and progression of both dry and exudative AMD (7, 8). Even though these vascular modifications have been clearly implicated in geographic atrophy (9–12), evidence of their correlation with the onset of MNV are still limited. Particularly, there is still debate on whether the origin of AMD has to be found in the RPE or in the CC (7). Nonetheless, what has already been demonstrated, is a decrease in CC blood flow with aging. The latter is probably due to repeated oxidative stress leading to retinal ischemia. The sequence of these events appears to play a major role in the origin of AMD (8–10).
With the advent of OCTA, CC blood flow can be studied in detail in order to understand its role in the pathogenesis of different forms of AMD. OCTA findings are even more relevant when considering that it is actually the onset of neovascularization (i.e., neovascular exudative AMD - NE-AMD) to be the most challenging issue to be faced in MNV patients. Friedman, who provided the first hemodynamic model of AMD, hypothesized that scleral stiffening could be the cause of an impaired choroidal blood flow, which in turn resulted in RPE damage and drusen production (13). Indeed, previews angiographic and histopathologic investigations have already shown a reduced choroidal blood flow in AMD eyes (14–17). Moreover, supporting the idea of macular hypoperfusion, recent studies have reported lower choriocapillaris density on OCTA across a whole range of AMD phenotypes (18–24). Choriocapillaris loss has also already been linked to drusen and geographic atrophy (GA) progression (12, 25, 26).
The aim of the study was to evaluate the choriocapillaris vessel density (CVD) of eyes at different stages of AMD and to compare it with sex- and age-matched healthy controls, in order to understand how choriocapillaris vascular network is affected along the progression of the disease. The secondary aim was to assess the possible correlation between the size of macular chorio-retinal atrophy in patients affected by dry AMD and the decrease in CVD.
Materials and methods
We conducted a prospective observational cross-sectional study including 5 subgroups that were classified as follows: healthy controls over 70 years of age, early – AMD, Geographic Atrophy (GA), late AMD under treatment with anti-VEGF intravitreal injections, and disciform scar AMD.
The study was conducted at the Fondazione Policlinico Universitario Agostino Gemelli, IRCCS, in Rome, Italy from September 2021 to January 2022. The study adhered to the tenets of the Declaration of Helsinki and was approved by Catholic University of the Sacred Heart Ethical Committee in Rome, Italy (ID number: 3860). An informed and written consent was obtained from all enrolled patients. All participants received a comprehensive ophthalmic examination which included the measurement of the best corrected visual acuity (BCVA) according to the Early Treatment for Diabetic Retinopathy Study (ETDRS) (BCVA was converted into LogMAR scale for statistical analysis), slit-lamp biomicroscopy, a dilated funduscopic examination, SD-OCT (Spectral Domain – Optical Coherence Tomography) and OCTA (Solix full – range OCT, Optovue Inc, Freemont CA, USA).
Patients
This study included patients affected by dry (non-exudative) or wet (exudative) AMD (d-AMD and w-AMD, respectively) and a healthy control group. Exclusion criteria were clinically significant lens opacities, SD-OCT or OCTA scans’ signal quality less than 7/10, systemic illnesses with ocular involvement, previous pars plana vitrectomy (PPV), concomitant vascular retinal diseases, congenital eye disorders, uveitis and myopia or hyperopia greater than 3.0 diopters (D).
Based on ophthalmoscopic and imaging examination, patients were classified as follows:
A) Healthy over-70 years of age group: healthy patients aged more than 70 years with no objective retinal diseases.
B) Stage I and II age-related maculopathy group (early AMD group): patients with confirmed diagnosis of AMD and possible mild vision loss. Fundoscopy and imaging evaluation may show medium-sized drusen (≥ 63 - <125 μm), in the absence of pigmentary abnormalities (stage I) or one large druse n (≥ 125 μm) with possible pigmentary abnormalities (stage II) (27).
C) Geographic Atrophy (GA) group: patients at late stage of macular degeneration and severe vision loss showing on fundoscopy and imaging evaluation a localized sharply demarcated atrophy of the outer retinal tissue layers, retinal pigment epithelium and choriocapillaris.
D) Late AMD group: patients who had developed an MNV associated with signs of activity (i.e., intra-retinal, sub-retinal or sub-RPE fluid, dark halo, branching of MNV), still undergoing anti-VEGF intravitreal injections. According to clinical indication, we used the specific on label anti-VEGF agent, choosing between Bevacizumab, Ranibizumab, Aflibercept and Brolucizumab;
E) Disciform scar AMD group: patients with a previous history of chronic exudative AMD that evolved into a disciform scar due to retinal fibrosis. These patients had already suspended anti-VEGF intravitreal injections.
Inclusion criteria in each subgroup were evaluated by three expert ophthalmologists independently. If all three operators agreed, the patient was consequently assigned to a specific subgroup. Cohen coefficient analysis was used to ensure that the concordance was at least 0.90. Otherwise, the experts discussed the case and if a univocal choice could not be reached, the patient was excluded from the study.
Ultimately, in a post-hoc analysis we included a supplementary group of 21 healthy controls less than 70 years of age, to also assess whether a correlation between CVD and age may exist, even in healthy eyes.
Imaging protocol and acquired data
OCT and OCTA scans were performed using the Solix full-range OCT (Optovue Inc, Freemont, CA, USA), a new ultra-high-speed spectral domain device (version 2019 V1.0.0.317) that runs at 120.000 A-scans per second and uses the split spectrum amplitude-decorrelation angiography (SSADA) algorithm. Performing multiple B-scans in sequence, the software detects changes between each single scan which permits to identify the vasculature (28).
Before performing the exams, each eye was dilated with 1% Tropicamide drops. High-definition line B scans, passing horizontally and vertically through the fovea were obtained, as well as a fundus photography. The OCTA scan consisted of a 6.4x6.4 mm image focused on the fovea. The software adopts Motion Correction Technology, a unique post-processing technology that allows for genuine three-dimensional (3D) distortion correction in all directions for ultra-precise motion correction. Scans with a low-quality index (≤ 7/10) (e.g., significant lens opacities, frequent eye blinks, excessive movement artifacts) were rejected. Retinal features on OCT scans were evaluated to define the stage of AMD.
The CVD of the whole macular area and of the foveal area (in the fovea grid-based image), expressed in percentage, were analyzed in a customized layer set from 9 µm above to 30 µm below the Bruch’s Membrane, and calculated using the in-built software algorithm, as showed in Figure 1. Before processing the OCTA scans, two operators independently evaluated if the Bruch’s Membrane was correctly identified by the software. If the segmentation was not precise, the operator would have marked the layer manually.
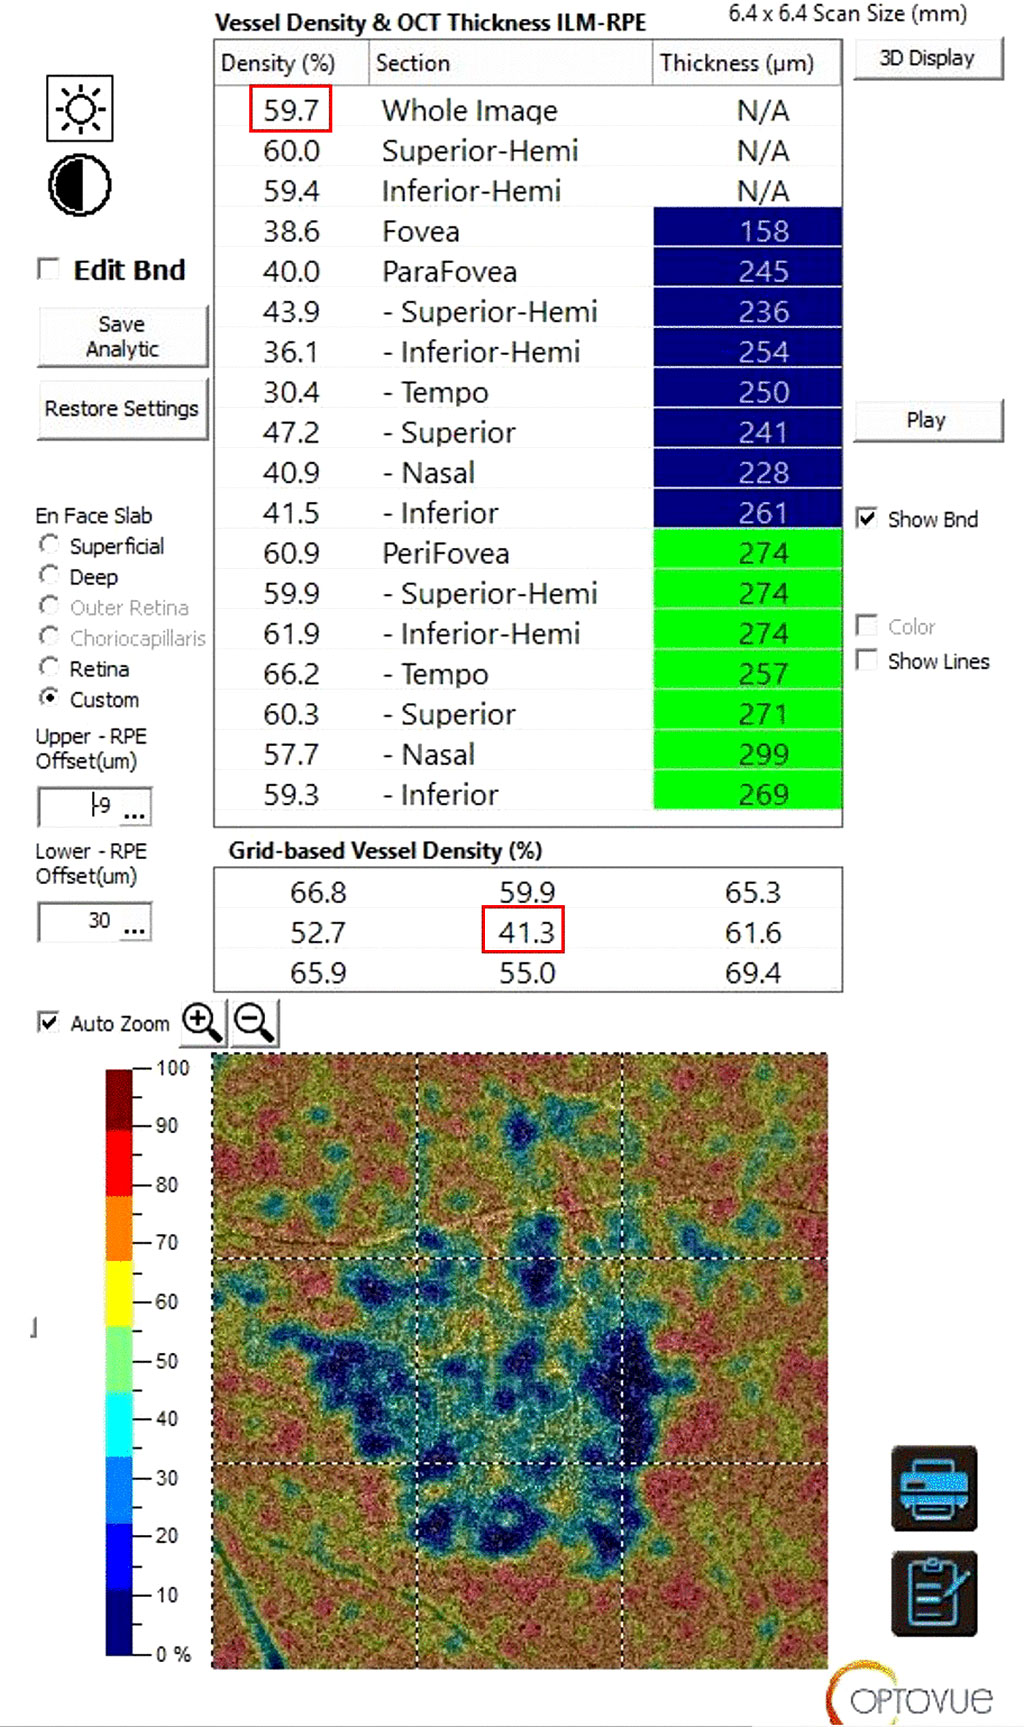
Figure 1 Sample of a Solix full-range OCTA analysis of the CVD using the in-built software algorithm. After setting a customized layer from 9 µm above to 30 µm below the Bruch’s Membrane the CVD of the whole macular area (highlighted by the upper red rectangle) and of the foveal only area (in the fovea grid-based image, highlighted by the lower red rectangle), expressed in percentage, were collected. OCTA, Optical Coherence Tomography Angiography; CVD, Choriocapillaris Vascular Density.
Additional analyses were conducted in the GA subgroup. Fovea-centered 6.4 mm horizontal B scans were collected in order to manually evaluate the extension (µm) of the Ellipsoid Zone (EZ) interruption via the built-in linear caliper tool. Additionally, we estimated the area of macular chorio-retinal atrophy, using the in-built image capture option for en-face 6.4x6.4 mm scans segmented at the RPE layer. Every scan capture was uploaded on ImageJ software (ImageJ 1.53k, National Institutes of Health, USA) and underwent an 8-bit conversion. Subsequently, the atrophic area was manually segmented and after putting the scale setting on 6.4x6.4 mm, the final value of the atrophic area (mm2) was calculated with the specific software tool (Figure 2).
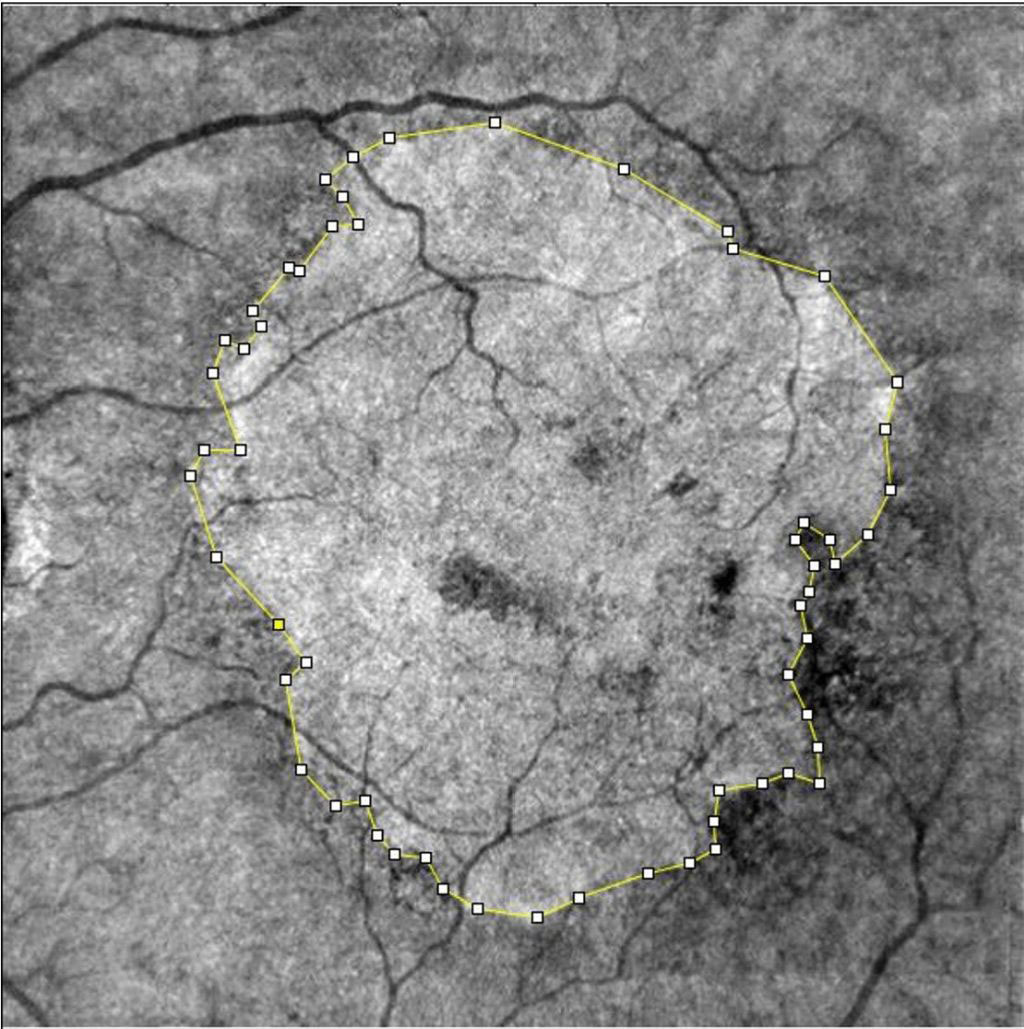
Figure 2 Sample of manual segmentation of a GA through ImageJ software tool. En-face images were exported from Solix full-range OCTA, after automatic segmentation at the retinal RPE. GA, Geographic Atrophy; OCTA, Optical Coherence Tomography Angiography; RPE, Retinal Pigmented Epithelium.
Statistical analysis
The sample size of each group was evaluated using the G-Power software package (Version 3.1.9.6). Assuming a minimum difference of 15%, a residual standard deviation of 10%, a power of 0.08 and an alpha of 0.05 to highlight the differences, the required smallest population size was 21 patients for each group. GraphPad PRISM Software (Version 9.0; GraphPad, La Jolla, CA) was used to analyze the resulting data. Shapiro-Wilk test was used to assess the normality of our sample, with p value > 0.05 set to verify the null hypothesis. We conducted an Analysis of Variance (ANOVA) and employed the Dunnett’s multiple comparison test to evaluate the differences in CVD amongst the various groups. Furthermore, a Tukey test, computing confidence intervals, was used to compare the difference between each pair of means. Finally, correlation and regression analyses were conducted for continuous variables. Quantitative values were expressed as mean ± SD and a p value <0.05 was considered statistically significant. A designated confidence interval (CI) of 95% was used.
Results
Hundred-and-five eyes of 105 patients were examined, 21 for each subgroup. Demographic characteristics of all subgroups are listed in Table 1. OCTA samples are shown in Figure 3.

Table 1 Demographic characteristics of all sub-groups.
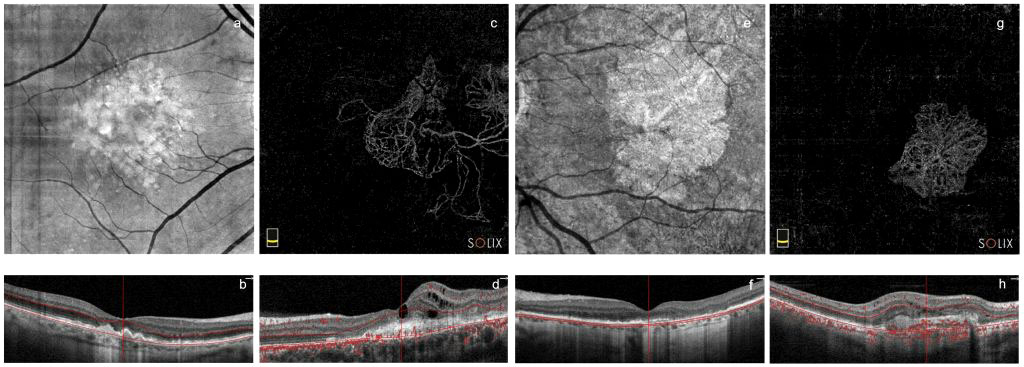
Figure 3 Sample images of every pathological subgroup from Solix full-range OCTA captures. En-face and B-scan images of early AMD group (A, B, respectively) and of the GA group (E, F, respectively). Outer retinal OCTA en-face images and B-scans showing MNVs and blood flow (red dots in B-scan images) in late AMD (C, D, respectively) and disciform scar AMD (G, H, respectively) groups. OCTA, Optical Coherence Tomography Angiography; MNVs, Macular Neo-Vascularizations; GA, Geographic Atrophy; AMD, age related macular degeneration.
Whole image CVD results
There was a statistically significant difference between the whole image-CVDs (i.e., entire macular area) of the exudative, geographic atrophy and disciform scar AMD groups, and the control group (p <0.001). Multiple comparison analysis showed statistically significant differences as follows: Healthy vs. GA (mean difference 5.44, CI 1.33 to 9.54, p=0.0052); Healthy vs. late AMD (mean difference 8.01, CI 3.90 to 12.10, p <0.0001); Healthy vs. disciform scar AMD (mean difference 6.83, CI 2.72 to 10.90, p=0.0003). No statistically significant difference was found in the Healthy vs. early AMD group comparison (mean difference 1.26, CI -2.85 to 5.36, p=0.86) (Figure 4). The post hoc Tukey test showed statistically significant differences between early AMD and both late and disciform scar AMD groups (mean differences 6.75 and 5.57, CI 2.34 to 11.16 and 1.16 to 9.80, with p values to be 0.0009 and 0.0095, respectively). None of the other pairwise comparisons among subgroups showed statistically significant differences.
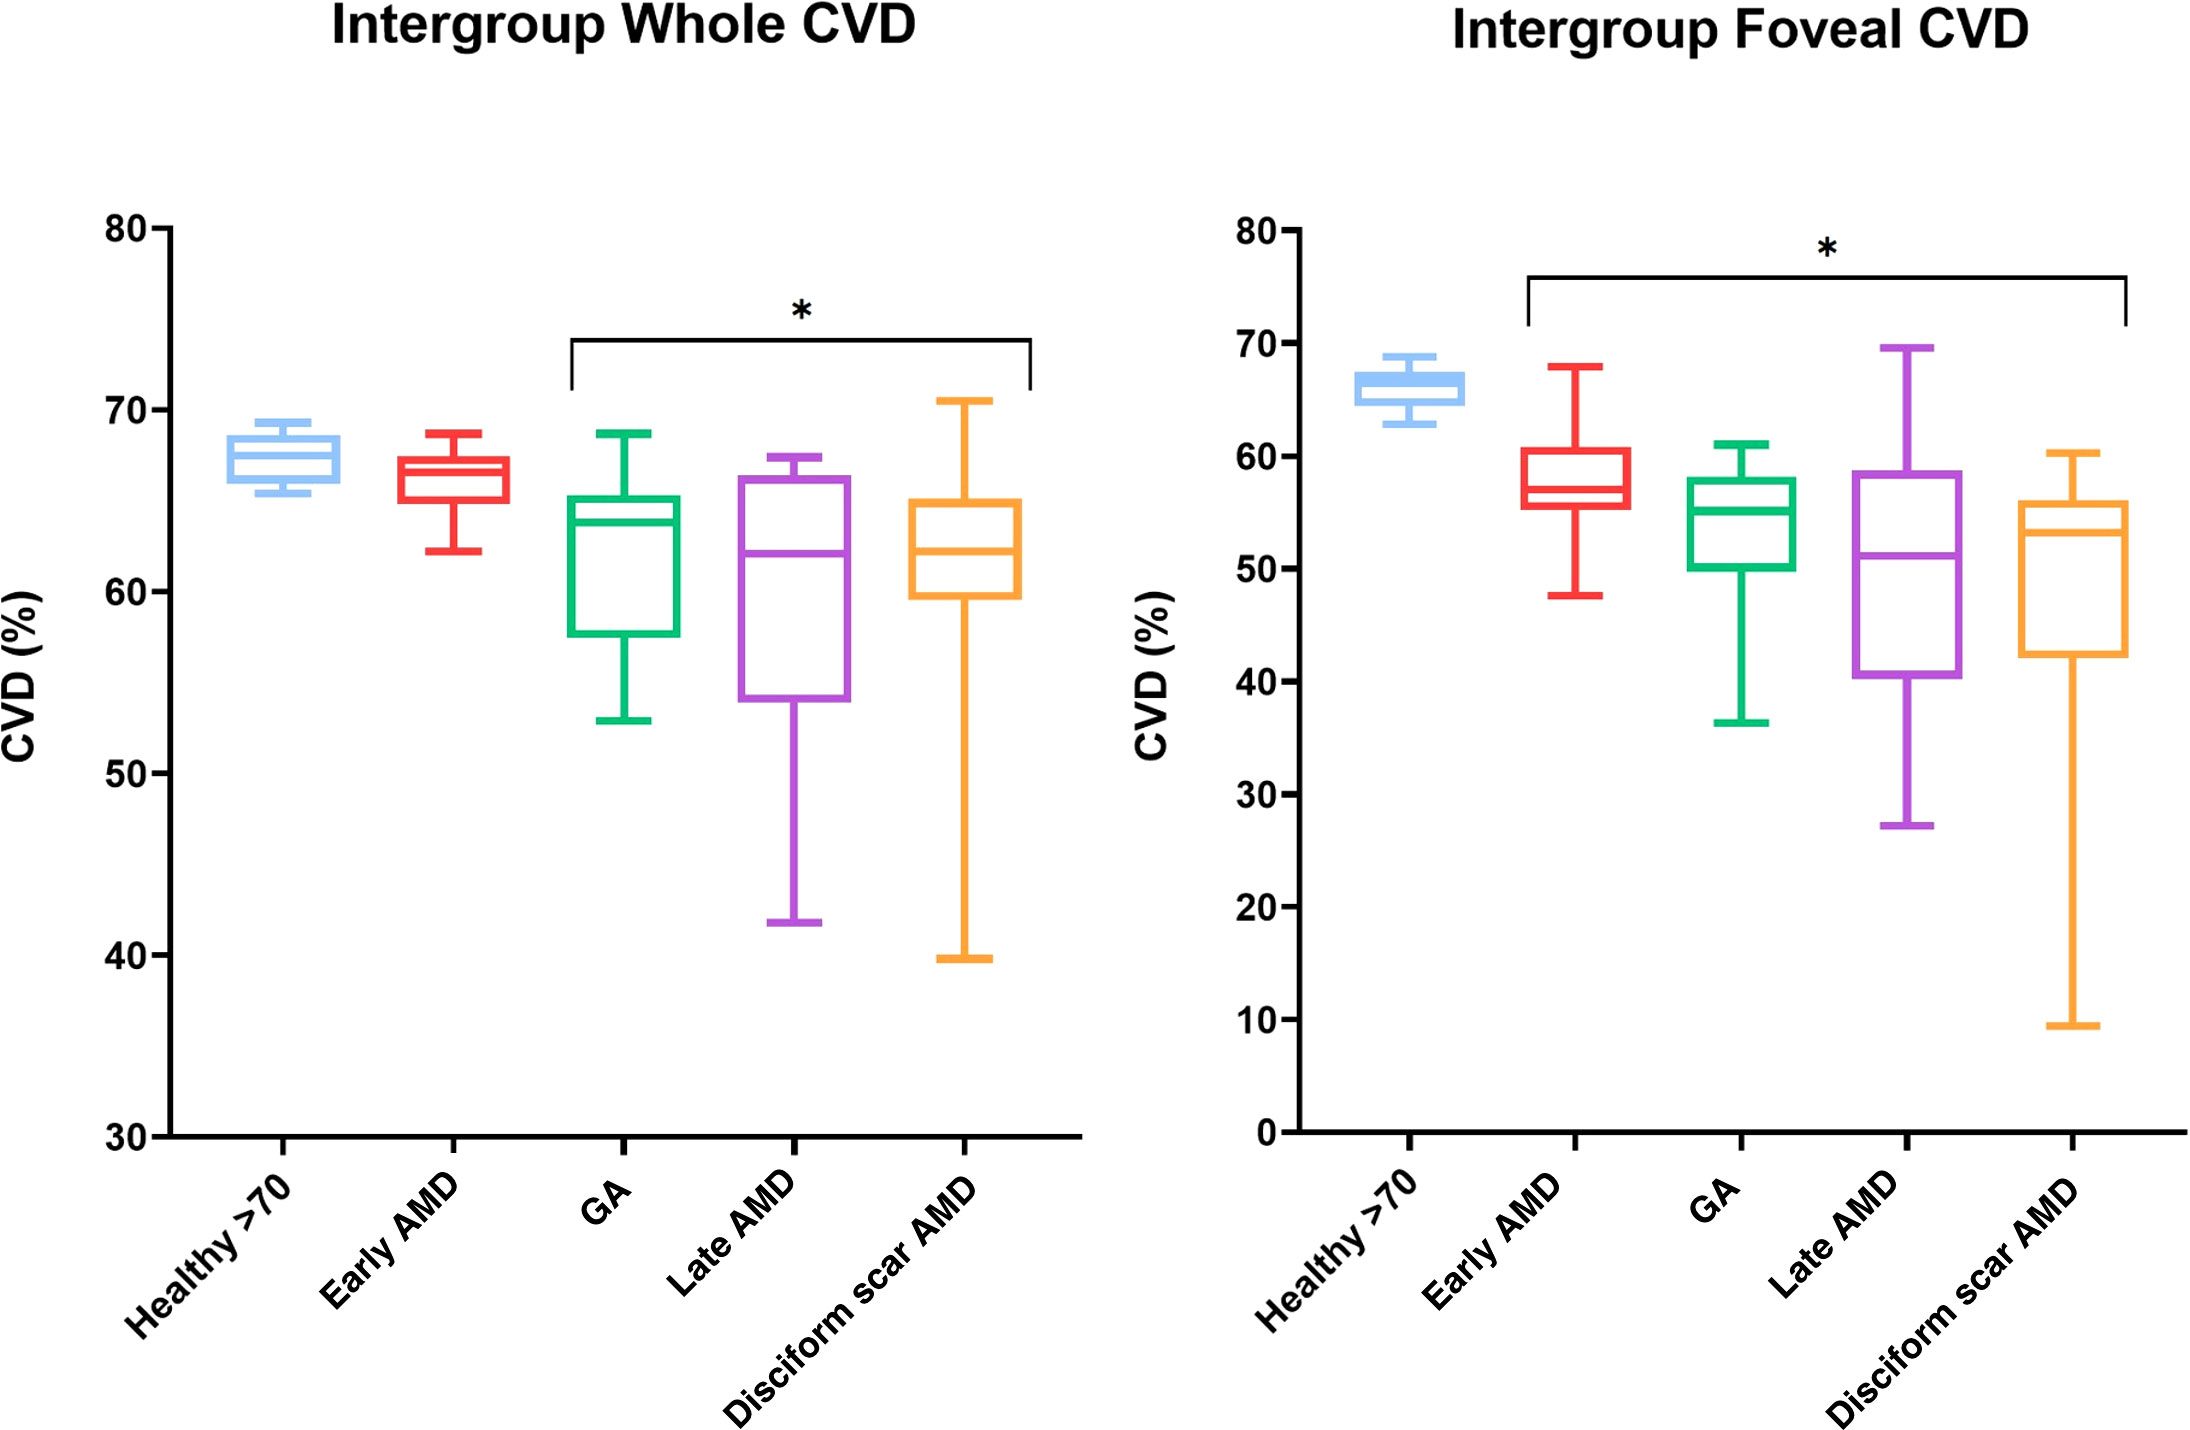
Figure 4 Box and whiskers graphs showing both whole macular and foveal area CVD variations among subgroups with min-to-max values. Asterisks* highlighting statistically significant differences when compared with healthy over 70 years-old subjects. CVD, Choriocapillaris Vascular Density; GA, Geographic Atrophy; AMD, age related macular degeneration.
Foveal grid-based CVD results
The ANOVA test confirmed a statistically significant difference between healthy and AMD groups (p <0.0001). Multiple comparison analyses showed statistical validity when comparing Healthy controls to all of the pathological subgroups: Healthy vs. early AMD (mean difference 7.80, CI 1.46 to 14.14, p=0.011); Healthy vs. GA (mean difference 13.20, CI 6.85 to 19.54, p<0.0001); Healthy vs. late AMD (mean difference 16.40, CI 10.05 to 22.74, p<0.0001); Healthy vs. disciform scar AMD (mean difference: 17.07, CI 10.72 to 23.41, p<0.0001) (Figure 4). Tukey’s multiple comparisons test was conducted among all pathological subgroups, showing no statistically significant difference among the pathologic subgroups, with the exception of the early AMD vs. late AMD and disciform scar AMD comparison (mean differences 8.60 and 9.27, CI 1.81 to 15.39 and 2.48 to 16.06, with p=0.0095 and p=0.0041, respectively).
An overview on CVDs’ data among all subgroups is available in Table 2, whereas heat maps of the various CVD values are presented in Figure 5.
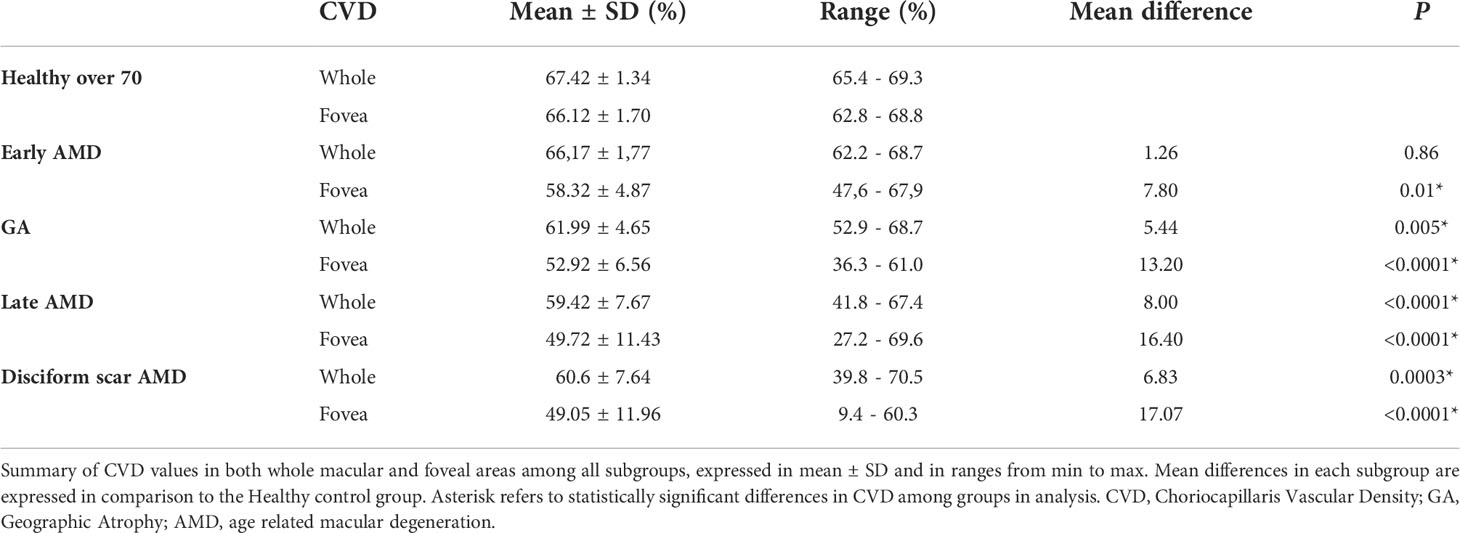
Table 2 Choriocapillaris vascular density among all sub-groups.
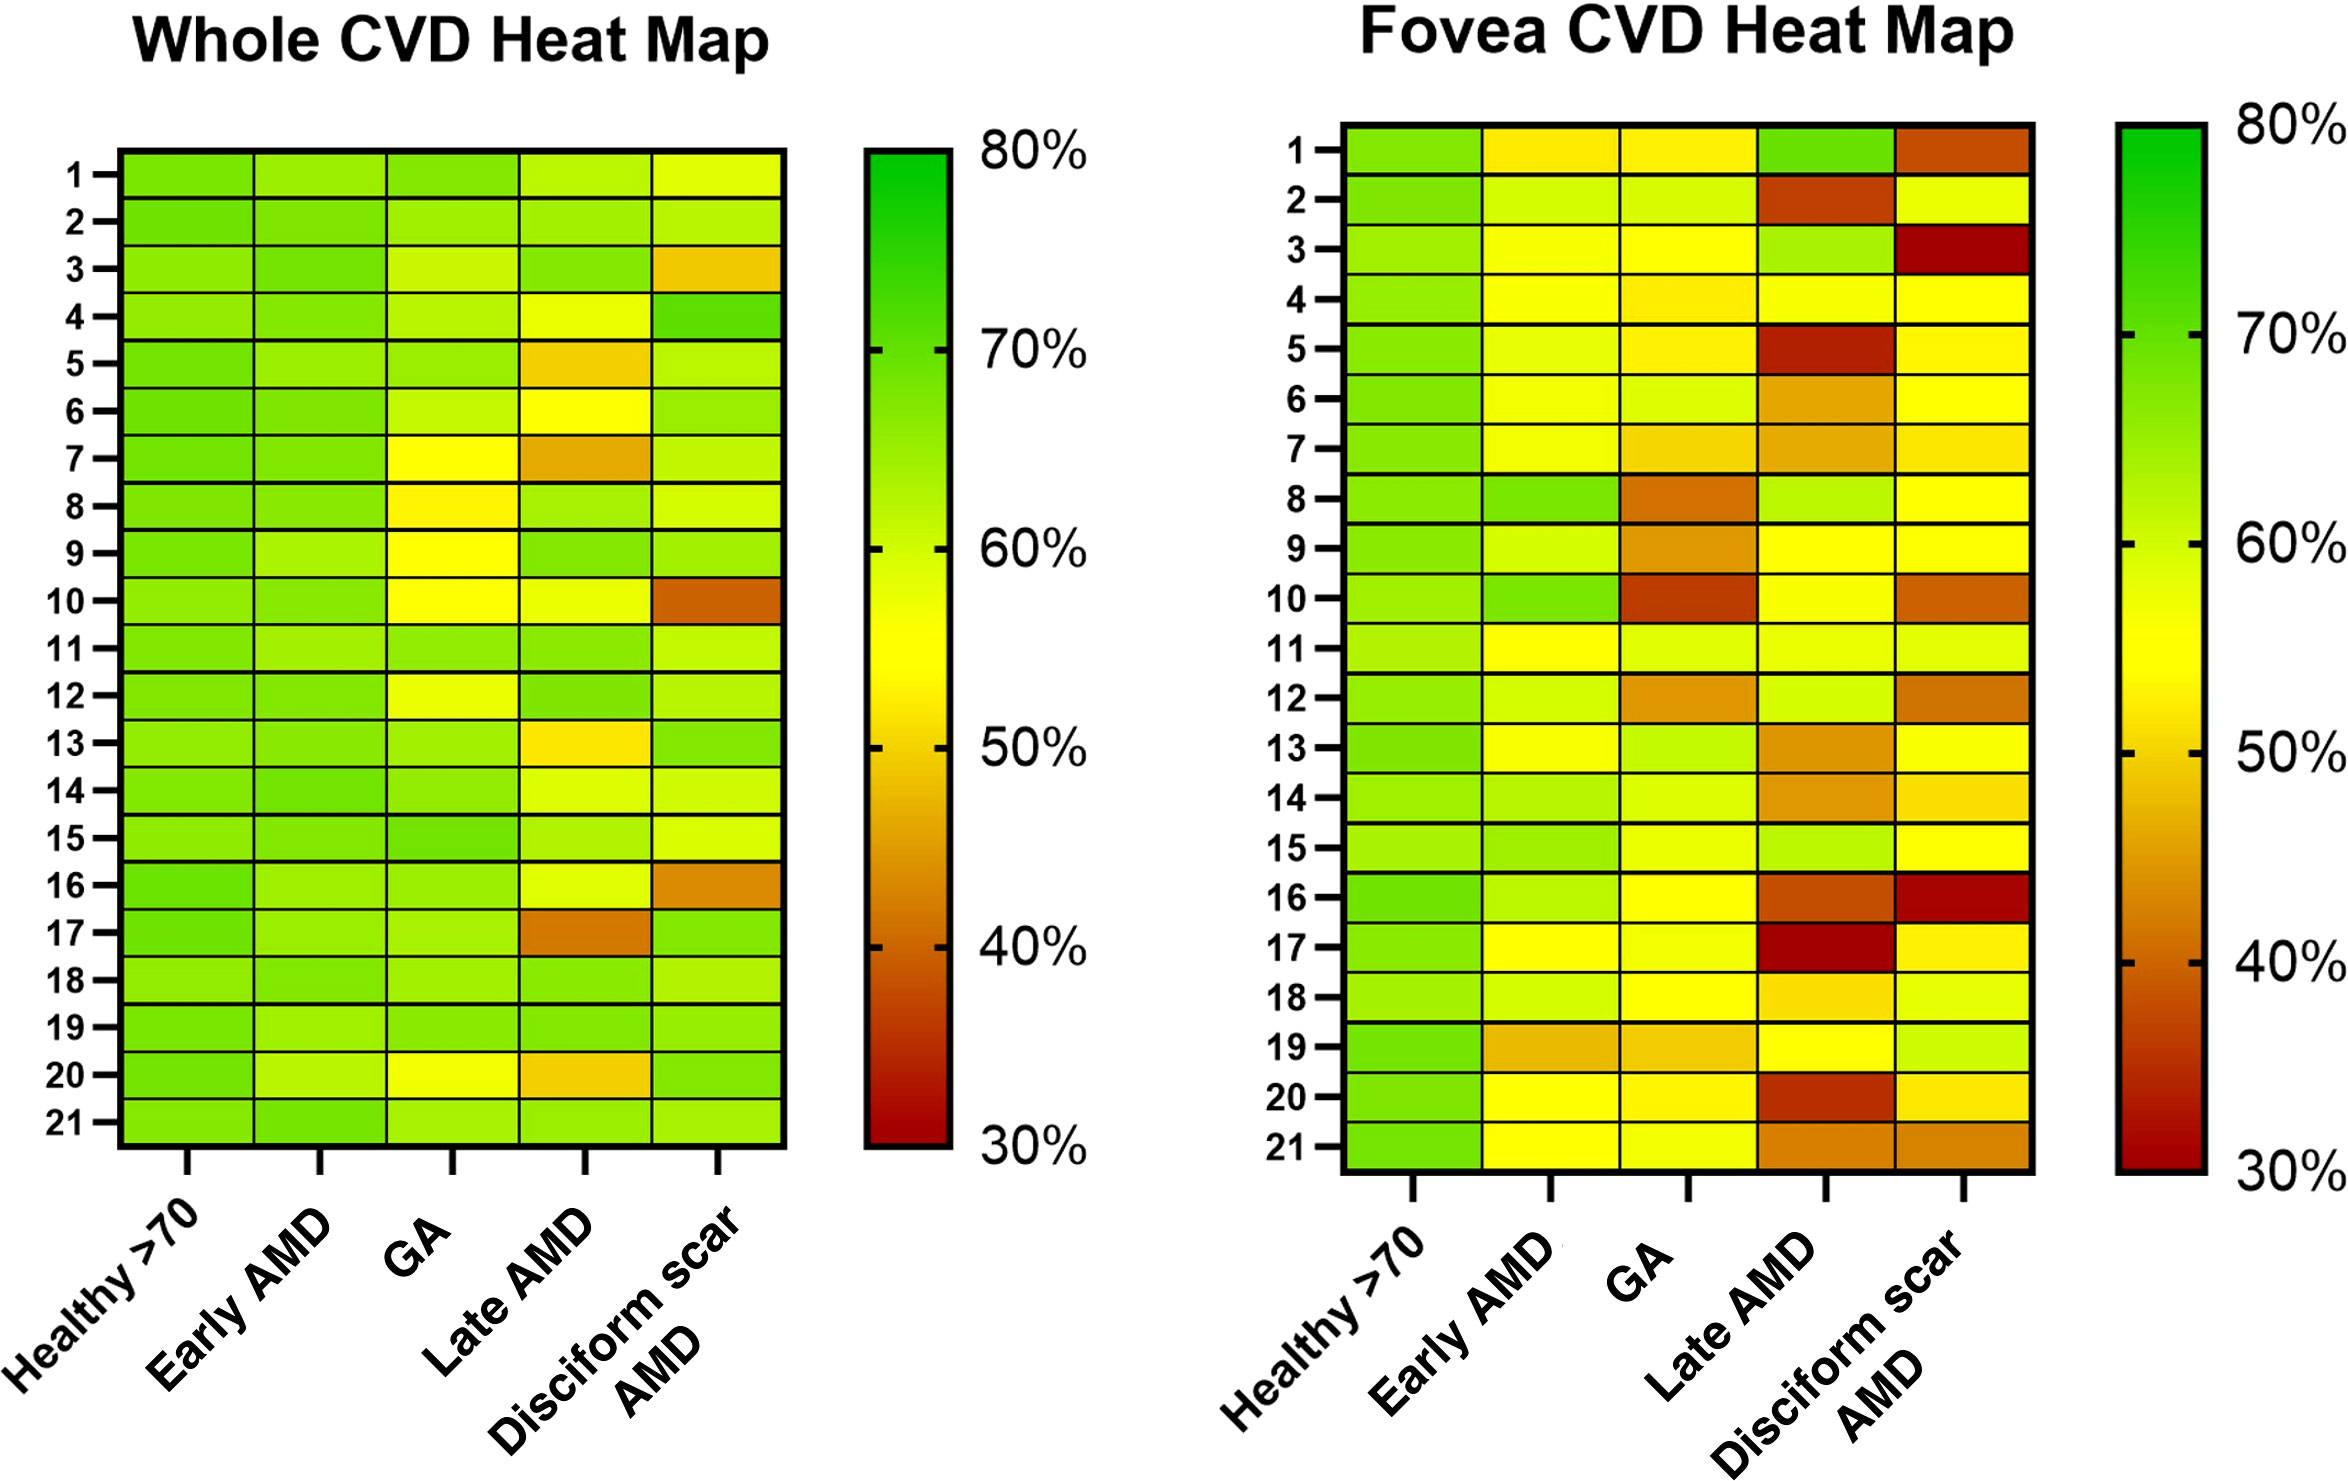
Figure 5 Heat maps of CVD for every eye highlighting variations in different colors (red for worse values, green for better). CVD, Choriocapillaris Vascular Density; GA, Geographic Atrophy; AMD, age related macular degeneration.
GA subgroup results
The GA subgroup underwent an extra analysis focused on the areas of inner/outer segment of photoreceptors (IS/OS) disruption, i.e., EZ interruption. An average of 1954.5 ± 1477.6 µm of EZ interruption was found on OCT B scans, while ImageJ analysis reported a mean atrophic area of 9.11 ± 9.22 mm2 on 6.4x6.4 mm macular scans.
In this subgroup, the whole image-CVD had an inverse correlation with both the EZ interruption measurements (r=-0.5390; R2 = 0.31; p=0.012) and the calculated chorio-retinal atrophic area (r=-0.5546; R2= 0.29; p=0.009). On the other hand, the foveal CVD did not correlate with any of them (r=-0.2112; p=0.36 for foveal CVD and EZ interruption correlation; r=-0.03925; p=0.87, for foveal CVD and measurement of the atrophic area).
Other results
Correlation analysis among all subgroups showed an inverse correlation between patients’ age and whole image CVD (r=-0.2875; R2= 0.08; p=0-003). On the other hand, no correlation was found between patients’ age and foveal CVD (r=-0.1476; p=0.13). Linear regression analysis showed a significant non-zero slope when considering the entire sample and evaluating patients’ age and whole CVD (slope=-0.2612, 1/slope=-3.828; p=0.003), whereas this outcome was not appreciated when evaluating the foveal CVD (slope=-0.2242, 1/slope=-4.461; p=0.13) (Figure 6).
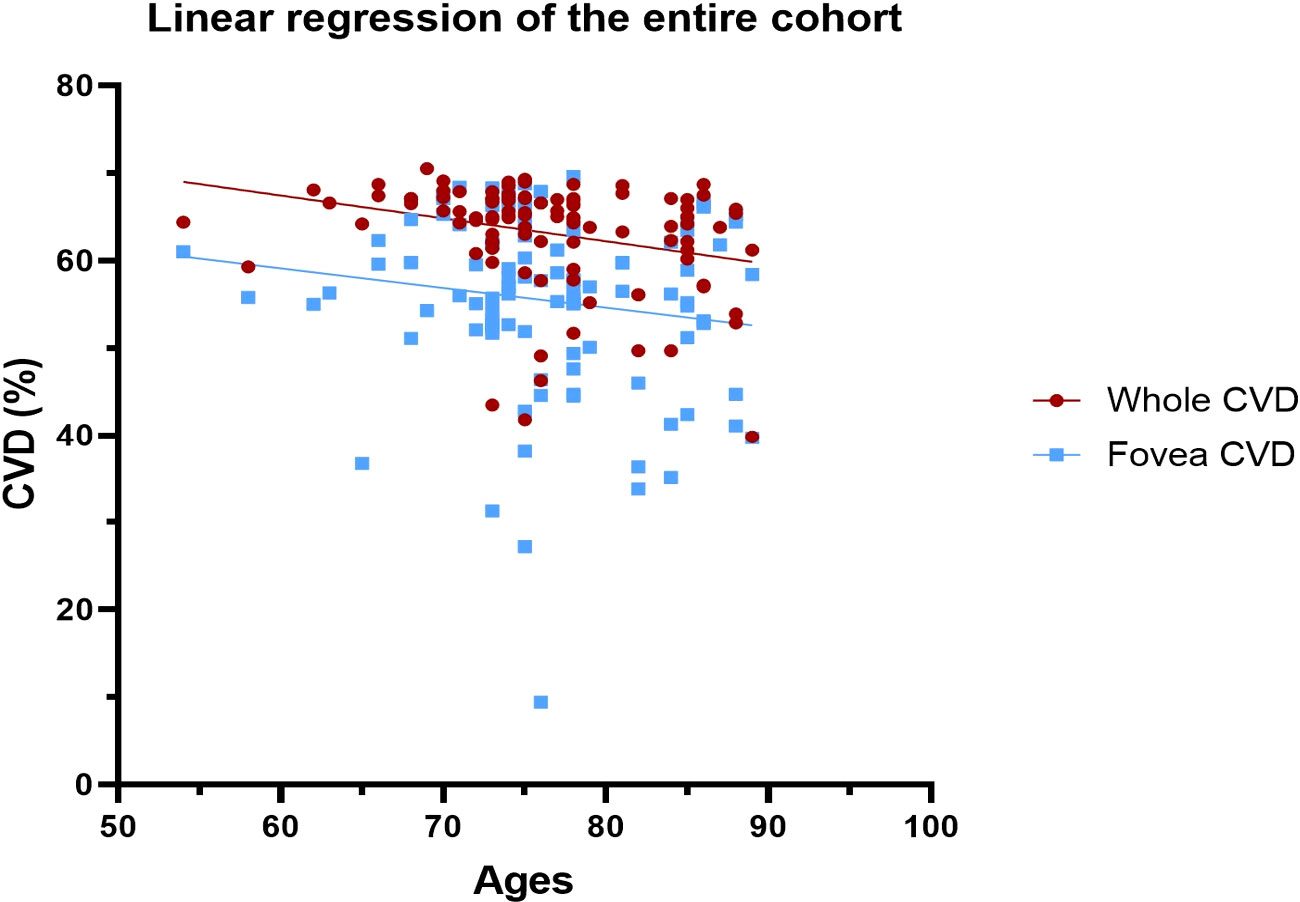
Figure 6 Linear regression to evaluate age-dependent CVD changes in both whole and foveal area among the entire cohort. CVD, Choriocapillaris Vascular Density.
Finally, a post hoc analysis was conducted on healthy patients under 70 years old, with a mean age of 61.2 ± 8.2 years (N=21 eyes). The pairwise comparison between under-70 and over-70 years old healthy controls showed no statistically significant difference in either their whole image CVD (mean difference 0.86, p=0.30), or in their foveal CVD (mean difference 0.36, p=0.88). Correlation analysis showed a statistically significant inverse correlation between age and whole image CVD (r=-0.3844, p=0.012), and only a non-significant tendency to inverse correlation with foveal CVD (r=-0.2314, p=0.14). These results were confirmed with linear regression analysis.
Discussion
Several papers have recently explored the role of CC flow in many types of age-related macular degeneration.
A considerable drop in CC perfusion has been demonstrated beneath (29, 30) and even beyond the boundaries of GA areas (31, 32). Particularly, Sacconi et al. found a reduction in vessel density at GA’s borders, and hypothesized that this impairment might forecast the future direction of its expansion (33). Nassisi et al., analyzing CC flow around zones of GA with SS-OCTA found that the 500-µm para-atrophic zone directly around the GA had much higher flow deficits (FDs) than the 500-µm peri-atrophic ring, i.e., just beyond the former (34). This result was confirmed by Rinella et al., who evidenced a significant increase in CC flow voids in GA areas, compared to age-matched controls, but also in the area within 2° of the GA, compared with the area outside this limit. These findings suggest that a proportional reduction of flow starts from the edges of the atrophy (35). Again, Nassisi et al. recently demonstrated that the severity of FDs around the GA is related to the speed with which the illness progresses or the atrophy enlarges (12, 34). Based on these findings, it could be hypothesized that CC flow modification may occur before RPE atrophy, making the CC alteration a biomarker of GA progression (36). However, the above mentioned results are in contrast with those of Bhutto et al., who suggest that the first insult begins at the level of the RPE, while the CC would be affected only afterwards (37). It was also hypothesized a strict connection between CC and RPE, necessarily through few soluble molecules since the presence of the Bruch’s membrane. A role seemed to be particularly played by the VEGF (vascular endothelial growth factor) and its receptor VEGFR2 (38).
Alagorie et al. focused on the severity of CC FDs in peripheral portions of the macula in patients with late AMD. They claimed that while the peripheral CC flow in eyes with CNV was comparable to that in healthy eyes, the FDs in GA-eyes was considerably higher in comparison with controls (p=0.012) and CNV eyes (p=0.038) (39). Consistent with these findings, on whole images (i.e., macular area), we found a significant inverse correlation between CVD changes and atrophic parameters (i.e., the size of macular chorio-retinal atrophy and the length of EZ interruption) in the GA subgroup.
Sohn et al. recently evidenced that CC loss can be detected in early AMD even in regions with a preserved RPE. On the other hand, modifications in the lumen/stroma ratio of the outer choroid, did not significantly vary between controls, AMD, or GA eyes, suggesting that CC changes are more common/happen earlier than those in the outer choroid (11). In contrast with this finding, another research group found no difference in CC blood flow between intermediate AMD patients and healthy control participants (40), and also in our study, no statistically significant difference in CVD values between healthy and early AMD eyes, was to be found. Interestingly, a previous research on intermediate AMD suggested that there are CC FDs below the drusen and in the areas immediately around them (41). Some authors believe that a compensatory enhanced CC perfusion in a more remote area of the macula, away from the drusen, might lead to an overall normal macular CVD (39).
In agreement with the above, we detected a progressive attenuation of the CVD as the AMD progressed to more advanced stages. A recent study conducted by Savastano et al. showed a statistically significant difference in CC perfusion in both the entire macular area and the foveal region between healthy and advanced exudative - AMD eyes, suggesting that a loss in CC perfusion should be interpreted as a marker of permanent damage, and thus a predictor of AMD evolution (42).
This research highlighted that there is a statistically significant difference in whole images-CVDs between various types of AMD eyes (with the exception of early AMD) and control groups. Foveal CVD, on the other hand, showed a significant difference between healthy controls and all stages of AMD. Moreover, comparison between the early AMD, late AMD and the disciform scar AMD groups showed a significant reduction in CVD, with increasing mean differences, in both whole and foveal images. This may suggest that a linear decrease of CC perfusion goes hand in hand with exudative AMD worsening and reflects the disease’s stage. Nonetheless, we found no differences in CVD between mild/intermediate forms of AMD and GA. Although not statistically significant, in our study CC flow impairment in GA atrophy tended to be less severe than in the advanced exudative forms of AMD.
Based on our findings, we hypothesize that the detection of decreased CVD on foveal images in patients at the early stage of AMD could represent a useful functional biomarker for an early diagnosis, since it seems to become evident before any morphological modification. This is consistent with a recent research conducted by Tiosano et al., in which a group of patients with a relatively stable intermediate AMD followed with OCTA, showed a significant CC impairment deterioration over one year of follow up, suggesting that CC dysfunction occurs before any structural change (43). Similarly, Corvi et al. suggested that CC flow deficit, along with other structural biomarkers such as intraretinal hyperreflective foci, hyporeflective drusen cores, and higher drusen volume ≥0.03 mm3, was an independent risk factor for the progression of intermediate AMD to outer retinal and RPE atrophy (44).
Our study has several limitations. First, because intraretinal fluid can mask the signal from the underlying choriocapillaris (i.e., absent flow signal), CVD might have been described as falsely reduced in case some lesions would have layed on top of the CC itself (i.e., “dark halo” effect). Indeed, previous studies have found an increase in the percentage of CC FDs of areas immediately surrounding CNVs (39, 45, 46). Another possible shortfall of our study derives from the manual segmentation of GA areas. However, the inverse correlation we have found between GA’s parameters and the CVD had an important statistical significance (p=0.012 and p=0.009), making a casual correlation unlikely.
In conclusion our study highlighted the crucial role that OCTA could play in the categorization of AMD. Indeed, this imaging technique is able to detect significant worsening in CVD among the different phases of the disease. Importantly, the detection of an early decrease in CVD may be a predictor of AMD development, becoming a fundamental biomarker of this pathology.
Data availability statement
The raw data supporting the conclusions of this article will be made available by the authors, without undue reservation.
Ethics statement
The studies involving human participants were reviewed and approved by Catholic University of the Sacred Heart Ethical Committee, Rome, Italy. The patients/participants provided their written informed consent to participate in this study.
Authors contributions
Data collection: CFo, CFa, MMC Writing paper: MCS; CFo; MMC Idea of paper investigation: MCS. Data manager: CR; RK. Review: MCS; AS. Statistical Analysis: BF. Language assistance: RK. Critical revision: SR. All authors have read and agreed to the published version of the manuscript.
Acknowledgments
The Authors want to thank Fondazione Policlinico Gemelli IRCCS and Ministero della Salute. The Authors want to thank Catholic University of the Sacred Heart, too. The Authors thank native speaker co-author Raphael Kilian for language assistance.
Conflict of interest
The authors declare that the research was conducted in the absence of any commercial or financial relationships that could be construed as a potential conflict of interest.
Publisher’s note
All claims expressed in this article are solely those of the authors and do not necessarily represent those of their affiliated organizations, or those of the publisher, the editors and the reviewers. Any product that may be evaluated in this article, or claim that may be made by its manufacturer, is not guaranteed or endorsed by the publisher.
References
1. Wong WL, Su X, Li X, Cheung CM, Klein R, Cheng CY, et al. Global prevalence of age-related macular degeneration and disease burden projection for 2020 and 2040: A systematic review and meta-analysis. Lancet Glob Health (2014) 2:e106–16. doi: 10.1016/S2214-109X(13)70145-1
2. Muakkassa NW, Chin AT, De Carlo T, Klein KA, Baumal CR, Witkin AJ, et al. Characterizing the effect of anti-vascular endothelial growth factor therapy on treatment-naive choroidal neovascularization using optical coherence tomography angiography. Retina-the J Retinal Vitreous Dis (2015) 35:2252–9. doi: 10.1097/IAE.0000000000000836
3. Novais EA, Adhi M, Moult EM, Louzada RN, Cole ED, Husvogt L, et al. Choroidal neovascularization analyzed on ultrahigh-speed swept-source optical coherence tomography angiography compared to spectral-domain optical coherence tomography angiography. Am J Ophthalmol (2016) 164:80–8. doi: 10.1016/j.ajo.2016.01.011
4. Moult E, Choi W, Waheed NK, Adhi M, Lee B, Lu CD, et al. Ultrahigh-speed swept-source OCT angiography in exudative AMD. Ophthalmic Surg Lasers Imaging Retina (2014) 45:496–505. doi: 10.3928/23258160-20141118-03
5. Coscas G, Lupidi M, Coscas F, Francais C, Cagini C, Souied EH. Optical coherence tomography angiography during follow-up: Qualitative and quantitative analysis of mixed type I and II choroidal neovascularization after vascular endothelial growth factor trap therapy. Ophthalmic Res (2015) 54:57–63. doi: 10.1159/000433547
6. Wong TY, Chakravarthy U, Klein R, Mitchell P, Zlateva G, Buggage R, et al. The natural history and prognosis of neovascular age-related macular degeneration: A systematic review of the literature and meta-analysis. Ophthalmology (2008) 115:116–26. doi: 10.1016/j.ophtha.2007.03.008
7. Farazdaghi MK, Ebrahimi KB. Role of the choroid in age-related macular degeneration: A current review. J Ophthalmic Vis Res (2019) 14:78–87. doi: 10.4103/jovr.jovr_125_18
8. Campochiaro PA. Molecular pathogenesis of retinal and choroidal vascular diseases. Prog Retin Eye Res (2015) 49:67–81. doi: 10.1016/j.preteyeres.2015.06.002
9. Lindner M, Bezatis A, Czauderna J, Becker E, Brinkmann CK, Schmitz-Valckenberg S, et al. Choroidal thickness in geographic atrophy secondary to age-related macular degeneration. Invest Ophthalmol Vis Sci (2015) 56:875–82. doi: 10.1167/iovs.14-14933
10. Thorell MR, Goldhardt R, Nunes RP, Garcia CAD, Abbey AM, Kuriyan AE, et al. Association between subfoveal choroidal thickness, reticular pseudodrusen, and geographic atrophy in age-related macular degeneration. Ophthalmic Surg Lasers Imaging Retina (2015) 46:513–21. doi: 10.3928/23258160-20150521-02
11. Sohn EH, Flamme-Wiese MJ, Whitmore SS, Workalemahu G, Marneros AG, Boese EA, et al. Choriocapillaris degeneration in geographic atrophy. Am J Pathol (2019) 189:1473–80. doi: 10.1016/j.ajpath.2019.04.005
12. Nassisi M, Baghdasaryan E, Borrelli E, Ip M, Sadda SR. Choriocapillaris flow impairment surrounding geographic atrophy correlates with disease progression. PLoS One (2019) 14:e0212563. doi: 10.1371/journal.pone.0212563
13. Friedman E. A hemodynamic model of the pathogenesis of age-related macular degeneration. Am J Ophthalmol (1997) 124:677–82. doi: 10.1016/S0002-9394(14)70906-7
14. Lutty G, Grunwald J, Majji AB, Uyama M, Yoneya S. Changes in choriocapillaris and retinal pigment epithelium in age-related macular degeneration. Mol Vis (1999) 5:35.
15. Mullins RF, Johnson MN, Faidley EA, Skeie JM, Huang J. Choriocapillaris vascular dropout related to density of drusen in human eyes with early age-related macular degeneration. Invest Ophthalmol Vis Sci (2011) 52:1606–12. doi: 10.1167/iovs.10-6476
16. Boker T, Fang T, Steinmetz R. Refractive error and choroidal perfusion characteristics in patients with choroidal neovascularization and age-related macular degeneration. Ger J Ophthalmol (1993) 2:10–3.
17. Pauleikhoff D, Chen J, Chisholm I, Bird A. Choroidal perfusion abnormality with age-related bruch’s membrane change. Am J Ophthalmol (1990) 109:211–7. doi: 10.1016/S0002-9394(14)75989-6
18. Lee B, Ahn J, Yun C, Kim SW, Oh J. Variation of retinal and choroidal vasculatures in patients with age-related macular degeneration. Invest Ophthalmol Vis Sci (2018) 59:5246–55. doi: 10.1167/iovs.17-23600
19. Vujosevic S, Toma C, Villani E, Muraca A, Torti E, Florimbi G, et al. Quantitative choriocapillaris evaluation in intermediate age-related macular degeneration by swept-source optical coherence tomography angiography. Acta Ophthalmol (2019) 97:e919–26. doi: 10.1111/aos.14088
20. Alten F, Heiduschka P, Clemens CR, Eter N. Exploring choriocapillaris under reticular pseudodrusen using OCT-angiography. Graefe’s Arch Clin Exp Ophthalmol (2016) 254:2165–73. doi: 10.1007/s00417-016-3375-1
21. Borrelli E, Shi Y, Uji A, Balasubramanian S, Nassisi M, Sarraf D, et al. Topographic analysis of the choriocapillaris in intermediate age-related macular degeneration. Am J Ophthalmol (2018) 196:34–43. doi: 10.1016/j.ajo.2018.08.014
22. Borrelli E, Souied EH, Freund KB, Querques G, Miere A, Gal-Or O, et al. Reduced choriocapillaris flow in eyes with type 3 neovascularization and age-related macular degeneration. Retina (2018) 38:1968–76. doi: 10.1097/IAE.0000000000002198
23. Treister AD, Nesper PL, Fayed AE, Gill MK, Mirza RG, Fawzi AA. Prevalence of subclinical CNV and choriocapillaris nonperfusion in fellow eyes of unilateral exudative AMD on OCT angiography. Transl Vis Sci Technol (2018) 7:19. doi: 10.1167/tvst.7.5.19
24. Moult EM, Alibhai AY, Rebhun C, Lee B, Ploner S, Schottenhamml J, et al. Spatial distribution of choriocapillaris impairment in eyes with choroidal neovascularization secondary to age-related macular degeneration: A quantitative OCT angiography study. Retina (2020) 40:428–45. doi: 10.1097/IAE.0000000000002556
25. Nassisi M, Tepelus T, Nittala MG, Sadda SR. Choriocapillaris flow impairment predicts the development and enlargement of drusen. Graefes Arch Clin Exp Ophthalmol (2019) 257:2079–85. doi: 10.1007/s00417-019-04403-1
26. Thulliez M, Zhang QQ, Shi YY, Zhou H, Chu ZD, de Sisternes L, et al. Correlations between choriocapillaris flow deficits around geographic atrophy and enlargement rates based on swept-source OCT imaging. Ophthalmol Retina (2019) 3:478–88. doi: 10.1016/j.oret.2019.01.024
27. Ferris FL III, Wilkinson C, Bird A, Chakravarthy U, Chew E, Csaky K, et al. Clinical classification of age-related macular degeneration. Ophthalmology (2013) 120:844–51. doi: 10.1016/j.ophtha.2012.10.036
28. Spaide RF, Fujimoto JG, Waheed NK, Sadda SR, Staurenghi G. Optical coherence tomography angiography. Prog Retin Eye Res (2018) 64:1–55. doi: 10.1016/j.preteyeres.2017.11.003
29. Moult EM, Waheed NK, Novais EA, Choi W, Lee B, Ploner SB, et al. Swept-source optical coherence tomography angiography reveals choriocapillaris alterations in eyes with nascent geographic atrophy and drusen-associated geographic atrophy. Retina (2016) 36 Suppl 1:S2–S11. doi: 10.1097/IAE.0000000000001287
30. Arya M, Sabrosa AS, Duker JS, Waheed NK. Choriocapillaris changes in dry age-related macular degeneration and geographic atrophy: a review. Eye Vis (Lond) (2018) 5:22. doi: 10.1186/s40662-018-0118-x
31. Choi W, Moult EM, Waheed NK, Adhi M, Lee B, Lu CD, et al. Ultrahigh-speed, swept-source optical coherence tomography angiography in nonexudative age-related macular degeneration with geographic atrophy. Ophthalmology (2015) 122:2532–44. doi: 10.1016/j.ophtha.2015.08.029
32. Kvanta A, Casselholm de Salles M, Amren U, Bartuma H. Optical coherence tomography angiography of the foveal microvasculature in geographic atrophy. Retina (2017) 37:936–42. doi: 10.1097/IAE.0000000000001248
33. Sacconi R, Corbelli E, Carnevali A, Querques L, Bandello F, Querques G. Optical coherence tomography angiography in geographic atrophy. Retina (2018) 38:2350–5. doi: 10.1097/IAE.0000000000001873
34. Nassisi M, Shi Y, Fan W, Borrelli E, Uji A, Ip MS, et al. Choriocapillaris impairment around the atrophic lesions in patients with geographic atrophy: A swept-source optical coherence tomography angiography study. Br J Ophthalmol (2019) 103:911–7. doi: 10.1136/bjophthalmol-2018-312643
35. Rinella NT, Zhou H, Zhang Q, Keiner C, Oldenburg CE, Duncan JL, et al. Quantifying choriocapillaris flow voids in patients with geographic atrophy using swept-source OCT angiography. Ophthalmic Surgery Lasers Imaging Retina (2019) 50:e229–35. doi: 10.3928/23258160-20190905-14
36. Lindner M, Boker A, Mauschitz MM, Gobel AP, Fimmers R, Brinkmann CK, et al. Fundus autofluorescence in age-related macular degeneration study, directional kinetics of geographic atrophy progression in age-related macular degeneration with foveal sparing. Ophthalmology (2015) 122:1356–65. doi: 10.1016/j.ophtha.2015.03.027
37. Bhutto I, Lutty G. Understanding age-related macular degeneration (AMD): relationships between the photoreceptor/retinal pigment epithelium/Bruch’s membrane/choriocapillaris complex. Mol aspects Med (2012) 33:295–317. doi: 10.1016/j.mam.2012.04.005
38. Saint-Geniez M, Kurihara T, Sekiyama E, Maldonado AE, D’Amore PA. An essential role for RPE-derived soluble VEGF in the maintenance of the choriocapillaris. Proc Natl Acad Sci U.S.A. (2009) 106:18751–6. doi: 10.1073/pnas.0905010106
39. Alagorie AR, Verma A, Nassisi M, Sadda SR. Quantitative assessment of choriocapillaris flow deficits in eyes with advanced age-related macular degeneration versus healthy eyes. Am J Ophthalmol (2019) 205:132–9. doi: 10.1016/j.ajo.2019.04.037
40. Alagorie AR, Verma A, Nassisi M, Nittala M, Velaga S, Tiosano L, et al. Quantitative assessment of choriocapillaris flow deficits surrounding choroidal neovascular membranes. Retina (2020) 40:2106–12. doi: 10.1097/IAE.0000000000002878
41. Borrelli E, Uji A, Sarraf D, Sadda SR. Alterations in the choriocapillaris in intermediate age-related macular degeneration. Invest Ophthalmol Vis Sci (2017) 58:4792–8. doi: 10.1167/iovs.17-22360
42. Savastano MC, Rizzo C, Gambini G, Savastano A, Falsini B, Bacherini D, et al. Choriocapillaris vascular density changes: Healthy vs. advanced exudative age-related macular degeneration previously treated with multiple anti-VEGF intravitreal injections. Diagnostics (Basel) (2021) 11:1958. doi: 10.3390/diagnostics11111958
43. Tiosano L, Corradetti G, Sadda SR. Progression of choriocapillaris flow deficits in clinically stable intermediate age-related macular degeneration. Eye (Lond) (2021) 35:2991–8. doi: 10.1038/s41433-020-01298-9
44. Corvi F, Tiosano L, Corradetti G, Nittala MG, Lindenberg S, Alagorie AR, et al. Choriocapillaris flow deficits as a risk factor for progression of age-related macular degeneration. Retina (2021) 41:686–93. doi: 10.1097/IAE.0000000000002990
45. Seddon JM, McLeod DS, Bhutto IA, Villalonga MB, Silver RE, Wenick AS, et al. Histopathological insights into choroidal vascular loss in clinically documented cases of age-related macular degeneration. JAMA Ophthalmol (2016) 134:1272–80. doi: 10.1001/jamaophthalmol.2016.3519
Keywords: age-related macular degeneration, advanced exudative AMD, exudative AMD, geographic atrophy AMD, macular neovascularization, OCT angiography, choriocapillaris vascular density, disciform scar AMD
Citation: Savastano MC, Fossataro C, Carlà MM, Fantozzi C, Falsini B, Savastano A, Rizzo C, Kilian R and Rizzo S (2022) OCT angiography analysis of choriocapillaris vascular density in different stages of age-related macular degeneration. Front. Ophthalmol. 2:985262. doi: 10.3389/fopht.2022.985262
Received: 03 July 2022; Accepted: 23 August 2022;
Published: 22 September 2022.
Edited by:
Genea Edwards, University of Missouri–Kansas City, United StatesReviewed by:
Hossein Nazari, University of Minnesota Twin Cities, United StatesLuca Di Antonio, University of Studies G. d’Annunzio Chieti and Pescara, Italy
Copyright © 2022 Savastano, Fossataro, Carlà, Fantozzi, Falsini, Savastano, Rizzo, Kilian and Rizzo. This is an open-access article distributed under the terms of the Creative Commons Attribution License (CC BY). The use, distribution or reproduction in other forums is permitted, provided the original author(s) and the copyright owner(s) are credited and that the original publication in this journal is cited, in accordance with accepted academic practice. No use, distribution or reproduction is permitted which does not comply with these terms.
*Correspondence: Claudia Fossataro, Zm9zc2F0YXJvY2xhdWRpYUBnbWFpbC5jb20=
†ORCID: Claudia Fossataro, orcid.org/0000-0001-9474-0517
‡These authors have contributed equally to this work