 Jennifer L. Philip1,2
 Ryan J. Pewowaruk1
 Claire S. Chen3
 Diana M. Tabima1Daniel A. Beard4
 Anthony J. Baker5,6Naomi C. Chesler1,3,7*
- 1Department of Biomedical Engineering, University of Wisconsin–Madison, Madison, WI, United States
- 2Department of Surgery, University of Wisconsin–Madison, Madison, WI, United States
- 3Department of Mechanical Engineering, University of Wisconsin–Madison, Madison, WI, United States
- 4Department of Molecular and Integrative Physiology, University of Michigan, Ann Arbor, MI, United States
- 5San Francisco Veterans Affairs Medical Center, San Francisco, CA, United States
- 6Department of Medicine, University of California, San Francisco, San Francisco, CA, United States
- 7Department of Medicine, University of Wisconsin–Madison, Madison, WI, United States
Introduction: Pulmonary hypertension (PH) causes pressure overload leading to right ventricular failure (RVF). Myocardial structure and myocyte mechanics are altered in RVF but the direct impact of these cellular level factors on organ level function remain unclear. A computational model of the cardiovascular system that integrates cellular function into whole organ function has recently been developed. This model is a useful tool for investigating how changes in myocyte structure and mechanics contribute to organ function. We use this model to determine how measured changes in myocyte and myocardial mechanics contribute to RVF at the organ level and predict the impact of myocyte-targeted therapy.
Methods: A multiscale computational framework was tuned to model PH due to bleomycin exposure in mice. Pressure overload was modeled by increasing the pulmonary vascular resistance (PVR) and decreasing pulmonary artery compliance (CPA). Myocardial fibrosis and the impairment of myocyte maximum force generation (Fmax) were simulated by increasing the collagen content (↑PVR + ↓CPA + fibrosis) and decreasing Fmax (↑PVR + ↓CPA + fibrosis + ↓Fmax). A61603 (A6), a selective α1A-subtype adrenergic receptor agonist, shown to improve Fmax was simulated to explore targeting myocyte generated Fmax in PH.
Results: Increased afterload (RV systolic pressure and arterial elastance) in simulations matched experimental results for bleomycin exposure. Pressure overload alone (↑PVR + ↓CPA) caused decreased RV ejection fraction (EF) similar to experimental findings but preservation of cardiac output (CO). Myocardial fibrosis in the setting of pressure overload (↑PVR + ↓PAC + fibrosis) had minimal impact compared to pressure overload alone. Including impaired myocyte function (↑PVR + ↓PAC + fibrosis + ↓Fmax) reduced CO, similar to experiment, and impaired EF. Simulations predicted that A6 treatment preserves EF and CO despite maintained RV pressure overload.
Conclusion: Multiscale computational modeling enabled prediction of the contribution of cellular level changes to whole organ function. Impaired Fmax is a key feature that directly contributes to RVF. Simulations further demonstrate the therapeutic benefit of targeting Fmax, which warrants additional study. Future work should incorporate growth and remodeling into the computational model to enable prediction of the multiscale drivers of the transition from dysfunction to failure.
Introduction
Pulmonary hypertension (PH) is a fatal vascular disease that progresses from first symptoms to death in 5 years for 61% of patients (Thenappan et al., 2010). Right ventricular failure (RVF) is the leading cause of death in patients with PH (Sztrymf et al., 2010; Vonk Noordegraaf and Galie, 2011). Despite its high clinical significance, RVF is poorly understood and inadequately treated.
The right ventricular (RV) response to pressure overload in PH is initially adaptive but subsequently transitions to RVF. The adaptive phase is characterized by hypertrophy, increased or decreased end-systolic elastance, impaired ventricular-vascular coupling and diastolic dysfunction (Bogaard et al., 2009; Champion et al., 2009; Wang et al., 2013; Liu et al., 2014; Rain et al., 2014; Golob et al., 2016; Liu et al., 2017b), whereas the transition to RVF is marked by decreased RV ejection fraction and decreased cardiac output (CO) (Greyson, 2008; Markel et al., 2008; Bogaard et al., 2009). Histologically, RVF is characterized by myocardial fibrosis and rarefaction of myocardial capillaries (Bogaard et al., 2009; Drake et al., 2011; Rain et al., 2014, 2016). Recent small animal studies have demonstrated distinct molecular and cellular profiles for RVF (Bogaard et al., 2009; Drake et al., 2011; Gomez-Arroyo et al., 2013). However, none have demonstrated a functional link between cellular level and organ level changes in function.
Cellular level function is best evaluated by a combination of myocyte biomechanical measurements via length-tension and force generation experiments as well as myocardial cellular and extracellular structural measurements. This approach has only been used to explore the RV in a limited number of studies. Myocyte maximum force generation has been found to be preserved or increased in some models of PH (Fan et al., 1997; Walker et al., 2011; Wang et al., 2018), but decreased in others (Versluis et al., 2004; Dai et al., 2006; Cowley et al., 2015, 2017). In particular, in RVF secondary to LV failure and RVF due to bleomycin-induced pulmonary fibrosis (Wang et al., 2010; Cowley et al., 2017), maximum myocyte force generation (Fmax) decreases. Changes in passive myocardial mechanics have also been found in human PH as measured in isolated RV trabeculae (Rain et al., 2013) and experimental models of PH associated with myocardial fibrosis (Rain et al., 2016).
These studies give evidence of important associations between cellular level and organ level function changes in RVF; however, no causal relationships have been established. A computational model of the cardiovascular system that integrates cellular function (both metabolic and mechanical) and structure into whole organ function has recently been developed (Tewari et al., 2016a,b). This model is an important tool to aid in investigating which functional and structural changes at the cellular level cause impaired RV function at the organ level.
Here, we used this multiscale computational model to investigate how measured changes in myocyte and myocardial mechanics cause RVF at the organ level. Moreover, we predict the ability of a novel myocyte-targeted therapy for RVF to restore organ level RV function based on measurements of cellular level function.
Materials and Methods
Bleomycin Mouse Model of Pulmonary Hypertension and Right Ventricular Failure
Bleomycin treatment has been shown to result in pulmonary fibrosis, PH and RVF in ∼2 weeks (Williams et al., 1992; Sato et al., 1993; Hemnes et al., 2008; Cowley et al., 2017). Hemnes et al. (2008) characterized the development of PH and RVF in bleomycin (Bleo) treated mice in vivo using right heart catheterization and pressure volume loop analysis. Our group has documented the development of RVF following Bleo treatment and demonstrated impaired myocyte force generation (Cowley et al., 2015, 2017). Table 1 summarizes these experimental results.
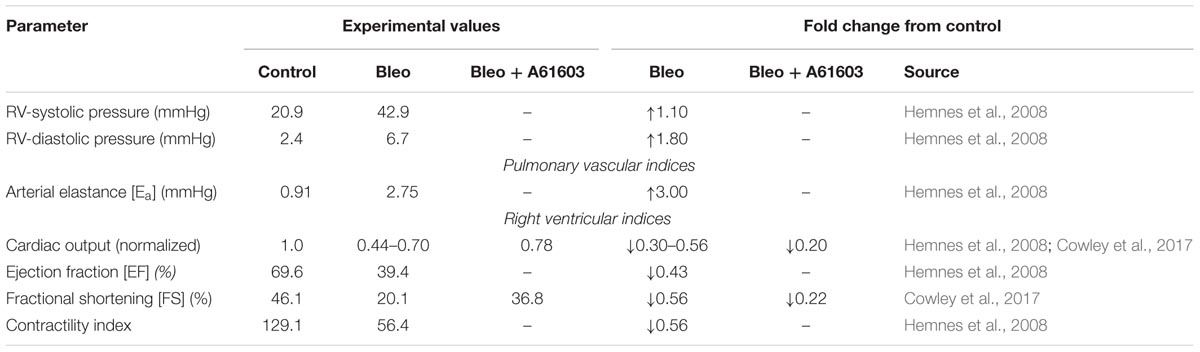
TABLE 1. Hemodynamic alterations in right ventricular failure (RVF) due to bleomycin exposure.
Computational Modeling
Model Description and Adaptation
The multiscale model is illustrated in Figure 1. Developed by Tewari et al. (2016b), myofilament mechanoenergetics (Tewari et al., 2016a,b) drive biventricular contraction and relaxation (Lumens et al., 2009) coupled to lumped parameter circulations (Tewari et al., 2013). As recently described by Pewowaruk et al. (2018), in order to better represent diastolic ventricular physiology, a varying elastance atrial model was incorporated (Senzaki et al., 1996), in which the atrial pressure changes that drive ventricular filling are calculated as
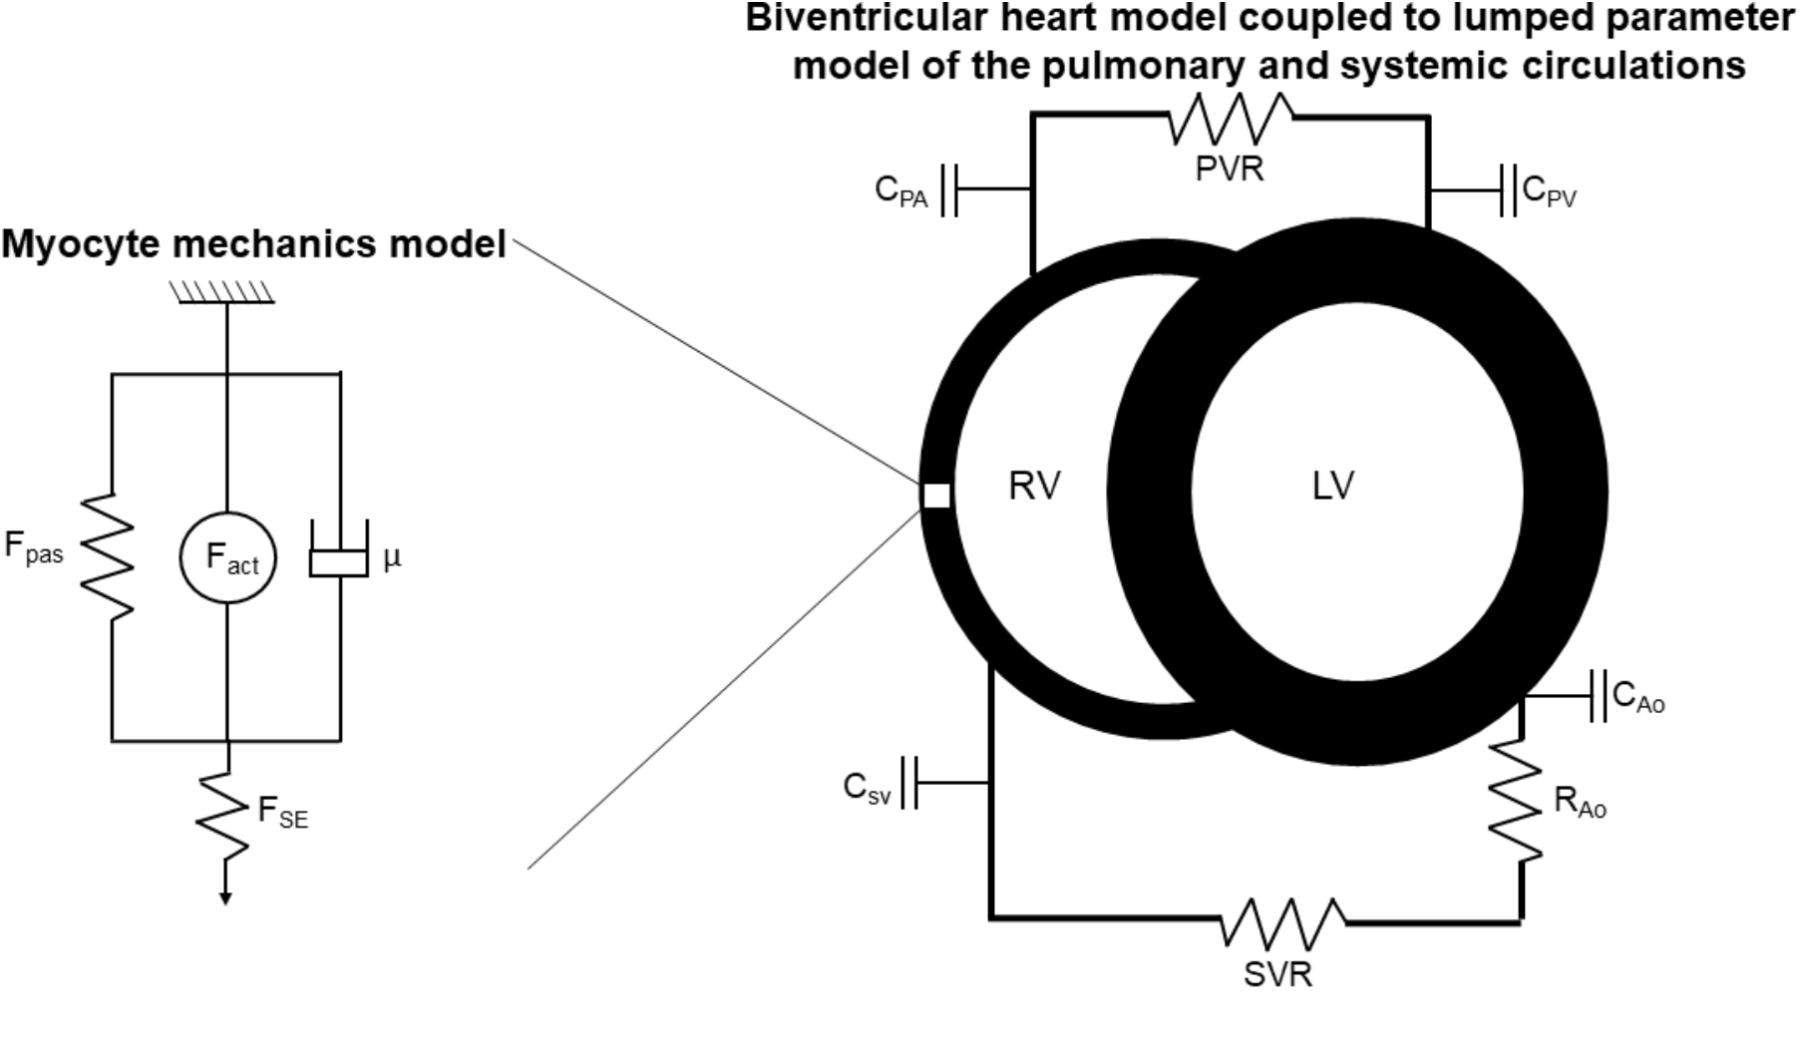
FIGURE 1. Schematic of multiscale computational model adapted from Tewari et al. (2016a,b). Myocyte mechanics model: Fpas: passive force, including contributions of intracellular titin and extracellular collagen, Fact: active force, incorporating actin-myosin cross-bridging kinetics and maximum myocyte calcium-activated force (Fmax), μ: viscous force, FSE: corrective factor to account for sarcomere length. Biventricular heart and lumped parameter circulation models: RV: right ventricle, LV: left ventricle, C: compliance, PA: pulmonary artery, PV: pulmonary veins, SV: systemic veins, Ao: aorta, PVR: pulmonary vascular resistance, SVR: systemic vascular resistance.
where Patria is atrial pressure, Vatria is the atrial volume, and Catria is the time varying atrial compliance depicted in Figure 2.
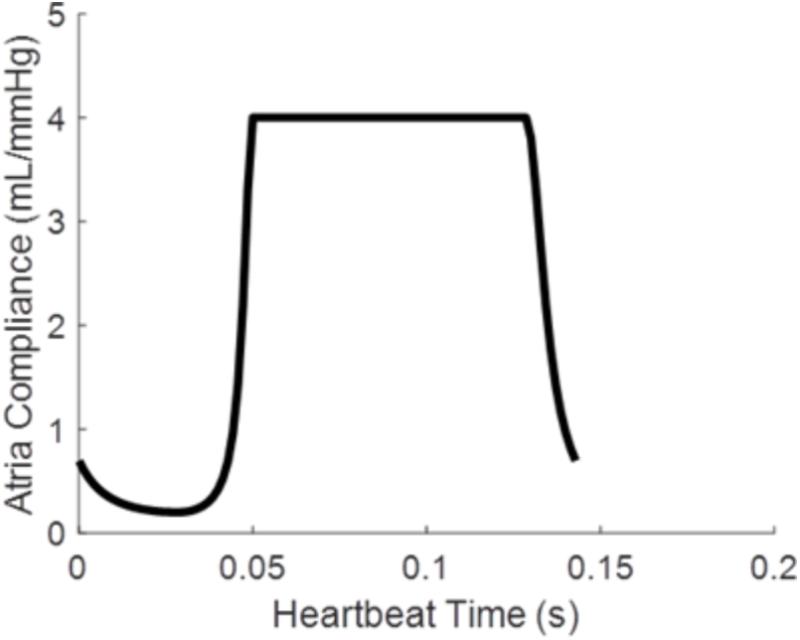
FIGURE 2. Time varying atrial compliance (Catria) for a physiologically realistic rodent heart rate of 420 bpm.
Simulation of Bleomycin-Induced Pulmonary Hypertension
Baseline multiscale model parameters were those used by Tewari et al. (2016b) to model the healthy rodent cardiovascular system. To simulate bleomycin-induced PH, pulmonary vascular resistance (PVR) was increased to match experimental measurements published by Hemnes et al. (2008; Table 1). While Hemnes et al. (2008) didn’t report pulmonary artery compliance (CPA), it is well known that as PVR increases in PH, CPA decreases (Lankhaar et al., 2006, 2008; Saouti et al., 2009) and this loss of compliance is an important component of RV afterload (Wang and Chesler, 2013). Given this lack of data, decreases in CPA in response to Bleo were chosen to match published experimental measurements of CPA in mice with other forms of PH (Tewari et al., 2013; Liu et al., 2015, 2017a; Wang et al., 2018). RV mass was increased to match RV hypertrophy reported by Cowley et al. (2017) in Bleo mice. For all simulations, blood volume and systemic vascular resistance were adjusted to maintain systolic arterial pressures between 110 and 125 mmHg as done previously (Tewari et al., 2016b). Left ventricular function has been shown to be unchanged in the setting of bleomycin-induced PH (Cowley et al., 2015), therefore LV parameters were kept at baseline for all simulations. Simulations were run until the convergence criterion of RV versus LV stroke volume difference less than one percent was met. Convergence typically occurred after approximately 200 heart beats.
Myocardial fibrosis was modeled by increasing the collagen passive force contribution (Concollagen) in the elastic myocardium constitutive model of Rice et al. (2008) while the decrease in maximum myofilament force was represented by decreasing the myosin head stiffness (kstiff,2) (Tewari et al., 2016a). Fibrosis and decreased Fmax were only simulated in the RV free wall, with LV and septum parameters kept at baseline values. The parameter value changes used in simulations of Bleo versus control are shown in Table 2. In order to investigate the individual effects of fibrosis and Fmax, the parameter changes were simulated individually and together.

TABLE 2. Simulation parameters.
In order to control for any potential variations in animal size between the experimental animals, all experimental and model results were normalized to the reference group for either the experiment or simulation. Experimental results for bleomycin exposure were normalized to Control. Simulation results were normalized to Baseline.
Contribution of Myocyte Maximum Force Generation to Right Ventricular Function Independent of RV Afterload
To explore the impact of Fmax on cardiac output (CO) and RV ejection fraction (EF) independent of RV afterload, simulations were performed with five Fmax values evenly spaced between those used in baseline and Bleo simulations with PVR and CPA at baseline values. Simulated CO and EF values were then correlated with Fmax using a linear regression. R squared (R2) of the linear regression was used as a metric of correlation strength.
Impact of Myocyte Targeted Therapy on Right Ventricular Function
A61603 (A6), a selective α1A-adrenergic receptor agonist, has recently been shown to prevent RV failure following Bleo exposure by preserving myocyte force generation (Cowley et al., 2017). Here we used the multiscale model to predict the efficacy of A6 as a therapeutic strategy, instead of as a preventive strategy. Since improved Fmax was the primary mechanism identified for A6 preservation of RV function (Cowley et al., 2017), simulations of A6 treatment included only restored Fmax with no change in afterload (PVR or CPA), hypertrophy or fibrosis. RVF due to Bleo exposure was simulated as described above and depicted in Table 2. A6 treatment of RVF was simulated by matching Fmax values to those measured in isolated RV cardiomyocytes with A6 preventative treatment and Bleo exposure (Bleo + A61603 in Table 2; Cowley et al., 2017). As no experimental results regarding LV function with A6 preventative treatment and Bleo exposure were available, LV parameters were kept at baseline Bleo + A6 simulations. Simulated rescue of RVF with A6 treatment was then compared against experimental prevention of RVF with A6. As described above, experimental and model results were normalized to the reference group for either the experiment or simulation. Experimental results for bleomycin exposure with A6 prevention therapy were normalized to bleomycin exposure alone. Simulation results for bleomycin exposure with A6 rescue treatment were normalized to bleomycin simulation.
Results
Pressure Overload Alone Leads to Right Ventricular Dysfunction
Pulmonary vascular resistance was increased twofold and pulmonary artery compliance (CPA) was decreased to 70% of control levels (Table 2) to match experimental observations of increased PVR in mice following Bleo exposure (Table 1; Hemnes et al., 2008) and experimental observations of decreased CPA in mice with other forms of PH (Tewari et al., 2013; Liu et al., 2015, 2017a; Wang et al., 2018). Simulation of these changes in PVR and CPA resulted in elevations of right ventricular systolic pressure (RVSP) and arterial elastance (Ea) that were similar to experimental findings (Figures 3A,B). Without changes in RV cellular level function or structure, increased afterload alone resulted a reduction in EF similar to experimental results (Figure 4A) with only a modest decrease (<20%) in CO (Figure 4B). Simulation further predicted mild impairments in end-systolic elastance (Ees) (Figure 5A), ventricular-vascular coupling (Figure 5B), and diastolic function as assessed via RV chamber compliance (Figure 5C) in response to pressure overload alone (↑PVR + ↓CPA). Simulated pressure overload resulted in RV dilation with near doubling of RV end diastolic volume which likely contributes to the impaired EF and reduced chamber compliance.
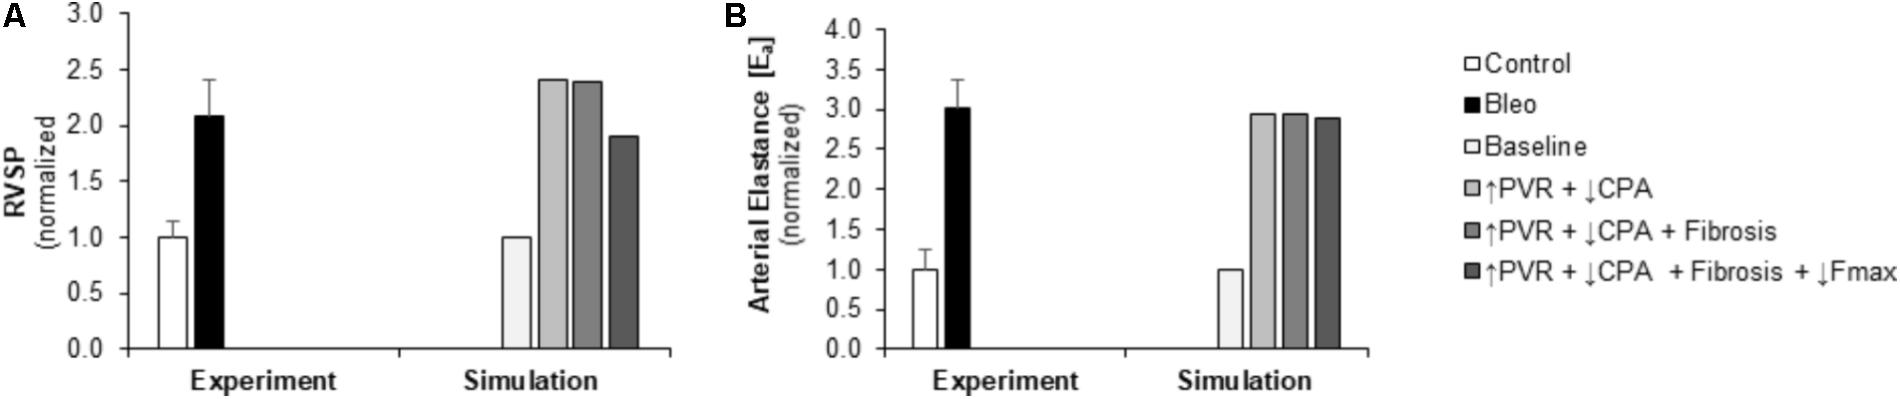
FIGURE 3. Measured and simulated increases in right ventricular afterload due to bleomycin exposure. (A,B) Predicted increases in RVSP and Ea in simulations of pressure overload alone (↑PVR + ↓CPA), with fibrosis (Fibrosis), and decreased myocyte maximum force generation (↓Fmax) match increases compared to control found in experimental measurements in mice exposed to bleomycin from (Hemnes et al., 2008). RVSP: right ventricular systolic pressure, PVR: pulmonary vascular resistance, CPA: pulmonary artery compliance.
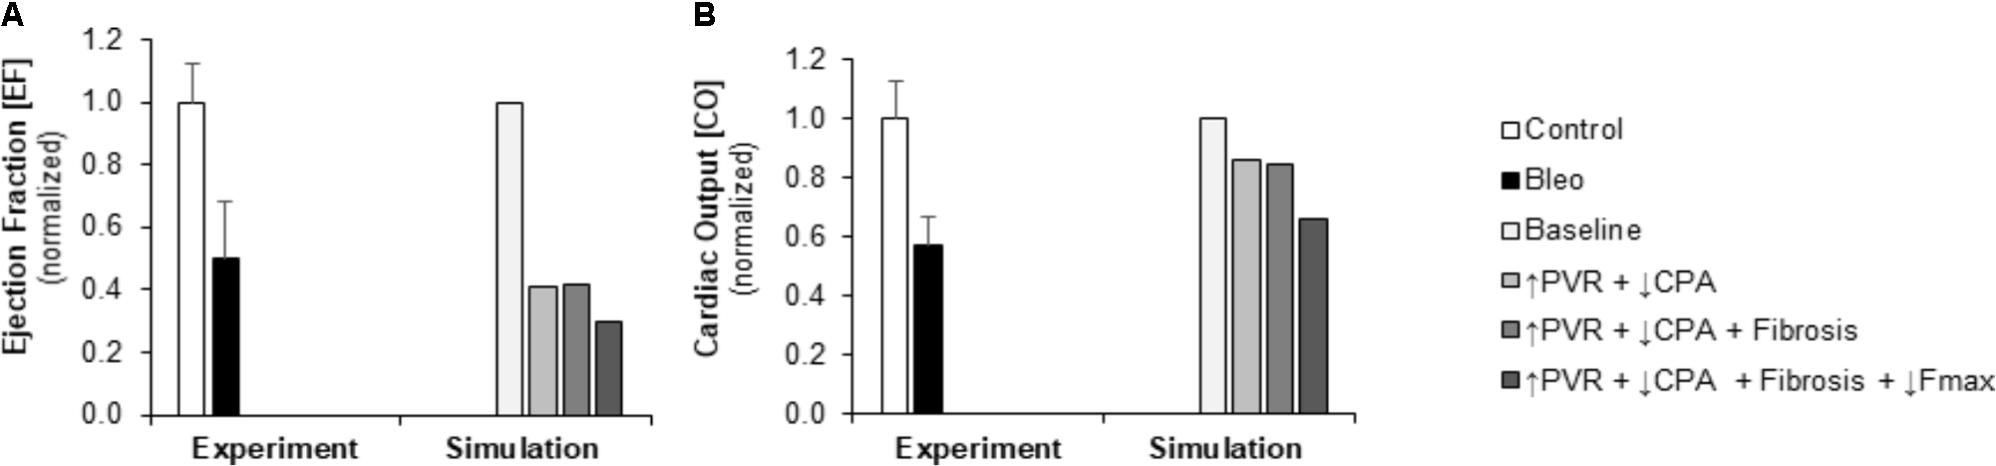
FIGURE 4. Measured and simulated decreases in right ventricular function due to bleomycin exposure. (A) Predicted decreases in EF with pressure overload alone (↑PVR + ↓CPA), fibrosis (Fibrosis), and decreased myocyte maximum force generation (↓Fmax) match decreases compared to control found in experimental measurements in mice exposed to bleomycin from Hemnes et al. (2008). (B) Predicted decreases in cardiac output (CO) with pressure overload alone and with fibrosis are more moderate than the decrease in CO compared to control found experimentally; however, including impaired myocyte force generation predicts decreases in CO that better match experiments (Hemnes et al., 2008).
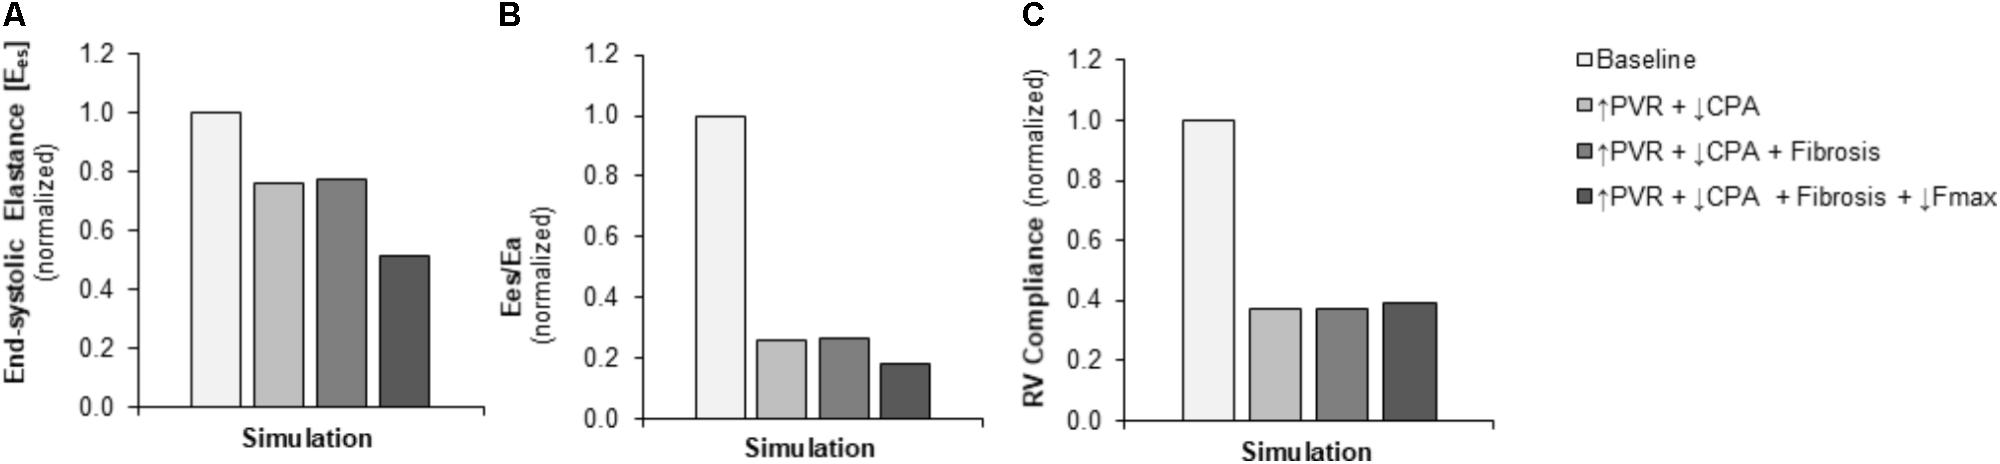
FIGURE 5. Simulated decreases in contractility, ventricular-vascular coupling, and diastolic function. (A) Predicted decrease in RV contractility end-systolic elastance (Ees) in the setting of pressure overload alone (↑PVR + ↓CPA) is moderate with limited additional impact of fibrosis (Fibrosis); the predicted decrease with decreased myocyte maximum force generation (↓Fmax) is substantial. (B) Predicted decrease in ventricular-vascular coupling (Ees/Ea) in the setting of pressure overload alone is dramatic; additional decreases with fibrosis and decreased myocyte maximum force generation are limited. (C) Predicted decrease in RV compliance in the setting of pressure overload alone is substantial without further impairments with fibrosis and reduced myocyte maximum force generation.
Limited Impact of Fibrosis on Right Ventricular Function
To explore the impact of myocardial fibrosis on RV organ level function, simulations were conducted with myocyte passive force increased by a factor of ∼2.7 in addition to the increased RV afterload (↑PVR + ↓CPA+ Fibrosis) to match measured increases in RV interstitial collagen content in (Cowley et al., 2017). As Figures 4, 5 demonstrate, RV fibrosis in the context of increased afterload did not have a significant impact on RV function.
Powerful Impact of Myocyte Force Generation on Right Ventricular Function
To examine in the impact of myocyte force generation on RV organ level function, Fmax was decreased to 64% of control levels in addition to fibrosis and increased afterload (↑PVR + ↓CPA + Fibrosis + ↓Fmax) to match measured decreases in Fmax in (Cowley et al., 2017). Impaired Fmax further decreased CO and EF such that experimental values were more closely matched as compared to increased RV afterload alone (Figures 4A,B). Moreover, simulations predict an almost 50% decrease in Ees (Figure 5A) compared to the modest <20% decrease observed with RV overload alone (↑PVR + ↓CPA).
To ensure these results reflect the impact of reduced Fmax independent of RV fibrosis, simulations with decreased Fmax in the absence of fibrosis were also performed (↑PVR + ↓CPA + ↓Fmax). The consequences of impaired Fmax for organ level RV function were the same in both the presence and absence of RV fibrosis (data not shown). These simulations provide evidence that changes in myocyte Fmax have a powerful impact on RV organ level function and are potentially a key component of the transition from RV dysfunction with maintained CO to RVF.
To further explore this relationship, the impact of Fmax on RV function under baseline conditions (normal PVR and CPA) was examined. As demonstrated in Figure 6, simulations predict a strong, direct correlation between Fmax and RV function as measured by CO or EF.
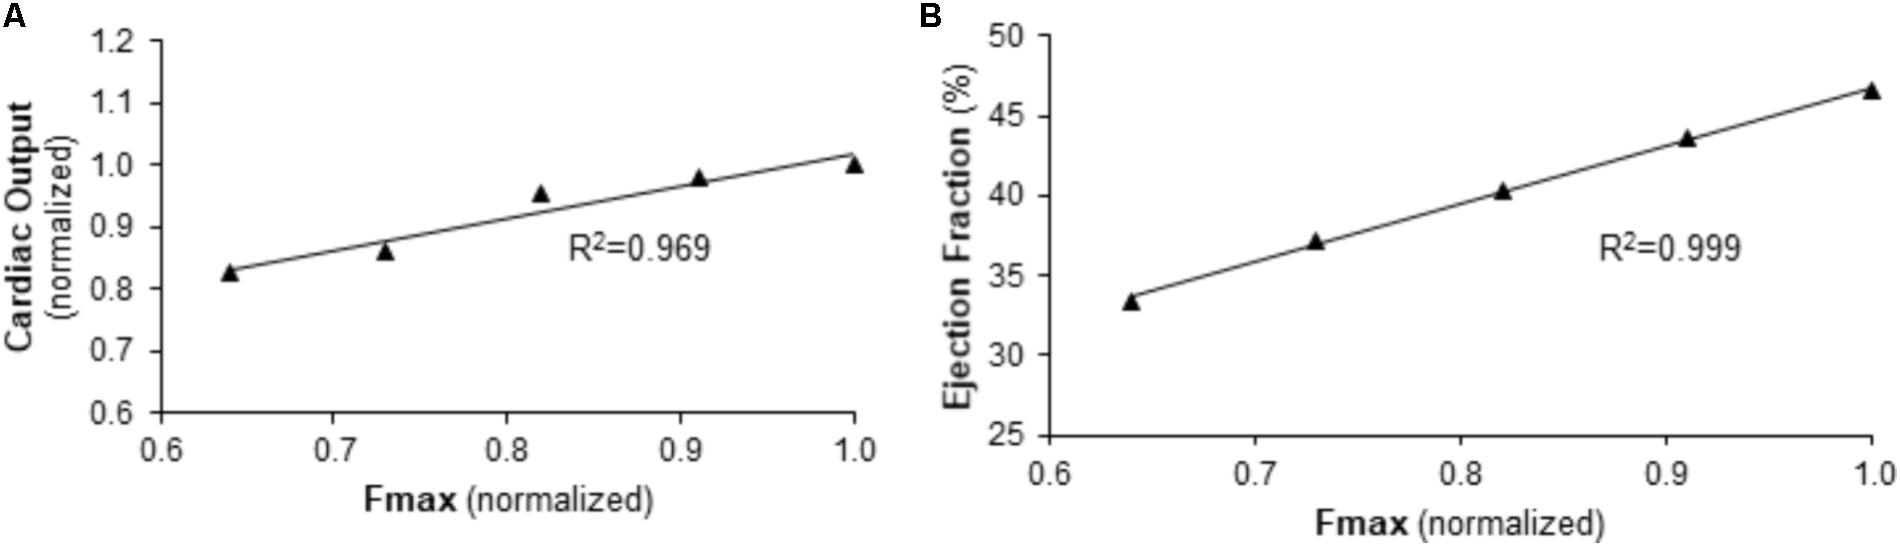
FIGURE 6. Predicted relationship between right ventricular function and maximum myocyte force generation (Fmax) in the context of normal afterload. (A) CO and (B) EF are predicted to be linearly dependent on Fmax for baseline pulmonary vascular resistance and pulmonary artery compliance values.
Myocyte Targeted Therapy Protects Against Development of Right Ventricular Failure
Experimentally, A6 therapy was shown to preserve Fmax at the cellular level and RV fractional shortening at the organ level following Bleo exposure (Cowley et al., 2017). We used the multiscale computational model to investigate the impact of restored Fmax on multiple metrics of RV function in the context of sustained RV afterload, RV fibrosis, and RV hypertrophy. RVF due to Bleo exposure was simulated as described above incorporating both the elevated PVR and decreased CPA in the pulmonary vasculature and the changes in myocardial mechanics (↑PVR + ↓CPA + Fibrosis + ↓Fmax). To model A6 treatment in the setting of Bleo exposure induced RVF, Fmax was adjusted to match experimental results from prevention experiments (Table 2; Cowley et al., 2017). While A6 did not affect arterial elastance, RVSP did increase somewhat in response to restored Fmax (Figures 7A,B). Moreover, A6 improved EF and CO by 20% (Figures 7C,D). Simulation further predicts restored RV contractility as measured by Ees and ventricular-vascular coupling (Figures 7E,F).
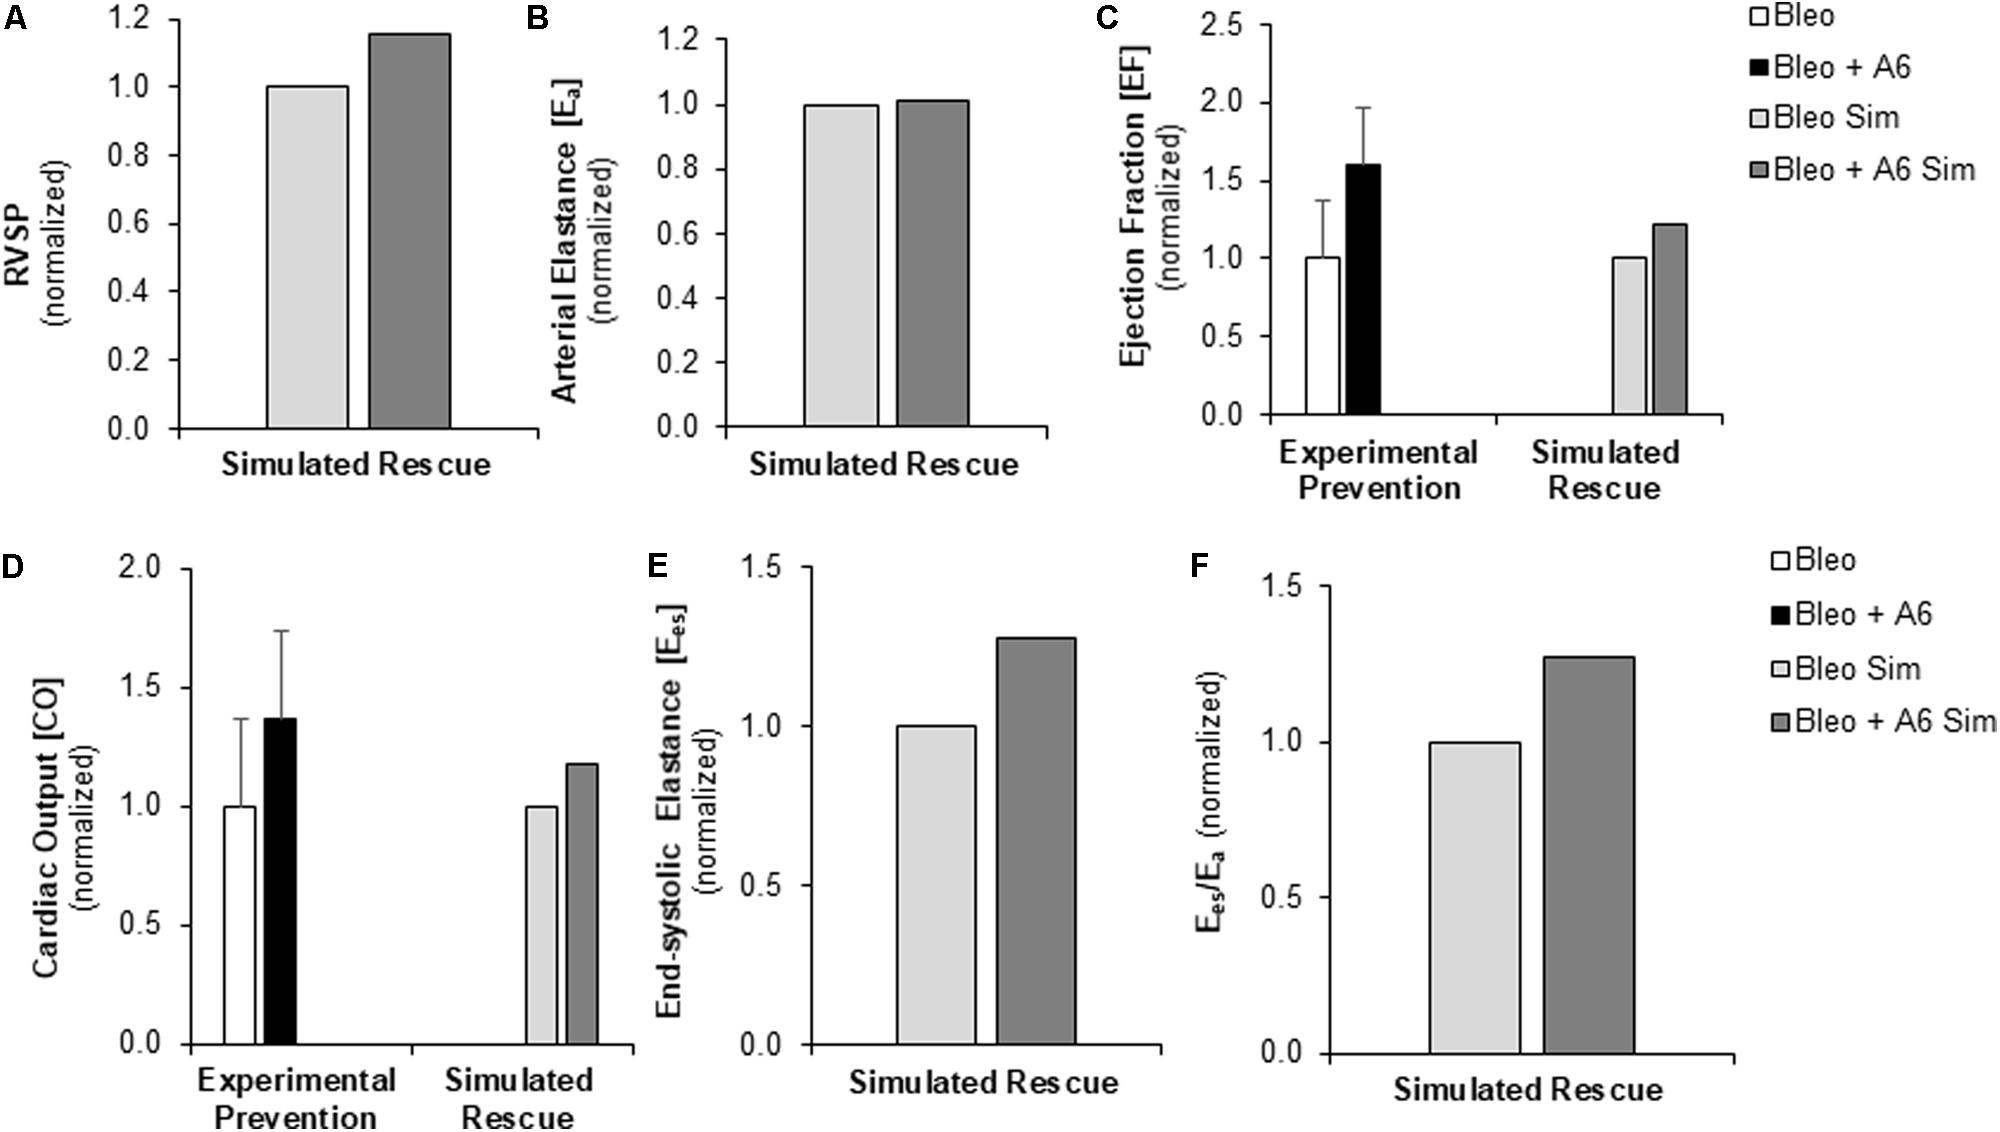
FIGURE 7. Measured prevention and simulated rescue of RVF by A61603 (A6). (A,B) Simulation of improved myocyte maximum force generation due to A6 rescue of RVF (RVF + A6) does not impact degree of pressure overload. Simulated A6 rescue of RVF also results in (C) increased ejection fraction and (D) improved CO that show the same trends as experimental measurements of A6 prevention of RVF (Cowley et al., 2017). (E,F) Simulations further predict A6 rescue of (E) RV contractility (Ees) and (F) ventricular-vascular coupling (Ees/Ea).
Discussion
In this study, we used a multiscale computational model to predict the impact of myocyte and myocardial mechanical changes on RV function using experimental measurements from a mouse model of RVF due to bleomycin-induced PH. Our main findings are:
(1) Reduced Fmax is a key contributor to reduced EF and CO in RVF.
(2) There is a direct link between restored myocyte Fmax and improved RV function following A6 treatment in RVF.
(3) RV fibrosis in the setting of RV pressure overload does not further impair RV function as compared to RV pressure overload alone.
Right ventricular failure is the most common cause of death in PH (Sztrymf et al., 2010). Despite this clinical importance, the adaptation of the RV to pressure overload is poorly understood, especially with regard to the drivers of the transition to failure. Myocyte level molecular, cellular, and mechanical changes have been identified in the setting of RVF (Bogaard et al., 2009; Drake et al., 2011; Gomez-Arroyo et al., 2013; Cowley et al., 2015, 2017; Rain et al., 2016; Wang et al., 2018); however, to date no studies have demonstrated a functional link between cellular level and organ level function changes. This study used a novel multiscale computational modeling approach to evaluate which cellular and structural features associated with RVF have an impact on whole organ function.
Key Role of Decreased Maximum Force Generation in RVF
Decreased Fmax has been shown to be associated with RVF (Versluis et al., 2004; Dai et al., 2006; Cowley et al., 2015, 2017). Additionally, recent results from our lab demonstrate that this feature is preserved in the setting of RV adaptation in a mouse model of PH (Wang et al., 2018). Preserved or even increased Fmax has been shown in large animal models of RV pressure overload without RVF (Walker et al., 2011) and in human PH patients with preserved cardiac output (Rain et al., 2013). This is a key cellular level difference observed between RV adaptation and RV failure. The simulation results provided here demonstrate that decreased Fmax has a powerful impact on RV function and may be a key component of transition to RVF. Simulation of increased RV afterload (↑PVR and ↓CPA) failed to reproduce the observed features of RVF in vivo and rather resulted in a phenotype consistent with RV adaptation. It was only with the inclusion of the observed decreased myocyte maximum force generation that the simulated phenotype predicted RVF consistent with experimental results. This provides strong evidence of the functional impact of RV myocyte Fmax on organ level RV function.
The important organ level functional impact of RV myocyte force generation was further demonstrated in simulations of A6 treatment. Recently published data demonstrated that a primary cellular level result of A6 therapy was preserved myocyte Fmax (Cowley et al., 2017). Simulation of this treatment effect resulted in improved RV function, giving strong evidence of the direct causal link between improved myocyte Fmax and improved EF occurring with A6 treatment. Interestingly, the effect size on RV function measured via non-invasive techniques in vivo was larger than that predicted by simulation. One reason for this difference is that the simulation modeled A6 given as a treatment to rescue RV function after the onset of RVF whereas the experimental protocol was that of prevention with A6 given at the time of bleomycin exposure, prior to the onset of PH and changes in RVF. Additionally, the discrepancies between simulation and experiment likely also indicate that A6 has additional beneficial effects not captured in the simulation that result in an improvement in RV function beyond that due to the improvement in Fmax alone. For example, A6 may improve LV function (not simulated) and thereby improve RV function. Overall, these data show the potential powerful impact of therapies that restore myocyte force generation. While chronic (≥2 weeks) treatment with these therapies have been shown to be beneficial in small animal studies (Cowley et al., 2017), there is a potential for chronic therapy to have negative consequences and further studies of longer term treatments are needed.
The Impact of Fibrosis on RV Function
Fibrosis is considered a histological hallmark of RVF (Bogaard et al., 2009; Drake et al., 2011; Rain et al., 2013, 2014, 2016). Myocardial fibrosis has additionally been demonstrated in several models PH resulting in RV adaptation (Golob et al., 2016; Lahm et al., 2016; Rain et al., 2016). Recently, increased collagen was shown to contribute to increased RV myocyte stiffness in a mouse model of PH (Rain et al., 2016). Interestingly, in the simulations performed here, changes in myocardial collagen content did not cause significant impairment in RV function (diastolic or systolic) beyond that seen with PH alone. We hypothesized that increased myocardial fibrosis would impair diastolic function; however, the simulation did not demonstrate any such association. A moderate degree of diastolic dysfunction occurred in response to pressure overload alone (Figure 5C), which was caused by RV dilation resulting in increased collagen loading. It is likely that in the remodeling RV, not only is the amount of collagen increased but also the loading dynamics are altered, which leads to more diastolic dysfunction associated with fibrosis than simulated here. Recent study by Hill et al. (2014) demonstrated changes in collagen fiber orientation in a mouse model of RV pressure overload. Interestingly, in this model of compensated RV hypertrophy increased myocardial stiffness was shown to be due to myocyte hypertrophy, with minimal changes observed in collagen recruitment or intrinsic stiffness. Both computationally and experimentally, a better understanding of the impact of collagen on organ level function is an important area of future study.
Role of Simulation to Explore Multiscale Structure-Function Relationships
In this study, we adapted a multiscale model of the cardiovascular system which has been tuned to the rodent to explore relationships between myocyte structure and function and right ventricular function. The computational model was improved through the addition of atrial mechanics in order to improve simulation of diastolic pressure-volume relationships and diastolic function. As detailed in the previous sections, the model allows for the exploration of functional links between cellular level changes and organ level changes. Figures 3, 4 highlight the ability of the model to predict changes in hemodynamics and to replicate experimental results. Figure 5 highlights the power of the model to provide additional information on predicted hemodynamic function that is otherwise only available through invasive in vivo tests. Our results predict that ventricular-vascular uncoupling can occur due to pressure overload alone. However, ventricular contractility, measured by Ees, is likely to be preserved or only mildly decreased until there are changes in myocyte force generation. The multiscale model used in this study provides the important opportunity to simulate organ level changes in the context of altered afterload (or preload) with or without cellular level changes. We further demonstrate the ability to recapitulate in vivo treatment results through simulation of changes in cellular level functions. These results highlight the utility of this multiscale computational model as a tool to identify therapeutic targets and to test the in vitro effects of treatments in vivo.
Experience developing, validating, and using multiscale computational models to explore cardiac function is growing (Kerckhoffs et al., 2009; Tewari et al., 2013, 2016a,b; Garbey et al., 2015; Zhang et al., 2016). Adapting and optimizing these tools for evaluation of the RV is an important area of investigation that will allow for testing and validating of hypotheses as well as to help identify which cellular level components to target therapeutically in order to have the largest impact on RV function. Furthermore, models could be tuned to individual patients in the future to account for specific changes in pulmonary vascular function, ventricular geometry and cellular function, and guide treatment.
This study has several limitations that should be noted. In this study a single animal model of RVF was explored. A recent study by our group evaluated the ability of the computational model to predict pathophysiology in three different experimental models of PH (Pewowaruk et al., 2018). Here we focused on one PH model to enable in-depth investigation of the effect of a potential therapy. Another limitation is that, once RV afterload was increased to cause PH, only parameters describing myocardial collagen content and Fmax were altered in simulations. To more fully describe the cellular-level myocardial changes caused by RV pressure overload, additional active and passive myocardial properties such as myocyte passive force, titin concentration, and metabolite concentrations should be investigated for their independent and dependent effects on RV organ level function. In particular, complete evaluation of myocyte function would ideally include measures of twitch velocity of cardiomyocytes, but only myofiber force generation data was available for the bleomycin model of PH. Furthermore, while multiple conditions are considered in this study, each condition is evaluated at only one time point and time dependent changes are not considered either in experimental or simulation results. Future experimental work discerning cardiac adaptation to stress over time will allow for incorporation of growth and remodeling laws into the computational model to simulate and/or predict disease progression. Finally, it is important to note that changes in left ventricular function are not considered in the simulations. As recently discussed by Tabima et al. (2017) in a review of RV and pulmonary vascular interactions, 20–40% of the RV work is due to LV contraction (Santamore et al., 1976; Damiano et al., 1991; Haddad et al., 2008), so changes in LV function can have a large impact on RV function (Tabima et al., 2017). However, LV function has been shown to remain normal in the setting of PH due to bleomycin-exposure (Cowley et al., 2015). Unfortunately, experimental data on LV function in the setting of bleomycin exposure with A6 therapy were not available, thus consideration of any potential effect of A6 on LV function was not incorporated into simulations. The multiscale computational model does provide the ability to investigate interventricular interactions allowing for consideration of LV function as a key variable when experimental results are available. Recent work by our group has explored the impact of LV myocardial infarction on RV function using simulations (Pewowaruk et al., 2018). Despite these limitations, this novel study highlights that impaired myocyte force generation previously shown to be a cellular feature of RVF appears to drive impaired hemodynamic function.
Conclusion
This study gives strong evidence that impaired myocyte maximum force generation is a key feature that directly contributes to hemodynamic hallmarks of RVF. This work uses a multiscale computational model to explore contributions of cellular level changes to organ level function. The model is improved with the addition of atria and is shown to predict in vivo hemodynamic data with reasonable accuracy. Despite limitations, the model further predicts that changes in myocyte force generation but not changes in passive force due to collagen content have a direct impact on RV function in the context of RV pressure overload.
Author Contributions
JP, RP, DT, AB, and NC designed the research. NC, RP, DB, and CC contributed to model development and execution of simulations. JP, RP, NC, AB, and DB contributed to data analysis and interpretation. All authors contributed to the manuscript preparation and approved the final version of the manuscript.
Funding
This work was supported by National Heart, Lung, and Blood Institute Grants R01 HL-086939 (NC, RP, and DT) and T32 HL-110853 (JP), the Grainger Foundation Wisconsin Distinguished Graduate Fellowship (RP), the Thoracic Surgery Foundation for Research and Education Nina Starr Braunwald Fellowship (JP), Department of Veterans Affairs Merit Review Award I01BX000740 (AB), the American Heart Association Grant in Aid 15GRNT25550041 (AB), and NIH R01 HL-072011 (DB).
Conflict of Interest Statement
The authors declare that the research was conducted in the absence of any commercial or financial relationships that could be construed as a potential conflict of interest.
The handling Editor declared a past co-authorship with one of the authors NC.
Acknowledgments
The authors gratefully acknowledge Dr. Byron Zambrano for help with manuscript editing.
References
Bogaard, H. J., Natarajan, R., Henderson, S. C., Long, C. S., Kraskauskas, D., Smithson, L., et al. (2009). Chronic pulmonary artery pressure elevation is insufficient to explain right heart failure. Circulation 120, 1951–1960. doi: 10.1161/circulationaha.109.883843
Champion, H. C., Michelakis, E. D., and Hassoun, P. M. (2009). Comprehensive invasive and noninvasive approach to the right ventricle-pulmonary circulation unit: state of the art and clinical and research implications. Circulation 120, 992–1007. doi: 10.1161/circulationaha.106.674028
Cowley, P. M., Wang, G., Chang, A. N., Makwana, O., Swigart, P. M., Lovett, D. H., et al. (2015). The alpha1A-adrenergic receptor subtype mediates increased contraction of failing right ventricular myocardium. Am. J. Physiol. Heart Circ. Physiol. 309, H888–H896. doi: 10.1152/ajpheart.00042.2015
Cowley, P. M., Wang, G. Y., Joshi, S. K., Swigart, P. M., Lovett, D. H., Simpson, P. C., et al. (2017). alpha1A-subtype adrenergic agonist therapy for failing right ventricle. Am. J. Physiol. Heart Circ. Physiol. 313, H1109–H1118. doi: 10.1152/ajpheart.00153.2017
Dai, T., Ramirez-Correa, G., and Gao, W. D. (2006). Apelin increases contractility in failing cardiac muscle. Eur. J. Pharmacol. 553, 222–228. doi: 10.1016/j.ejphar.2006.09.034
Damiano, R. J. Jr., La Follette, P. Jr., Cox, J. L., Lowe, J. E., and Santamore, W. P. (1991). Significant left ventricular contribution to right ventricular systolic function. Am. J. Physiol. 261(5 Pt 2), H1514–H1524. doi: 10.1152/ajpheart.1991.261.5.H1514
Drake, J. I., Bogaard, H. J., Mizuno, S., Clifton, B., Xie, B., Gao, Y., et al. (2011). Molecular signature of a right heart failure program in chronic severe pulmonary hypertension. Am. J. Respir. Cell Mol. Biol. 45, 1239–1247. doi: 10.1165/rcmb.2010-0412OC
Fan, D., Wannenburg, T., and de Tombe, P. P. (1997). Decreased myocyte tension development and calcium responsiveness in rat right ventricular pressure overload. Circulation 95, 2312–2317. doi: 10.1161/01.CIR.95.9.2312
Garbey, M., Rahman, M., and Berceli, S. (2015). A multiscale computational framework to understand vascular adaptation. J. Comput. Sci. 8, 32–47. doi: 10.1016/j.jocs.2015.02.002
Golob, M. J., Wang, Z., Prostrollo, A. J., Hacker, T. A., and Chesler, N. C. (2016). Limiting collagen turnover via collagenase-resistance attenuates right ventricular dysfunction and fibrosis in pulmonary arterial hypertension. Physiol. Rep. 4:e12815. doi: 10.14814/phy2.12815
Gomez-Arroyo, J., Mizuno, S., Szczepanek, K., Van Tassell, B., Natarajan, R., dos Remedios, C. G., et al. (2013). Metabolic gene remodeling and mitochondrial dysfunction in failing right ventricular hypertrophy secondary to pulmonary arterial hypertension. Circ. Heart Fail. 6, 136–144. doi: 10.1161/circheartfailure.111.966127
Greyson, C. R. (2008). Pathophysiology of right ventricular failure. Crit. Care Med. 36(1 Suppl), S57–S65. doi: 10.1097/01.CCM.0000296265.52518.70
Haddad, F., Hunt, S. A., Rosenthal, D. N., and Murphy, D. J. (2008). Right ventricular function in cardiovascular disease, part I: anatomy, physiology, aging, and functional assessment of the right ventricle. Circulation 117, 1436–1448. doi: 10.1161/circulationaha.107.653576
Hemnes, A. R., Zaiman, A., and Champion, H. C. (2008). PDE5A inhibition attenuates bleomycin-induced pulmonary fibrosis and pulmonary hypertension through inhibition of ROS generation and RhoA/Rho kinase activation. Am. J. Physiol. Lung Cell. Mol. Physiol. 294, L24–L33. doi: 10.1152/ajplung.00245.2007
Hill, M. R., Simon, M. A., Valdez-Jasso, D., Zhang, W., Champion, H. C., and Sacks, M. S. (2014). Structural and mechanical adaptations of right ventricle free wall myocardium to pressure overload. Ann. Biomed. Eng. 42, 2451–2465. doi: 10.1007/s10439-014-1096-3
Kerckhoffs, R. C., Campbell, S. G., Flaim, S. N., Howard, E. J., Sierra-Aguado, J., Mulligan, L., et al. (2009). Multi-scale modeling of excitation-contraction coupling in the normal and failing heart. Conf. Proc. IEEE Eng. Med. Biol. Soc. 2009, 4281–4282. doi: 10.1109/IEMBS.2009.5332708
Lahm, T., Frump, A. L., Albrecht, M. E., Fisher, A. J., Cook, T. G., Jones, T. J., et al. (2016). 17beta-Estradiol mediates superior adaptation of right ventricular function to acute strenuous exercise in female rats with severe pulmonary hypertension. Am. J. Physiol. Lung Cell. Mol. Physiol. 311, L375–L388. doi: 10.1152/ajplung.00132.2016
Lankhaar, J.-W., Westerhof, N., Faes, T. J., Marques, K. M., Marcus, J. T., Postmus, P. E., et al. (2006). Quantification of right ventricular afterload in patients with and without pulmonary hypertension. Am. J. Physiol. Heart Circ. Physiol. 291, H1731–H1737. doi: 10.1152/ajpheart.00336.2006
Lankhaar, J.-W., Westerhof, N., Faes, T. J., Tji-Joong Gan, C., Marques, K. M., Boonstra, A., et al. (2008). Pulmonary vascular resistance and compliance stay inversely related during treatment of pulmonary hypertension. Eur. Heart J. 29, 1688–1695. doi: 10.1093/eurheartj/ehn103
Liu, A., Hacker, T., Eickhoff, J. C., and Chesler, N. C. (2017a). Estrogen preserves pulsatile pulmonary arterial hemodynamics in pulmonary arterial hypertension. Ann. Biomed. Eng. 45, 632–643. doi: 10.1007/s10439-016-1716-1
Liu, A., Philip, J., Vinnakota, K. C., Van den Bergh, F., Tabima, D. M., Hacker, T., et al. (2017b). Estrogen maintains mitochondrial content and function in the right ventricle of rats with pulmonary hypertension. Physiol. Rep. 5:e13157. doi: 10.14814/phy2.13157
Liu, A., Schreier, D., Tian, L., Eickhoff, J. C., Wang, Z., Hacker, T. A., et al. (2014). Direct and indirect protection of right ventricular function by estrogen in an experimental model of pulmonary arterial hypertension. Am. J. Physiol. Heart Circ. Physiol. 307, H273–H283. doi: 10.1152/ajpheart.00758.2013
Liu, A., Tian, L., Golob, M., Eickhoff, J. C., Boston, M., and Chesler, N. C. (2015). 17beta-Estradiol attenuates conduit pulmonary artery mechanical property changes with pulmonary arterial hypertension. Hypertension 66, 1082–1088. doi: 10.1161/hypertensionaha.115.05843
Lumens, J., Delhaas, T., Kirn, B., and Arts, T. (2009). Three-wall segment (TriSeg) model describing mechanics and hemodynamics of ventricular interaction. Ann. Biomed. Eng. 37, 2234–2255. doi: 10.1007/s10439-009-9774-2
Markel, T. A., Wairiuko, G. M., Lahm, T., Crisostomo, P. R., Wang, M., Herring, C. M., et al. (2008). The right heart and its distinct mechanisms of development, function, and failure. J. Surg. Res. 146, 304–313. doi: 10.1016/j.jss.2007.04.003
Pewowaruk, R. J., Philip, J., Tewari, S., Chen, C., Nyaeme, M., Wang, Z., et al. (2018). Multiscale computational analysis of RV mechanoenergetics. J. Biomech. Eng. 140:081001-081001-15. doi: 10.1115/1.4040044
Rain, S., Andersen, S., Najafi, A., Gammelgaard Schultz, J., da Silva Goncalves Bos, D., Handoko, M. L., et al. (2016). Right ventricular myocardial stiffness in experimental pulmonary arterial hypertension: relative contribution of fibrosis and myofibril stiffness. Circ. Heart Fail. 9:e002636. doi: 10.1161/circheartfailure.115.002636
Rain, S., Handoko, M. L., Trip, P., Gan, C. T., Westerhof, N., Stienen, G. J., et al. (2013). Right ventricular diastolic impairment in patients with pulmonary arterial hypertension. Circulation 128, 2016–2025. doi: 10.1161/circulationaha.113.001873
Rain, S., Handoko, M. L., Vonk Noordegraaf, A., Bogaard, H. J., van der Velden, J., and de Man, F. S. (2014). Pressure-overload-induced right heart failure. Pflugers Arch. 466, 1055–1063. doi: 10.1007/s00424-014-1450-1
Rice, J. J., Wang, F., Bers, D. M., and De Tombe, P. P. (2008). Approximate model of cooperative activation and crossbridge cycling in cardiac muscle using ordinary differential equations. Biophys. J. 95, 2368–2390. doi: 10.1529/biophysj.107.119487
Santamore, W. P., Lynch, P. R., Heckman, J. L., Bove, A. A., and Meier, G. D. (1976). Left ventricular effects on right ventricular developed pressure. J. Appl. Physiol. 41, 925–930. doi: 10.1152/jappl.1976.41.6.925
Saouti, N., Westerhof, N., Helderman, F., Marcus, J. T., Stergiopulos, N., Westerhof, B. E., et al. (2009). RC time constant of single lung equals that of both lungs together: a study in chronic thromboembolic pulmonary hypertension. Am. J. Physiol. Heart Circ. Physiol. 297, H2154–H2160. doi: 10.1152/ajpheart.00694.2009
Sato, S., Kato, S., Arisaka, Y., Takahashi, H., Takahashi, K., and Tomoike, H. (1993). Changes in pulmonary hemodynamics during normoxia and hypoxia in awake rats treated with intratracheal bleomycin. Tohoku J. Exp. Med. 169, 233–244. doi: 10.1620/tjem.169.233
Senzaki, H., Chen, C.-H., and Kass, D. A. (1996). Single-beat estimation of end-systolic pressure-volume relation in humans. Circulation 94, 2497–2506. doi: 10.1161/01.CIR.94.10.2497
Sztrymf, B., Souza, R., Bertoletti, L., Jais, X., Sitbon, O., Price, L. C., et al. (2010). Prognostic factors of acute heart failure in patients with pulmonary arterial hypertension. Eur. Respir. J. 35, 1286–1293. doi: 10.1183/09031936.00070209
Tabima, D. M., Philip, J. L., and Chesler, N. C. (2017). Right ventricular-pulmonary vascular interactions. Physiology 32, 346–356. doi: 10.1152/physiol.00040.2016
Tewari, S. G., Bugenhagen, S. M., Palmer, B. M., and Beard, D. A. (2016a). Dynamics of cross-bridge cycling, ATP hydrolysis, force generation, and deformation in cardiac muscle. J. Mol. Cell. Cardiol. 96, 11–25. doi: 10.1016/j.yjmcc.2015.02.006
Tewari, S. G., Bugenhagen, S. M., Vinnakota, K. C., Rice, J. J., Janssen, P. M. L., and Beard, D. A. (2016b). Influence of metabolic dysfunction on cardiac mechanics in decompensated hypertrophy and heart failure. J. Mol. Cell. Cardiol. 94, 162–175. doi: 10.1016/j.yjmcc.2016.04.003
Tewari, S. G., Bugenhagen, S. M., Wang, Z., Schreier, D. A., Carlson, B. E., Chesler, N. C., et al. (2013). Analysis of cardiovascular dynamics in pulmonary hypertensive C57BL6/J mice. Front. Physiol. 4:355. doi: 10.3389/fphys.2013.00355
Thenappan, T., Shah, S. J., Rich, S., Tian, L., Archer, S. L., and Gomberg-Maitland, M. (2010). Survival in pulmonary arterial hypertension: a reappraisal of the NIH risk stratification equation. Eur. Respir. J. 35, 1079–1087. doi: 10.1183/09031936.00072709
Versluis, J. P., Heslinga, J. W., Sipkema, P., and Westerhof, N. (2004). Contractile reserve but not tension is reduced in monocrotaline-induced right ventricular hypertrophy. Am. J. Physiol. Heart Circ. Physiol. 286, H979–H984. doi: 10.1152/ajpheart.00536.2002
Vonk Noordegraaf, A., and Galie, N. (2011). The role of the right ventricle in pulmonary arterial hypertension. Eur. Respir. Rev. 20, 243–253. doi: 10.1183/09059180.00006511
Walker, L. A., Walker, J. S., Glazier, A., Brown, D. R., Stenmark, K. R., and Buttrick, P. M. (2011). Biochemical and myofilament responses of the right ventricle to severe pulmonary hypertension. Am. J. Physiol. Heart Circ. Physiol. 301, H832–H840. doi: 10.1152/ajpheart.00249.2011
Wang, G., Yeh, C. C., Jensen, B. C., Mann, M. J., Simpson, P. C., and Baker, A. J. (2010). Heart failure switches the RV {alpha}1-adrenergic inotropic response from negative to positive. Am. J. Physiol. Heart Circ. Physiol. 298, H913–H920. doi: 10.1152/ajpheart.00259.2009
Wang, Z., and Chesler, N. C. (2013). Pulmonary vascular mechanics: important contributors to the increased right ventricular afterload of pulmonary hypertension. Exp. Physiol. 98, 1267–1273. doi: 10.1113/expphysiol.2012.069096
Wang, Z., Patel, J. R., Schreier, D. A., Hacker, T. A., Moss, R. L., and Chesler, N. C. (2018). Organ-level right ventricular dysfunction with preserved Frank-Starling mechanism in a mouse model of pulmonary arterial hypertension. J. Appl. Physiol. 124, 1244–1253. doi: 10.1152/japplphysiol.00725.2017
Wang, Z., Schreier, D. A., Hacker, T. A., and Chesler, N. C. (2013). Progressive right ventricular functional and structural changes in a mouse model of pulmonary arterial hypertension. Physiol. Rep. 1:e00184. doi: 10.1002/phy2.184
Williams, J. H. Jr., Bodell, P., Hosseini, S., Tran, H., and Baldwin, K. M. (1992). Haemodynamic sequelae of pulmonary fibrosis following intratracheal bleomycin in rats. Cardiovasc. Res. 26, 401–408. doi: 10.1093/cvr/26.4.401
Keywords: pulmonary hypertension, computational modeling, right ventricular failure, myoycte mechanics, fibrosis, myocyte force generation, right ventricle
Citation: Philip JL, Pewowaruk RJ, Chen CS, Tabima DM, Beard DA, Baker AJ and Chesler NC (2018) Impaired Myofilament Contraction Drives Right Ventricular Failure Secondary to Pressure Overload: Model Simulations, Experimental Validation, and Treatment Predictions. Front. Physiol. 9:731. doi: 10.3389/fphys.2018.00731
Received: 08 February 2018; Accepted: 25 May 2018;
Published: 27 June 2018.
Edited by:
Rebecca R. Vanderpool, The University of Arizona, United StatesReviewed by:
Lucio Barile, Cardiocentro Ticino, SwitzerlandPasquale Pagliaro, Università degli Studi di Torino, Italy
Daniela Valdez-Jasso, University of California, San Diego, United States
Copyright © 2018 Philip, Pewowaruk, Chen, Tabima, Beard, Baker and Chesler. This is an open-access article distributed under the terms of the Creative Commons Attribution License (CC BY). The use, distribution or reproduction in other forums is permitted, provided the original author(s) and the copyright owner are credited and that the original publication in this journal is cited, in accordance with accepted academic practice. No use, distribution or reproduction is permitted which does not comply with these terms.
*Correspondence: Naomi C. Chesler, Y2hlc2xlckBlbmdyLndpc2MuZWR1; bmFvbWkuY2hlc2xlckB3aXNjLmVkdQ==