 Huimei An
 Hongzhen Fan
 Yajun Yun
 Song Chen
 Zhiren Wang
- HuiLongGuan Clinical Medical School, Beijing HuiLongGuan Hospital, Peking University, Beijing, China
Objectives: The aim of the present study was to investigate a potential relationship between metabolic parameters and steady-state plasma concentrations of olanzapine (OLA) and its metabolite, 4-N'-desmethyl-olanzapine (DMO) in patients with schizophrenia taking therapeutic doses.
Methods: A total of 352 inpatients, diagnosed with schizophrenia according to the DSM-V criteria and treated with OLA, were investigated. The plasma concentrations of OLA and DMO were measured by high-performance liquid chromatography-mass spectrometry (HPLC-MS/MS). Fasting blood samples were measured for insulin, glucose, total cholesterol (TC), triglycerides (TG), high-density lipoprotein cholesterol (HDL-c), low-density lipoprotein cholesterol (LDL-c), C-reactive protein (CRP) and homocysteine, and differences in these parameters were investigated in relation to plasma concentrations of OLA and DMO.
Results: Lower plasma DMO concentrations were associated with higher glucose and TG levels and homeostasis model assessment of insulin resistance (HOMA-IR), while higher plasma OLA concentrations were associated with higher CRP and homocysteine levels in the OLA-treated patients with schizophrenia.
Conclusion: These results demonstrate that OLA and its metabolite DMO may have different effects on OLA-induced metabolic abnormalities. DMO might have a counteracting effects on glucose-insulin homeostasis and lipid metabolic abnormalities, which suggests that regular measure of various metabolic parameters and drug monitoring on both OLA and DMO are recommended in OLA-treated patients with schizophrenia.
Introduction
Olanzapine (OLA) is one of the most prescribed atypical antipsychotics for the treatment of schizophrenia. It has a lower incidence of extrapyramidal adverse effects and better therapeutic efficacy than other antipsychotics (1), but is associated with a higher propensity for metabolic abnormalities (2). Therefore, the superiority in clinical efficacy of OLA should be weighed against the metabolic adverse effects when comparing OLA with other antipsychotics (3).
OLA has a high affinity for various receptors (4), and is extensively metabolized after oral administration. It is primarily metabolized by glucuronyltransferase to OLA 10-N-glucuronide, by flavin-containing monooxygenase system to OLA N-oxide, by the major pathway of CYP1A2 to 4-N'-desmethyl-olanzapine (DMO), and by the minor pathway of CYP2D6 to 2-hydroxymethyl OLA (5). Even though OLA 10-N-glucuronide is the most abundant metabolite, DMO is reported to be more strongly associated with the clearance of OLA (6).
Numerous studies have investigated the associations between serum or plasma concentrations of OLA and metabolic abnormalities, including weight gain, impaired glucose metabolism, diabetes mellitus, and dyslipidemia (7–11). A previous review reported a dose-response relationship between OLA serum concentrations and metabolic outcomes (9). Furthermore, a recent study reported the high prevalence of prediabetes and metabolic abnormalities among the schizophrenia patients treated with OLA, putting them at high risk for later cardiovascular disease and type 2 diabetes (12).
In addition to the parent drug OLA, some studies have focused on the relationship between the OLA metabolite DMO and metabolic abnormalities. A recent animal study further reported that DMO can induce a remarkable loss of body weight and fat mass in obese mice and improve insulin resistance and energy expenditure, suggesting that DMO might directly impact the metabolic, endocrinal, and inflammatory effects of OLA (13). Lu et al. reported that in humans, a DMO plasma concentration >5.63 ng/mL is a negative predictor of metabolic syndrome, while COLA/CDMO ratio between 3 and 6 might maximize the therapeutic efficacy and minimize the metabolic adverse effects in OLA-treated schizophrenia patients (14, 15). Although a number of studies have investigated the relationship between DMO plasma concentrations and body weight, waist circumference, and some metabolic parameters, their results are inconsistent (7, 16), and the exact effects of DMO on various metabolic parameters are still unknown. Thus, the aim of this study was to investigate the potential relationships between metabolic parameters and steady-state plasma concentrations of OLA and DMO in schizophrenic patients on therapeutic doses.
Materials and Methods
Participants
A total of 325 inpatients who fulfilled the DSM-V diagnostic criteria of schizophrenia were recruited in this retrospective study. All were stable schizophrenic inpatients receiving a fixed dose of OLA (5–20 mg/day) orally for at least 6 months. The daily doses were determined by the physician who was treating the patients. The following information: demographic data, prescribed dose, time of last dose adjustment, time of last drug intake, date of blood sampling, psychiatric diagnosis, and concomitant medication were obtained from the medical record system. Patients treated with sustained-release OLA, carbamazepine and fluvoxamine and other antipsychotics were excluded from the study. In addition, patients with substance addiction, known diabetes mellitus or other physical disease that could influence metabolic parameters were excluded. The study was approved by the Review Board of Beijing Hui-Long-Guan Hospital. Written informed consent for therapeutic drug monitoring (TDM) of OLA was not required as it was a part of clinical routine of blood test.
Blood Sampling
Blood samples were drawn in the morning generally between 7 and 8 a.m. under fasting conditions, ~12 h after the last dose of OLA. The blood samples were subjected to either biochemical analysis or immediately centrifuged for 10 min at 3,000 g at 4°C. The plasma samples were collected and stored at −20°C until analysis for determination of OLA and DMO, which was completed within 5 days.
Determination of the Plasma Concentrations of OLA and DMO
The steady-state plasma concentrations of OLA and DMO were measured by the high-performance liquid chromatography-tandem mass spectrometry (HPLC-MS/MS) method, which was detailed in our previous study (17). Briefly, plasma samples of 100 μl were extracted with 300 μl acetonitrile (containing 15 ng/ml d8-olanzapine) by agitation for 30 s and centrifuged for 10 min, and then 150 μl of supernatant was injected into the HPLC-MS/MS system. The calibration curves of OLA and DMO was linear in the concentration range of 3.2–160 and 1.6–80 ng/ml, respectively. The detection limits of OLA and DMO were 0.4 and 0.3 ng/ml, respectively. The intra and inter-day precision and relative errors were < 15%.
Determination of Metabolic Parameters
The serum levels of insulin, glucose, total cholesterol (TC), triglycerides (TG), high-density lipoprotein cholesterol (HDL-c), low-density lipoprotein cholesterol (LDL-c), C-reactive protein (CRP) and homocysteine were measured by commercially available kits (Leadman Biotechnology Co Ltd, Beijing, China) using an automatic biochemistry analyzer AU2700 (Olympus, Japan). The homeostasis model assessment of insulin resistance (HOMA-IR), was calculated using the equation HOMA-IR = fasting insulin (mU/L)*fasting glucose (mmol/L)/22.5.
Statistical Analyses
Statistical analyses were performed using the SPSS 20.0. Kolmogorov-Smirnov test to analyze the normality. Descriptive statistics were presented as the mean ± standard deviation (SD) for continuous variables and the rate for discrete variables. The dose-corrected plasma concentrations of OLA (COLA/D), DMO (CDMO/D), and the CDMO/COLA ratio were calculated. Spearman's rank order correlation analysis was used to assess the correlation between variables. Modified Bonferroni's method was used to correct possible errors during multiple tests (18). Further, multiple regression analysis (enter method) was performed to assess the association of each metabolic parameter and COLA and CDMO after controlling for confounding factors, including age, gender, weight, and dose and duration of OLA. The significance level was set to p < 0.05.
Results
Demographic and Metabolic Characteristics
A total of 352 inpatients with schizophrenia under TDM for OLA were included in this study. Table 1 shows the demographic and metabolic characteristics of the study participants. The daily OLA dose was positively correlated with COLA (r = 0.567, p < 0.001) and CDMO (r = 0.569, p < 0.001), respectively. CDMO was significantly correlated with COLA (r = 0.606, p < 0.001). Age was negatively correlated with the daily OLA dose (r = −0.355, p < 0.001), COLA (r = −0.176, p < 0.001) and CDMO (r = −0.258, p < 0.001), respectively. Weight was positively correlated with the daily OLA dose (r = 0.106, p = 0.048), but negatively correlated with COLA (r = −0.114, p = 0.034) and CDMO (r = −0.212, p < 0.001). There were no sex differences in the daily OLA dose and CDMO (both p > 0.05), but female patients showed significantly higher COLA than male patients (57.8 ± 27.2 ng/ml for male and 69.4 ± 30.5 ng/ml for female, p < 0.001).
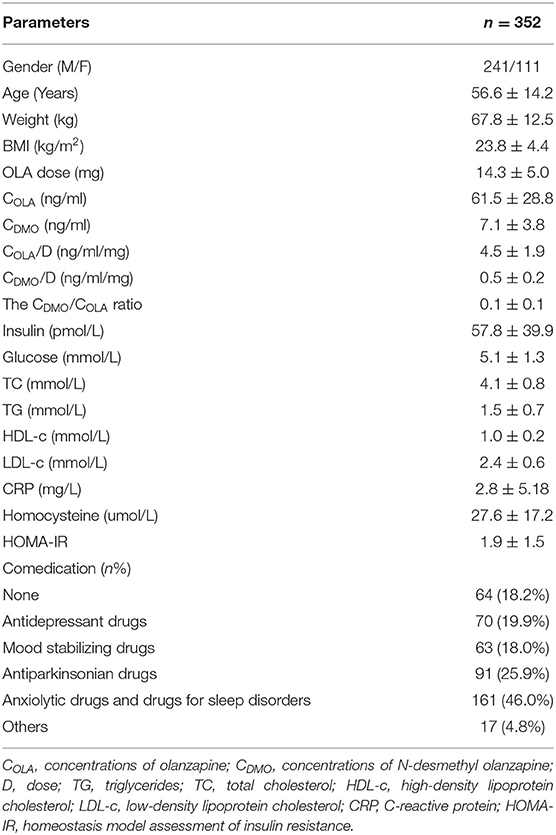
Table 1. Demographic and metabolic characteristics of study subjects.
Relationship Between OLA, DMO and Glucose, Insulin
Simple correlation analysis revealed that COLA was positively correlated with insulin levels, glucose levels, and HOMA-IR. After Bonferroni's correction, only the correlation of COLA with HOMA-IR remained statistically significant (p < 0.05).
Simple correlation analysis revealed that CDMO/D and CDMO/COLA ratios were negatively correlated with insulin levels, glucose levels, and HOMA-IR. After Bonferroni's correction, these negative correlations remained statistically significant (all p < 0.05) (Table 2).
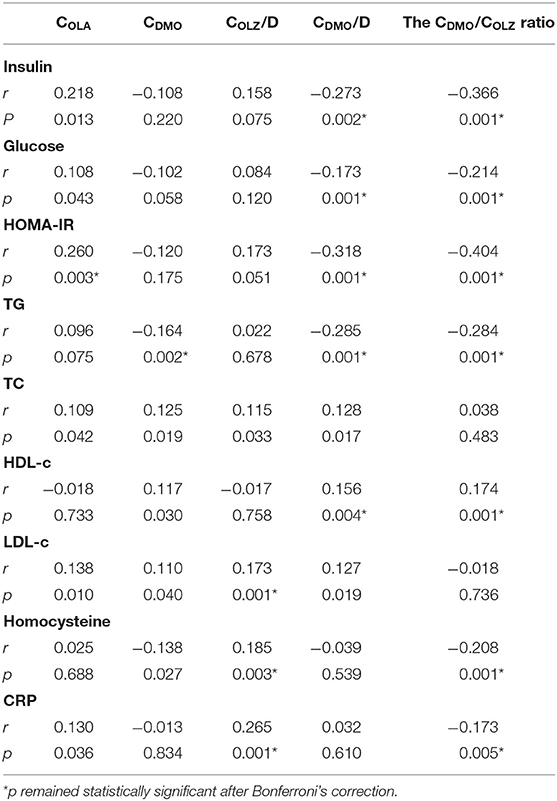
Table 2. Correlations of COLA, CDMO, COLA/D, CDMO/D and the CDMO/COLA ratio with metabolic parameters.
Further, multiple regression analysis revealed that lower CDMO was associated with higher glucose levels (β = −0.212, t = −2.710, p = 0.007) and higher HOMA-IR (β = −0.298, t = −2.071, p = 0.042) after controlling for age, gender, weight, and dose and duration of OLA.
Relationship Between OLA, DMO, and Lipids
Simple correlation analysis revealed that COLA was positively correlated with TC and LDL-c levels; CDMO positively correlated with TC, HDL-c, and LDL-c levels but negatively with TG levels. After Bonferroni's correction, only the negative correlation of CDMO with TG levels remained statistically significant (p < 0.05).
Simple correlation analysis revealed that COLA/D was positively correlated with TC and LDL-c levels; CDMO/D positively correlated with TC, HDL-c, and LDL-c levels but negatively with TG levels; CDMO/COLA ratio positively correlated with HDL-c levels but negatively with TG levels (Table 2). After Bonferroni's correction, the positive correlation of COLA/D with LDL-c levels and negative correlations of CDMO/D and CDMO/COLA ratio with TG and HDL-c levels remained statistically significant (all p < 0.05).
Further, multiple regression analysis revealed that lower CDMO was associated with higher TG levels (β = −0.232, t = −3.168, p = 0.002) after controlling for age, gender, weight, and dose and duration of OLA.
Relationship Between OLA, DMO and Homocysteine, CRP
Simple correlation analysis revealed that COLA was positively correlated with CRP levels; CDMO negatively correlated with homocysteine levels. However, neither of the two correlations passed Bonferroni's correction.
Simple correlation analysis revealed that COLA/D was positively correlated with homocysteine and CRP levels, but the CDMO/COLA ratio was negatively correlated with both. After Bonferroni's correction, these correlations remained statistically significant (all p < 0.05) (Table 2).
Further, multiple regression analysis revealed that higher COLA was associated with higher homocysteine (β = 0.245, t = 2.556, p = 0.011) and CRP levels (β = 0.254, t = 2.535, p = 0.012) after controlling for age, gender, weight, and dose and duration of OLA.
Discussion
Metabolic abnormalities are associated with OLA treatment in patients with schizophrenia. The present study found that higher plasma COLA was associated with higher homocysteine and CRP levels, while lower plasma CDMO was associated with higher glucose and TG levels and HOMA-IR. These results suggest that OLA and its metabolite DMO may have different effects on OLA-induced metabolic abnormalities. DMO might have a counteracting effects on glucose-insulin homeostasis and lipid metabolic abnormalities.
The first finding of the present study is that lower plasma CDMO was associated with higher glucose and TG levels and HOMA-IR in OLA-treated patients with schizophrenia. The findings are in accordance with those of previous studies by Melkersson (7, 16). Similarly, another study observed negative correlations of CDMO with glucose levels, and CDMO/D with insulin levels (14). Additionally, a recent animal study found that DMO improves insulin resistance and energy expenditure in mice with high-fat-diet–induced obesity (13). Although it failed to pass Bonferroni's correction, this study found that COLA was positively correlated with glucose, insulin levels and HOMA-IR. Patients receiving OLA exhibited significantly higher insulin and glucose levels than those receiving conventional antipsychotics, indicating that OLA has a direct stimulating role on insulin secretion from pancreatic beta cells, or may simultaneously act secondary to insulin resistance (19, 20). Thus, we speculated that OLA and DMO could have different effects on glucose-insulin homeostasis, the concentration-dependent metabolic abnormalities of OLA might be complicated by the counteracting effects of DMO (9). Lu et al. previously reported that COLA ≥ 22.77 ng/mL is a predictor of moderate clinical efficacy, CDMO > 5.63 ng/mL is associated with reduced risk of metabolic syndrome, and COLA/CDMO ratio between 3 and 6 may maximize the therapeutic efficacy and minimize the metabolic adverse effects in OLA-treated patients with schizophrenia (15, 21). Therefore, these results demonstrated that drug monitoring of both OLA and DMO is a valuable method to improve the therapeutic efficacy and decrease the metabolic adverse effects.
The second finding of the present study is that higher plasma COLA was associated with higher CRP levels. Similarly, a recent study found a trend toward a positive correlation between serum COLA/D and CRP levels in a naturalistic setting (22). C-reactive protein (CRP) is a systemic inflammatory marker associated with obesity, insulin resistance, and cardiovascular disease (23). Previous studies have reported that CRP levels are higher in patients treated with OLA (24–26); however, it is still uncertain whether this is directly associated with OLA treatment or indirectly associated with OLA-induced side effects. Interestingly, a recent meta-analysis reported that CRP levels were increased in patients with schizophrenia but is not altered by antipsychotic medication, notwithstanding whether these were typical or atypical antipsychotics (27). Therefore, although CRP levels were found to be correlated with COLA in this study, the correlation should be interpreted with more caution.
The third finding of the present study is that higher plasma COLA was associated with higher homocysteine levels in the OLA-treated patients with schizophrenia. Few studies have explored the association between homocysteine levels and plasma COLA or CDMO. The only study to do so reported a positive correlation between COLA and homocysteine levels and a marginally positive correlation between CDMO and homocysteine levels (14). Homocysteine is a risk factor for cardiovascular disease and is associated with a variety of neurological and psychiatric diseases (28–30). Numerous studies have further reported elevated homocysteine levels in first-episode (31–33) and chronic schizophrenia patients (29, 34, 35). Elevated homocysteine levels are considered to be a pathophysiological symptom of schizophrenia. Several studies have previously investigated the effects of antipsychotics on homocysteine levels in schizophrenia, but with inconsistent results. Some studies reported that homocysteine levels were decreased after antipsychotic treatment in schizophrenia (31), others found that the homocysteine levels did not change (36). Furthermore, Dicker-Brown et al.'s study demonstrated that glucose and insulin might influence homocysteine metabolism, possibly by affecting the activity of cystathionine-beta-synthase and methylenetetrahydrofolate reductase (37). Therefore, we speculated that the possible explanations for the association between the plasma COLA and homocysteine levels might be related to the impaired glucose–insulin homeostasis in the OLA-treated patients with schizophrenia.
There are several limitations to the present study. First, this was a retrospective study, several potential confounders, such as diet, exercise, co-medication and disease severity were not considered. Therefore, these correlations should be interpreted with more caution. Second, in the present study, only OLA and its metabolite DMO were analyzed, the possible role of other metabolites (38) on glucose-insulin homeostasis and lipid metabolism therefore could not be evaluated. Third, although a number of significant correlations were found, with plasma COLA generally being associated with a worsening of metabolic parameters and plasma CDMO the opposite, the strength of these associations was not particularly strong. It is still not enough to accurately clarify the effect of DMO on metabolic parameters in patients with schizophrenia treated with OLA based on available clinical data. Further studies in animal are needed to better understand the metabolic effects of DMO.
Conclusion
In conclusion, the present study found that higher plasma COLA was associated with higher CRP and homocysteine levels, and lower plasma CDMO was associated with higher glucose and TG levels and HOMA-IR in the OLA-treated patients with schizophrenia. These findings demonstrate that DMO might counteract the effects on OLA-induced metabolic abnormalities, which suggests that maintaining CDMO/COLA ratio in a suitable range may minimize the metabolic side effects in OLA-treated patients with schizophrenia. Therefore, regular measure of various metabolic parameters and drug monitoring on both OLA and DMO are recommended for patients receiving OLA treatment.
Data Availability Statement
The original contributions presented in the study are included in the article/supplementary material, further inquiries can be directed to the corresponding authors.
Ethics Statement
The studies involving human participants were reviewed and approved by the Review Board of Beijing Hui-Long-Guan Hospital. Written informed consent for participation was not required for this study in accordance with the national legislation and the institutional requirements.
Author Contributions
FY and HA were responsible for the study design, manuscript preparation, and providing the funding for the study. YY, SC, BM, and ZW were responsible for recruiting the patients and collecting clinical data. SQ and JS were responsible for drug assays. HF was responsible for statistical analysis. All authors have contributed to and have approved the final manuscript.
Funding
This study was supported by grants from Beijing Municipal Science & Technology Commission No. Z191100006619020. The supporters had no role in the design, analysis, interpretation, or publication of this study.
Conflict of Interest
The authors declare that the research was conducted in the absence of any commercial or financial relationships that could be construed as a potential conflict of interest.
Publisher's Note
All claims expressed in this article are solely those of the authors and do not necessarily represent those of their affiliated organizations, or those of the publisher, the editors and the reviewers. Any product that may be evaluated in this article, or claim that may be made by its manufacturer, is not guaranteed or endorsed by the publisher.
Acknowledgments
We would like to thank all our study participants to take part in this study.
References
1. Aringhieri S, Carli M, Kolachalam S, Verdesca V, Cini E, Rossi M, et al. Molecular targets of atypical antipsychotics: from mechanism of action to clinical differences. Pharmacol Ther. (2018) 192:20–41. doi: 10.1016/j.pharmthera.2018.06.012
2. Lieberman JA, Stroup TS, Mcevoy JP, Swartz MS, Rosenheck RA, Perkins DO, et al. Effectiveness of antipsychotic drugs in patients with chronic schizophrenia. N Engl J Med. (2005) 353:1209–23. doi: 10.1056/NEJMoa051688
3. Samara MT, Dold M, Gianatsi M, Nikolakopoulou A, Helfer B, Salanti G, et al. Efficacy, acceptability, and tolerability of antipsychotics in treatment-resistant schizophrenia: a network meta-analysis. JAMA Psychiatry. (2016) 73:199–210. doi: 10.1001/jamapsychiatry.2015.2955
4. Bymaster FP, Calligaro DO, Falcone JF, Marsh RD, Moore NA, Tye NC, et al. Radioreceptor binding profile of the atypical antipsychotic olanzapine. Neuropsychopharmacology. (1996) 14:87–96. doi: 10.1016/0893-133X(94)00129-N
5. Ring BJ, Catlow J, Lindsay TJ, Gillespie T, Roskos LK, Cerimele BJ, et al. Identification of the human cytochromes P450 responsible for the in vitro formation of the major oxidative metabolites of the antipsychotic agent olanzapine. J Pharmacol Exp Ther. (1996) 276:658–66.
6. Callaghan JT, Bergstrom RF, Ptak LR, Beasley CM. Olanzapine. Pharmacokinetic and pharmacodynamic profile. Clin Pharmacokinet. (1999) 37:177–93. doi: 10.2165/00003088-199937030-00001
7. Melkersson KI, Dahl ML. Relationship between levels of insulin or triglycerides and serum concentrations of the atypical antipsychotics clozapine and olanzapine in patients on treatment with therapeutic doses. Psychopharmacology. (2003) 170:157–66. doi: 10.1007/s00213-003-1529-4
8. Citrome L, Stauffer VL, Chen L, Kinon BJ, Kurtz DL, Jacobson JG, et al. Olanzapine plasma concentrations after treatment with 10, 20, and 40 mg/d in patients with schizophrenia: an analysis of correlations with efficacy, weight gain, prolactin concentration. J Clin Psychopharmacol. (2009) 29:278–83. doi: 10.1097/JCP.0b013e3181a289cb
9. Simon V, Van Winkel R, De Hert M. Are weight gain and metabolic side effects of atypical antipsychotics dose dependent? A literature review. J Clin Psychiatry. (2009) 70:1041–50. doi: 10.4088/JCP.08r04392
10. Citrome L, Holt RI, Walker DJ, Hoffmann VP. Weight gain and changes in metabolic variables following olanzapine treatment in schizophrenia and bipolar disorder. Clin Drug Investig. (2011) 31:455–82. doi: 10.2165/11589060-000000000-00000
11. Perry PJ, Argo TR, Carnahan RM, Lund BC, Holman TL, Ellingrod VL, et al. The association of weight gain and olanzapine plasma concentrations. J Clin Psychopharmacol. (2005) 25:250–4. doi: 10.1097/01.jcp.0000162800.64378.82
12. Larsen JR, Svensson CK, Vedtofte L, Jakobsen ML, Jespersen HS, Jakobsen MI, et al. High prevalence of prediabetes and metabolic abnormalities in overweight or obese schizophrenia patients treated with clozapine or olanzapine. CNS Spectr. (2018) 24:441–52. doi: 10.1017/S1092852918001311
13. Zhang X, Zhao Y, Shao H, Zheng X. Metabolic and endocrinal effects of N-desmethyl-olanzapine in mice with obesity: implication for olanzapine-associated metabolic changes. Psychoneuroendocrinology. (2019) 108:163–71. doi: 10.1016/j.psyneuen.2019.06.017
14. Lu ML, Lin CH, Chen YC, Yang HC, Wu TH. Determination of olanzapine and N-desmethyl-olanzapine in plasma using a reversed-phase HPLC coupled with coulochemical detection: correlation of olanzapine or N-desmethyl-olanzapine concentration with metabolic parameters. PLoS ONE. (2013) 8:e65719. doi: 10.1371/journal.pone.0065719
15. Lu ML, Chen CH, Kuo PT, Lin CH, Wu TH. Application of plasma levels of olanzapine and N-desmethyl-olanzapine to monitor metabolic parameters in patients with schizophrenia. Schizophr Res. (2018) 193:139–45. doi: 10.1016/j.schres.2017.07.022
16. Melkersson KI, Hulting AL, Brismar KE. Elevated levels of insulin, leptin, and blood lipids in olanzapine-treated patients with schizophrenia or related psychoses. J Clin Psychiatry. (2000) 61:742–9. doi: 10.4088/JCP.v61n1006
17. An H, Fan H, Chen S, Qi S, Ma B, Shi J, et al. Effects of dose, age, sex, body weight, and smoking on plasma concentrations of Olanzapine and N-desmethyl Olanzapine in inpatients with schizophrenia. J Clin Psychopharmacol. (2021) 41:255–9. doi: 10.1097/JCP.0000000000001390
18. Benjamini Y, Drai D, Elmer G, Kafkafi N, Golani I. Controlling the false discovery rate in behavior genetics research. Behav Brain Res. (2001) 125:279–84. doi: 10.1016/S0166-4328(01)00297-2
19. Melkersson K, Khan A, Hilding A, Hulting AL. Different effects of antipsychotic drugs on insulin release in vitro. Eur Neuropsychopharmacol. (2001) 11:327–32. doi: 10.1016/S0924-977X(01)00108-0
20. Melkersson KI, Hulting AL. Insulin and leptin levels in patients with schizophrenia or related psychoses–a comparison between different antipsychotic agents. Psychopharmacology. (2001) 154:205–12. doi: 10.1007/s002130000639
21. Lu ML, Wu YX, Chen CH, Kuo PT, Chen YH, Lin CH, et al. Application of Plasma Levels of Olanzapine and N-Desmethyl-Olanzapine to monitor clinical efficacy in patients with schizophrenia. PLoS ONE. (2016) 11:e0148539. doi: 10.1371/journal.pone.0148539
22. Scherf-Clavel M, Weidner A, Deckert J, Menke A, Unterecker S. Pathological concentration of C-reactive protein is correlated to increased concentrations of quetiapine, but not of risperidone, olanzapine and aripiprazole in a naturalistic setting. Pharmacopsychiatry. (2020) 53:30–5. doi: 10.1055/a-0869-8053
23. Backes JM, Howard PA, Moriarty PM. Role of C-reactive protein in cardiovascular disease. Ann Pharmacother. (2004) 38:110–8. doi: 10.1345/aph.1D203
24. Baptista T, Davila A, El Fakih Y, Uzcategui E, Rangel NN, Olivares Y, et al. Similar frequency of abnormal correlation between serum leptin levels and BMI before and after olanzapine treatment in schizophrenia. Int Clin Psychopharmacol. (2007) 22:205–11. doi: 10.1097/YIC.0b013e328080ca44
25. Meyer JM, Mcevoy JP, Davis VG, Goff DC, Nasrallah HA, Davis SM, et al. Inflammatory markers in schizophrenia: comparing antipsychotic effects in phase 1 of the clinical antipsychotic trials of intervention effectiveness study. Biol Psychiatry. (2009) 66:1013–22. doi: 10.1016/j.biopsych.2009.06.005
26. Jena M, Mishra A, Mishra BR, Nath S, Maiti R. Effect of lurasidone versus olanzapine on cardiometabolic parameters in unmedicated patients with schizophrenia: a randomized controlled trial. Psychopharmacology. (2020) 237:3471–80. doi: 10.1007/s00213-020-05628-3
27. Fernandes BS, Steiner J, Bernstein HG, Dodd S, Pasco JA, Dean OM, et al. C-reactive protein is increased in schizophrenia but is not altered by antipsychotics: meta-analysis and implications. Mol Psychiatry. (2016) 21:554–64. doi: 10.1038/mp.2015.87
28. Nygard O, Vollset SE, Refsum H, Stensvold I, Tverdal A, Nordrehaug JE, et al. Total plasma homocysteine and cardiovascular risk profile. The Hordaland Homocysteine study. JAMA. (1995) 274:1526–33. doi: 10.1001/jama.1995.03530190040032
29. Regland B, Johansson BV, Grenfeldt B, Hjelmgren LT, Medhus M. Homocysteinemia is a common feature of schizophrenia. J Neural Transm Gen Sect. (1995) 100:165–9. doi: 10.1007/BF01271539
30. Osher Y, Sela BA, Levine J, Belmaker RH. Elevated homocysteine levels in euthymic bipolar disorder patients showing functional deterioration. Bipolar Disord. (2004) 6:82–6. doi: 10.1046/j.1399-5618.2003.00082.x
31. Fan N, Tan Y, Yang F, Tian L, Chen S, Li J, et al. Effect of risperidone on serum homocysteine levels in first-episode, drug-naive patients with schizophrenia. Neurosci Lett. (2017) 650:168–73. doi: 10.1016/j.neulet.2017.04.025
32. Liu YF, Wang YP, Zhang PF, Yuan XX, Zhu QY, Li X, et al. [Correlation of serum level of homocysteine and insulin resistance with cognitive dysfunction in first-episode schizophrenics]. Zhonghua Yi Xue Za Zhi. (2018) 98:191–5. doi: 10.3760/cma.j.issn.0376-2491.2018.03.007
33. Liu Y, Tao H, Yang X, Huang K, Zhang X, Li C. Decreased serum oxytocin and increased homocysteine in first-episode schizophrenia patients. Front Psychiatry. (2019) 10:217. doi: 10.3389/fpsyt.2019.00217
34. Ma YY, Shek CC, Wong MC, Yip KC, Ng RM, Nguyen DG, et al. Homocysteine level in schizophrenia patients. Aust N Z J Psychiatry. (2009) 43:760–5. doi: 10.1080/00048670903001935
35. Eren E, Yegin A, Yilmaz N, Herken H. Serum total homocystein, folate and vitamin B12 levels and their correlation with antipsychotic drug doses in adult male patients with chronic schizophrenia. Clin Lab. (2010) 56:513–8.
36. Bicikova M, Hampl R, Hill M, Ripova D, Mohr P, Putz Z. Neuro- and immunomodulatory steroids and other biochemical markers in drug-naive schizophrenia patients and the effect of treatment with atypical antipsychotics. Neuro Endocrinol Lett. (2011) 32:141–7.
37. Dicker-Brown A, Fonseca VA, Fink LM, Kern PA. The effect of glucose and insulin on the activity of methylene tetrahydrofolate reductase and cystathionine-beta-synthase: studies in hepatocytes. Atherosclerosis. (2001) 158:297–301. doi: 10.1016/S0021-9150(01)00442-7
Keywords: therapeutic drug monitoring, olanzapine, N-desmethyl-olanzapine, metabolic abnormalities, schizophrenia
Citation: An H, Fan H, Yun Y, Chen S, Qi S, Ma B, Shi J, Wang Z and Yang F (2022) Relationship Between Plasma Olanzapine and N-Desmethyl-Olanzapine Concentration and Metabolic Parameters in Patients With Schizophrenia. Front. Psychiatry 13:930457. doi: 10.3389/fpsyt.2022.930457
Received: 28 April 2022; Accepted: 30 May 2022;
Published: 21 June 2022.
Edited by:
Roberto Ciccocioppo, University of Camerino, ItalyReviewed by:
David Wright, University of Guelph, CanadaYinghua Yu, Xuzhou Medical University, China
Copyright © 2022 An, Fan, Yun, Chen, Qi, Ma, Shi, Wang and Yang. This is an open-access article distributed under the terms of the Creative Commons Attribution License (CC BY). The use, distribution or reproduction in other forums is permitted, provided the original author(s) and the copyright owner(s) are credited and that the original publication in this journal is cited, in accordance with accepted academic practice. No use, distribution or reproduction is permitted which does not comply with these terms.
*Correspondence: Huimei An, anhuimei_teacher@163.com; Fude Yang, yangfd200@126.com