 Christopher Small
 Daniel Sousa
- 1Lamont Doherty Earth Observatory, Columbia University, Palisades, NY, United States
- 2Department of Geography, San Diego State University, San Diego, CA, United States
The statistical and topological properties of spectral feature spaces are direct expressions of the populations of spectra they represent. Characterization of the topology and dimensionality of spectral feature spaces provides both quantitative and qualitative insight into their information content. Understanding the characteristics and information content of a spectral feature space is essential to modeling and interpretation of the target properties of spectra. The reflectance of crystalline substrates, specifically sands and evaporites, is of immediate relevance to remote sensing of the diversity of soils and terrestrial substrates more generally. The objective of this analysis is to characterize the topology and spectral dimensionality of spectroscopic feature spaces composed of a diversity of co-occurring sands and evaporites worldwide. To achieve this, we construct a composite spectral feature space as a mosaic of 30 desert environments imaged by NASA’s EMIT spaceborne imaging spectrometer and compare the global and local structure of the aggregate spectral feature space using a combination of linear and nonlinear dimensionality reduction. The 3D (>99%) variance partition of the EMIT mosaic indicates that the spectral diversity of sand and evaporite reflectances is determined primarily by albedo and spectral continuum–related to mineralogy, moisture content and illumination geometry. The spectral feature space defined by the low order principal components clearly distinguishes low and high albedo sand endmembers with multiple internal clusters indicating distinct spectral continuum shapes. The same feature space also contains a continuum of evaporite endmembers with no apparent clustering but a strong dependence of albedo and continuum curvature on moisture content. In contrast, 2D and 3D UMAP embeddings of the same feature space clearly distinguish at least 18 spectrally separable clusters interspersed amidst two continua of tendrils. One continuum is associated with multiple sand albedo gradients in the Gobi Desert while the other corresponds to a variety of low albedo basement outcrops in multiple granules. Together, these observations indicate that the EMIT spectrometer is able to clearly distinguish spectrally separable reflectance features in both the spectral continuum and narrowband absorptions, suggesting that the geographically distinct crystalline substrates included in the study are mineralogically distinct and completely spectrally separable.
Introduction
The statistical and topological properties of spectral feature spaces are direct expressions of the populations of spectra they represent. Specifically, the diversity of spectral continuum shapes and amplitudes and the diversity of absorption features superimposed on them (Clark and Roush, 1984; Hapke, 2012). Characterization of the topology and dimensionality of spectral feature spaces provides both quantitative and qualitative insight into their information content (Boardman, 1993; 1994). Here we follow the primary definition of topology as given by the Oxford English Dictionary; The way in which constituent parts are interrelated or arranged. The topology of an object is inherently dependent on its dimensionality. In the case of imaging spectroscopy, the dimensionality of a spectral feature space is dependent on both the intrinsic dimensionality of the population of constituent spectra and on the sampling (both spatial and spectral) of the imaging sensor, among other factors.
Understanding the characteristics and information content of a spectral feature space is essential to modeling and interpretation of the target properties (landscape, water body, atmospheric column, material surface, etc.). In the context of this analysis, modeling can include both physically-based continuous models (e.g., spectral mixture models) and categorically-defined discrete classifications (e.g., thematic land cover maps). In both cases, the model represents a lower dimensional depiction of a higher dimensional feature space. Characterization of the topology and dimensionality of a spectral feature space can therefore inform the design of appropriate parsimonious models to represent its information content.
Accurate representation of a spectral feature space often depends on the statistical variance scale of features contained within. While the overall “global” scale topology of the full feature space may be more influenced by the diversity of continuum shapes and amplitudes of the constituent spectra, the more subtle “local” scale topology may reflect the diversity of narrowband absorption features present in the spectra–but lacking sufficient variance to affect the global structure. Depending on the application of the model, either or both scales may be relevant to how the feature space is modeled. Whereas clustering within the feature space can determine how accurately it can be categorized with a discrete classification, the number of distinct spectral endmembers and linearity of the topology can guide the design of spectral mixture models. The primary focus of this analysis is on the topology and dimensionality of spectral feature spaces of reflectance spectra of crystalline substrates. Specifically, naturally occurring sand dune fields and their associated evaporite deposits.
The reflectance of crystalline substrates is of immediate relevance to remote sensing of the diversity of substrates more generally. Both sands and evaporites represent multiple mineralogically distinct endmembers within the continuum of rock, sediment and soil substrates found throughout the Earth surface. Global studies of both broadband (e.g., (Small and Milesi, 2013; Small and Sousa, 2022; Sousa and Small, 2019)) and spectroscopic (e.g., (Small and Sousa, 2024; Sousa and Small, 2018)) substrate mixing spaces identify sands and evaporites as distinct endmembers on the substrate continuum. The fundamental question we seek to address is the degree to which high signal-to-noise spaceborne imaging spectroscopy can resolve diagnostic spectral features of mineralogically distinct crystalline substrates in spectral mixtures and whether the spectral features are sufficiently consistent to allow for accurate mapping of their composition and spatial extent.
The overall objective of this analysis is to characterize the topology and spectral dimensionality of spectral feature spaces composed of a diversity of sands and evaporites worldwide. To achieve this, we construct a composite spectral feature space as a mosaic of 30 desert environments imaged by NASA’s EMIT spaceborne imaging spectrometer. We exploit the frequent co-occurrence of evaporites within and around sand dune fields to simplify our sample selection, but acknowledge that larger evaporite basins like playa lakes and sabkhas are underrepresented. Therefore, we limit our inference about evaporite reflectance to time static images of sand-adjacent evaporites which may not represent all spatiotemporal processes that occur within the temporal continuum of evaporite hydration and dehydration. Because EMIT’s ∼60 m Ground Instantaneous Field of View (GIFoV) is considerably finer than the scale of both dune fields and evaporite basins, the instrument effectively oversamples the targets while maintaining the potential to resolve compositional gradients within them. The specific objectives of the analysis are to characterize the differences and similarities of multiple scales of mixing space topology using complementary approaches to dimensionality reduction. With application to continuous spectral mixture models, this characterization will allow for identification of spectral endmembers and dimensionality of viable models. With application to discrete thematic classifications, this characterization will allow for identification of distinct clusters within the mixing space and quantify the spectral separability of such clusters.
Data
The source of data for this analysis is a 30-granule mosaic of spectroscopic imagery from NASA’s Earth Mineral Dust Source Investigation (EMIT) mission (Green et al., 2020). The EMIT instrument is a Dyson imaging spectrometer with an 11° cross-track field of view. EMIT has an optically fast (F/1.8) and wide-swath (1,240 samples) optical system achieving roughly 7.4 nm spectral sampling across the 380–2,500 nm spectral range (Bradley et al., 2020). EMIT achieves a high signal-to-noise (SNR) > 2x its design requirement of ∼200 in most channels (Thompson et al., 2024). The ground sampling distance of EMIT pixel spectra is ∼40 × 60 m. EMIT was launched via SpaceX Dragon on 14 July 2022, and autonomously docked to the forward-facing port of the International Space Station (ISS) (LP_DAAC, 2023). All EMIT data used in this study are available from https://search.earthdata.nasa.gov/ as the standard Level-2A ISOFIT-corrected surface reflectance product (EMITL2ARFL v001). Cloud and data quality masks were acquired and spot checked, but not used in the analysis. Default bad bands lists (bands 128–142 and 188–213) provided with the data were applied.
Geographic locations of the granules used in the mosaic are shown in Figure 1, while the full 30 granule mosaic is shown in Figure 2. The mosaic is displayed with both a common linear stretch [0, 0.8] applied to all granules and with individual 2% linear stretches applied to each granule separately. The former illustrates the distinction between higher and lower albedo sands, while the latter illustrates the spectral diversity among different geographically and mineralogically distinct sand bodies.
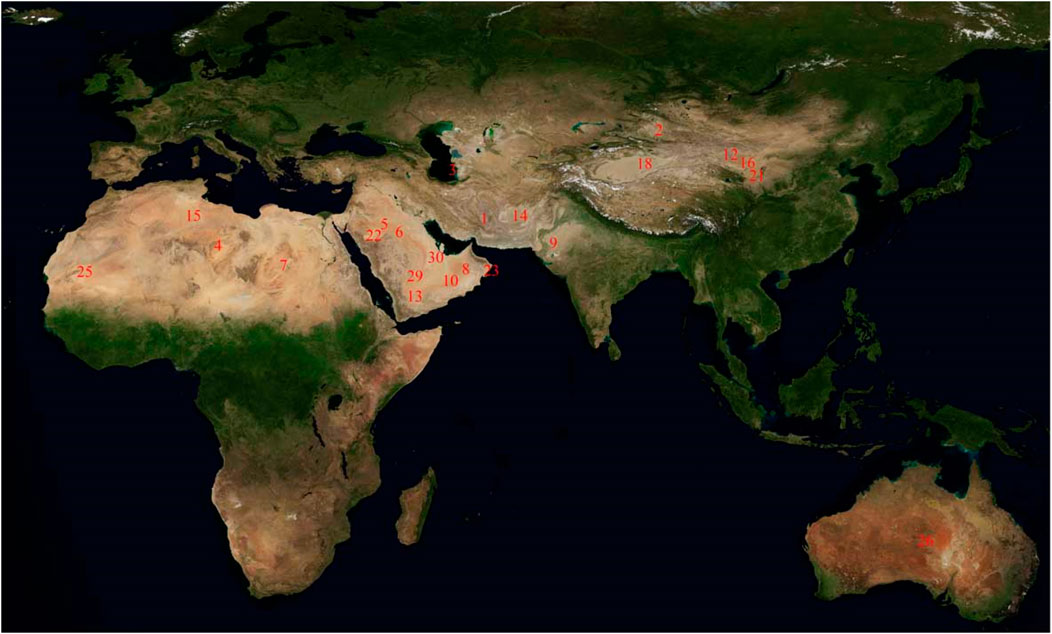
Figure 1. Index map showing EMIT granule locations. Index numbers correspond to granule IDs in Table 1 and mosaic tile numbers (L to R, T to B) in Figure 2. Where multiple adjacent granules are used, only the first of the sequence is numbered for clarity.
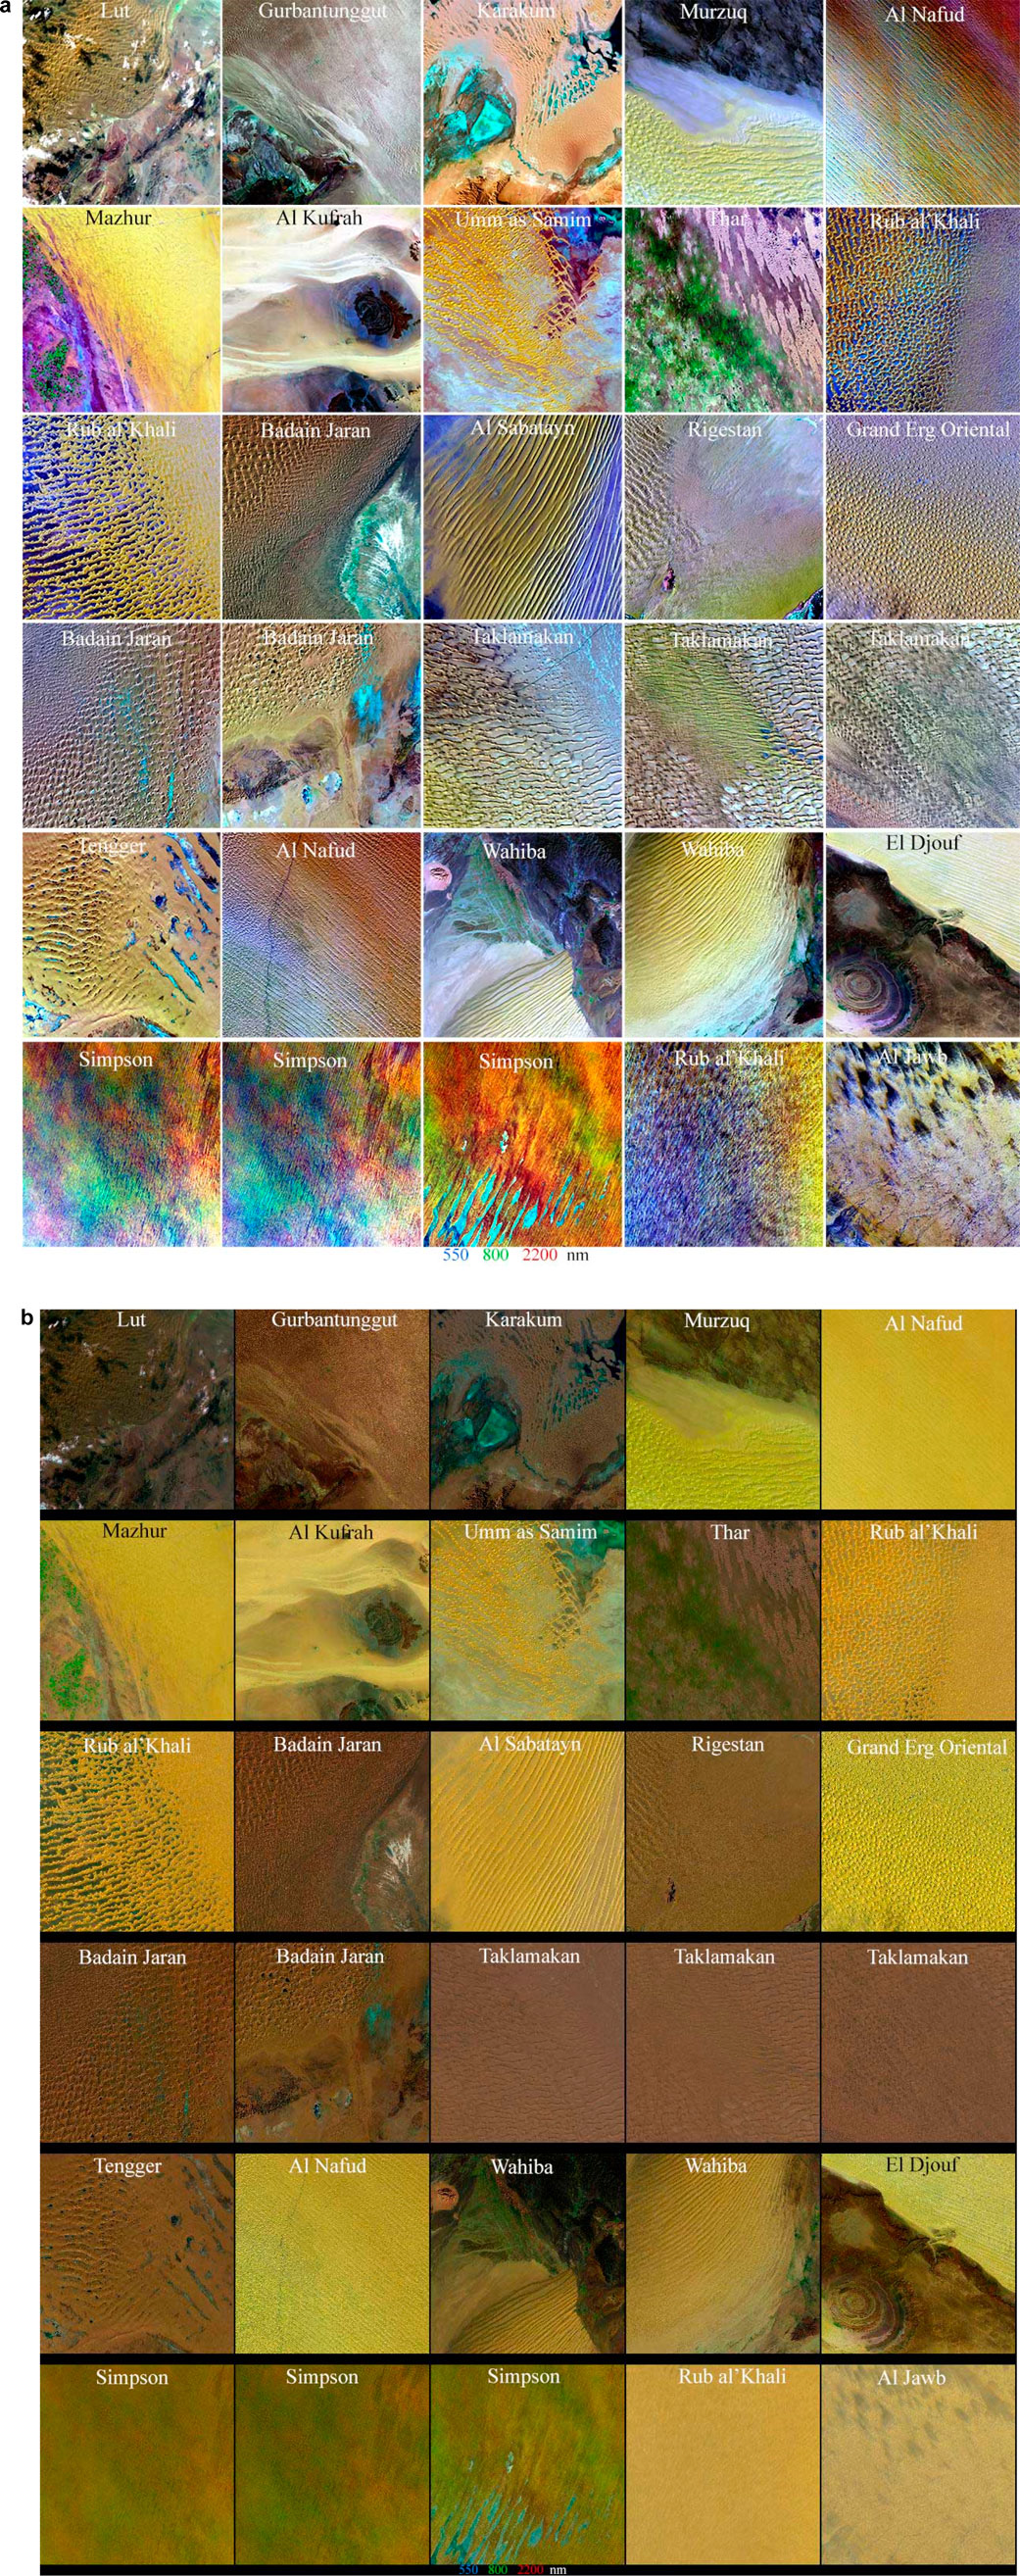
Figure 2. (a) Visible/NIR/SWIR composite of 30 EMIT granules combined for the spectroscopic mixing space. Each granule contains 1,242 × 1,280 pixel spectra at ∼50 m resolution. In addition to sand dunes, most granules contain significant areas of evaporite, appearing white, cyan or blue, depending on mineralogy and moisture content. Exposed crystalline basement is generally low albedo mafic rock appearing black or brown. The Mazhur (#6) and Thar (#9) granules contain significant areas of vegetation and non-photosynthetic vegetation (NPV) appearing green. The Lut (#1) and Al Jawb (#30) granules contain some clouds and shadows. Granule-specific 2% linear stretches emphasize intra-granule spectral diversity. Granule numbers increment row-by-row from upper left to lower right. (b) Visible/NIR/SWIR composite of 30 EMIT granules combined for the spectroscopic mixing space. Same as Figure 2a but with a common linear stretch [0.1, 0.8] applied.
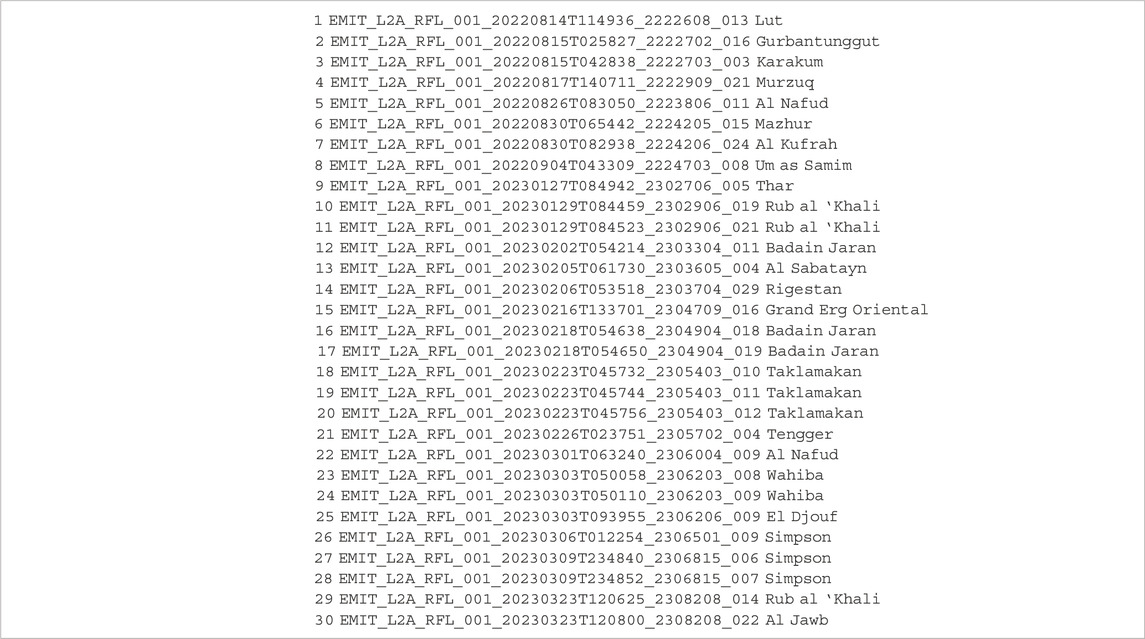
Table 1. EMIT granule IDs and place names.
Methods
Dimensionality reduction
We use two complementary approaches to dimensionality reduction to render low dimensional projections of spectral mixing spaces. Specifically, matrix factorization and neighbor graph retrieval. The principal component (PC) transformation (Pearson 1901) is a linear matrix factorization that estimates the low rank structure of the mixing space by maximizing variance in the minimum number of orthogonal dimensions in which variance diminishes monotonically with increasing PC dimension. For this reason, the low dimensional principal components (PCs) project the topology of the mixing space in a way that depicts the global structure resulting from the continuum shape and amplitude of each spectrum. In contrast, Uniform Manifold Approximation and Projection (UMAP) (McInnes et al. 2018) constructs an adjacency-preserving neighbor graph of the high dimensional mixing space and embeds the graph in a low dimensional embedding space in which statistically local structure often related to low variance features, like narrowband absorptions, can be preserved. The topology of the low dimensional PC projections is physically interpretable, in part, because these projections reveal the spectral endmembers that are most distinct on the basis of spectral continuum shape bounding the feature space of spectral mixtures of the endmember spectra. The low dimensional embeddings given by UMAP may also preserve some physically interpretable global structure of the mixing space but also reveal finer scale clustering and mixing structure within the mixing space related to low variance features relegated to higher order PC projections.
For each of the composite mixing spaces described above we compute a traditional (L2 norm minimization) PC transform, preceded by a Robust PCA (RPCA) factorization (Candès et al. 2011). RPCA separates the low rank component of the mixing space from a sparse component containing outliers and transient features that may bias the projections provided by the traditional L2 transformation. A more detailed explanation of RPCA is given in Supplementray Appendix A. Subsequent Singular Value Decomposition of the low rank (L) and sparse (S) components provides the variance partitions of the orthogonal dimensions of each. These variance partitions, described in more detail in Supplementray Appendix A, reveal that the vast majority of variance is preserved in the low rank component, with the sparse component containing narrowband anomalies adjacent to water absorption features, presumably related to the performance of the atmospheric correction on anomalous spectra. The L2 (non-robust) PCs of both the raw and low rank mixing spaces of the EMIT mosaic are effectively 3D, with >99% of variance in the three low order dimensions. In contrast, the sparse component is at least 9D, with the 10 low order PC dimensions representing only 91% of total variance. The distinction is the greater separation of the lower order dimensions and higher order continuum in the low rank component.
Both 2D and 3D UMAP embeddings are computed for each of the composite mixing spaces described above. Because the topology of the UMAP embedding can be significantly impacted by both the “nearest neighbor” and “minimum distance” hyperparameters chosen, we conduct a hyperparameter sweep on both to determine the sensitivity of the topology and the consistency of internal structure of the mixing space (Supplementray Appendix B). Specifics of the PC, RPCA and UMAP computations are given in Supplementray Appendix C.
Topology, endmembers, mixture modeling
The topology of the low order PC space is a function of the presence and identity of the spectral endmembers bounding the mixing space. In addition, the curvature (i.e., linearity, concavity or convexity) of the convex hull spanning the endmember apexes reveals the linearity (or lack thereof) of spectral mixing among bounding mixtures of endmembers within the space. For this reason, the dimensionality (quantified by the variance partition of the eigenvalues of the PC factorization) and the topology of the low dimensional space provide a basis for the design of data-adapted linear spectral mixture models. In this analysis, we use the standardized Substrate, Vegetation, Dark (SVD) linear mixture model developed using the spectrally diverse collection of EMIT granules described by (Small and Sousa 2024). Inversion of the linear spectral mixture model yields endmember fraction estimates for each pixel spectrum within the mixing space. Together, the spatial maps of spectral endmember fractions provide a low dimensional physically-based projection of the higher dimensional spectroscopic mixing space. Because the spectral endmembers on which the mixture model is based provide a physically meaningful set of basis vectors, the endmember fractions can be combined with the UMAP embedding coordinates to yield a Joint Characterization (Sousa and Small 2021) of the mixing space that represents both the global structure of the spectral continua with the local structure related to narrow band absorption features.
Spectral separability
While the PC-derived mixing spaces tend to reflect the global structure of the continuum shapes of the constituent spectra, the local scale topology preserved in the UMAP-derived mixing spaces often shows much greater degrees of clustering related to low variance features like narrowband absorptions shared by spectra with otherwise similar continua and amplitudes. This clustering may take the form of discrete clusters or continuous tendrils within the mixing space. The presence, or absence, of discrete clusters has immediate implications for discrete thematic classifications which require high degrees of spectral separability among classes. Labeling discrete clusters within UMAP embeddings allows for estimation of spectral separability with metrics such as Transformed Divergence (Swain 1973) and Jeffries-Matusita distance (Richards 1999). Even when fully discrete clusters cannot be identified, distinct continua within the mixing space can be interpreted by comparison of spectra corresponding to different continua, or by back-projecting 3D UMAP coordinates into geographic space as RGB composites to reveal spatial continuity and geographic distinction of coherent spatial features with similar color renderings. We use both approaches with the EMIT mosaic to identify compositional consistencies in impervious substrates in different urban settings.
Results
Consistent with earlier characterizations of multispectral (Small 2004; Small and Sousa 2022; Sousa and Small 2017) and spectroscopic (Sousa et al. 2022; Sousa and Small 2023; Sousa and Small, 2017b) mixing spaces, global variance of the 30 granule EMIT mosaic is effectively 3D, with >99% of spectral variance contained in three low order PC dimensions of the low rank component. Also consistent with previous studies, this mixing space is bounded by Substrate, Vegetation and Dark spectral endmembers with strongly linear mixing along the binary continua radiating from the Dark endmember (Figure 3). Both Vegetation and Dark endmembers have well-defined apexes, while the Substrate endmembers are more diffuse, each with a relatively well-defined interior apex and a constellation of higher amplitude exterior endmembers around the periphery of the apex (Figure 3). In addition, due to the distinct mineralogy of different sands, there are a number of distinct clusters within the PC mixing space. Each of these clusters corresponds to spectrally distinct sands–but not necessarily geographically distinct granules. This is a limitation of the variance maximizing PC space in that it comingles spectra with similar continuum amplitudes and curvatures–despite differences in low variance absorption features that may distinguish different sand mineralogies. Cluster mean spectra, sampled from the density maximum of each cluster, are compared with the corresponding Empirical Orthogonal Function (EOF) of the first principal component (PC1) in Figure 4. As EOF 1 modulates the overall amplitude of each individual spectrum, the similarity in continuum curvature is apparent, while variations in the VNIR shoulder and SWIR2 absorptions are modulated by the higher order EOFs. In addition to the clear distinction between the higher and lower albedo sands, variations in both VNIR and SWIR absorption features are observed between clusters.
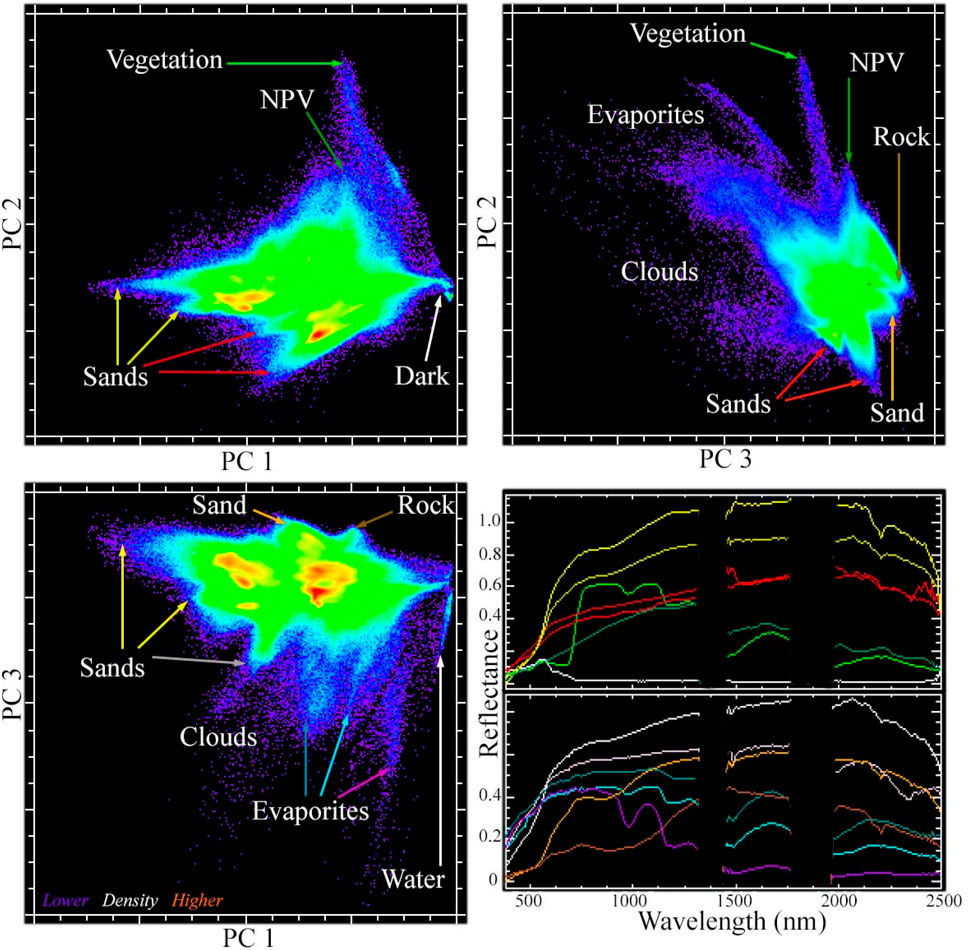
Figure 3. Spectroscopic mixing space and endmember spectra for the 30 scene EMIT mosaic. The first three low order principal components (PCs) account for 96.6%, 1.4% and 1.2% (respectively) of total variance. While several dense clusters are apparent within the space, none is geographically specific to any single EMIT granule, whereas all but one of the endmember apexes correspond to one, or at most two, geographically specific granules. Only the Dark endmember (e.g., cloud shadow, water, mafic rock) spans several granules. Vegetation, non-photosynthetic vegetation (NPV) and wet evaporites form a distinct limb from sands and dry evaporites because liquid water absorptions reduce SWIR reflectance relative to NIR. Arrow colors correspond to spectra colors.
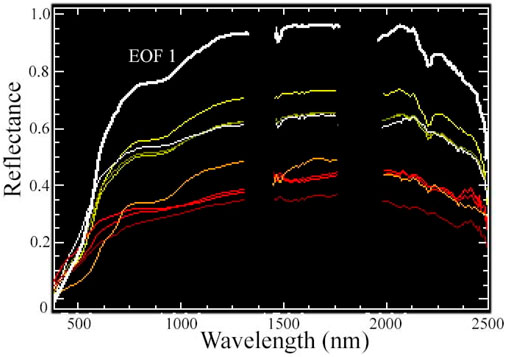
Figure 4. Cluster mean spectra and spectral EOF 1from the 3D PC mixing space. Two distinct groups of clusters seen in Figure 3 correspond to higher (yellow) and lower (red) albedo sands seen in Figure 2b. Spectral EOF 1 is the primary determinant of spectral continuum shape with amplitude modulated by the corresponding PC 1 values. Hence the amplitude continuum from the Dark endmember (right) to the highest albedo sands (left) on Figure 3.
In contrast to the PC space, UMAP spaces for a range of nearest neighbor hyperparameter settings show consistent topologies over a range of scales. For nearest neighbor distances greater than 5, the UMAP embeddings converge to a consistent topology that preserves the mixing continua spanning a single Dark and multiple sand and evaporite Substrate endmembers, while also containing multiple distinct clusters and continua spanning Vegetation and Substrate endmembers (Figure 5). The UMAP embedding is characterized by numerous distinct clusters of varying sinuousity, mostly corresponding to geographically distinct granules dominated by sands. Evaporites also form distinct clusters and continua, but are much smaller when dry. When moisture gradients produce a wider range of evaporite reflectance, the clusters take the form of thin tendrils extending from sand clusters. With lower minimum distance settings, evaporite clusters and tendrils are generally distinct from sand clusters (Supplementray Appendix B). Within the Dark-Substrate continua shown in Figure 5 are multiple distinct tendrils and mixing continua, each corresponding to a geographically distinct granule. Reflectance spectra from all pairs of distinct clusters and continuum ends within the 3D UMAP space (discussed below) have Transformed Divergence scores >1.97, with the vast majority of cluster pairs having scores of 2.0 indicating unambiguous spectral separability.
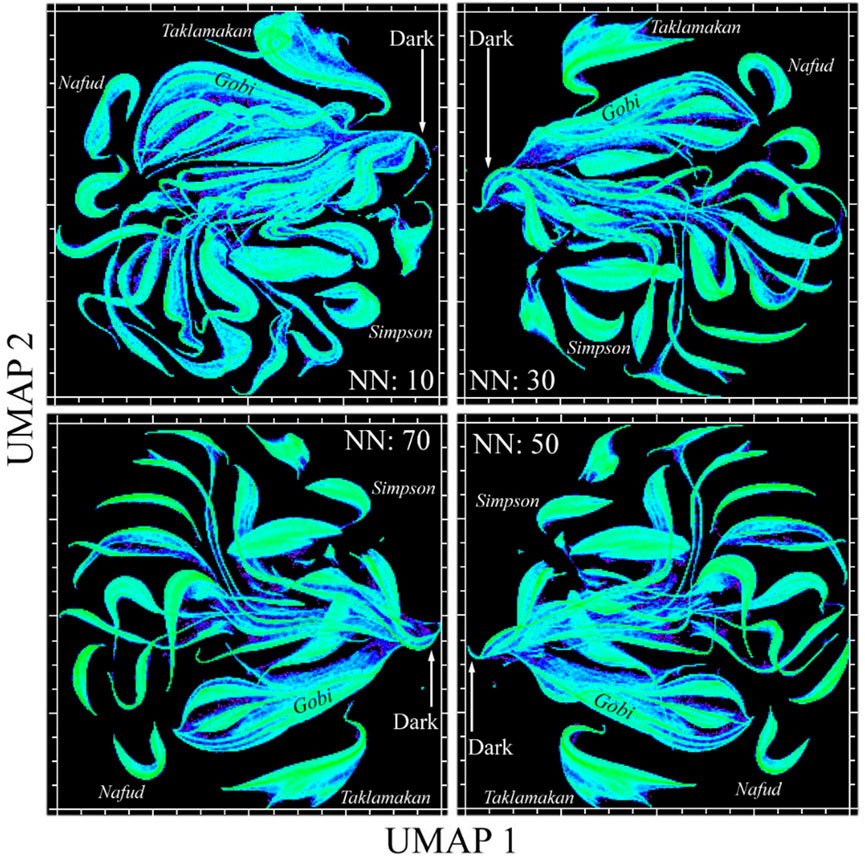
Figure 5. 2D UMAP embeddings for the 30 granule EMIT mosaic. In contrast to the continuous low order PC mixing space in Figure 3, the UMAP spaces are all clearly segregated into several distinct clusters interspersed among two sets of elongate tendrils. As near neighbor hyperparameter NN is increased, the clusters and tendrils grow more clearly separated but the topology has converged by NN 50. The embedding for NN:150 (not shown) is almost indistinguishable from NN 50. The two sets of elongate tendrils correspond to the Gobi desert (Badain Jaran and Tengger) granules and the basement lithology exposures in several granules.
Within the UMAP feature space of the mosaic, two sets of tendrils can be identified. These correspond to a spectral continuum of sands from the Gobi Desert (Figure 6) and a diversity of basement rock exposures present in several of the granules. Within the larger Gobi desert, these granules occur within the Badain Jaran and Tengger dune fields. Field photos and lab spectra of the diversity of substrates found in these basins are available from: https://www.ldeo.columbia.edu/∼small/Alashan2005/. We further characterize the mixing subspace of the four granules from the Gobi Desert for comparison the full mosaic.
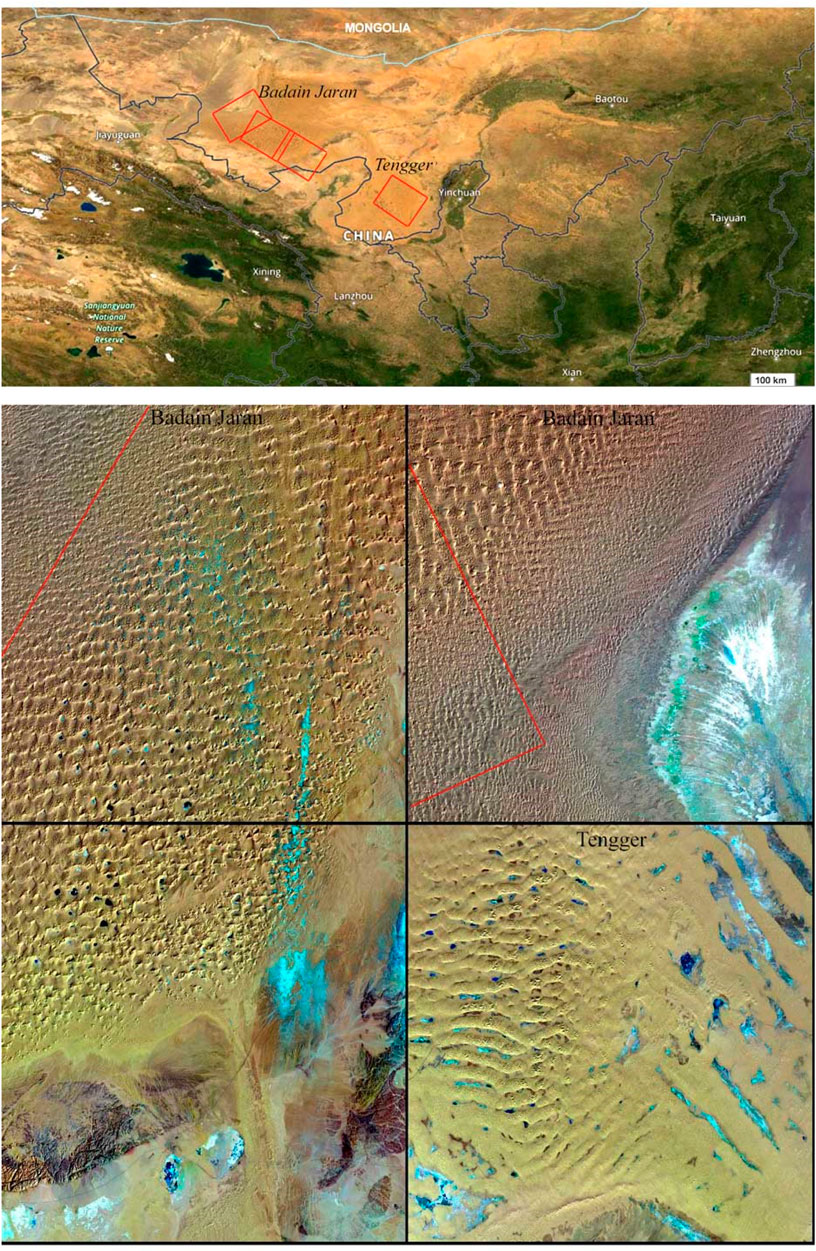
Figure 6. Gobi Desert index map and Visible/NIR/SWIR composites for Badain Jaran and Tengger EMIT granules. Evaporites appear blue, cyan and white. Basement rock outcrops appear dark brown. Common 1% linear stretch applied to all composites.
Figure 7 contrasts the topologies of the PC and UMAP spaces, with corresponding spectral endmembers from both. The spectral mixing subspace of the Gobi spectra clearly distinguishes both the higher and lower albedo sands, as well as the continuum of evaporites at the peripheries and within the dune fields (Figure 7). The 2D UMAP projection reveals at least six distinct mixing continua. The joint characterization combining the Substrate fraction and one of the UMAP dimensions untangles these mixing continua, revealing gradients in both mineralogy and moisture content in the reflectance spectra. There are two distinct continua for evaporites and five for sand. The evaporite continua show variations in liquid water absorptions at SWIR wavelengths while the sands appear to be related to mineralogy.
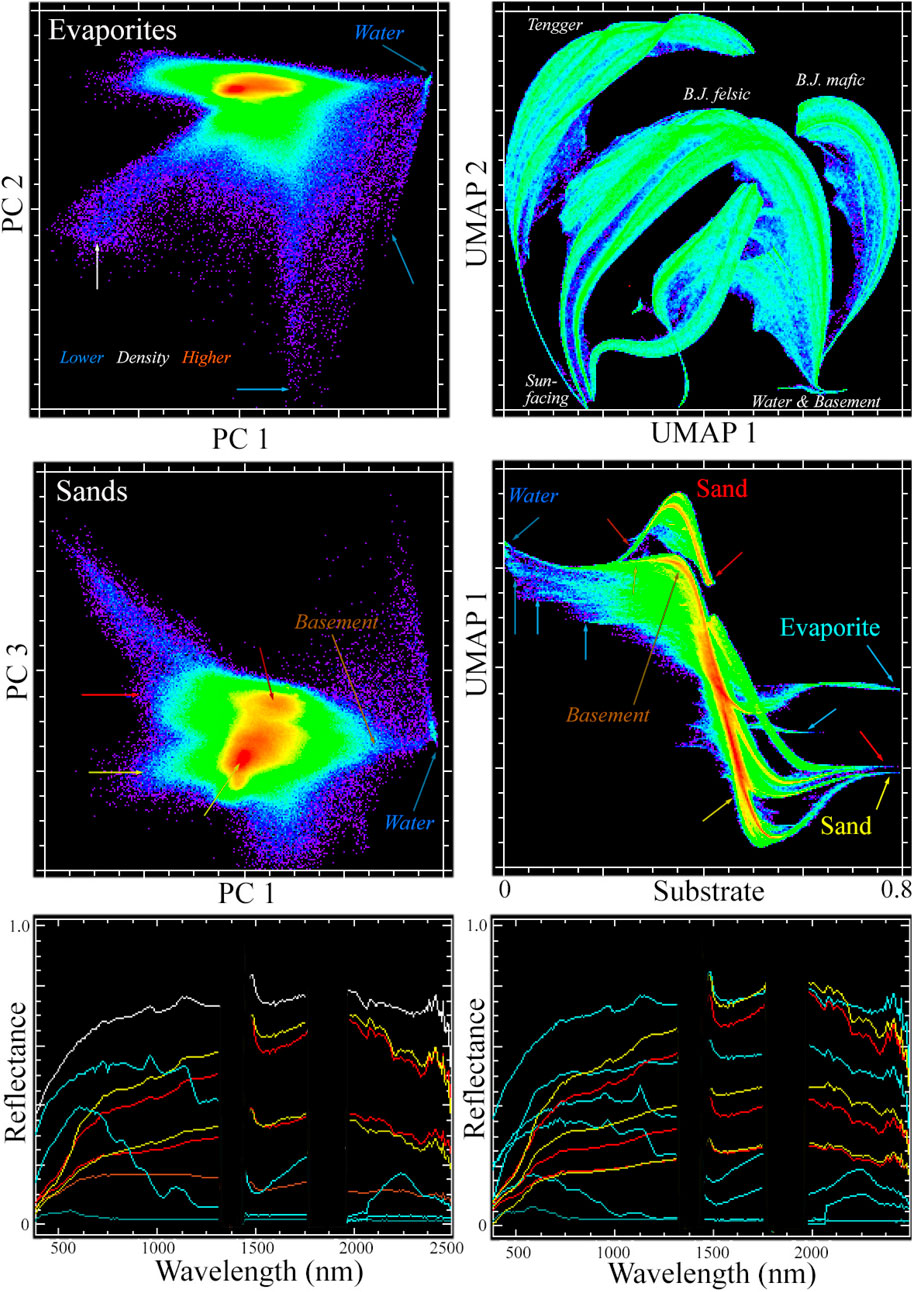
Figure 7. Gobi Desert mixing spaces and spectra. The PC mixing space is continuous and bounded by seven spectral endmembers with two internal clusters corresponding to spectrally distinct sands and evaporites forming separate continua. In contrast, the 2D UMAP embedding reveals seven distinct continua bounded by spectral endmembers. The joint characterization (JC) maps these UMAP continua as functions of Substrate fraction. Colors of labels and arrows on upper spaces correspond to colors of spectral endmembers on plots below.
The clear separation of distinct clusters and continua within the 3D UMAP embedding allows for interactive labeling of individual clusters. Figure 8 shows an oblique projection of the 3D space revealing the interspersed nature of the clusters and multi-tendril continua. Color-coded cluster mean spectra highlight clear distinctions in both continuum shape and absorption features.
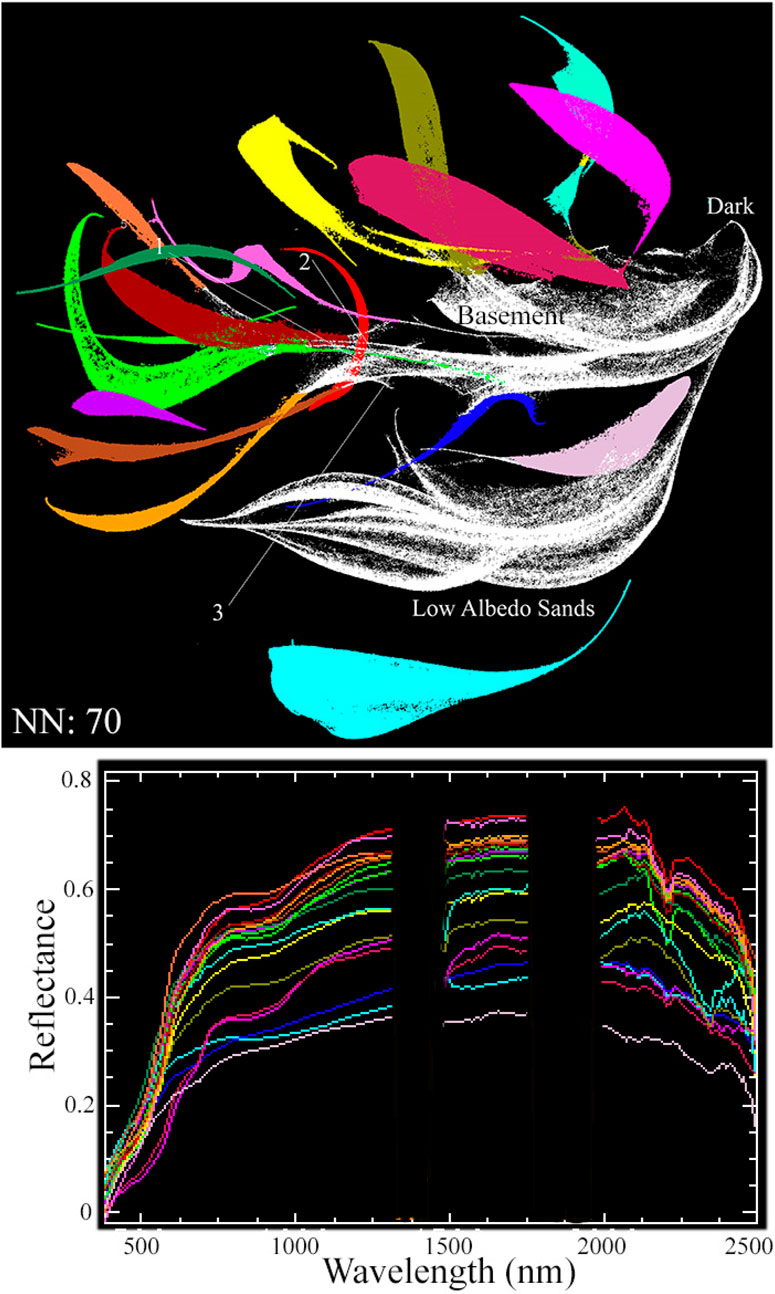
Figure 8. 3D UMAP space of the 30 granule EMIT mosaic with 18 distinct clusters labeled (color) and two multi-tendril continua not labeled (white). Oblique projection increases cluster separability for clarity. Mean spectra from each labeled cluster show a wide range of absorption features in both VNIR and SWIR2 wavebands. Transformed divergence of all cluster spectra pairs is >1.996, indicating near complete spectral separability.
When the 3D UMAP embedding of the EMIT mosaic is back-projected into geographic space as an RGB composite the geographic specificity of the embedding is apparent (Figure 9). While intra-granule land cover variations are apparent as slightly different hues, inter-granule geographic differences are immediately apparent as distinctly different hues for different dune fields.
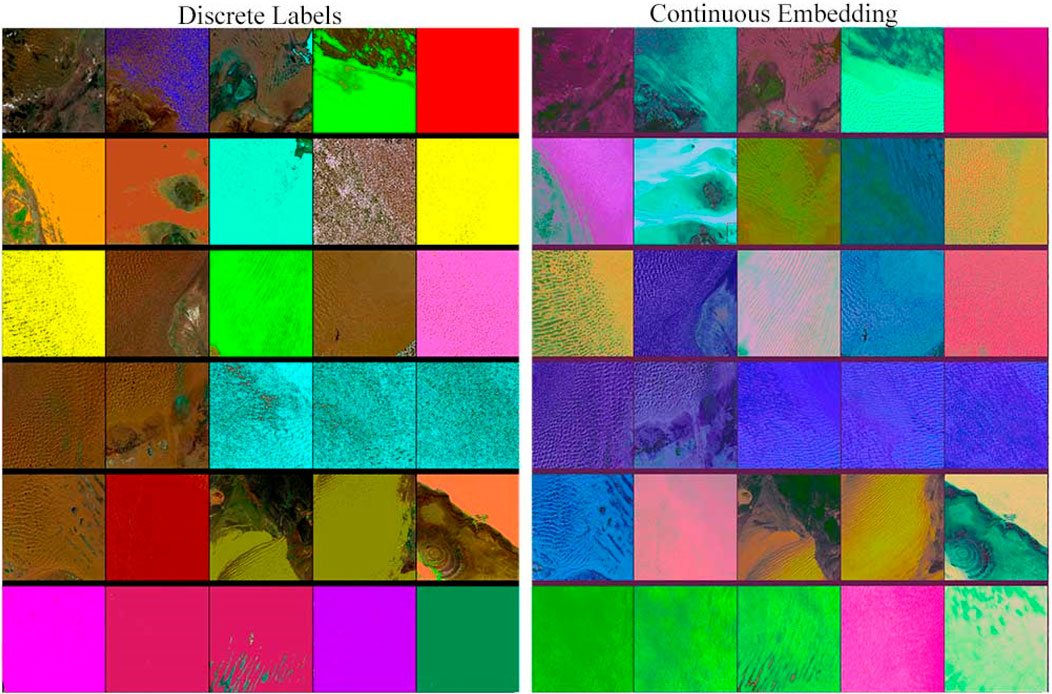
Figure 9. 3D UMAP mixing space embedding mapped onto geographic space. Topologically distinct cluster labels from Figure 8 map onto geographically distinct EMIT granules (left) with individual colors spanning multiple granules only when geographically adjacent. Cluster labels map as distinct colors showing no intra-cluster gradients. Unlabeled continua correspond to lower albedo sands, water and basement lithology. Mapping 3D UMAP embedding coordinates directly onto RGB channels (right) without labels shows distinct color ranges for geographically distinct scenes but preserves intra-cluster gradients. Discrete label colors are arbitrary whereas continuous embedding colors show relative location within the 3D UMAP space. Hence, colors are unrelated between the discrete and continuous panels.
Combining the SVD endmember fractions and UMAP coordinates for the 30 granule mosaic yields a 6D joint characterization of the spectral mixing space of all the sands and evaporites together. The 2D projection of Substrate fraction and UMAP dimension 1 shown in Figure 10 clearly illustrates the mixing continua between at least 18 distinct Substrate endmembers converging to a considerably smaller number of Dark endmembers. The Substrate endmember spectra vary in continuum amplitude and curvature as well as narrowband SWIR absorptions.
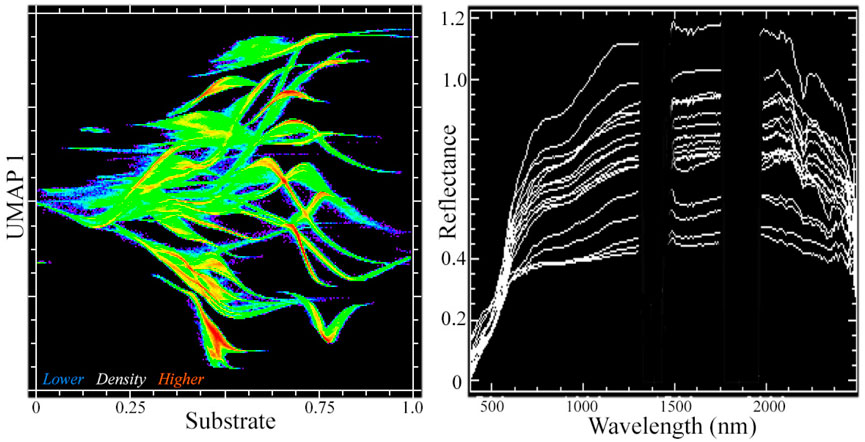
Figure 10. Joint characterization of the 30 granule mosaic mixing space distinguishes 18 high Substrate fraction spectral endmembers. Each of the distinct 2D UMAP continua spans a range of Substrate fractions resulting from a range of albedos and illuminations. Spectral endmembers span a range of Substrate fractions (left), reflecting the variable albedo of sands in the 30 scene mosaic. High Substrate fraction endmember spectra (right) from each distinct continuum vary in amplitude, curvature and SWIR2 absorption features. Even high albedo dry evaporites have relatively low Substrate fractions because the Substrate endmember used to unmix the mosaic is itself a composite of sand spectra, having considerably more curvature than the more spectrally flat evaporites. The low Substrate fraction spectra of almost all scenes converge to a single Dark endmember near 0.
Discussion
Spectral dimensionality
The 3D partition of variance of the EMIT mosaic (Supplementray Appendix A) confirms that the spectral diversity of sand and evaporite reflectances is controlled primarily by albedo, and to a lesser extent by continuum curvature. This is consistent with the fact that the principal component transformation of substrate spectra is primarily sensitive to differences in the amplitude and curvature of the spectral continuum (Small et al. 2009). In contrast, the 3D UMAP embeddings clearly resolve spectrally distinct clusters and continua unique to each dune field and their associated evaporites. The fact that these clusters and continua are geographically distinct and completely spectrally separable indicates that EMIT can resolve measurable differences in sand mineralogy when concentrated in dune fields. From comparison of the cluster mean spectra (Figures 7, 8, 10), these differences are manifest primarily as VNIR and SWIR2 absorption features. The spectral separability of basement rock outcrops is less apparent, although this diversity is underrepresented in comparison to sands in the mosaic used for this analysis. Estimates of the intrinsic spectral dimensionality of nonlinear embeddings like UMAP are beyond the scope of this study, but the fact that a 3D UMAP embedding allows for labeling and complete spectral separation of all geographically distinct sands is consistent with this relatively low dimensionality.
The use of RPCA to separate low rank and sparse components isolates some apparent inconsistencies in the atmospheric correction of column water vapor absorption. The sparse component is limited to spikes at the edge of water absorption bands, and some noise in the shortest and longest wavelength bands (Supplementray Figure A1). Geographically, these sparse component artifacts are limited to five of the 30 granules in the mosaic. This bodes well for the quality of both the EMIT radiance measurements and the atmospheric corrections used to produce the Level 2 reflectance product. The difference in the spectral standard deviations of the low rank and sparse components (Supplementray Figure A1) clearly indicates that the sparse component is dominated by high amplitude spikes adjacent to the SWIR water absorption bands. It is also worth noting that we intentionally did not apply the provided atmospheric correction masks provided with every EMIT granule. Nonetheless, the total variance of the sparse component is small (<4%) compared to the variance of the low rank component. These observations suggest that RPCA may be useful as an anomaly detector for EMIT and other spectroscopic image data.
Substrate mixing space topology
In contrast to our parallel analysis of impervious substrates (Small and Sousa 2023), the topology of the crystalline substrate feature space is controlled primarily by amplitude and curvature of the spectral continuum while the topology of the UMAP embedding reveals strong clustering corresponding to both broad and narrowband absorption features specific to sand mineralogy. Impervious substrate mixing spaces reflect the compositional heterogeneity and pervasive subpixel mixing that is endemic to built environments. Specifically, the diversity of substrates, presence of vegetation and ubiquitous deep shadow. Whereas the sands and evaporites that comprise the crystalline substrate mixing space are spectrally and compositionally distinct from each other, the compositional homogeneity that results from the common geologic provenance and sedimentologic refinement of sands and evaporites in each granule produces distinct mixing continua in the PC space and very distinct clusters in the UMAP space. Both of these studies’ results stand in strong contrast to our comparative analyses of soil reflectance using both meter resolution AVIRIS (Sousa and Small 2018) and decameter resolution EMIT (Small and Sousa 2024) from a diversity of agricultural basins worldwide. Whereas soils form a continuous plane of substrates in both PC and UMAP mixing spaces, the more compositionally homogeneous sands show some degree of albedo-related clustering in PC spaces and very distinct clustering in UMAP spaces–with numerous distinct spectral endmembers in each. Taken together, these results suggest a spectral convergence in the substrate weathering process, as well as a homogenizing effect of the non-photosynthetic vegetation component of many soils.
Additional factors which are particularly important for spectroscopic imaging of the dune fields and other sand-dominated landscapes include potentially significant effects of grain size (mineralogical and sedimentological), BRDF, and particulate coatings. This highlights the importance of ongoing work in physical modeling of grain size from imaging spectroscopy (e.g., (González-Romero et al. 2024),). BRDF effects on sand dunes can be particularly severe (e.g., (Wise and Mars 2022)) and potentially useful as an additional predictor (e.g., (Bachmann et al. 2014; Kimmel and Baranoski, 2007). Particulate coatings (e.g., (Ben-Dor et al. 2006)) can also be an important driver of spectroscopic signal in sands where sufficient observations are available to support model inversion. The approach used for this analysis does not seek to disentangle the effects of these (and other) potential geophysical drivers of spectroscopic variance. Rather, the purpose of the characterization is to empirically evaluate which spectroscopic signals are (and are not) statistically differentiable in the data themselves–being intentionally agnostic to the generative process (es).
Implications for mapping crystalline substrates
The results of this analysis are consistent with the findings of seminal studies of granular media reflectance and mineralogy (e.g., (Hunt 1977; Hunt and Salisbury 1970)) based on laboratory reflectance. Most well-sorted sands, like those found on dunes, are composed primarily of quartz, although interdune deposits can vary widely in composition and moisture content (Kocurek 1981). Beyond the mafic-felsic albedo contrast apparent in Figures 2b, 3, EMIT is able to resolve more subtle consistencies in both VNIR spectral continuum shape and narrowband SWIR absorptions that distinguish geographic differences in sand reflectance among dune fields.
The continuum shapes of the PC feature space clusters and endmembers (e.g., Figure 5) are consistent with those associated with lithologically diverse fluvial sands, but lack the mineralogical diversity of the silts and clays generally associated with fluvial sands (e.g., (Small et al. 2009)). The varying effect of Fe2+ absorption in the VNIR continuum suggests provenance-specific impurities or accessory minerals in several of the dune fields. However, aside from overall albedo, the most prominent differences among the distinct sand reflectances are related to narrowband absorption features in the 2,000–2,500 nm SWIR2 waveband (Figures 8, 10).
The ability of the EMIT spectrometer to distinguish variations in continuum shape and SWIR absorption features with sufficient consistency to achieve complete spectral separability among geographically distinct sand provenances bodes well for the ability of EMIT and successive spaceborne spectrometers to map compositional differences among some crystalline substrates. While dune sands represent a deliberately chosen extreme in mineralogic homogeneity, the widespread occurrence of sands in soils clearly contributes to the observed spectral diversity of substrates more generally. In addition, spectroscopic mapping of mineralogically distinct crystalline substrates has potential to supplement complementary multimodal feature extraction approaches, like those based on deep learning of regional geological context (e.g., (Ouyang et al. 2022). The spectral separability of the mineralogic diversity of eolian sands stands in contrast to the comingling of multiple spectral continua of impervious substrates found in built environments (Small and Sousa 2023).
Data availability statement
The original contributions presented in the study are included in the article/Supplementray Material, further inquiries can be directed to the corresponding author.
Author contributions
CS: Conceptualization, Formal Analysis, Funding acquisition, Investigation, Methodology, Writing – original draft, Writing – review and editing. DS: Formal Analysis, Funding acquisition, Investigation, Methodology, Writing – original draft, Writing – review and editing.
Funding
The author(s) declare that financial support was received for the research and/or publication of this article. NASA EMIT Science and Applications Team Program (Grant # 80NSSC24K0861) Sousa and Small (co-PIs).
Conflict of interest
The authors declare that the research was conducted in the absence of any commercial or financial relationships that could be construed as a potential conflict of interest.
The author(s) declared that they were an editorial board member of Frontiers, at the time of submission. This had no impact on the peer review process and the final decision.
Generative AI statement
The author(s) declare that no Generative AI was used in the creation of this manuscript.
Publisher’s note
All claims expressed in this article are solely those of the authors and do not necessarily represent those of their affiliated organizations, or those of the publisher, the editors and the reviewers. Any product that may be evaluated in this article, or claim that may be made by its manufacturer, is not guaranteed or endorsed by the publisher.
Supplementary material
The Supplementary Material for this article can be found online at: https://www.frontiersin.org/articles/10.3389/frsen.2025.1551139/full#supplementary-material
References
Bachmann, C. M., Abelev, A., Philpot, W., Doctor, K. Z., Montes, M. J., Fusina, R., et al. (2014). “Retrieval of sand density from hyperspectral BRDF,” in Algorithms and technologies for multispectral, hyperspectral, and ultraspectral imagery XX (SPIE).
Ben-Dor, E., Levin, N., Singer, A., Karnieli, A., Braun, O., and Kidron, G. J. (2006). Quantitative mapping of the soil rubification process on sand dunes using an airborne hyperspectral sensor. Geoderma 131, 1–21. doi:10.1016/j.geoderma.2005.02.011
Boardman, J. W. (1993). “Automating spectral unmixing of AVIRIS data using convex geometry concepts,” in Fourth airborne visible/infrared imaging spectrometer (AVIRIS) airborne geoscience workshop. Editor R. O. Green (Pasadena, CA: Jet Propulsion Laboratory), 11–14.
Boardman, J. W. (1994). Geometric mixture analysis of imaging spectrometery data. Proc. Int. Geoscience Remote Sens. Symp. 4, 2369–2371.
Bradley, C. L., Thingvold, E., Moore, L. B., Haag, J. M., Raouf, N. A., Mouroulis, P., et al. (2020). “Optical design of the Earth surface mineral dust source investigation (EMIT) imaging spectrometer,” in Imaging spectrometry XXIV: applications, sensors, and processing, 1150402
Candès, E. J., Li, X., Ma, Y., and Wright, J. (2011). Robust principal component analysis? J. Assoc. Comput. Mach. 58, 1–37. doi:10.1145/1970392.1970395
Clark, R. N., and Roush, T. L. (1984). 'Reflectance Spectroscopy: quantitative analysis techniques for remote sensing applications. J. Geophys. Res. 89, 6329–6340. doi:10.1029/jb089ib07p06329
Green, R. O., Mahowald, N., Ung, C., Thompson, D.R., Bator, L. M., Bennet, M., et al. (2020). The Earth Surface Mineral Dust Source Investigation: An Earth Science Imaging Spectroscopy Mission, in: 2020 IEEE Aerospace Conference. Presented at the 2020 IEEE Aerospace Conference, pp. 1–15. doi:10.1109/AERO47225.2020.9172731
González-Romero, A., González-Flórez, C., Panta, A., Yus-Díez, J., Córdoba, P., Alastuey, A., et al. (2024). Characterization of the particle size distribution, mineralogy, and Fe mode of occurrence of dust-emitting sediments from the Mojave Desert, California, USA. Atmos. Chem. Phys. 24, 9155–9176. doi:10.5194/acp-24-9155-2024
Hapke, B. (2012). Theory of reflectanace and emittance spectroscopy. 2nd Edn. Cambridge, UK: Cambridge University Press.
Hunt, G. R. (1977). Spectral signatures of particulate minerals, in the visible and near-infrared. Geophysics 42, 501–513. doi:10.1190/1.1440721
Hunt, G. R., and Salisbury, J. W. (1970). 'Visible and near infrared spectra of minerals and rocks. I. Silicate minerals. Mod. Geol. 1, 283–300.
Kimmel, B., and Baranoski, G. V. (2007). A novel approach for simulating light interaction with particulate materials: application to the modeling of sand spectral properties. Optics Express. 15 (15), 9755–9777.
Kocurek, G. (1981). Significance of interdune deposits and bounding surfaces in aeolian dune sands. Sedimentology 28, 753–780. doi:10.1111/j.1365-3091.1981.tb01941.x
LP_DAAC (2023). LP DAAC—new NASA mission EMIT launched to the international space station. Available online at: https://lpdaac.usgs.gov/news/new-nasa-mission-emit-launched-to-the-international-space-station/.
McInnes, L., Healy, J., Saul, N., and Großburger, L. (2018). UMAP: Uniform Manifold approximation and projection. J. Open Source Softw. 3, 861. doi:10.21105/joss.00861
Ouyang, S., Xu, J., Chen, W., Dong, Y., Li, X., and Li, J. (2022). A fine-grained genetic landform classification network based on multimodal feature extraction and regional geological context. IEEE Trans. Geoscience Remote Sens. 60, 1–14. doi:10.1109/tgrs.2022.3203606
Pearson, K. (1901). LIII. On lines and planes of closest fit to systems of points in space. Philos. Mag. 2, 559–572. doi:10.1080/14786440109462720
Small, C. (2004). The landsat ETM+ spectral mixing space. Remote Sens. Environ. 93, 1–17. doi:10.1016/j.rse.2004.06.007
Small, C., and Milesi, C. (2013). Multi-scale standardized spectral mixture models. Remote Sens. Environ. 136, 442–454. doi:10.1016/j.rse.2013.05.024
Small, C., and Sousa, D. (2022). The Sentinel 2 MSI spectral mixing space. Remote Sens. 14, 5748. doi:10.3390/rs14225748
Small, C., and Sousa, D. (2023). Multiscale topology of the spectroscopic mixing space: impervious substrates. ArXiv 2307, 04716. doi:10.48550/arXiv.2307.04716
Small, C., and Sousa, D. (2024). The standardized spectroscopic mixture model. Remote Sens. 16, 3768. doi:10.3390/rs16203768
Small, C., Steckler, M., Seeber, N., Akhter, H., Goodbred, S., Mia, B., et al. (2009). Spectroscopy of sediments in the ganges-brahmaputra delta: spectral effects of moisture, grain size and lithology. Remote Sens. Environ. 113, 342–361. doi:10.1016/j.rse.2008.10.009
Sousa, D., Brodrick, P., Cawse-Nicholson, K., Fisher, J. B., Pavlick, R., Small, C., et al. (2022). The spectral mixture residual: a source of low-variance information to enhance the explainability and accuracy of surface biology and geology retrievals. J. Geophys. Res. 127. doi:10.1029/2021jg006672
Sousa, D., and Small, C. (2017). Global cross calibration of Landsat spectral mixture models. Remote Sens. Environ. 192, 139–149. doi:10.1016/j.rse.2017.01.033
Sousa, D., and Small, C. (2018). Multisensor analysis of spectral dimensionality and soil diversity in the Great Central Valley of California. Sensors 18, 583–617. doi:10.3390/s18020583
Sousa, D., and Small, C. (2019). Globally standardized MODIS spectral mixture models. Remote Sens. Lett. 10, 1018–1027. doi:10.1080/2150704x.2019.1634299
Sousa, D., and Small, C. (2021). Joint characterization of multiscale information in high dimensional data. ArXiv 2102, 09669. doi:10.48550/arXiv.2108.09545
Sousa, D., and Small, C. (2023). Topological generality and spectral dimensionality in the Earth mineral dust source investigation (EMIT) using joint characterization and the spectral mixture residual. Remote Sens. 15, 2295. doi:10.3390/rs15092295
Swain, P. H. (1973). in Laboratory for applications of remote sensing technical reports (West Lafayette: Purdue University), 4.A result from studies of transformed divergence
Thompson, D. R., Green, R. O., Bradley, C., Brodrick, P. G., Mahowald, N., Ben Dor, E., et al. (2024). On-orbit calibration and performance of the EMIT imaging spectrometer. Remote Sens. Environ. 303, 113986. doi:10.1016/j.rse.2023.113986
Keywords: reflectance, spectrosccopy, imaging, hyperspectral (HS), EMIT, sand, evaporite, feature space
Citation: Small C and Sousa D (2025) Multiscale topology of the spectroscopic mixing space: crystalline substrates. Front. Remote Sens. 6:1551139. doi: 10.3389/frsen.2025.1551139
Received: 24 December 2024; Accepted: 05 May 2025;
Published: 29 May 2025.
Edited by:
Xinghua Li, Wuhan University, ChinaReviewed by:
Weitao Chen, China University of Geosciences Wuhan, ChinaJia Li, Southern University of Science and Technology, China
Copyright © 2025 Small and Sousa. This is an open-access article distributed under the terms of the Creative Commons Attribution License (CC BY). The use, distribution or reproduction in other forums is permitted, provided the original author(s) and the copyright owner(s) are credited and that the original publication in this journal is cited, in accordance with accepted academic practice. No use, distribution or reproduction is permitted which does not comply with these terms.
*Correspondence: Christopher Small, Y3NtYWxsQGNvbHVtYmlhLmVkdQ==