 Adrien Le Guillou
 Simona Niculescu
- 1Laboratory LETG, Université de Brest, Brest, Bretagne, France
- 2Institut Universitaire Français (IUF), Paris, France
The role of wetlands in coastal area processes must be recognized and strengthened. Unless the hydrological and related functions of coastal wetlands are maintained, the success of sustainable coastal development is uncertain. In this study, an initial methodology section is dedicated to the calculation and normalization of several topographic indices to assess soil moisture susceptibility in coastal wetland areas. By providing detailed information on the elevation and topographic structure of coastal wetlands, this study uses various topographic indices, including the Topographic Wetness Index (TWI), the Topographic Position Index (TPI), the Multi-Resolution Valley Bottom Flatness (MRVBF). Additionally, the study considers valley depth, which can contribute to a better understanding of hydrological dynamics, water level variations, and water flow zones during the process of mapping and monitoring changes in these environments. The second research aim of this work is evaluation of the pre-localization of potential coastal wetland areas and their evolution over time in relation to impervious surface changes in Brittany. The analysis reveals that between 1990 and 2020, the area of potentially impervious wetlands increased by 18.3% from 145.3 km2 to 171.95 km2. By combining these pre-localization results with Corine Land Cover (CLC) data and OCS GE, the study highlights the influence of urbanized and impermeable area on coastal wetlands dynamics between 1990 and 2020. The third aim in of this article focuses on assessing the quality of the “binary classification” of wetlands and non-wetlands. A inventory focus on coastal wetlands (carried out by stakeholders between 2011 and 2019) is used as reference data to check whether the proposed methodology is effective and, if so, to determine the score at which it gives satisfactory results. Model performance metrics show a high recall of 0.948 for non-wetland areas, though with moderate precision (0.798), suggesting occasional misclassification of wetland areas as non-wetlands. For wetland areas, the approach achieved high precision (0.936) but a lower recall (0.759), indicating challenges in detecting all existing wetland areas. The overall accuracy of 0.854 and a Kappa coefficient of 0.708 point to a solid performance of the binary classification methodology.
1 Introduction
Coastal wetlands are essential ecosystems for biodiversity and play a crucial role in the regulation of biogeochemical cycles (Reddy et al. (2022), protecting coasts from erosion (Nayak and Bhushan (2022), and mitigating the impact of storms (Allam (1978). Effective integration and maintenance of the hydrological functions of coastal wetlands can help to improve coastal water quality, reduce the risk of damage to health and loss of life and property, increase the economic value of coastal lands, and maintain coastal biodiversity. However, coastal wetlands are facing numerous pressures related to climate change, such as rising sea levels as well as human activities (Newton et al. (2020), such as coastal urbanization, that are accelerating their degradation and transforming their dynamics (Mitsch and Gosselink (2015); Davidson (2014). It is important to have reliable and accurate methods and tools for detecting and localizing these environments to better understand the condition of coastal wetlands. According to the Global Wetland Outlook, around 35% of the world’s wetlands disappeared between 1970 and 2015, a rate of decline three times faster than that of forests (Davidson (2014); Ramsar (1971). Coastal wetlands, such as mangroves, coastal marshes, and estuaries (Sievers et al. (2021), are particularly vulnerable to the combined effects of human activities, including urbanization, conversion to agricultural land and pollution, and climate change (Ballut-Dajud et al. (2022), which can result in adverse effects including sea-level rise and the intensification of extreme weather events Vinayachandran et al. (2022). These pressures are leading to increased degradation of water quality (Trebitz and Herlihy (2023), loss of habitat, and reduced resilience of coastal ecosystems. Faced with these challenges, the conservation and restoration of coastal wetlands have become strategic priorities in several international agreements, notably the Ramsar Convention and sustainable Development Goals of the United Nations, which encourage the sustainable management of these environments to ensure their preservation and their ability to adapt to future pressures (United Nations Environment Programme (UNEP) (2021).
To sustainably monitor and manage these areas, certain methods can be particularly effective. The use of altimetric data, such as Digital Terrain Models (DTMs), has proven highly efficient for their detection and for understanding their dynamics. Altimetry data (such as DTMs) provide valuable information on land surface topography (Allam (1978), which is essential for assessing hydrological dynamics and water level variations in these areas (Chen et al. (2022). In addition, the contribution of satellite imagery, combined with data such as DTMs, is particularly valuable. Due to their spectral information, these data enable the characterization of vegetation and the identification of water bodies over time through the re-visit capabilities of satellites. Furthermore, the complementarity between DTMs and satellite imagery enhances the analysis by integrating topographic details with spectral and temporal information, offering a more comprehensive understanding of the areas studied (Ozesmi and Bauer (2002).
Detection and pre-localization of coastal wetlands remains a methodological challenge due to the inherent complexity of these environments, their spatiotemporal variability, and the limitations of remote sensing data in terms of spatial and temporal resolution (Mahdavi et al. (2018). Traditional approaches, based on the analysis of optical images, have limitations in areas covered by dense vegetation or during bad weather conditions, reducing the quality and frequency of usable data (Adam et al. (2010). To overcome these limitations, methodologies have been developed that incorporate multiple data sources, such as a combination of LIDAR, RADAR (Montgomery et al. (2019); Richard Allen et al. (2013), and satellite image data (Niculescu et al. (2020). Methodologies based on the synergy between RADAR, LIDAR, and optical data enhance hydrological and ecological modeling by providing high-resolution, multidimensional datasets that capture both the physical and biological characteristics of coastal wetlands. Radar data contribute to precise surface and subsurface moisture assessments, critical for simulating water flow and retention. LiDAR, with its fine-scale elevation measurements, accurately delineates microtopographic features and hydrological pathways, essential for modeling water dynamics and flood patterns. Optical data, which offer detailed spectral information, enable the identification and monitoring of vegetation types and conditions, which are integral to ecological modeling. The integration of these data sources ensures that models reflect the complexity of interactions between topography, vegetation, and hydrological processes, thereby improving predictions of ecosystem responses to environmental changes and management interventions (Zhang et al. (2018); DeLancey et al. (2019).
DTMs play an essential role in modeling water flow zones in coastal wetland ecosystems. By providing detailed information on the elevation and topographic structure of these environments, they can be used to calculate topographic indices such as the TWI and the TPI. The TWI, based on local slope and flow accumulation, is widely used to identify areas of potential saturation and to model locations likely to accumulate water during periods of rainfall or when the water table rises. The TPI, which measures the relative position of a point in relation to its immediate surroundings, can be used to distinguish depressions and areas of high altitude, making it easier to characterize the microreliefs influencing the distribution of surface water flows (Weiss (2001). These altimetric variables are combined with remote sensing data through spatial analysis and data integration techniques. For instance, digital terrain models (DTMs) derived from altimetric variables provide detailed topographic information, which can be overlaid with spectral and temporal data from remote sensing imagery. This fusion allows for the identification of hydrologically active zones, such as areas of potential water retention or flow pathways. The objective is to detect potential wetland areas by leveraging topographic insights from altimetric data alongside spectral indicators from remote sensing, such as vegetation health or water presence. This integrated approach enhances the ability to map and monitor wetlands, supporting their sustainable management by targeting areas most critical for conservation or restoration (Rodhe and Seibert (1999); Higginbottom et al. (2018); Infascelli et al. (2013).
The main objective of this study is to develop an integrated methodological approach for the detection, pre-location and characterization of coastal wetlands areas in Brittany region using altimetry data and exogenous datasets including Corine Land Cover (CLC) and OCS GE data (between 1990 and 2020) and a wetland inventory (carried out by stakeholders between 2011 and 2019). More specifically, the study aims to detect and pre-localize potential wetlands by combining DTMs with land cover and land use data, taking advantage of their complementary strengths. The DTMs provide detailed topographic information essential for understanding the hydrological dynamics and water retention processes in these ecosystems. The use of CLC data enables the assessment of urbanized and impervious areas, providing a comparative analysis of land use and its impact on the potential functionality of wetlands. By integrating these datasets, the study seeks to refine the detection, pre-localization, and mapping of wetlands, highlighting hydrologically active areas while assessing the influence of human activities such as urbanization on wetland functionality. In addition, the study explores how altimetry variables, such as TWI and TPI, can be used with land cover data to improve the accuracy of wetland detection and assess interactions with impervious surfaces. This approach aims to provide valuable information on the dynamics of coastal wetlands, supporting sustainable management and conservation strategies in the face of climate change and increasing anthropogenic pressures.
2 Materials and methods
2.1 Study site
Brittany (Figure 1), a region located in the far west of France, is distinguished by its unique hydrological characteristics and diverse landscapes, shaped by an oceanic climate and strong maritime influence. The Brittany region is characterized by relatively low altitudes, with a gently undulating landscape shaped by ancient geological processes. The region’s highest point is the Roc’h Ruz, located in the Monts d’Arrée, which peaks at 385 m above sea level. Brittany’s average altitude is approximately 50 m, reflecting its predominantly low-lying terrain. The slopes are generally moderate, with steeper inclines concentrated in the central areas, and gentler slopes dominating the coastal plains and river valleys. This topographical diversity plays a significant role in influencing hydrological dynamics, including water flow and wetland distribution, across the region. The region has a dense hydrographic network, consisting mainly of short rivers and coastal streams, such as the Vilaine, Odet, and Blavet. Rainfall is relatively high, ranging from 700 to 1,200 mm per year (Hainry and Colombet (2009), with regular precipitation that is particularly concentrated in autumn and winter. The region’s geology, dominated by impermeable granite and schist soils (Ballevre et al. (2013), limits infiltration and promotes surface runoff, thereby increasing the risk of seasonal flooding. This is especially the case in small drainage basins, which are sensitive to climatic variations and human activities (BRGM, 2011).
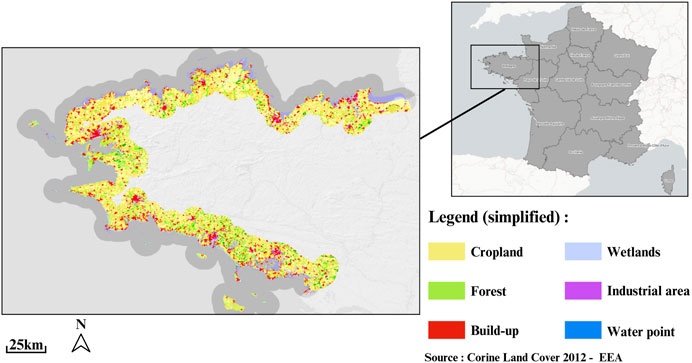
Figure 1. Location of the study area - Brittany (France) at national and regional levels.
According to Hallégouët and Poncet in 1980 in their book ‘Evolution of coastal wetlands in Brittany’. we learn that at that date there were around 1,137 km2 of wetlands along the entire Brittany coastline. Hallégouët and Poncet (1980) These varied environments, including marshes, peat bogs, estuaries, and flood zones (Bioret and Kerberiou (1994), play a crucial role in regulating hydrological cycles, filtering water, and providing protection against floods and coastal erosion (Barbier (2013). Wetlands, and coastal wetlands in particular, play also an essential role in maintaining biodiversity and ecosystem services (Gopal (2009), including hydrological regulation (Bullock and Acreman (2003), carbon storage (Nahlik and Fennessy (2016), coastal protection against erosion, and as a habitat for a wide variety of species (Weller (1999). Among the notable areas, the National Nature Reserve of “L’étang de Chéran” and the Guérande marshes stand out for their ecological diversity and importance for migratory birds, which find suitable habitats there for breeding and feeding. Furthermore, the Bay of Saint-Brieuc, classified as a Special Protection Area (SPA) and Ramsar site, is another emblematic example of the richness of Brittany’s wetlands, providing sanctuary for numerous endangered species, such as shorebirds, redshanks, and great crested grebes. However, these ecosystems face increasing pressures from urbanization, intensive agriculture, and climate change, making their conservation and management all the more critical. The preservation of wetlands is therefore essential not only for maintaining biodiversity but also for safeguarding the ecosystem services they provide to the region and its inhabitants.
Land use in Brittany shows a predominance of agricultural land, covering approximately 70% of the territory and focusing primarily on livestock and forage crop activities (EEA). This agricultural dominance has significant environmental impacts, particularly through the runoff of pollutants such as nitrates and phosphates, which affect the quality of surface and groundwater. Although relatively limited, urban areas are gradually expanding around major urban centers such as Rennes, Brest, and Lorient, contributing to increased soil artificialization and added pressure on local water resources. Land use maps, such as those produced by the CORINE Land Cover program and Sentinel imagery, provide a basis for monitoring these changes and measuring the impact of human activities on the natural ecosystems of Brittany. In the field study of remote sensing, S. Rapinel and Laurence Hubert-Moy are prominent researchers in this application for wetlands study in Brittany, particularly on the Pleine-Fougères or Couesnon floodplain close to the Mont-Saint-Michel Bay. Their work has advanced the understanding and mapping of these ecosystems Rapinel et al. (2019), Rapinel et al. (2015), Rapinel et al. (2018).
Urban planning in Brittany is characterized by a high fragmentation of urban spaces, often due to a combination of urban sprawl, small municipalities, and a great diversity of landscapes (Le Lannou (1950). This fragmentation results in an uneven distribution of infrastructure, marked peri-urbanization, and the fragmentation of agricultural land. Many municipalities, especially in rural areas, suffer from a lack of coherence in land use planning, complicating the organization of transport and public services. According to a study by the Île-de-France Region Institute for Planning and Development, this situation poses challenges for the sustainability and integration of public policies on housing and the environment in Brittany. In response, urban space management initiatives, such as the “Bretagne Horizon 2040” project1, aim to promote more integrated and sustainable urban development while preserving the unique characteristics of the region.
2.2 Data
2.2.1 BD alti/DTM
In this study focuses on monitoring and pre-locating potential coastal wetlands we will use the BD Alti® dataset as the primary source of topographic data. This digital elevation model (DTM) provides high-resolution terrain information, making it foundational for the calculations and algorithms applied in our approach. With its detailed depiction of landscape morphology, BD Alti enables accurate water accumulation analyses and helps identify potential retention zones. These data thus serve as the starting point for the spatial processing and analytical methods that will be further outlined in the following sections.
BD Alti® 25 m2 (Figure 2) is a reference altimetric database in France, developed and maintained by the National Institute of Geographic and Forest Information (IGN). Covering the entire metropolitan territory, this database provides a digital terrain model (DTM) with a 25-m resolution, offering a continuous representation of altitudes on regular 25 m × 25 m grids. It is primarily intended for applications requiring medium-resolution accuracy over large geographic areas.
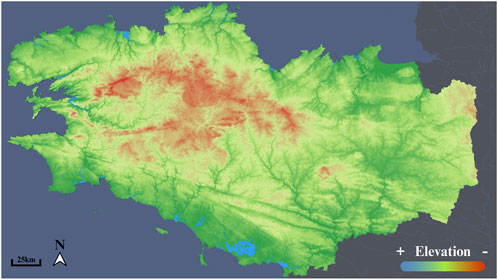
Figure 2. Digital terrain Model (DTM) of Brittany: Topographic Features and Variations from BD AltiⒸ(IGN).
The BD Alti® 25 m relies on a range of data collection and integration methods, including aerial photogrammetry, satellite remote sensing, LiDAR surveys, and topographic maps from previous field campaigns (IGN (2021). The main production method is based on photogrammetry, which allows altitude measurements to be derived from aerial images using triangulation techniques. The images are obtained through systematic flyover campaigns conducted by IGN, supplemented by satellite data to cover hard-to-access areas. Data processing includes error corrections, filtering of outlier points, and altitude harmonization to ensure continuous altimetric representation across the entire territory (IGN (2021).
The DTM of BD Alti® provides an average altitude for each cell in this grid. This resolution is particularly suited to medium-scale applications, such as slope mapping, hydrological flow modeling, and landscape dynamics studies (IGN, 2020). The altimetric data are structured as a grid matrix, making it compatible with geographic information system (GIS) software and facilitating the extraction of topographic indices, such as the TWI or the TPI, commonly used to characterize wetlands and flow dynamics (Weiss (2001). The IGN’s BD Alti® 25 m was initially produced in the 1990s, with regular updates to improve accuracy and incorporate new data. The current version is the result of several successive enhancements, the most recent of which took place in the 2010s to integrate (modern) remote sensing techniques as aerial photogrammetry and new LiDAR acquisitions in certain regions.
2.2.2 Corine land cover database (1990 and 2020)
In this study, we also used the CLC database (1990 and 2020). Developed by the European Environment Agency (EEA), the CLC database is a comprehensive and consistent dataset designed to monitor land cover in Europe. First launched in 1990, CLC provides a detailed classification of land cover types through a 44-class hierarchical system that encompasses both natural and anthropogenic land cover categories. The database is derived from satellite imagery, which is processed and validated using remote sensing techniques. Updated periodically, typically every few years, the CLC reflects changes in land cover, making it an invaluable resource for environmental research, land use planning, and ecological modeling. With a spatial resolution of 100 m, the CLC dataset supports the analysis of land cover dynamics, biodiversity, and the impacts of land use changes on ecosystems. Its consistent methodology and wide applicability make it a crucial tool for assessing land cover patterns and trends across Europe, as well as for informing European Union policies on environmental protection and sustainable development.
2.2.3 A wetland inventory (carried out by stakeholders between 2011 and 2019)
Since 2011, wetland inventories in Brittany have been systematically conducted by local stakeholders, including local authorities. Each actor is responsible for conducting an inventory and mapping of wetlands within their respective territories, often defined by catchment areas or specific geographical units. There is no specific inventory of coastal wetlands, but since a comprehensive inventory has been conducted across the entire Brittany region, it is possible to extract only those wetlands located in coastal areas. The inventory process involves detailed field surveys, combined with the use of advanced tools such as GIS and remote sensing technologies. This approach facilitates the production of high-resolution, regularly updated maps of wetland ecosystems, allowing for precise identification of wetland boundaries, types, and functional characteristics. These fine-scale maps offer a deeper understanding of wetland distribution, dynamics, and ecological functions. This inventory has the advantage of being highly accurate, as it is an in situ wetland inventory. This means that extensive fieldwork was conducted each time to characterize wetlands at a specific moment in time. As a result, this inventory stands out for its precision and effectiveness, although it requires a very long revisit time. Another inventory, also conducted at the scale of Brittany, was carried out by modeling potential wetlands (using a methodology similar to ours). This inventory, conducted by UMR SAS INRAE - Agro Rennes Angers, uses the Beven-Kirby index. This index, similar to the Topographic Wetness Index (TWI), allows for reliable pre-location of wetlands based on elevation data. However, the use of a single topographic variable, such as the Beven-Kirby index, has limitations compared to our methodology with the combined use of multiple topographic variables (such as TWI, Topographic Position Index (TPI), Terrain Ruggedness Index (TRI), etc.). Indeed, a multivariate approach better captures the complexity of environmental conditions influencing wetland formation. For example, the TPI (Topographic Position Index) adds an additional dimension by identifying relative topographic positions, such as depressions, slopes, or ridges.
The integration of these individual inventories is coordinated by Géobretagne,3 a platform managed by the Direction régionale de l’Environnement de l’aménagement et du logement (DREAL) Bretagne and the Région Bretagne (Regional Council). Géobretagne consolidates all the data into a single comprehensive database, accessible through an online portal. This centralized system allows for data standardization, ensuring that all wetland information from different actors is harmonized and accessible, thereby facilitating region-wide monitoring and management. Each local actor, including regional planning bodies and environmental organizations, update their inventories to reflect changes in land use, natural processes, and human activities. This ongoing monitoring provides essential data that informs decision-making processes related to sustainable land management, conservation policies, and climate adaptation strategies.
3 Methodology
The methodology of this study is structured into three interconnected parts: models for calculating topographical indices, extraction of impervious areas from the Corine Land Cover database, and accuracy assessment (Figure 3). Each part contributes to achieving the final objective, namely, detection and pre-localization of coastal wetlands in Brittany using topographical indices from altimetric and remote sensing data.
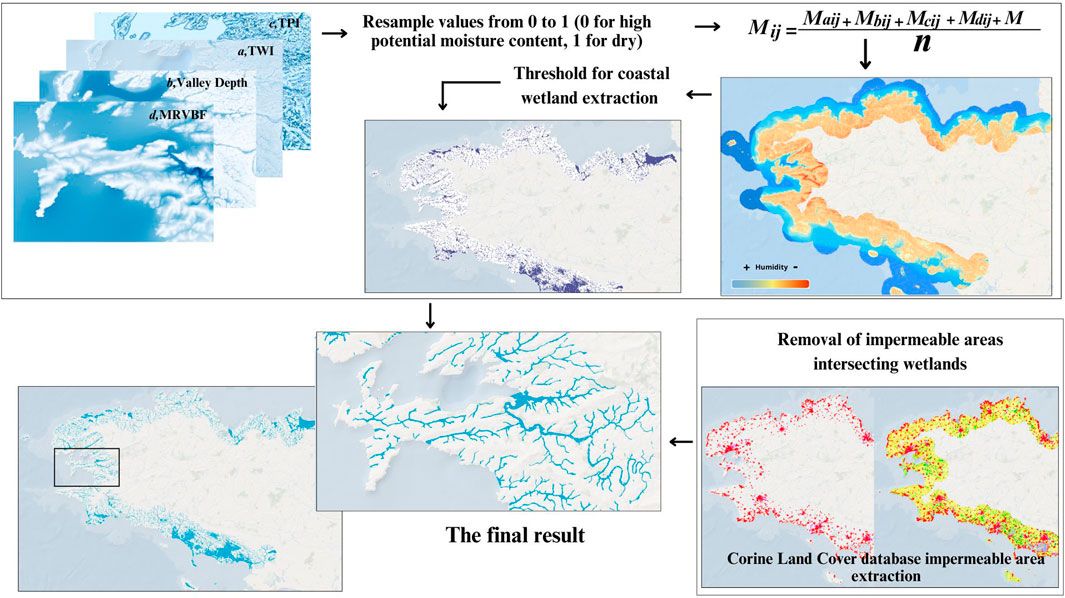
Figure 3. Methodological framework for detection and pre-localization of coastal wetlands in Brittany, France.
3.1 Models for calculating topographical indices
The first step is based on the calculation of several topographic indices (TWI, TRI, valley depth, MRVBF, and TPI) to assess soil moisture susceptibility in coastal wetland areas. Each of these indices plays an essential role in understanding hydrological dynamics, water level variations, water flow zones, and the spatial distribution of wetland ecosystems. Soil moisture susceptibility is used to detect and pre-localize coastal wetland area (Thanks to this, we can also study the hydro-ecological continuity of wetlands, also known as the blue network). In this first part, we present the variables and algorithms employed in the analysis, followed by an explanation of how these variables were utilized to produce a wetland map at the regional scale in Brittany.
All calculations were conducted using the open-source software SAGA GIS which is available with a graphical interface and integrated into QGIS 3.22.124.
The Topographic Wetness Index (Equation 1) (Beven and Kirkby (1979) is a dimensionless index that quantifies the spatial distribution of soil moisture based on topography. It is calculated using the following formula:
where A represents the contributing area per unit width, and
The Terrain Ruggedness Index (Equation 2) (TRI, Riley et al. (1999) quantifies terrain complexity by calculating the variability of elevation over a defined area. It is obtained by assessing elevation changes within a specified window size, resulting in an index that represents the roughness of the landscape. High TRI values indicate areas with significant elevation variations, often associated with various hydrological conditions. This index is particularly relevant for detecting wetlands located in mountainous environments, such as montane marshes and headwater wetlands, where topographic variability significantly influences hydrological dynamics and habitat availability (Riley et al. (1999).
The formula for TRI can be expressed as follows (Figure 4):
where
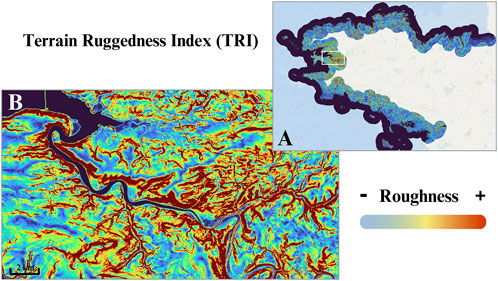
Figure 4. Variability of terrain roughness (TRI) along the Brittany coast (A): global analysis and local focus on a Crozon estuary (B).
Valley depth is a measure of the vertical distance between the highest point of a watershed and the valley floor. This parameter is essential for understanding the potential for water accumulation and retention in low-lying areas, making it a critical factor in the formation of wetlands. Valley depth can indicate a region’s capacity to support different types of wetlands, such as estuarine wetlands and coastal marshes, which thrive in valleys where marine and freshwater influences converge. Analyzing valley depth allows for a better assessment of these areas’ ability to support wetland ecosystems and their associated biodiversity.
The formula for valley depth (Equation 3) can be expressed as follows:
Where
Multi-Resolution Valley Bottom Flatness (MRVBF) (Gallant and Dowling (2003) (Figure 6) assesses the flatness of valley bottoms using multiple resolutions of topographic data. The MRVBF is calculated by comparing the elevation of valley bottoms to that of their surroundings, allowing for the identification of systematically flat areas likely to retain water. This index is particularly useful for detect wetlands that require prolonged water retention, such as riparian zones, floodplains, and coastal marshes, which are essential for biodiversity and ecosystem services.
MRVBF (Equation 4) is calculated using the following equation:
Where
The Topographic Position Index (TPI) (Equation 5) (Guisan et al. (1999) (Figure 6) is a dimensionless index that quantifies the relative position of a point within the landscape, based on its upstream contributing area and slope angle. It is computed using the following formula:
where A is the contributing area,
The Topographic Wetness Index (TWI) (Beven and Kirkby (1979) (Figure 6) is an essential tool for the detection of wetlands, particularly riparian wetlands, due to its ability to quantify water accumulation based on topography and flow patterns. This index also helps detect floodplains, which are frequently inundated, as well as marshes and swamps where water accumulates. The use of the TRI makes it possible to relatively easily highlight estuarine areas, particularly mudflats and salt marshes, which are characterized by very flat topography in the intertidal zone. In addition, continental water bodies, due to their very smooth surface, are also easily identifiable using this index. (Figure 4 In addition, valley depth is a key indicator for areas where water accumulation is likely, allowing the detection of estuarine marshes, floodplains, and coastal wetlands (Sparks (1995). The MRVBF enables assessment of the flatness of valley bottoms, which is crucial for detecting wetlands that retain water, such as riparian wetlands and salt marshes. Finally, the TPI is particularly useful for identifying water contribution areas and facilitating the detection of freshwater and saltwater marshes as well as transitional wetlands where freshwater and saltwater meet, thus supporting rich biodiversity. (Qiu et al. (2017).
3.2 Statistical and analytical methods for combining standardized indices into a composite score
The methodology adopted in this study is based on the calculation and normalization of several topographic indices to assess soil moisture susceptibility in coastal wetland areas. The selected indices include the TWI, TRI, valley depth, MRVBF, and TPI (Figure 6). Each of these indices plays an essential role for understanding of hydrological dynamics, water level variations, water flow zones and the spatial distribution of wetland ecosystems.
Once the indices have been calculated, the next step is to normalize them on a scale from 0 to 1 (Equation 6), where a score of 0 represents a wet condition and a score of one corresponds to a non-wet state. This normalization is essential to harmonize the different units and scales of the indices, thereby facilitating direct comparison among them. For normalization, a min/max method was applied to standardize the pixel values of the raster, scaling them to a range of 0–one using the formula:
Through this standardized approach, it becomes possible to integrate the indices into a comparative analysis, providing a solid foundation for assessing soil moisture susceptibility in the detection, understanding, and pre-localization of wetlands areas. After the normalization, an integrative scoring of the various variables is conducted. This step involves applying statistical and analytical methods to combine the normalized indices into a composite score. A composite score was calculated to represent the soil moisture gradient by integrating multiple raster-based variables. Each variable was normalized to a range of 0–one to ensure comparability, and the composite score was derived as the mean value across all variables for each raster cell. This approach provides a single metric per pixel, effectively summarizing the combined influence of multiple contributing factors into a unified gradient that reflects variations in soil moisture (Figure 5). This composite score reflects the relative soil moisture sensitivity, enabling the generation of a detailed map of sensitive areas. This mapping serves as a valuable tool for water resource management and ecosystem conservation as it identifies areas likely to be affected by climatic variations and human activities (Figure 3). The results of this study yield a 25-m resolution soil moisture map, providing a global view of moisture gradients across the entire Brittany region, including the coastal wetlands. This approach enables the identification of soil moisture variations in different geographic areas.
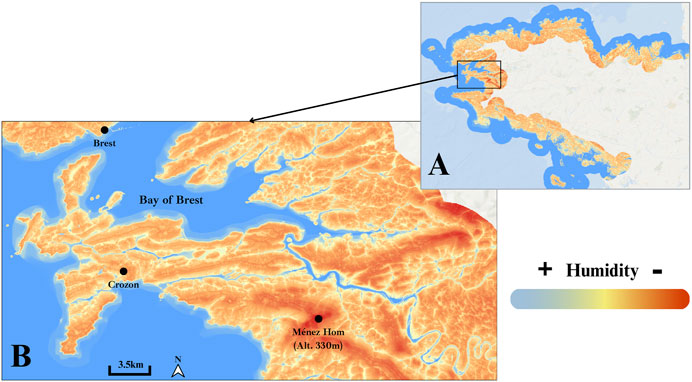
Figure 5. Mapping of soil moisture sensitivity in the coastal areas of Brittany using the proposed methodology. On a global scale (A); on the scale of the Crozon Peninsula and the Bay of Brest (B).
3.3 Extraction of impervious areas from the Corine Land Cover database via intersection of built-up layers
To further refine these results, we integrated complementary datasets, such as Corine Land Cover (CLC) and OCS GE5, depending on the required level of detail. The contribution of CLC allows for the incorporation of a land-use dimension to account for impervious areas located within potential wetland zones, particularly in coastal areas. Moreover, as the CLC database is regularly updated, it facilitates the analysis of changes in soil impermeabilization over time in relation to potential wetland zones. The inclusion of these data allows us to map impermeable areas, which we convert into raster format for integration into our analysis. Rather than simply assessing probable wetland areas, this approach enables a more accurate mapping of actual wetlands. By incorporating this information, we improve the precision of our assessment, providing a more comprehensive understanding, pre-localization, and spatial distribution of wetland ecosystems.
3.4 Accuracy assessment
The evaluation of classification performance is an important step in assessing the reliability and accuracy of methods applied to distinguish wetland and non-wetland areas using altimetric data. Among the widely used metrics for this purpose are precision, overall accuracy, and the kappa coefficient. Each of these metrics provides unique insights into the quality of the classification results, enabling a comprehensive understanding of the model’s performance.
Precision, also referred to as the positive predictive value, measures the proportion of correctly identified positive instances (e.g., wetland areas) relative to the total instances predicted as positive. Mathematically, precision is defined as the ratio of true positives (TPs) to the sum of TPs and false positives (FPs). This metric is particularly valuable in applications where minimizing FPs is critical as it reflects the confidence one can have in predictions labeled as positive. High precision indicates that the method effectively identifies wetlands with minimal misclassification of non-wetland areas as wetlands, which is especially important for applications requiring targeted conservation efforts or resource allocation.
Overall accuracy is another fundamental metric, representing the proportion of correctly classified instances (both wetland and non-wetland) out of the total number of instances. It is calculated by dividing the sum of TPs and true negatives (TNs) by the total number of observations. This metric provides a general assessment of the classifier’s performance across all classes. While straightforward and intuitive, overall accuracy can be influenced by class imbalance as it does not differentiate between the contributions of different classes to the final score. Despite this limitation, overall accuracy remains a widely used metric due to its simplicity and its ability to provide an overarching view of classification success.
The kappa coefficient, developed by Jacob Cohen in 1960 (Cohen (1960), offers a more nuanced evaluation of classification performance by accounting for the agreement expected by chance. The kappa statistic is calculated as follows: K = (
By employing all three metrics, we can gain a nuanced understanding of the strengths and weaknesses of different classification methods. For instance, the over-classification of wetland areas as non-wetland, or the inverse, can be identified and quantified through these measures. Precision directly addresses false positives, kappa highlights performance beyond random chance, and overall accuracy provides an overall snapshot.
3.4.1 Assessment the quality of the “binary classification” of wetlands and non-wetlands
To assess the quality of the classification of wetland and non-wetland areas, a wetland inventory was employed as reference data. This inventory, developed in collaboration with local stakeholders and regularly updated since its first edition in 2011, serves as a reliable dataset for validation. A total of 4,000 validation points were selected independently of the classification results, including 2,000 points within wetland areas and 2,000 points in non-wetland areas. These points provide a robust basis for evaluating the model’s performance using standard metrics such as accuracy, F1-score, and the Kappa coefficient.
Given the transitional nature of wetland boundaries, the proposed methodology applies a defined threshold to spatially differentiate wetlands from non-wetlands. This approach simplifies the classification process while acknowledging the presence of buffer zones between these areas. The selected validation points, derived from the wetland inventory, enable a detailed assessment of the model’s strengths and limitations.
4 Results
4.1 Detection and localization of soil moisture sensitivity in coastal wetlands
In this section, we analyze and evaluate the spatial distribution and sensitivity of soil moisture levels moisture across the study area, as derived from the composite scoring of normalized topographic indices (Figure 6).
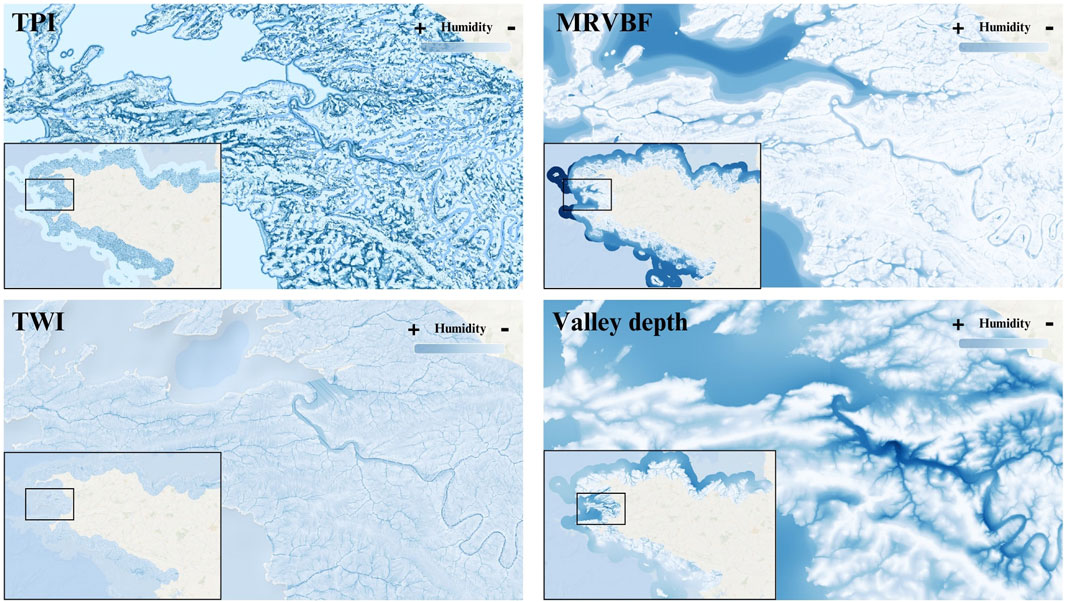
Figure 6. Illustration of topographic indices. Detection and localization of soil moisture sensitivity in coastal wetlands (Brittany, France), with a local focus on Crozon estuary.
This analysis reveals moisture gradients and identifies sensitive wetland zones across all the coast of Brittany, highlighting coastal regional variations. For example, northern Brittany is characterized by a steep coastal topography with cliffs, leading to wetlands primarily located in valley bottoms that drain directly toward the sea. In contrast, southern Brittany, particularly in the Morbihan department, features a much flatter landscape with gentle slopes. In this area, water tends to accumulate, similar to an alluvial plain, and flows more slowly, resulting in a different hydrological dynamic compared to the north. This contrast in topography influences the distribution and behavior of wetlands, with the north favoring rapid drainage and the south promoting water retention and slower runoff. By quantifying topographic properties, this approach provides a deeper understanding of the water accumulation and drainage dynamics that influence soil moisture availability. To validate these results, we compared them with a regional wetland inventory specific to Brittany conducted by local stakeholders, allowing us to assess the accuracy of our method in mapping actual wetland areas. This approach ensures a robust assessment of soil moisture sensitivity, enhancing the precision of wetland ecosystem mapping and supporting biodiversity conservation and water resource management efforts.
4.2 Detection and pre-localization of coastal wetlands in brittany
The results enable wetlands to be detected and pre-located, thereby providing an in-depth understanding of the spatial distribution of the main wetland ecosystem units and enabling their temporal evolution to be studied as a function of various factors affecting these regions, such as soil sealing, coastal erosion, and agricultural practices. To better understand the health of wetlands over time, impervious areas (such as roads, buildings, and construction sites) were identified using the CLC dataset. This made it possible to detect potential wetlands, identify impermeable areas, and analyze their temporal evolution between the first comparable dataset (1990) and the most recent (2020). This study focuses mainly on soil impermeability, assessed using CLC data to analyze changes in impermeability between 1990 and 2020.
For this analysis, the DTM was cross-referenced with aquatic zones encompassing the Gulf of Morbihan and several estuarine areas (Figure 7). This methodological approach, which incorporates altimetry data, also enables the modeling of intertidal zones subject to tidal fluctuations, where mudflats (slikkes) and salt marshes (schorres) follow one another. However, this approach may slightly overestimate the extent of wetlands, as it includes marine water bodies present in the gulf, estuaries, and intertidal zones.
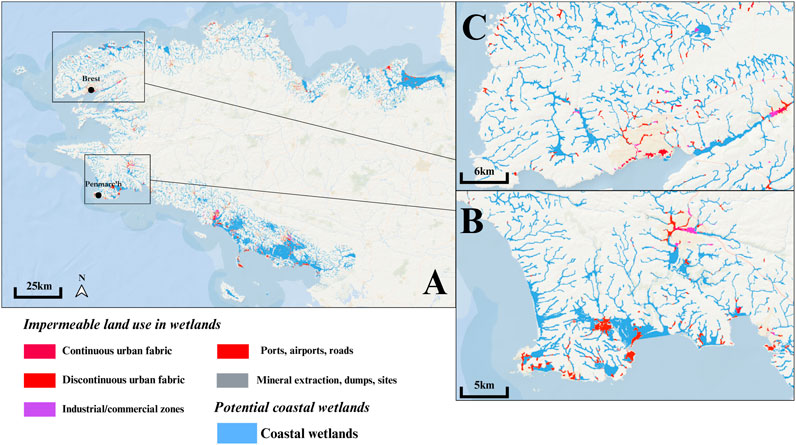
Figure 7. Detection and pre-localization of coastal wetlands and impermeabilized areas (wetlands affected by soil sealing) based on CORINE Land Cover data: Global scale (A); Audierne Bay (B); Northern Finsitère (C).
The pre-localization of wetland areas allows for a raw identification of all regions where water could potentially accumulate and create wetland environments due to gravity and surface runoff, in the absence of human intervention (Figure 5). This approach serves as a valuable methodological resource for identifying areas that could be targeted for rewilding or restoration as wetland habitats, especially if they are located in impermeable regions.
By combining the pre-localization of wetland areas with CLC data from 1990 to 2020, it becomes possible to assess the evolution of wetland areas in correlation with changes in impervious surfaces in Brittany. The proposed methodology therefore contributes to understanding the spatial distribution of the main ecosystem units within wetland areas. This fusion allows for the identification of hydrologically active zones, such as areas of potential water retention or flow pathways, and serves as a valuable methodological chain for water resource management and ecosystem conservation efforts by identifying areas likely to be affected by climatic variations and human activities.
In 1990, the results indicate that there were 145 km2 of potential coastal wetland areas in Brittany that had been impervious, compared to 171.9 km2 in 2020. This represents a 18.3% (Tables 1, 2) increase in impervious wetland areas over a 30-year period. It is important to note that other factors, such as erosion and agricultural practices, can also influence wetland areas, potentially contributing to changes in these results. An in-depth analysis of the different land use classes contributing to the impermeabilization of coastal wetlands in Brittany reveals that discontinuous urban fabric (representing 80.5% in 1990 and 79.8% in 2020) and industrial/commercial zones (11% in 1990 and 12% in 2020) are the primary factors. Together, these two classes account for approximately 90% of the impermeable surfaces affecting potential coastal wetlands in Brittany. This situation is not surprising, as the Breton coastal territory is characterized by fragmented habitats and urban sprawl dominated by single-family housing, explaining the predominance of discontinuous urban fabric. Additionally, Brittany has numerous port and commercial areas along its coastline, both military and public, which also contribute to the significance of industrial and commercial zones. However, a 17% increase in urban sprawl over the past 30 years has been observed, highlighting ongoing pressure on coastal wetlands.
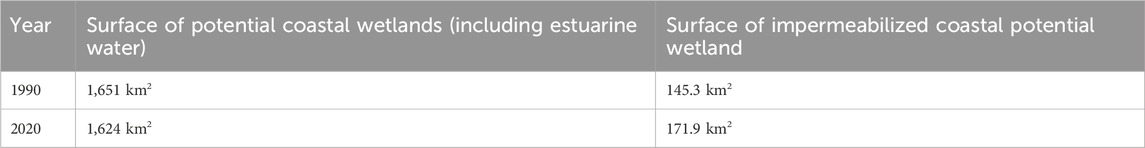
Table 1. Surface of potential coastal wetlands and impermeabilized coastal wetlands in brittany (France) from 1990 to 2020.
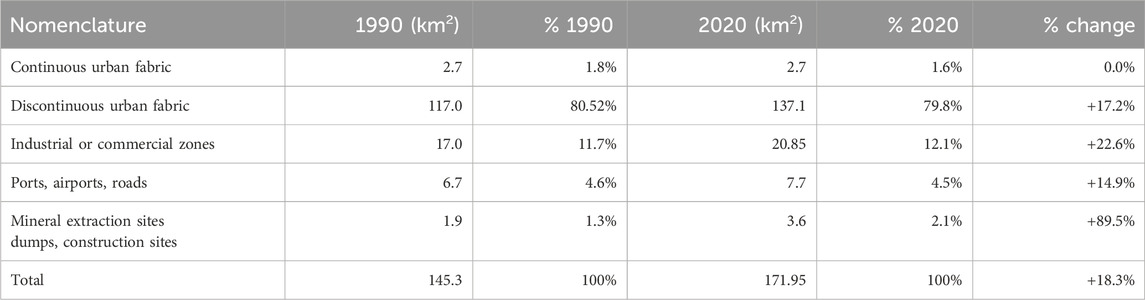
Table 2. Evolution of impervious surfaces in coastal wetlands in Brittany (1990–2020).
4.3 Estimating performance in detecting coastal wetland/non coastal wetland areas
To assess the quality of the “binary classification” of wetland and non-wetland areas, a wetland inventory was used as reference data to verify whether the proposed methodology is effective and, if so, to determine the score at which it performs adequately. In practice, there is a gradient (or buffer zone) between wetland and non-wetland areas, with transitions being gradual. However, the presented methodology establishes a threshold to spatially differentiate wetland areas from non-wetland areas. To evaluate the quality of this classification, 4,000 (Figure 8) points were selected independently of classification results based on a wetland inventory conducted by local stakeholders that is regularly updated. The first edition of this inventory was published in 20116 This dataset includes 2,000 points within wetland areas and 2,000 points outside of them (Figure 8). These points enable the calculation of various metrics to assess model performance, such as accuracy, F1-score, and Kappa. All the validation points have been implemented on the Brittany coast to ensure consistent metrics.
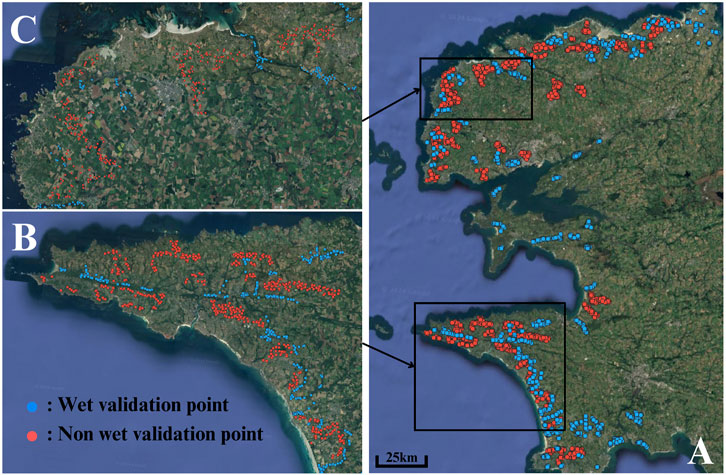
Figure 8. Distribution of validation points (Images Ⓒ2024 TerraMetrics) in coastal Brittany: 2,000 wet (red) and 2,000 non-wet (blue) validation points: Finistère (A); Audierne Bay (B); Nothern Finistère (C).
The results indicate that the model effectively identifies non-wetland areas, with a high recall of 0.948, demonstrating a strong detection capability. However, the precision for this class is more modest (0.798), suggesting a tendency to incorrectly classify some wetland areas as non-wetlands and therefore resulting in false positives.
For wetland areas, the methodology shows a high precision of 0.936, which means when an area is predicted as wetland, it is generally accurate. However, the lower recall (0.759) indicates a challenge in detecting all existing wetland areas, leading to a significant number of false negatives.
The Kappa coefficient of 0.708 and an overall accuracy of 0.854 reflect a decent performance, though with some imbalance. The model demonstrates strong performance in detecting non-wetland areas but is more conservative for wetland areas, suggesting room for improvement in balancing the classification of both categories.
5 Discussion
5.1 Comparison with other studies. Strengths and limitations of the study
This article is structured into three interconnected parts that form a methodology for improved detection and pre-localization of coastal wetlands. This methodology facilitates the pre-location of coastal wetlands and their spatial distribution across a given territory by combining topographic variables. By modeling areas of water accumulation and runoff, this approach provides an overview of potential wetlands, while also incorporating factors of soil impermeability derived from exogenous data sources, such as the Corine Land Cover (CLC) dataset. This approach can be compared to other studies that have used similar indices for soil moisture detection and pre-localization for mapping of ecosystems and units of wetlands. However, previous studies have often focused on a limited number of indices, such as the TWI alone, to assess soil moisture dynamics (Beven and Kirkby (1979). Here, by combining multiple indices and incorporating supplementary data sources, such as CLC and OCS GE, our methodology provides a more global understanding of detection, pre-localization, and mapping of wetland ecosystems. Moreover, the robustness of this methodology stems from its inherent flexibility and adaptability: the approach can be tailored by incorporating various combinations of topographic variables and leveraging diverse altimetric datasets at varying resolutions. This adaptability ensures its applicability to the distinct topographic characteristics of each study area, making it a versatile tool for diverse geographical contexts. Corine Land Cover can be replaced by finer-grained land cover data or even land cover mapping using machine learning, making this method even more automated. Currently, the presence of impermeable surfaces, such as urbanized areas or specific geological formations, can skew the interpretation of topographic indices. An improvement would involve incorporating more detailed information on soil types and land use, specifically excluding sandy areas or non-wetland depressions, to refine the mapping of potential wetland zones. This approach, combined with up-to-date and high-resolution data, allows for a more precise detection of water retention areas, particularly in depressions or regions with limited natural drainage.
The TRI is not tailored to detecting wetland areas but nevertheless proves valuable in identifying transitional zones characterized by abrupt changes in slope. Our study is a concrete example of the adaptability of this topographical index to coastal wetlands and its importance to the observation and analysis of transition zones between different ecosystems. Particularly in intertidal zones where salt marshes or salt meadows are found, characterized by very flat topography with minimal elevation changes, these areas can sometimes be challenging to detect. The TRI helps to highlight these very flat and smooth areas (Figure 4). This topographical index was previously applied to coastal wetlands by (Shaver et al. (2019), whose conclusions converge with our study. These zones are critical for understanding the interfaces between different ecosystems, such as salt marshes and upland areas. By emphasizing the ruggedness of terrain, the TRI highlights features like steep gradients that might otherwise be overlooked when focusing on flat or low-relief wetland areas. In coastal environments, TRI is particularly useful for delineating sharp transitions, such as those seen in cliffs or escarpments, compared to more gradual slopes like coastal plains or dune systems. For riparian zones and riparian ecosystems, the TRI can help differentiate between steep banks and flatter floodplains (Engelhardt et al. (2012); Baker and Wiley (2009); Baker (1989). While the TRI is predominantly applied in mountainous regions, its application in coastal and flat regions underscores its potential for detecting features that influence wetland boundaries. To enhance its utility in these contexts, modifications such as applying stronger weighting to specific ruggedness thresholds could improve its sensitivity to subtle but ecologically significant terrain changes in flat or lowland landscapes. Such adaptations would allow the TRI to better capture the complexity of transitional zones, further supporting wetland research and management.
A comparable study which studied the contribution of topographic index and optical image data is that of (Haas (2010), which uses TWI and Landsat imagery to predict vegetation distribution based on soil moisture. This study is notably comprehensive, offering in-depth insights into the TWI and its application in satellite imagery and thus providing a strong foundation for understanding the relationship between topography and vegetation. Furthermore, the inclusion of raster data from current geographic databases, such as OCS GE, enables us to account for impervious surfaces, enhancing the accuracy of wetland mapping. This approach not only extends Haas et al.‘s framework but also improves the overall precision of wetland mapping and soil moisture assessments. In 2013, Infascelli et al. published an article testing different topographical indices to predict the distribution of wetlands in a catchment in Brittany. This study shows that, depending on the variable or index used, it is possible to predict between 43% and 59% of soil hydromorphy. For example, the downslope index predicts between 0% and 42% of hydric soils, while the climato-topographic index offers a prediction of 56% with a threshold of 5.29. These results show that topographical variables can predict the distribution of wetlands, but only incompletely. Our research aims to reduce this uncertainty by merging these different indices, in order to capitalise on the specific advantages of each. The study also highlights the importance of the Strahler order for predicting wetlands. Although this method works well for continental wetlands, it may have limitations in the case of coastal wetlands. In these environments, the topography of the terrain, such as coastal alluvial plains where water tends to diffuse and accumulate, may not be correctly captured by Strahler’s order (Infascelli et al. (2013). Also in 2013, Lang et al. proposed a method to improve forest wetland mapping using topographic metrics. This method uses LiDAR data to generate a digital terrain model (DTM). Although the article focuses on a finer scale, it uses similar approaches to those mentioned above. In this study, the researchers suggest using the Topographic Wetness Index (TWI) and propose an improvement to it. Their method is based on adding several conditions to the TWI, followed by thresholding, to produce a composite score for mapping forest wetlands. This research is particularly interesting, as it demonstrates that the TWI alone is robust for mapping wetlands when it is correctly thresholded. The researchers also show that combining this index with other metrics, such as the Enhanced Topographic Wetness Index (ETWI), Local Terrain Normalized Relief (LTNR) and the Relief Enhanced TWI, significantly improves prediction accuracy. These results highlight the power of integrating several indices for more reliable wetland mapping (Lang et al. (2013).
As pointed out by (Mahdianpari et al. (2020), the main limitation of remote sensing studies for wetland detection is their tendency to focus on identifying areas of surface water and equating them directly with wetlands.: their tendency to focus on identifying areas of surface water and equating them directly with wetlands. Our study demonstrates that this approach oversimplifies the complexity of wetland ecosystems because a wetland does not necessarily require visible surface water. In our study area, water may be present only in the soil or in the underlying water table, which are undetectable on standard satellite images. By integrating multiple topographic indices, our approach detects hydrologically active wetlands, even in the absence of visible surface water. Our method leverages elevation data to simulate water flow and accumulation. This enables the identification of hydrological processes through gravity-driven dynamics, without the need for direct imagery. This is particularly advantageous in forested areas, where canopy cover can obscure ground-level hydrological activity. However, these results remain pre-localizations and theoretical predictions, highlighting the need for complementary methods. As such, this approach is highly synergistic with subsequent optical or radar satellite imagery.
The literature shows that many authors have taken an interest in the contribution of topographical indices to improving or carrying out wetland mapping or prediction, and many studies have used TWI (Berhanu and Bisrat (2018); Bian et al. (2021); Grabs et al. (2009); Anaya-Acevedo et al. (2017). These studies are often based on a single index and propose a methodology for extending and improving it, but rarely a methodology combining several topographical indices to determine wetlands (Rodhe and Seibert (1999); Bian et al. (2021); Murphy et al. (2007); Meles et al. (2019); McKergow et al. (2007). In addition, very few articles focus on these topographic indices for predicting coastal wetlands (Sun et al. (2020). The multidimensional approach of this study offers several strengths. Firstly, it provides a more nuanced understanding of soil moisture dynamics by examining how topography influences water accumulation and drainage, while land cover—such as impervious surfaces in urban affects runoff, infiltration, and the drying of wetlands. By integrating these factors, our approach captures the spatial variability of soil moisture more accurately, highlighting how human-altered landscapes and natural features jointly regulate hydrological processes. This is crucial because wetlands do not all share the same characteristics: some are formed by surface runoff, others by topographic depressions, while others act as buffer zones between watercourses and floodplains. Using a single variable would fail to capture this complexity, potentially overlooking key areas where wetlands exist due to different hydrological or geomorphological processes. Moreover, the normalization of indices facilitates direct comparison and integration of multiple data sources, thereby enhancing the robustness of the results. This approach improves the accuracy and reliability of moisture susceptibility assessments, making it a valuable methodology for wetland monitoring and management.
Additionally, the use of IGN’s BD Alti® 25 m provides notable advantages for wetland detection through the integration of topographic indices and elevation data. Its spatial resolution of 25 m offers a balance between data granularity and computational efficiency, making it suitable for regional-scale analyses.
This resolution allows the identification of broad wetland areas and captures topographic gradients that are critical for delineating wetland boundaries. However, its limitations become apparent when dealing with smaller or fragmented wetlands, which may be underrepresented or entirely omitted due to the coarser spatial resolution. Additionally, subtle elevation changes, which are often crucial for distinguishing transitional wetland zones, may not be fully captured. This can lead to inaccuracies in detecting low-relief wetlands or areas with gradual topographic transitions. While BD Alti® 25 m is sufficient for large-scale mapping, higher-resolution data may be required for detailed local studies or for detecting wetlands in highly heterogeneous landscapes. Balancing resolution and computational demands remain a critical consideration for optimizing the use of elevation datasets in wetland detection efforts. This methodology also has certain limitations. For instance, while a resolution of 25 m is sufficient for regional analysis, it may not capture microhabitats in more heterogeneous landscapes. Furthermore, incorporating additional data, such as detailed vegetation or land use information, could enhance the accuracy of the results; however, this would require high-quality data sources.
This methodology is also complementary with the integration of optical and radar remote sensing data as well as artificial intelligence. Indeed, the model serves as a form of pre-localization for wetland zones, offering a mask that can be a decision-support tool for AI algorithms to reduce confusion between wetland and non-wetland land cover classes Le Guillou et al. (2024); Le Guillou et al. (2023). By combining this pre-localization with optical/radar imagery, it is possible to add significant value to spectral information (reflectance), thereby enhancing the discrimination/detection of wetlands.
Furthermore, the methodology’s integration of freely available datasets such as CLC and OCS GE, along with high-resolution altimetric data, enhances its scalability and flexibility. By incorporating both spatial and temporal dimensions, the study is able to account for changes in impervious surfaces over time, adding a layer of environmental context that is often overlooked in traditional wetland mapping techniques. This temporal aspect is particularly crucial for understanding the impacts of urbanization, agricultural practices, and climate change on wetland ecosystems. The approach thus provides a valuable tool for monitoring and managing coastal wetlands, which are highly sensitive to anthropogenic pressures, such as soil sealing and coastal erosion.
5.2 Points of improvement
An improvement may be in the weighting of the variables used in the classification of wetland areas. Currently, each topographic index is given equal consideration, which may limit the accuracy of the resulting map. However, certain indices can be more indicative of soil moisture presence, depending on local conditions and the type of ecosystem being analyzed. For example, the TWI, which is highly correlated with water accumulation, could be assigned a higher weight compared to positional indices such as the TPI in areas where water accumulation is crucial for characterizing wetlands. Implementing weighting techniques such as multiple linear regression or multi-criteria analysis, could provide greater flexibility in adjusting the weight of each index according to its relative influence on wetland localization.
6 Conclusion
Coastal wetlands are complex systems resulting from the interaction between hydrological, geomorphological and biological processes. They are generally highly coveted for both their ecological and economic value. Coastal wetlands are suitable objects of study for addressing the transformations of Atlantic coastal areas through the prism of the relationship between nature and societies in a context of global change. In this study, we present an original methodological sequence that mobilizes a complete series of widely available spatial data at different temporal scales and open source software, structured in three interconnected parts, with the ultimate goal of improving the detection and pre-localization of coastal wetlands in Brittany. The first methodological approach, based on the calculation and standardization of several topographic indices, including the topographic wetness index (TWI), the topographic position index (TPI) and the multiresolution valley bottom flatness index (MRVBF), by combining them with detailed information on elevation and topographic structure, aims to evaluate the soil moisture gradient of coastal wetlands (with a resolution of 25 m), which can contribute to a better understanding of hydrological dynamics, water level variations and water flow zones during the process of mapping and monitoring changes in these environments. In the second methodological part, the CLC and OCS GE data are used to analyze changes in impermeability between 1990 and 2020. This made it possible to detect potential wetlands, identify impermeable areas and analyze their temporal evolution over the period considered. The method enabled a reliable assessment of the surface area of potentially impervious wetlands, which increased by 18.3%, from 145.3 km2 to 171.95 km2 between 1990 and 2020, and the influence of the urbanized and impervious area on the dynamics of coastal wetlands between 1990 and 2020. The third methodological approach is in fact structured in the form of a methodical evaluation of the quality of the “binary classification” of wetlands and non-wetland areas by implementing an inventory of wetlands (carried out by stakeholders between 2011 and 2019) is used as baseline data to verify whether the proposed methodology is effective and, if so, to determine the score at which it gives satisfactory results. Through its cartographic, statistical and spatial results and through these proposals for model optimization, this methodology proves to be particularly reliable and robust for the detection and pre-localization of coastal wetlands in Brittany, particularly in regions where traditional methods may prove insufficient to apprehend the complexity of the boundaries of these wetlands. Furthermore, the robustness of this methodology stems from its inherent flexibility and adaptability: the approach can be adapted by incorporating various combinations of topographic variables and by exploiting different sets of altimetric and land use data at varying resolutions. This adaptability/optimization is particularly important to support conservation strategies adapted to the challenges of current global changes.
Data availability statement
The raw data supporting the conclusions of this article will be made available by the authors, without undue reservation.
Author contributions
AL: Conceptualization, Data curation, Formal Analysis, Investigation, Methodology, Resources, Software, Validation, Visualization, Writing – original draft, Writing – review and editing. SN: Funding acquisition, Project administration, Supervision, Validation, Writing – review and editing.
Funding
The author(s) declare that financial support was received for the research and/or publication of this article. This work was part-funded by a project CNES/TOSCA. This work was part-funded by the IUF Senior Chair of the second author of the article.
Conflict of interest
The authors declare that the research was conducted in the absence of any commercial or financial relationships that could be construed as a potential conflict of interest.
Generative AI statement
The author(s) declare that no Generative AI was used in the creation of this manuscript.
Publisher’s note
All claims expressed in this article are solely those of the authors and do not necessarily represent those of their affiliated organizations, or those of the publisher, the editors and the reviewers. Any product that may be evaluated in this article, or claim that may be made by its manufacturer, is not guaranteed or endorsed by the publisher.
Footnotes
1https://www.planif-territoires.logement.gouv.fr/IMG/pdf/2015-au-bzh-territoires-2040_en_bretagne.pdf
2Available free of charge: https://geoservices.ign.fr/bdalti
4More information here: https://saga-gis.sourceforge.io/
5Available here: https://geoservices.ign.fr/ocsge
6freely available here: https://geobretagne.fr/mapfishapp/map/6b3b98dca689205102b3ac827351758b
References
Adam, E., Mutanga, O., and Rugege, D. (2010). Multispectral and hyperspectral remote sensing for identification and mapping of wetland vegetation: a review. Wetl. Ecol. Manag. 18, 281–296. doi:10.1007/s11273-009-9169-z
Allam, M. (1978). Dtm application in topographic mapping. Photogrammetric Eng. Remote Sens. 44, 1513–1520.
Anaya-Acevedo, J. A., Escobar-Martínez, J. F., Massone, H., Booman, G., Quiroz-Londoño, O. M., Cañón-Barriga, C. C., et al. (2017). Identification of wetland areas in the context of agricultural development using remote sensing and gis. Dyna 84, 186–194. doi:10.15446/dyna.v84n201.58600
Baker, M. E., and Wiley, M. J. (2009). Multiscale control of flooding and riparian-forest composition in lower Michigan, USA. Ecology 90, 145–159. doi:10.1890/07-1242.1
Baker, W. L. (1989). Macro-and micro–scale influences on riparian vegetation in western Colorado. Ann. Assoc. Am. Geogr. 79, 65–78. doi:10.1111/j.1467-8306.1989.tb00250.x
Ballevre, M., Bosse, V., Dabard, M.-P., Ducassou, C., Fourcade, S., Paquette, J.-L., et al. (2013). Histoire géologique du massif armoricain: actualité de la recherche. Bull. de Société géologique minéralogique de Bretagne 500, 5–96.
Ballut-Dajud, G. A., Sandoval Herazo, L. C., Fernández-Lambert, G., Marín-Muñiz, J. L., López Méndez, M. C., and Betanzo-Torres, E. A. (2022). Factors affecting wetland loss: a review. Land 11, 434. doi:10.3390/land11030434
Barbier, E. B. (2013). Valuing ecosystem services for coastal wetland protection and restoration: progress and challenges. Resources 2, 213–230. doi:10.3390/resources2030213
Berhanu, B., and Bisrat, E. (2018). Identification of surface water storing sites using topographic wetness index (twi) and normalized difference vegetation index (ndvi). JNRD-Journal Nat. Resour. Dev. 8, 91–100. doi:10.5027/jnrd.v8i0.09
Beven, K. J., and Kirkby, M. J. (1979). A physically based, variable contributing area model of basin hydrology/Un modèle à base physique de zone d'appel variable de l'hydrologie du bassin versant. Hydrological Sci. J. 24, 43–69. doi:10.1080/02626667909491834
Bian, L., Melesse, A. M., Leon, A. S., Verma, V., and Yin, Z. (2021). A deterministic topographic wetland index based on lidar-derived dem for delineating open-water wetlands. Water 13, 2487. doi:10.3390/w13182487
Bioret, F., and Kerberiou, C. (1994). Catalogue des espèces et des habitats de la directive habitats présents en bretagne. Directive 92, 43.
Bullock, A., and Acreman, M. (2003). The role of wetlands in the hydrological cycle. Hydrology Earth Syst. Sci. 7, 358–389. doi:10.5194/hess-7-358-2003
Chen, G., Chen, X., and Cao, C. (2022). Divergence and dispersion of global eddy propagation from satellite altimetry. J. Phys. Oceanogr. 52, 705–722. doi:10.1175/jpo-d-21-0122.1
Cohen, J. (1960). A coefficient of agreement for nominal scales. Educ. Psychol. Meas. 20, 37–46. doi:10.1177/001316446002000104
[Dataset] (EEA) (2021). “Corine land cover (clc),” in Database. A European land use and land cover database providing standardized data.
IGN (2021). Bd alti®: Base de données altimétriques multi-échelles de la france. Base données Géogr. Base altimétrique référence Fr. Dispon. sous licence spécifique.
Ramsar (1971). Convention on wetlands of international importance especially as waterfowl habitat. united nations treaty series no. 14583. Available online at: http://www.ramsar.org/cda/ramsar/display/main/main.jsp?zn=ramsar&cp=1-31-38}^{2}0671_4000_0__.
Davidson, N. C. (2014). How much wetland has the world lost? long-term and recent trends in global wetland area. Mar. Freshw. Res. 65, 934–941. doi:10.1071/mf14173
DeLancey, E. R., Simms, J. F., Mahdianpari, M., Brisco, B., Mahoney, C., and Kariyeva, J. (2019). Comparing deep learning and shallow learning for large-scale wetland classification in alberta, Canada. Remote Sens. 12 (2), 2. doi:10.3390/rs12010002
Engelhardt, B. M., Weisberg, P. J., and Chambers, J. C. (2012). Influences of watershed geomorphology on extent and composition of riparian vegetation. J. Veg. Sci. 23, 127–139. doi:10.1111/j.1654-1103.2011.01328.x
Gallant, J. C., and Dowling, T. I. (2003). A multiresolution index of valley bottom flatness for mapping depositional areas. Water Resour. Res. 39. doi:10.1029/2002wr001426
Grabs, T., Seibert, J., Bishop, K., and Laudon, H. (2009). Modeling spatial patterns of saturated areas: a comparison of the topographic wetness index and a dynamic distributed model. J. Hydrology 373, 15–23. doi:10.1016/j.jhydrol.2009.03.031
Guisan, A., Weiss, S. B., and Weiss, A. D. (1999). Glm versus cca spatial modeling of plant species distribution. Plant Ecol. 143, 107–122. doi:10.1023/a:1009841519580
Hainry, D., and Colombet, M. (2009). Bilan des introductions et perspectives d’utilisation du cèdre de l’atlas (cedrus atlantica) en bretagne. Centre Régional de la Propriété Forestière de Bretagne, 10p.
Higginbottom, T. P., Field, C. D., Rosenburgh, A., Wright, A., Symeonakis, E., and Caporn, S. J. (2018). High-resolution wetness index mapping: a useful tool for regional scale wetland management. Ecol. Inf. 48, 89–96. doi:10.1016/j.ecoinf.2018.08.003
Infascelli, R., Faugno, S., Pindozzi, S., Boccia, L., and Merot, P. (2013). Testing different topographic indexes to predict wetlands distribution. Procedia Environ. Sci. 19, 733–746. doi:10.1016/j.proenv.2013.06.082
Lang, M., McCarty, G., Oesterling, R., and Yeo, I.-Y. (2013). Topographic metrics for improved mapping of forested wetlands. Wetlands 33, 141–155. doi:10.1007/s13157-012-0359-8
Le Guillou, A., Niculescu, S., and Christiane, S. (2024). “Optical synergy (sentinel-2/spot6-7) for annual detection and mapping of coastal wetlands in the crozon peninsula using machine and deep learning methods,” in Igarss 2024 - 2024 IEEE international geoscience and remote sensing symposium, 4788–4792. doi:10.1109/IGARSS53475.2024.10642584
Le Guillou, A., Niculescu, S., and Schmullius, C. (2023). “Machine and deep learning methods for detection and mapping of coastal wetlands of crozon peninsula (brittany, France) used metric and sub-metric spatial resolution,” in Earth resources and environmental remote sensing/GIS applications XIV (SPIE), 12734, 55–74.
Le Lannou, M. (1950). Géographie de la Bretagne (1): Les conditions géographiques générales (FeniXX)
Mahdavi, S., Salehi, B., Granger, J., Amani, M., Brisco, B., and Huang, W. (2018). Remote sensing for wetland classification: a comprehensive review. GIScience and remote Sens. 55, 623–658. doi:10.1080/15481603.2017.1419602
Mahdianpari, M., Granger, J. E., Mohammadimanesh, F., Salehi, B., Brisco, B., Homayouni, S., et al. (2020). Meta-analysis of wetland classification using remote sensing: a systematic review of a 40-year trend in north America. Remote Sens. 12, 1882. doi:10.3390/rs12111882
McKergow, L., Gallant, J., and Dowling, T. (2007). “Modelling wetland extent using terrain indices, lake taupo, nz,” in Proceedings of MODSIM 2007 international Congress on Modelling and simulation, Modelling and simulation Society of Australia and New Zealand (citeseer), 74–80.
Meles, M. B., Younger, S. E., Jackson, C. R., Du, E., and Drover, D. (2019). Wetness index based on landscape position and topography (wilt): modifying twi to reflect landscape position. J. Environ. Manag. 255, 109863. doi:10.1016/j.jenvman.2019.109863
Montgomery, J., Brisco, B., Chasmer, L., Devito, K., Cobbaert, D., and Hopkinson, C. (2019). Sar and lidar temporal data fusion approaches to boreal wetland ecosystem monitoring. Remote Sens. 11, 161. doi:10.3390/rs11020161
Murphy, P. N., Ogilvie, J., Connor, K., and Arp, P. A. (2007). Mapping wetlands: a comparison of two different approaches for new brunswick, Canada. Wetlands 27, 846–854. doi:10.1672/0277-5212(2007)27[846:mwacot]2.0.co;2
Nahlik, A. M., and Fennessy, M. S. (2016). Carbon storage in us wetlands. Nat. Commun. 7, 13835–13839. doi:10.1038/ncomms13835
Nayak, A., and Bhushan, B. (2022). “Wetland ecosystems and their relevance to the environment: importance of wetlands,” in Handbook of research on monitoring and evaluating the ecological health of wetlands (IGI Global), 1–16.
Newton, A., Icely, J., Cristina, S., Perillo, G. M., Turner, R. E., Ashan, D., et al. (2020). Anthropogenic, direct pressures on coastal wetlands. Front. Ecol. Evol. 8, 144. doi:10.3389/fevo.2020.00144
Niculescu, S., Boissonnat, J.-B., Lardeux, C., Roberts, D., Hanganu, J., Billey, A., et al. (2020). Synergy of high-resolution radar and optical images satellite for identification and mapping of wetland macrophytes on the danube delta. Remote Sens. 12, 2188. doi:10.3390/rs12142188
Ozesmi, S. L., and Bauer, M. E. (2002). Satellite remote sensing of wetlands. Wetl. Ecol. Manag. 10, 381–402. doi:10.1023/a:1020908432489
Qiu, Z., Pennock, A., Giri, S., Trnka, C., Du, X., and Wang, H. (2017). Assessing soil moisture patterns using a soil topographic index in a humid region. Water Resour. Manag. 31, 2243–2255. doi:10.1007/s11269-017-1640-7
Rapinel, S., Clément, B., Dufour, S., and Hubert-Moy, L. (2018). Fine-scale monitoring of long-term wetland loss using lidar data and historical aerial photographs: the example of the couesnon floodplain, France. Wetlands 38, 423–435. doi:10.1007/s13157-017-0985-2
Rapinel, S., Fabre, E., Dufour, S., Arvor, D., Mony, C., and Hubert-Moy, L. (2019). Mapping potential, existing and efficient wetlands using free remote sensing data. J. Environ. Manag. 247, 829–839. doi:10.1016/j.jenvman.2019.06.098
Rapinel, S., Hubert-Moy, L., Clément, B., Nabucet, J., and Cudennec, C. (2015). Ditch network extraction and hydrogeomorphological characterization using lidar-derived dtm in wetlands. Hydrology Res. 46, 276–290. doi:10.2166/nh.2013.121
Reddy, K. R., DeLaune, R. D., and Inglett, P. W. (2022). Biogeochemistry of wetlands: science and applications. CRC Press.
Richard Allen, T., Wang, Y., and Gore, B. (2013). Coastal wetland mapping combining multi-date sar and lidar. Geocarto Int. 28, 616–631. doi:10.1080/10106049.2013.768297
Riley, S. J., DeGloria, S. D., and Elliot, R. (1999). Index that quantifies topographic heterogeneity. Intermt. J. Sci. 5, 23–27.
Rodhe, A., and Seibert, J. (1999). Wetland occurrence in relation to topography: a test of topographic indices as moisture indicators. Agric. For. meteorology 98, 325–340. doi:10.1016/s0168-1923(99)00104-5
Shaver, A., Carter, D. B., and Shawa, T. W. (2019). Terrain ruggedness and land cover: improved data for most research designs. Confl. Manag. Peace Sci. 36, 191–218. doi:10.1177/0738894216659843
Sievers, M., Brown, C. J., Buelow, C. A., Pearson, R. M., Turschwell, M. P., Adame, M. F., et al. (2021). Global typologies of coastal wetland status to inform conservation and management. Ecol. Indic. 131, 108141. doi:10.1016/j.ecolind.2021.108141
Sparks, R. E. (1995). Need for ecosystem management of large rivers and their floodplains. BioScience 45, 168–182. doi:10.2307/1312556
Sun, S., Zhang, Y., Song, Z., Chen, B., Zhang, Y., Yuan, W., et al. (2020). Mapping coastal wetlands of the bohai rim at a spatial resolution of 10 m using multiple open-access satellite data and terrain indices. Remote Sens. 12, 4114. doi:10.3390/rs12244114
Trebitz, A. S., and Herlihy, A. T. (2023). Wetland water quality patterns and anthropogenic pressure associations across the continental USA. Wetlands 43, 107. doi:10.1007/s13157-023-01754-8
Vinayachandran, P., Seng, D. C., and Schmid, F. A. (2022). “Climate change and coastal systems,” in Blue economy: an ocean science perspective (Springer), 341–377.
Weiss, A. (2001). “Topographic position and landforms analysis,” in Poster presentation, ESRI user conference, 200.
Weller, M. W. (1999). Wetland birds: habitat resources and conservation implications. Cambridge University Press.
Wilson, J. P., and Gallant, J. C. (2000). Terrain analysis: principles and applications. John Wiley and Sons.
Keywords: coastal wetlands, Brittany (France), hydrology, DTM, remote sensing data, topographical indices, TWI index
Citation: Le Guillou A and Niculescu S (2025) Detection and pre-localization of coastal wetlands in Brittany, France using topographical indices from altimetric and remote sensing data. Front. Remote Sens. 6:1566144. doi: 10.3389/frsen.2025.1566144
Received: 24 January 2025; Accepted: 14 April 2025;
Published: 28 April 2025.
Edited by:
Ce Zhang, University of Bristol, United KingdomReviewed by:
Shaohua Lei, Nanjing Hydraulic Research Institute, ChinaConstanza Ricaurte-Villota, José Benito Vives of Andréis Marine and Coastal Research Institute, Colombia
Copyright © 2025 Le Guillou and Niculescu. This is an open-access article distributed under the terms of the Creative Commons Attribution License (CC BY). The use, distribution or reproduction in other forums is permitted, provided the original author(s) and the copyright owner(s) are credited and that the original publication in this journal is cited, in accordance with accepted academic practice. No use, distribution or reproduction is permitted which does not comply with these terms.
*Correspondence: Adrien Le Guillou, YWRyaWVuLmxlZ3VpbGxvdUB1bml2LWJyZXN0LmZy