 Audric Bos
 Céline Lamarche1
- 1Earth and Life Institute, Université Catholique de Louvain, Louvain-la-Neuve, Belgium
- 2Serco for European Space Agency (ESA), Frascati, Italy
Anthropogenic land conversion profoundly impacts the Earth’s surface, with varying effects across regions. In the tropics, industrial plantations particularly affect natural forests. Monitoring land use and land cover change (LULCC) due to agricultural expansion is crucial for achieving sustainable imports into the European Union under the Regulation on Deforestation-free Products (EUDR). Earth observation satellite missions, providing free global imagery with high revisit frequency, are instrumental in monitoring tropical ecosystems and their transformation. However, accurately mapping the correct dates of tree cutting or planting on a global scale remains a challenge. This study addresses this gap by developing a near real-time sensor-agnostic method for monitoring deforestation and plantation rotation. It is developed using 100 m PROBA-V full Collection 2 archive with a 5-day revisit, spanning 2014 to 2020. A novel index enabled distinguishing vegetation from land cleared for plantations. The variability of atmospheric perturbations and both intra- and inter-annual variability of the vegetation spectral signatures were mitigated using spatial standardization. Statistical thresholds identified pixels that deviated from the normal distribution of forest spectral values, capturing LULCC. It results in pan-tropical annual maps series 2015–2020 illustrating the typical dynamics of perennial plantations, from land preparation to mature plantations, including the dates of cutting and planting. Validation using 899 randomly selected samples through confidence-based stratified sampling yielded a global accuracy of 82%
1 Introduction
The rapid expansion of tropical plantations, particularly for commodities such as oil palm, soy, and rubber, is a leading cause of deforestation in the tropics, contributing significantly to greenhouse gas emissions and biodiversity loss (Curtis et al., 2018; Lewis et al., 2019; Pendrill et al., 2022). These land use changes have become central to international climate and biodiversity agendas, as land conversion for export-oriented agriculture continues to threaten carbon-rich and species-diverse ecosystems.
While commodity-driven deforestation is widespread, its dynamics vary across regions. In Southeast Asia, large-scale forest loss has been primarily driven by the expansion of industrial oil palm plantations over recent decades (Austin et al., 2019; Gaveau et al., 2016; 2014; Gibbs et al., 2010). In contrast, expansion in West and Central Africa tends to occur in more fragmented and localized agroforestry systems (Li et al., 2015; Ordway et al., 2017). Both large-scale farming systems and smallholders contribute to this expansion, targeting degraded lands but also encroaching on primary forests (Glinskis and Gutiérrez-Vélez, 2019). Plantation sizes largely vary, from small family plots under 25 ha to industrial estates exceeding 100,000 ha (Meijaard et al., 2018). Efforts to mitigate these impacts include sustainability certifications with mixed success in reducing forest loss (Carlson et al., 2018), and regulatory frameworks such as the Regulation on Deforestation-free Products (EUDR), which seek to restrict deforestation-linked imports into European markets (IPCC, 2019; European Parliament and Council of the European Union, 2023).
High-resolution satellite missions have led to the widespread deployment of advanced annual monitoring and deforestation detection systems. These systems continue to improve in operability, spatio-temporal resolution and accuracy, enabling regular assessments of forest cover change (Vancutsem et al., 2021; Hansen et al., 2013). In parallel, near real-time alert systems enable rapid ground interventions in response to deforestation events (Hansen et al., 2016; Reiche et al., 2021). However, current systems are primarily designed to map annual change in tree cover and often fail to characterize land cover following deforestation, limiting their usefulness for tracking plantation establishment and other land use land cover (LULC) transitions.
Detecting land use and land cover change (LULCC) in near real-time and consistently over successive years, with the goal of regularly updating LULC maps, remains a global challenge. Several LULCC algorithms have been developed to address this issue, including pixel-based continuous change analysis (Zhu et al., 2020; Zhu and Woodcock, 2014), the Breaks for Additive Season and Trend (BFAST) algorithm (Verbesselt et al., 2010), LandTrendr (Kennedy et al., 2010) and the Vegetation Change Tracker (VCT) (Huang et al., 2010). For example, LandTrendr was used in Global Planting Years (GPY) (Du et al., 2022) to assign planting year using the closed-canopy Global Oil Palm (GOP) plantations (Descals et al., 2020) and the Spatial Database of Planted Trees Version 1.0 (SDPT) from Harris et al. (2019) as masks. When using the Normalized Burn Ratio (NBR), LandTrendr achieved a F1 score (harmonic mean of precision and recall) of approximately 80% in identifying planting year, accepting a 3-year deviation from the reference (true) dates. In their study, Danylo et al. (2021) used the Bare Soil Index (BSI) thresholding to estimate the year of oil palm plantations in Southeast Asia, but this method has not been validated yet. Despite these advances, most algorithms operate retrospectively rather than in near real-time, assessing changes after they occur, which limits their ability to support immediate communication and law enforcement.
Plantation masks have limitations. The SDPT is based on vector and raster data aggregation that records the extent of perennial plantations in 2015. Updating this database is time consuming and does not allow for the detection of new plantations. A new release (SDPT version 2.0), extending coverage to 2020, is now available (Richter et al., 2024). However, this update was published after the completion of this study. Descals et al. (2020) provides an accurate map of closed-canopy oil palm plantations, reaching an overall accuracy (OA) of 97%, but their method shows limitations in detecting young plantations (i.e., under 3 years old). With an average rotation cycle of 25 years, young plantations account for 12% of the total oil palm plantation area. By exploiting the complementarity between static masks and near real-time detection to dynamically identify newly established plantations, we aim to fill the gap and move towards an exhaustive cartography of perennial plantations.
To detect plantation establishment with high temporal precision, this study leverages Project for On-Board Autonomy - Vegetation (PROBA-V), a Belgian satellite mission of the European Space Agency (ESA) designed to bridge the gap between the Satellite Pour l’Observation de la Terre - Vegetation (SPOT-VGT) and Sentinel-3 missions, which operated from 2013 to 2020. PROBA-V was equipped with a wide-swath instrument featuring four spectral bands specifically designed for vegetation monitoring: blue, red, near-infrared (NIR), and short-wave infrared (SWIR). Its central camera provides a spatial resolution of 100 m with a 5-day revisit time, essential for tracking dynamic LULCC. Although the side cameras achieve a 1–2 days revisit time with a coarser resolution of 300 m, they are affected by significant bidirectional reflectance effects, making them less suitable for field-scale vegetation monitoring (Wolters et al., 2023). Focusing on the central camera 100 m resolution ensures high quality input data while maintaining a temporal resolution similar to Sentinel-2, making PROBA-V well-suited for the development of global LULCC detection algorithms.
Although PROBA-V is no longer operational, the approach developed here is designed to be transferable to other satellite missions, such as Sentinel-2 (Drusch et al., 2012), Landsat-8 (Roy et al., 2014), or PlanetScope (Marta, 2018), thanks to comparable spatial, spectral, and temporal characteristics. A comparative summary of these sensors is provided in Table 1, highlighting the complementarity between missions. This reinforces the broader applicability of our method beyond PROBA-V, particularly for operational and real-time plantation monitoring systems.
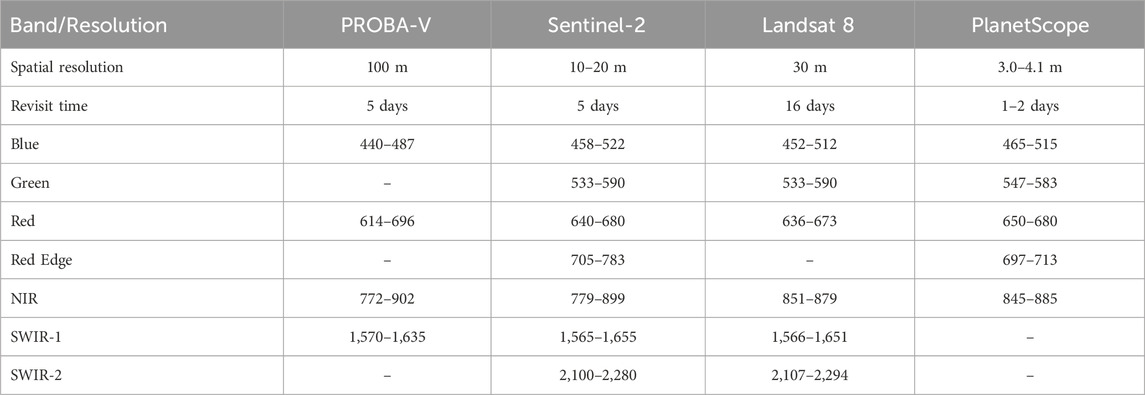
Table 1. Comparison of spectral, spatial, and temporal resolutions across satellites relevant for vegetation monitoring. Spectral bands are listed with their spectral ranges (nm).
The high temporal frequency of PROBA-V observations allows for more precise and timely detection of plantations as they are established, overcoming the limitations of retrospective systems. The methodology presented here is thus designed to be easily adaptable to other active missions, supporting international efforts to monitor land use change and reduce deforestation-related emissions.
The objective of this study is to develop, implement at scale and validate a transferable method for detecting the establishment of new perennial plantations across the pan-tropical region, using 100 m PROBA-V surface reflectance imagery. With its combination of global coverage, 5-day revisit and multi-year archive, PROBA-V provides a suitable proxy for testing methods designed to work with currently active sensors. Specifically, we aim to (1) track plantation expansion at a biweekly temporal resolution from 2015 to 2020, (2) characterize the dynamics and temporal patterns of plantation-driven land use change, and (3) evaluate the feasibility of a near-real-time detection framework that can be operationalized using current satellite missions such as Sentinel-2 and Landsat.
2 Methods
2.1 Study area
The study area covers the pan-tropical zone, well known for its extensive perennial plantations, including oil palm, rubber, pulpwood, coffee, and cocoa. These plantations are predominantly located between 23°S and 23°N, where growth conditions are optimal. In Asia, the main areas are Indonesia and Malaysia, where oil palm and rubber plantations are of primary importance. In Africa, the study encompasses countries such as Nigeria, Ghana, Cameroon, Ivory Coast, and the Democratic Republic of the Congo which are notable for both cocoa and oil palm production. In Central and South America, the focus is on Brazil, Colombia, and Ecuador, where these plantations are also significant (Meijaard et al., 2018).
2.2 EO data preprocessing
The input data is the full archive of Collection 2 (C2) PROBA-V 1-day Synthesis (S1) Top Of Canopy (TOC) surface reflectance at 100 m, acquired from 12 March 2014, to 30 June 2020 (Figure 1). The data processing methodology uses red (0.614
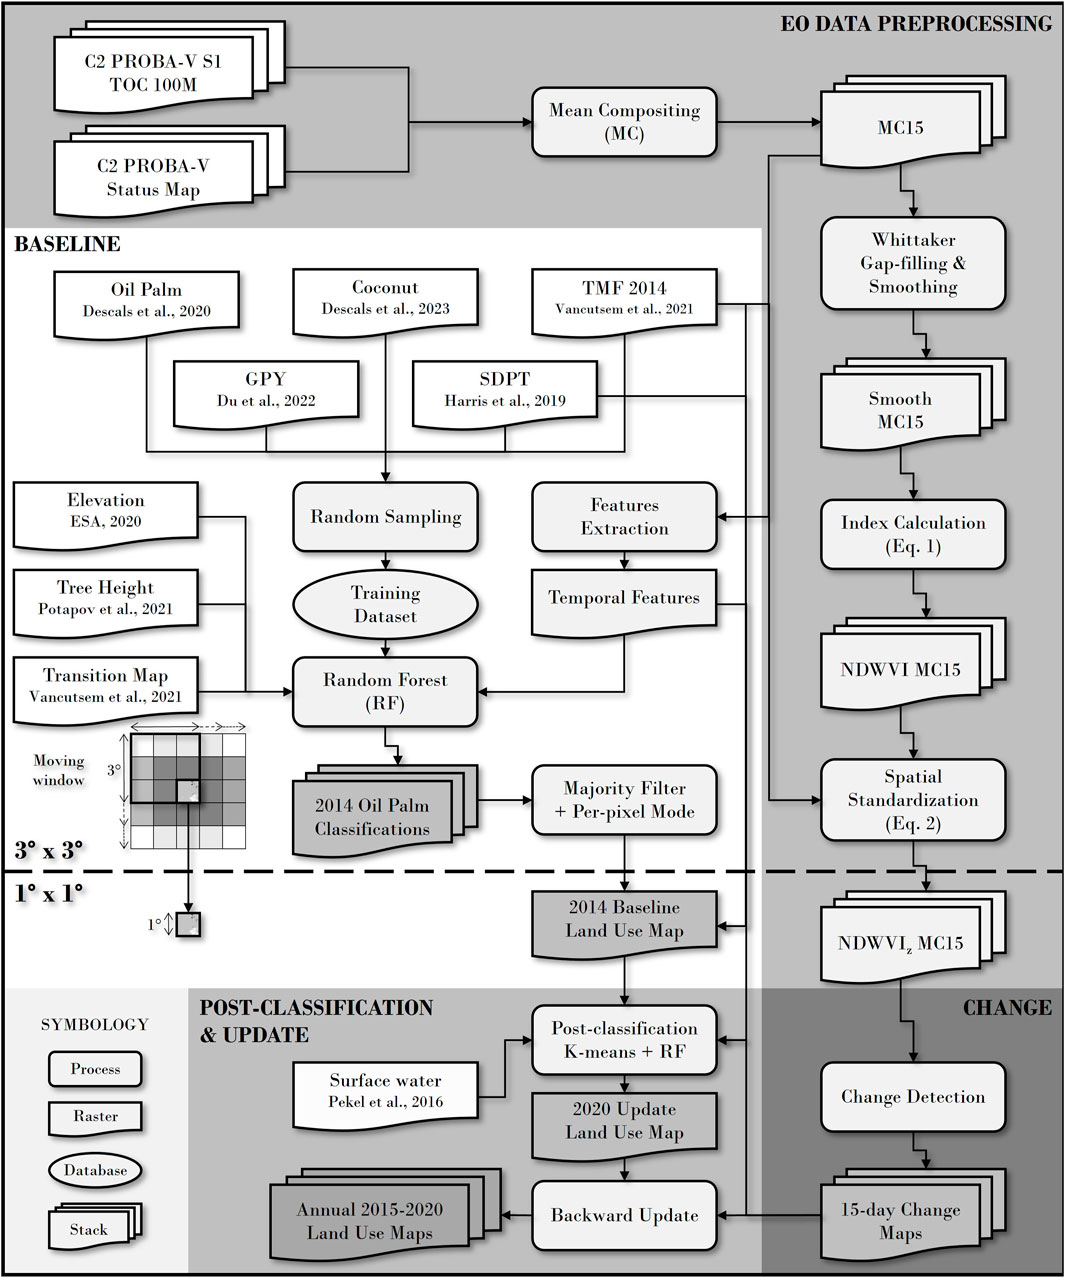
Figure 1. Processing chain for the detection of new plantations at a biweekly time step on a pan-tropical scale. Processing chain is divided into 4 key steps: 1. EO data preprocessing, 2. Baseline, 3. Change algorithm, 4.2020 update and post-classification. Moving 3° × 3° windows allow context to be taken into account for the first 2 steps, and spatially consistent results to be obtained with 1° × 1° windows for steps 3 and 4. TMF: Tropical Moist Forest, GPY: Global Planting Years, SDPT: Spatial Database of Planted Trees Version 1.0. The architecture of the code used to implement this processing chain is developed in Python.
The 6-year PROBA-V time series was composited as 15-day mean synthesis using mean compositing, enhancing spatial consistency (Vancutsem et al., 2007) while recording the number of valid observations per pixel. To increase the consistency of reflectance profiles and remove outlier values, we applied a Whittaker gap-filling and smoothing algorithm (Whittaker, 1927). Each 15-day mean composite (MC15) is smoothed according to the number of valid observations, with a lambda factor
The interpolation method has limited accuracy for extrapolating values at the edges of the time series, resulting in lower data quality for the first and last 6 weeks. Therefore, three MC15s were removed from each end, resulting in 6 full years of PROBA-V MC15 from 1 May 2014, to 30 April 2020. A composite index (Normalized Difference Water & Vegetation Index (NDWVI)) was then introduced as a pragmatic solution, calculated as the difference between the NIR band and the red and SWIR bands and divided by their sum to capture the spectral signature of vegetation clearing (Equation 1). The NIR, sensitive to the leaf biomass, decreases after tree removal. In contrast, red reflectance increases after cutting, as it is reflected by the bare soil. Likewise, the SWIR, sensitive to vegetation moisture content, increases after vegetation removal. This index combines the vegetation sensitivity of Normalized Difference Vegetation Index (NDVI) with the moisture sensitivity of Normalized Difference Moisture Index (NDMI). It is proposed here strictly as an operational tool, tailored to this application, with no intention of introducing a new biophysical metric.
where
The mean NDWVI (
where
Figure 2 illustrates multi-temporal
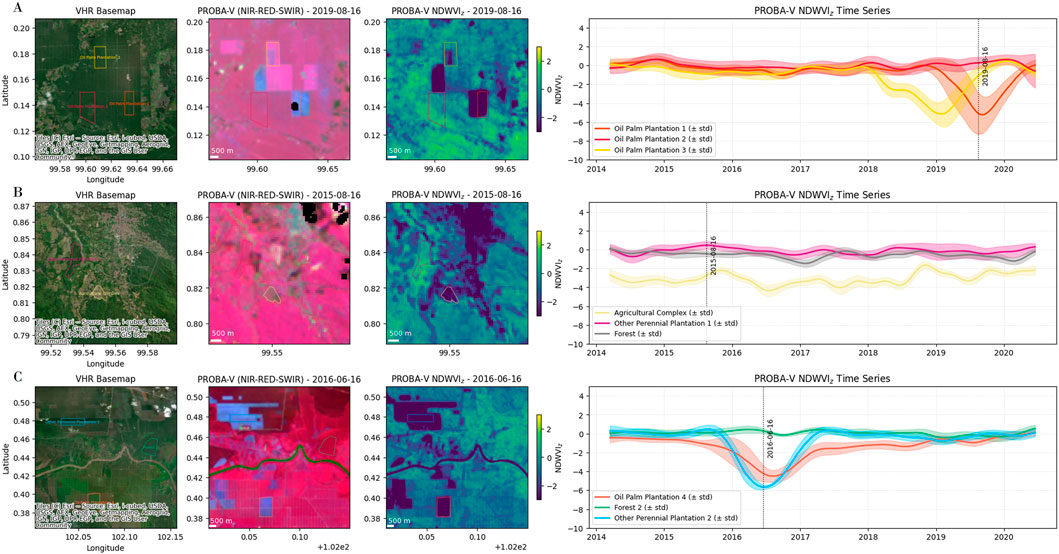
Figure 2. Spatial and temporal vegetation dynamics across three contrasting landscapes. (A) Three oil palm plantations monitored around 2019/08/16, showing different stages of planting and cutting. (B) A landscape including an agricultural complex, a perennial plantation, and a forest patch observed on 2015/08/16. (C) A mix of oil palm and other perennial plantations with adjacent forest, analyzed on 2016/06/16. Each row shows: (1) high-resolution basemap with parcel outlines; (2) PROBA-V composite (NIR-RED-SWIR) at the indicated date; (3) standardized NDWVI
2.3 2014 land use baseline map
The series of annual land use maps begins with the generation of a baseline land use map for 2014. Land use maps include four classes: “Oil Palm Plantations”, defined as large-scale farming systems in pan-tropical regions dedicated to the cultivation of oil palm (Elaeis guineensis) for palm oil production; “Other Perennial Plantations”, defined as large-scale plantations of other perennial crops, including tree crops (e.g., coffee (Coffea arabica), coconuts (Cocos nucifera), cocoa (Theobroma cacao), bananas (Musa spp.)) and planted forests for timber, paper or rubber (Hevea brasiliensis); “Tropical Forest”, which refers to natural, undisturbed or degraded forest ecosystems in tropical areas; and “Other Land Use”, which includes all remaining land categories such as annual cropland, urban areas and non-forest land. This 2014 map combines classification output of oil palm plantations and two ready-to-use datasets: TMF and SDPT. The undisturbed tropical moist forest and degraded tropical moist forest from TMF 2014 were combined to obtain the “Tropical Forest” class. All the SDPT classes, with the exception of the oil palm classes, have been merged into a common ‘Other perennial plantations’ class.
For systematic analysis, the pan-tropical zone is divided into 3° × 3° moving window, each window overlapping neighboring windows by 2° to reduce edge effects and take advantage of the diversity of contexts and training samples. This overlap leads to nine classifications per pixel, with the final class label determined by the mode of these classifications. This window-based approach enables localized training while maintaining consistency between regions.
Oil palm plantations are mapped using the Random Forest (RF) algorithm on the 2014 PROBA-V MC15 time series (Breiman, 2001). Five products allow to select training samples in proportion to the class area. TMF (Vancutsem et al., 2021) provides the tropical forest spectrotemporal signature. SDPT (Harris et al., 2019) and Coconut mask (Descals et al., 2023) are used to extract the signature of perennial plantations, aiding in the identification of non-oil palm plantation areas. The signatures of mature oil palm plantations, young oil palm plantations, and soils ready for planting are computed from GOP (Descals et al., 2020) and GPY dataset (Du et al., 2022). These three intermediate subclasses belong to the land use category “Oil Palm Plantations” but are used separately in the machine learning algorithm. Areas ready for planting are kept in the processing chain. In this way, a new plantation can be detected on these areas. Before sampling the training points, a 2-pixel erosion is performed to limit the non-pure spectrotemporal signature due to the point spread function (Radoux et al., 2016; Duveiller and Defourny, 2010). The features used to train the RF algorithm, include PROBA-V reflectance, but also a terrain elevation model (ESA, 2020), the Tree Height (Potapov et al., 2021) and the TMF Transition Map (Vancutsem et al., 2021). A majority filter on a 3 × 3 pixel window (corresponding to 0.09 km2; at 100 m resolution) is applied on the resulting oil palm plantation class to reduce the salt and pepper effect. Pixels that do not belong to the classes “Oil Palm Plantations”, “Other Perennial Plantations” or “Tropical Forest” are classified as “Other Land Use”.
2.4 Change detection
Detecting changes in
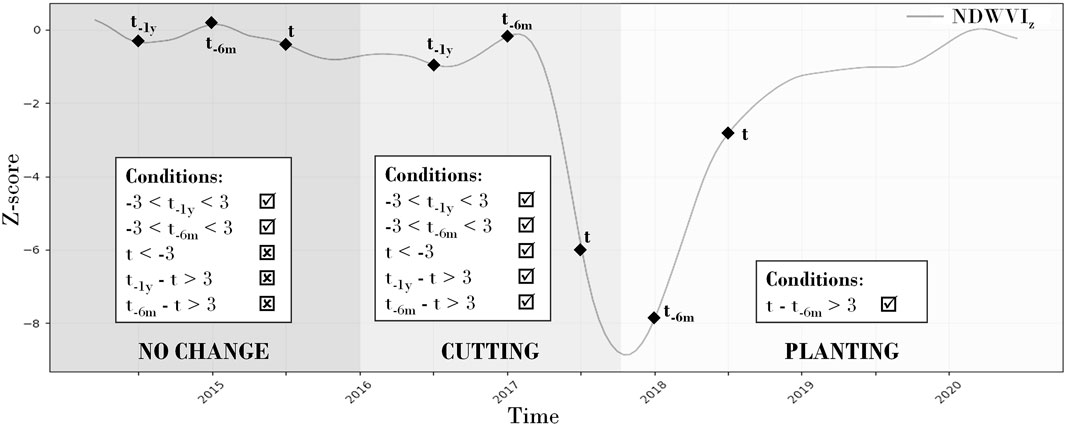
Figure 3. Detected changes using
2.5 Land use map update and post-classification
The detected change time series allows retrospective dating of transitions between land use categories. It is used to update the 2014 land use map by reclassifying pixels with changes from 2015 to 2020. The resulting PROBA-V Land Use @100 m time series covers the years 2015–2020 and illustrates the land use at the beginning and end of the years. With 24 biweekly change dates per year and the assumption that there is only one cutting or one planting event per year (although both can occur within the same year for perennial crops), a total of 120 maps are produced for the period.
A RF algorithm is performed in 1° × 1° window to reclassify changed pixels into “Oil Palm Plantations”, “Other Perennial Plantations”, or as “Tropical Forest” or “Other Land Use” to reduce false detection. Training samples are randomly selected in proportion to the four land use classes and change areas. To generate training samples for potential new plantations that may be novel in the sampling area, the algorithm applies k-means clustering to all available samples, grouping pixels with similar NDWVI values. Clusters with more than 50% of area identified as having undergone recent changes (e.g., tree cutting followed by potential reforestation or new plantation) are labeled as “Other Perennial Plantation”. A 3 × 3 pixel majority filter is then applied to reduce the salt and pepper effect, and surface water product (Pekel et al., 2016) is used to mask changes occurring within water areas.
2.6 Quantitative validation
The validation database is designed to validate the detection of new plantations, as points are sampled in strata where the probability of encountering a new plantation is increased by cross-checking with GPY (Du et al., 2022). Biweekly validation is not possible due to the lack of high-resolution, cloud-free imagery, and is therefore performed annually. The validation process includes a binary validation of the “Oil Palm Plantations” classification of the 2014 baseline and the 2020 updated map, and a validation of newly detected plantations, i.e., a planting event reclassified as “Oil Palm Plantations” or “Other Perennial Plantations” between 2014 and 2020. Both assessments therefore use the same stratified validation database built from mapped change zones.
Following the Committee on Earth Observation Satellites Land Product Validation (CEOS-LPV) guidelines for global land cover validation (Strahler et al., 2006) and the good practices for assessing land change (Olofsson et al., 2014), we relied on a confidence-based stratified random sampling to maximize the probability of sampling commission and omission errors. Confidence-based stratification involves layering multiple products for comparison. Unlike simple and map class-stratified random sampling, confidence-based stratification allows us to target areas where products disagree, allowing us to sample and directly compare points with classification discrepancies (Lamarche et al., 2017).
The stratification relies on four layers where overlaps determine six mutually exclusive strata (Figure 4). Stratum 1 includes validation points in inland areas where no perennial plantations or oil palms are detected, marking regions where the probability of change is minimal. Stratum 2 includes SDPT areas and GOP with no new plantation detected by GPY 2011–2019 and no new plantations detected by PROBA-V 2015–2020, indicating potentially stable land use. Stratum 3 consists of locations where SDPT and GOP overlap with 2011–2019 GPY new plantations, indicating potential recent land use change. PROBA-V 2015–2020 plantation detections cut across these three strata to form six. Stratum 4 corresponds to locations identified solely by PROBA-V detections, reflecting potential new plantations that would not have been captured by previous datasets. Stratum 5 covers areas where SDPT and GOP overlap with PROBA-V detections, highlighting locations where recent rotations of perennial plantations are likely. Stratum 6 covers areas where layers overlap (SDPT and GOP, 2011–2019 GPY detections and 2015–2020 PROBA-V detections), indicating a high likelihood of recent change.
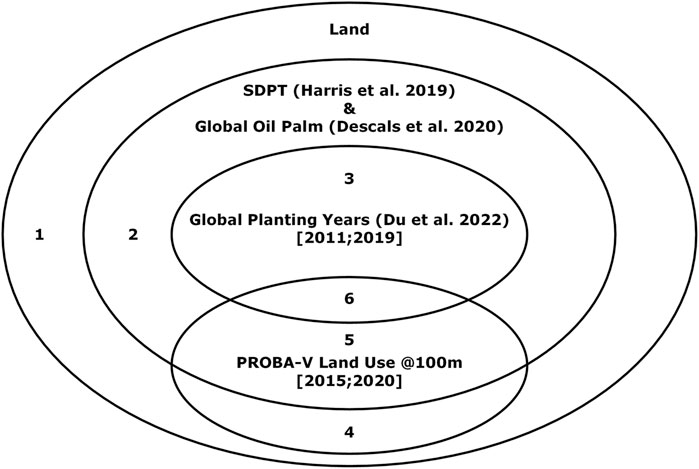
Figure 4. Spatial stratification based on the intersection of four layers: inland areas, SDPT (Harris et al., 2019) and GOP (Descals et al., 2020), GPY (Du et al., 2022) from 2011 to 2019, and PROBA-V Land Use @100 m detections from 2015 to 2020. The stratification results in six strata: 1 - minimum probability of change in inland areas; 2 - stable SDPT and oil palm regions; 3 - locations of recent plantings detected by GPY; 4 - potential plantings detected only by PROBA-V; 5 - potential plantings detected only by PROBA-V in the SDPT and GOP; and 6 - areas with high probability of planting detected by both GPY and PROBA-V.
The validation dataset consists of 1,029 samples equally distributed across strata. Each sample is a 300 m × 300 m footprint composed of 9 100 m PROBA-V pixels. The central pixel (100 m
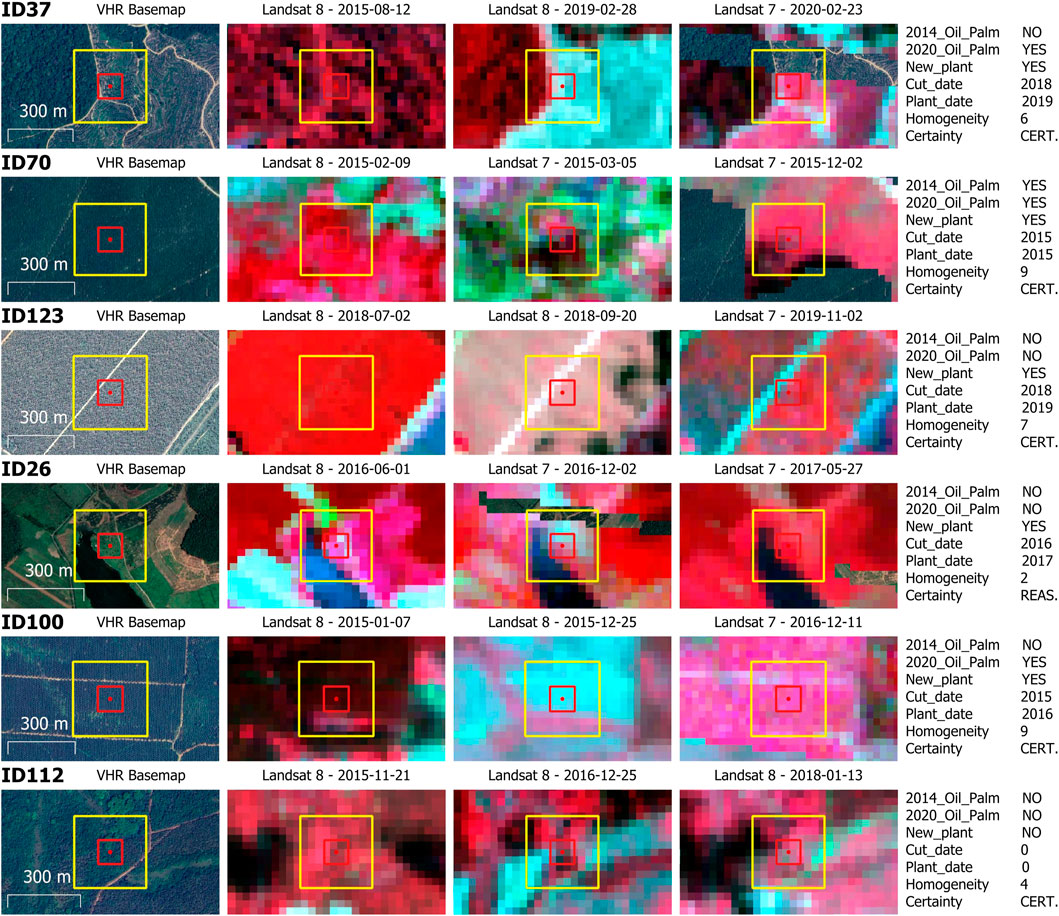
Figure 5. Examples of validation samples used for photo-interpretation. Each row corresponds to a 300 m × 300 m area composed of 9 PROBA-V pixels, delineated by the yellow square. The central red square represents a single 100 m × 100 m PROBA-V pixel, which is the unit used for classification and validation. From left to right: very high resolution (VHR) basemap and three Landsat false-color near-infrared composites illustrating vegetation dynamics. These Landsat images are used to confirm the presence of stable vegetation (first image), to detect a clearing event (second image), and to identify potential replanting (third image). On the right, database attributes detail the oil palm status in 2014 and 2020, the presence of a new plantation, estimated cutting and planting dates, a homogeneity score (1–9), and a confidence level (certain, reasonable, doubtful).
We assessed the presence of oil palm plantations using the F1 score and OA, calculated both per sample and area-weighted for the 2014 baseline map, the 2020 updated map, and the Descals et al. (2020) dataset, resampled to 100 m. Comparisons were made across the major pan-tropical regions: Central America & Amazon, West Africa & Central Africa, and Southeast Asia. To assess the detection of planting events, whether for oil palm or other perennial plantations, we used the F1 score, OA, and planting year accuracy (i.e., the number of accurate date detections out of the total number of correct detections) within the same regions to compare PROBA-V results with those of GPY (Du et al., 2022), resampled to 100 m. We also performed annual comparisons of F1 scores between GPY dataset and PROBA-V, using different tolerances for the exact year of detection.
To evaluate the temporal accuracy of PROBA-V biweekly detection, we performed a targeted validation on a subset of 147 samples drawn from our initial annual reference set. We randomly selected pixels where both a cutting and a planting event were detected by PROBA-V and documented in the reference, ensuring a focused assessment on bi-temporal transitions. This subset spans the study area both spatially and temporally. Reference dates were assigned via manual photo-interpretation of Landsat time series, using the first cloud-free observation showing either a sharp NDVI drop (cutting) or a sustained NDVI increase (planting). Due to the 16-day interval of Landsat and cloud cover, reference dates may lag behind actual cutting. In contrast, planting signatures often emerge gradually, intrinsically introducing temporal uncertainty. These limitations define the expected error margin in comparisons with biweekly detection dates.
3 Results
3.1 The PROBA-V land use @100 m map
The PROBA-V Land Use @100 m map for the pan-tropical zone (from 23°S to 23°N) provides an annual record of land use from 2015 to 2020, capturing LULCC in the region. Each annual map contains four layers: the first two layers show land use types at the beginning and end of the period, covering the categories “Oil Palm Plantations”, “Other Perennial Plantations”, “Tropical Forest”, and “Other Land Use”. Biweekly updates show cutting and planting dates. These maps are available for download at 10.5281/zenodo.14217166.
Figure 6 shows the land use map and the planting year on 30 April 2020, for the three pan-tropical zones. The PROBA-V Land Use @100 m map series is highly consistent in both space and time, with a 15-day detection interval that effectively captures LULCC. This near real-time monitoring of land use change allows detailed analysis of tree cutting and planting dynamics. The 100 m spatial resolution allows for a reliable mapping of land use patterns that reflects changes in different land use types.
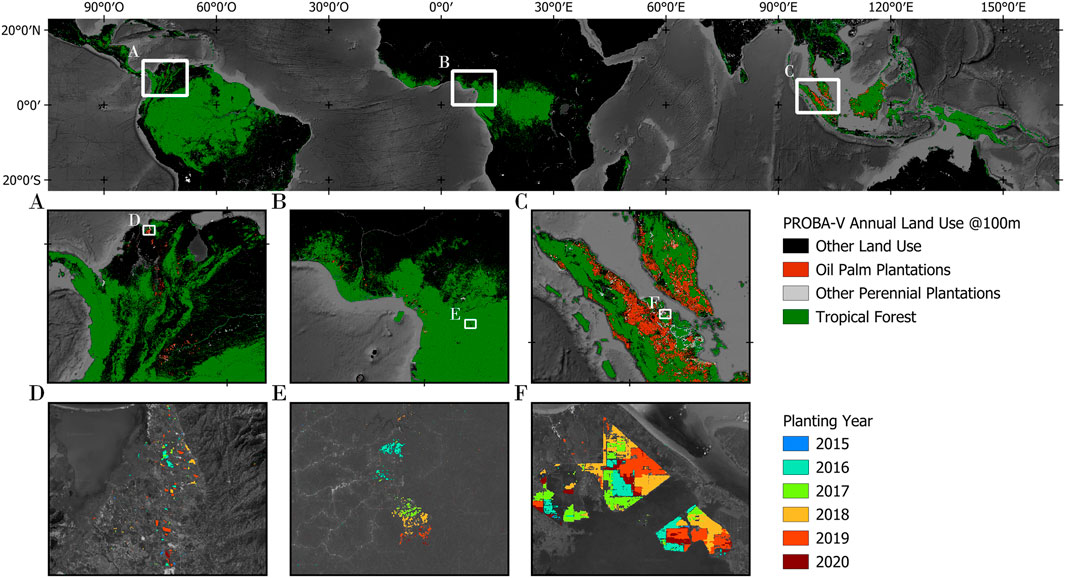
Figure 6. PROBA-V Land Use @100 m and planting years in 30 April 2020. (A) Land use in Central and South America. (B) Land use in West and Central Africa. (C) Land use in South-East Asia. (D) Planting year in Central and South America. (E) Planting year in West and Central Africa. (F) Planting year in South-East Asia. The dimensions of frames (A–C) are approximately 11.1°
3.2 Land use assessment
The 2014 PROBA-V Land Use @100 m map is shown in Figure 7A. The patterns rely heavily on the training data collected from closed-canopy oil palm plantations (Descals et al., 2020), as shown in Figure 7C. The situation in December 2020, shown in Figure 7D, is derived from the change detection map shown in Figure 7B. This shows an ability to identify new plantations and accurately reclassify them as oil palm plantations. Figure 7E provides insight into the rotation dynamics within oil palm plantations on Landsat 8 false-color imagery. Bare ground is shown in blue and newly established plantations are shown in pink due to their increasing leaf biomass. In addition, Figure 7C highlights that the 10 m resolution mapping of GOP (Descals et al., 2020) excels at delineating mature plantations with closed canopies, but is unable to identify bare soils ready for planting and young plantations.
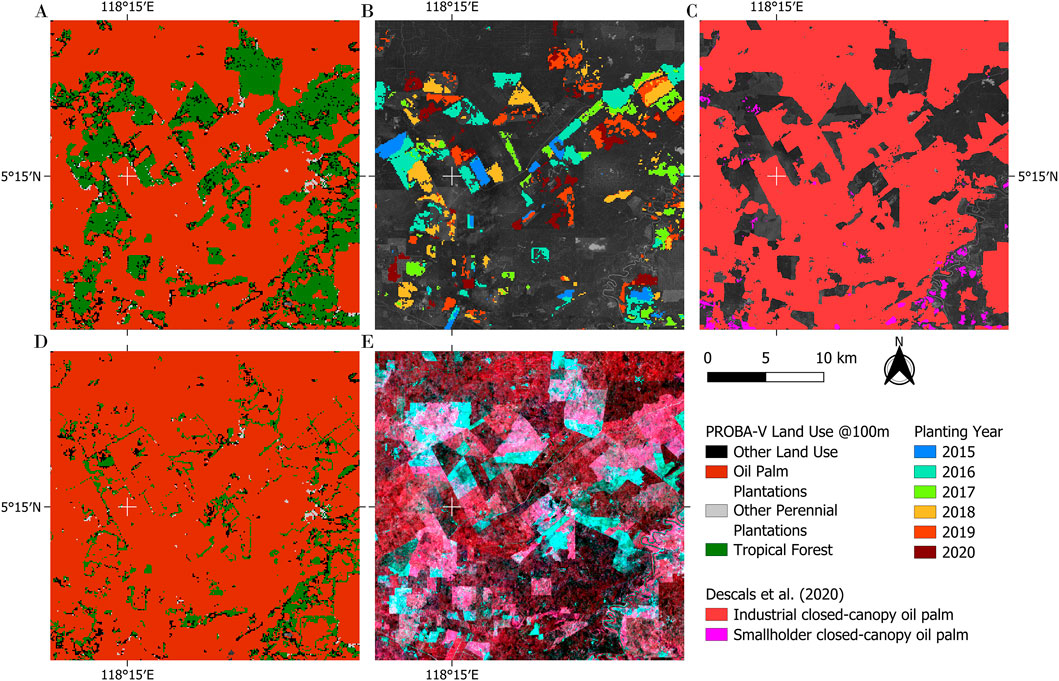
Figure 7. Classification of oil palm plantation area in Borneo, Malaysia. (A) Land use map for the end of the year 2014. (B) Planting year of new perennial plantations from 2015 to 2020. (C) Detection of GOP for the end of 2019 (Descals et al., 2020). (D) Land use map in December, 2019 using change detection derived from the PROBA-V planting year. (E) Landsat 8 false-color infrared mosaic (RGB: B5-B4-B3) from 1 June 2019 to 1 June 2020.
Table 2 shows the performance metrics for the “Oil Palm Plantations” land use class in 2014 and 2020, broken down by tropical region (Central America & Amazon, West & Central Africa, and Southeast Asia) and at the pan-tropical scale. Results are shown for both pixel count and area-weighted metrics, with comparisons to the GOP (Descals et al., 2020), which targets closed-canopy oil palm plantations. At the pan-tropical scale, our pixel count F1 scores are 68% (2014) and 72% (2020), which is slightly lower than the GOP at 78%. OA matches, with 90% (2014) and 87% (2020) for our maps compared to 90% for the GOP. However, regional performance varies. The GOP achieves higher OA and F1 scores in both Central America & Amazon and West & Central Africa, while our method underperforms in these regions with more open plantations. This could be attributed to the lower resolution of PROBA-V, which may not effectively capture the finer details of sparser and smaller plantations. In Southeast Asia, where most oil palm plantations are concentrated, our F1 score outperforms the GOP. OA is slightly lower than other regions but matches the GOP.
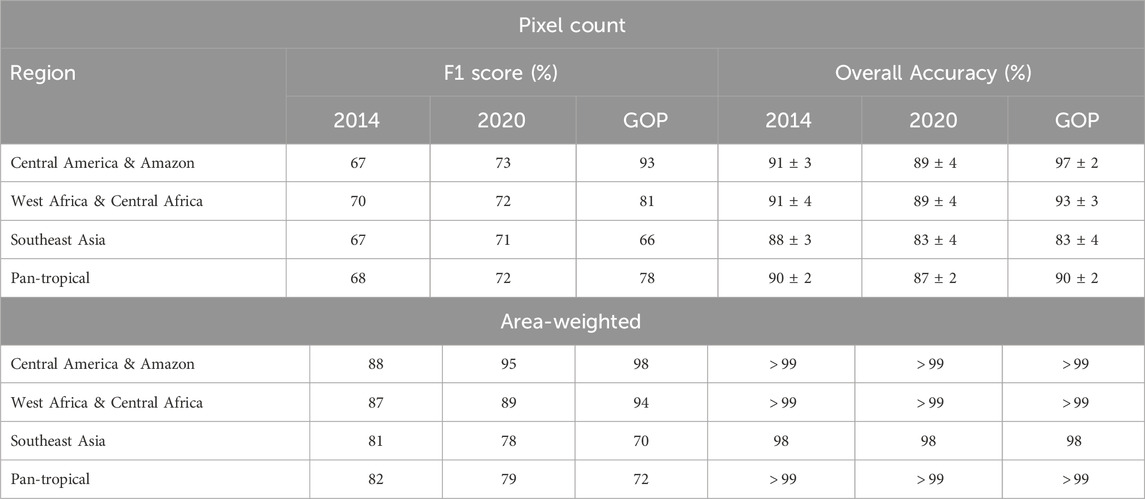
Table 2. F1 score and OA performance metrics for the 2014 PROBA-V Land Use @100 m, 2020 PROBA-V Land Use @100 m, and GOP (Descals et al., 2020), based on per-pixel and area-weighted matrices.
The area-weighted results, which provide a more precise indication of map performance by considering the area-weighted sampling probability, further underscore the complementarity between the two approaches. At the pan-tropical scale, our area-weighted F1 scores of 82% (2014) and 79% (2020) exceed the GOP’s 72%. Area-weighted OA is high across all methodologies, exceeding 99%, reflecting the relatively small extent of oil palm plantations compared to forests. Regionally, our area-weighted F1 scores are 88% (2014) and 95% (2020) in Central America & Amazon, compared to the GOP’s 98%. In West & Central Africa, we achieve 87% (2014) and 89% (2020), compared to 94% for the GOP. In Southeast Asia, our area-weighted F1 scores of 81% (2014) and 78% (2020) outperform the GOP’s 70%, highlighting the strength of our method in capturing both established and new plantations in this region.
3.3 Planting detection assessment
The planting detection algorithm operates on a biweekly basis, allowing precise monitoring of LULCC by assigning exact dates to planting and cutting events. This temporal resolution, combined with high spatial coherence, allows precise visualization of newly planted areas each year and the gradual expansion of plantations over time.
Figure 8 shows the dynamics of different plantations that were detected by the algorithm, both for tree cutting and for planting. Figures 8A,B illustrate the land use change for pineapple (Ananas comosus) plantations in 2017, a perennial crop with 2- to 3-year rotation cycles in the Puntarenas region of Costa Rica. The spatial consistency observed highlights the continuous nature of pineapple planting practices. For West Africa, Figures 8C,D show the dynamics of rubber plantations in Liberia in 2016, capturing successive tree cutting and replanting with 15-day precision. However, some patterns of new plantations are missing, likely due to cutting activities that occurred just prior to the detection period. In contrast, Figures 8E,F show the strong spatial and temporal consistency in Borneo, Indonesia, where both tree cutting and replanting are clearly delineated as plantations expand at the expense of tropical forest.
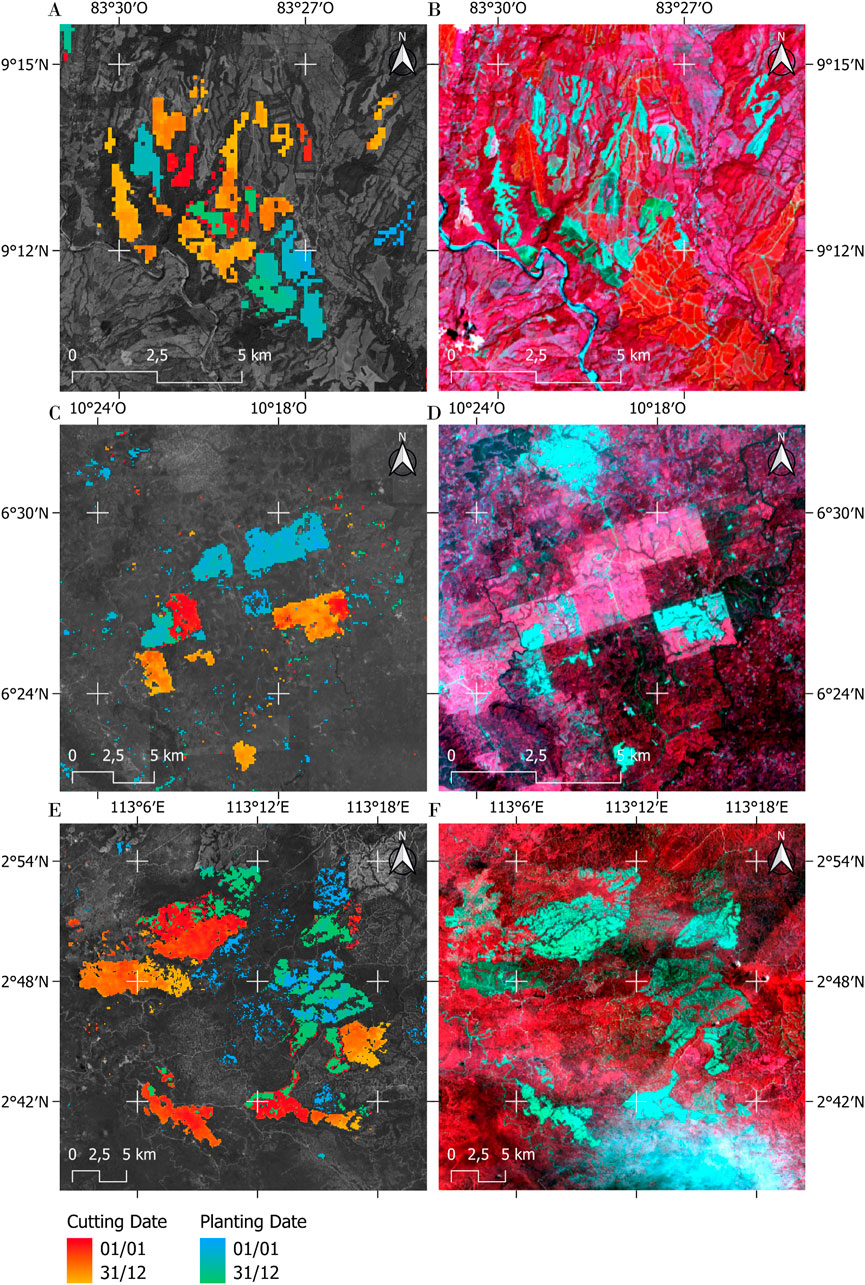
Figure 8. Overview of correct detection of perennial plantation dynamics. (A) Dynamics in perennial pineapple plantations in the region of Puntarenas, Costa Rica. All detection dates of tree cutting and planting at 15 days with PROBA-V for 2017. (B) Landsat 8 false-color infrared image (RGB: B5-B4-B3) on 21/12/2017, Puntarenas region, Costa Rica. (C) Dynamics in a rubber plantation, Liberia. All tree cutting and planting detection dates at 15 days with PROBA-V for 2016. (D) Landsat 8 false-color infrared image (RGB: B5-B4-B3) on 25/12/2016, Liberia. (E) Plantation dynamics, Borneo, Indonesia. All tree cutting and planting detection dates at 15 days with PROBA-V for 2019. (F) Landsat 8 false-color infrared image (RGB: B5-B4-B3) on 21/08/2019, Borneo, Indonesia.
The algorithm also leads to classification errors, with some LULCC being incorrectly reclassified as perennial plantations (Figure 9). Despite the use of a surface water mask (Pekel et al., 2016), some false detections remain at the boundaries of the water zones (Figures 9A,B). In Brazil, the initial detection of deforestation is effective, but leads to false detections of new plantations, since these are actually annual crops that are planted immediately after deforestation. This is illustrated for the year 2018, whose detections are shown in Figures 9C,D, so these are not perennial plantations. Due to persistent cloud cover in Central Africa, the number of cloud-free images is severely limited. The few available images may contain residual clouds, unmasked edges, or cloud shadows that affect the quality of the time series by introducing noise into the reflectance data. In areas with persistent cloud cover, some artifacts may occur, as shown in Figures 9E,F, where cutting and planting patterns appear while the Landsat 7 image shows no change. While the cloud artifacts in question remain marginal, the most significant patterns are of a high quality.
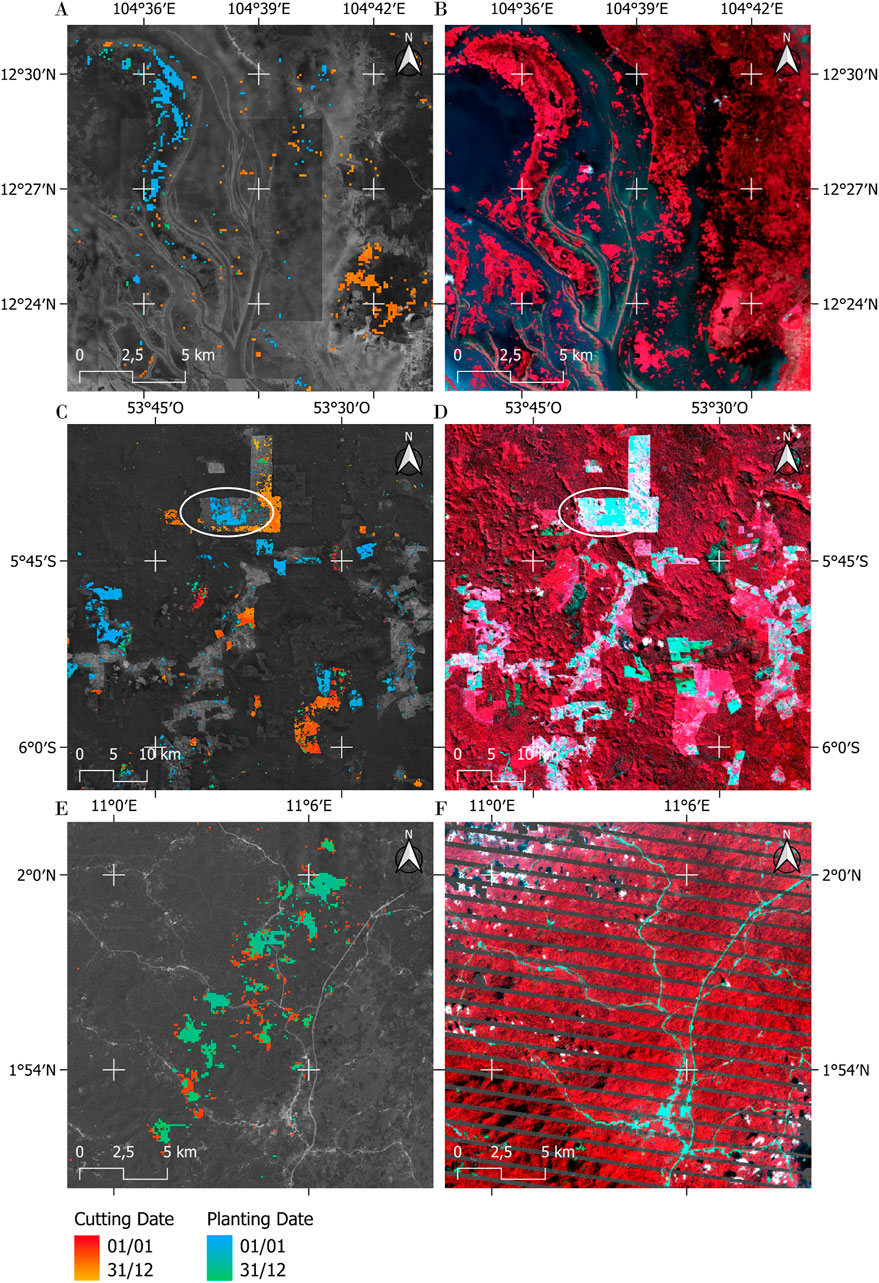
Figure 9. Overview of land use change commission errors. (A) Impact of water table fluctuation on commission errors, Tonlé Sap, Cambodia. (B) Landsat 8 false-color infrared image (RGB: B5-B4-B3) on 06/12/2017. (C) Impact of misclassified post-change class in the southern Amazon rain forest. The white circle indicates area where a perennial plantation was detected, while the following year the ground is bare. All tree cutting and planting dates are 15 days using PROBA-V for 2018. (D) Landsat 8 false-color infrared image (RGB: B5-B4-B3) on 15/06/2019. (E) Impact of an undetected cloud, Kié-Ntem, Equatorial Guinea. All tree cutting and planting dates are 15 days with PROBA-V for 2015. (F) Landsat 7 false-color infrared image (RGB: B5-B4-B3) on 23/01/2016.
A visual qualitative assessment was also performed against GPY (Du et al., 2022). Figure 10 shows very well defined patterns compared to the dataset. The plots of perennial plantations on the island of Sumatra are very well delineated and the annual dynamics are clearly visible.
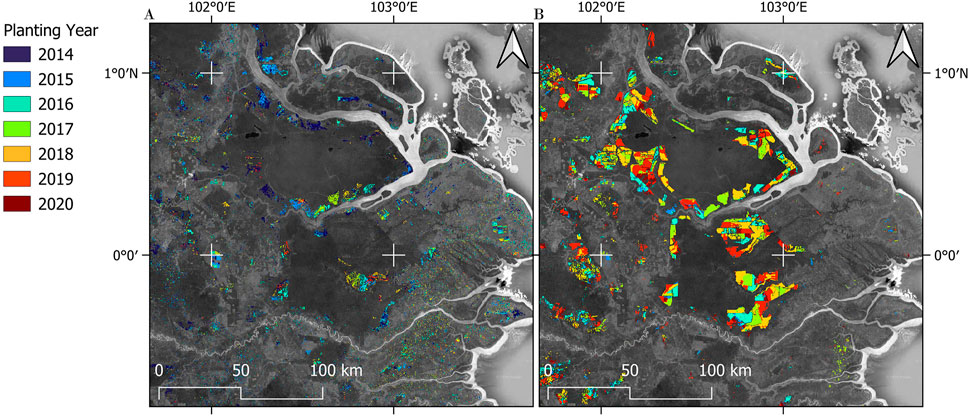
Figure 10. Planting year of industrial plantations in the Riau region, Sumatra, Indonesia. (A) GPY from 2014 to 2020 (Du et al., 2022). (B) 2015–2020 PROBA-V Annual Land Use @100 m planting years.
Given the minority class represented by changes over a single year, only the pixel count matrix is presented (Table 3), as we have seen that the area-weighted figures are meaningless. Overall, we obtained good results for pan-tropical detection of new plantations, with an F1 score of 68%, showing a good balance between errors of commission and errors of omission. The OA improves to 82% when considering all validation samples between 2014 and 2020. In addition, the planting year accuracy (i.e., the number of accurate date detections out of the total number of correct detections) is 62%. In Central America & Amazon, our F1 score is 59%, while GPY achieves its best F1 score of 56% and outperforms us with an OA of 79% compared to our 76%. Our planting year accuracy in this region is 60% compared to 45% for GPY. In West & Central Africa, our F1 scores show strong performance at 75%, with an OA of 90% and a planting year accuracy of 55%. GPY planting year accuracy drops to 26% in this region, highlighting the robustness and usefulness of the PROBA-V biweekly time step. In Southeast Asia, we achieve an F1 score of 71% and an OA of 82%, both higher than GPY, which only reaches a 48% F1 score and OA of 71% in this region. Our planting year accuracy in Southeast Asia is 67% compared to 44% for GPY.
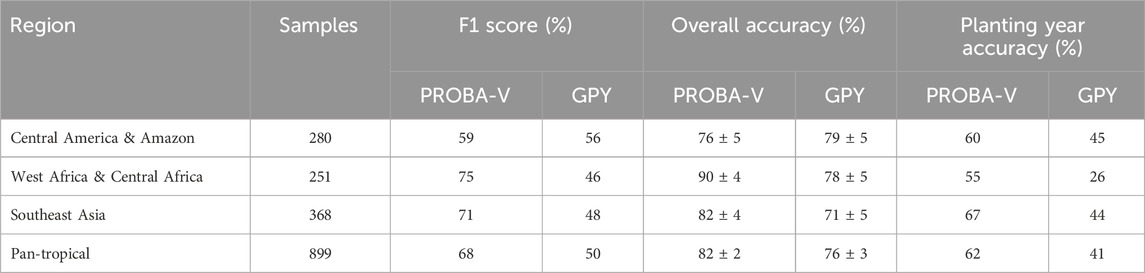
Table 3. Number of samples, F1 score performance metrics, OA and planting year accuracy using PROBA-V and GPY (Du et al., 2022), based on pixel count. All years detections between 2014 and 2020 are counted, regardless of tolerance.
Figure 11 shows the annual F1 score for the years covered in common with GPY, with a variable tolerance over the year. The tolerance over the year is expressed here as the number of years of accepted difference between the exact date of the change and the detected date. Regardless of the year or tolerance accepted for detection, accuracy performance of the PROBA-V Land Use @100 m change detection algorithm is consistently high, reaching 69% for all years combined. The F1 score for detections at the exact year for all years together is 48%, which is a relatively low value. This exceeds the F1 score of 45% achieved by GPY with all tolerances considered for all years together. Furthermore, the algorithm demonstrates remarkable stability over time, with increasing performance in 2019. While the decreasing accuracy of GPY over time in 2019 can be explained by the plantation mask. Because Du et al. (2022) restrict their detections to a plantation mask by going back in time, they are unable to detect recent planting events that are not in the mask. This illustrates the importance of near real-time detection for plantations, and the need to keep products updated.
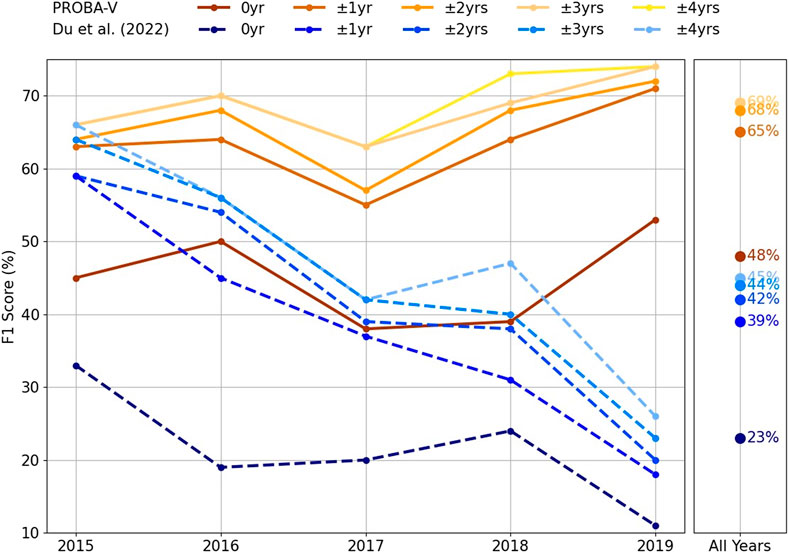
Figure 11. Annual comparison of F1 score for different tolerance on the year of detection between 2015 and 2019 by PROBA-V and GPY Du et al. (2022), to assess the accuracy of the detection year. The box on the right shows the F1 score calculated over all years between 2015 and 2019.
Figure 12 compares PROBA-V biweekly detection dates with reference dates for both cutting (Figures 12A–C) and planting events (Figures 12B–D). In scatterplots A and B, most observations align closely with the 1:1 line, indicating good agreement. For cutting (Figure 12A), the Mean Absolute Error (MAE) is 74 days and the Root Mean Squared Error (RMSE) is 184 days, with outliers primarily corresponding to double-event cases—where PROBA-V detects a valid early event, but the reference only registers a later valid event. When excluding these cases (Figure 12C), the error distribution narrows, and metrics improve markedly (MAE = 56 days, RMSE = 90 days), with a median error of −23 days. This reflects a tendency for PROBA-V to detect cutting slightly earlier than reference dates, as expected given Landsat’s revisit and cloud constraints, which can delay the photo-interpretation of cuttings from Landsat images. The algorithm’s data smoothing process can also result in early detections. For planting (Figure 12B), the temporal accuracy is lower: MAE reaches 141 days and RMSE 273 days. After excluding outliers (Figure 12D), metrics improve to MAE = 112 days and RMSE = 164 days, with a median error of 46 days. This systematic delay is consistent with the gradual increase in the time-series signal associated with vegetation regrowth after planting. In both cases, PROBA-V demonstrates a consistent ability to detect events at biweekly resolution, within the acceptable time limits imposed by reference dating based on Landsat optical time series.
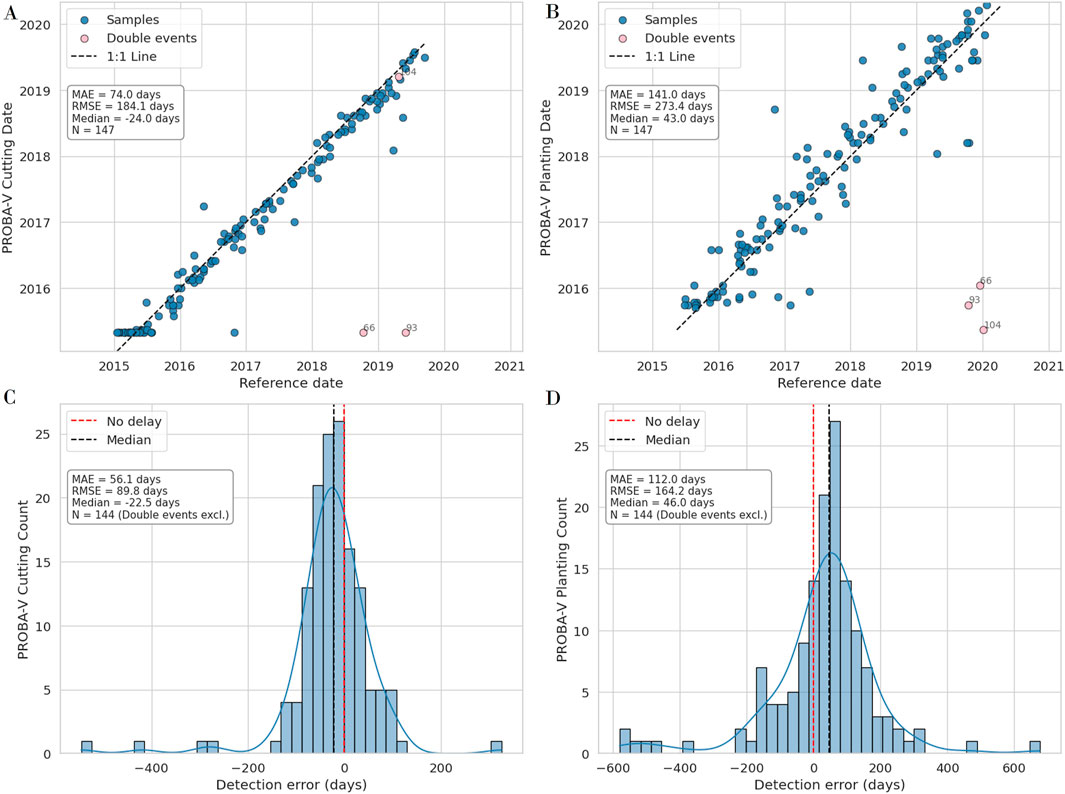
Figure 12. Temporal accuracy of biweekly detection of (A–C) cutting and (B–D) planting events by PROBA-V. (A–B) Scatterplots comparing the reference dates (x-axis) to the detected dates (y-axis) for all validation samples. Blue points represent the main sample set (N = 147), while pink points indicate locations with double events occurring in close temporal succession, such as repeated cutting or planting. The 1:1 dashed black line represents perfect agreement. MAE and RMSE are reported across all samples. (C–D) Histograms of temporal error (in days, PROBA-V date minus reference date) for the same events, limited to samples without double events. The vertical dashed red line marks zero error, and the dashed black line shows the sample median. Reported metrics correspond to the filtered subset of single-event cases. Reference dates were manually assigned by visual interpretation of Landsat time series.
3.4 Plantation expansion versus rotation dynamics
Plantation expansion from forest to plantation and intra-plantation rotation are analyzed by counting the proportion and location of new plantations detected each year. The dynamics are examined for conversion from “Oil Palm Plantations”, “Other Perennial Plantations”, “Tropical Forest” and “Other Land Use” to “Oil Palm Plantations” and “Other Perennial Plantations” (Figure 13). The first block represents the land use areas at the beginning of the year that was converted to perennial plantations during the year, in the second block. The flows between each block represent the converted land use area. Results for the years 2015 (May 1 to December) and 2020 (January to April 30) are incomplete, but when expressed in terms of relative surface areas, they allow conclusions to be drawn. Plantations to alternative land uses are not analyzed.
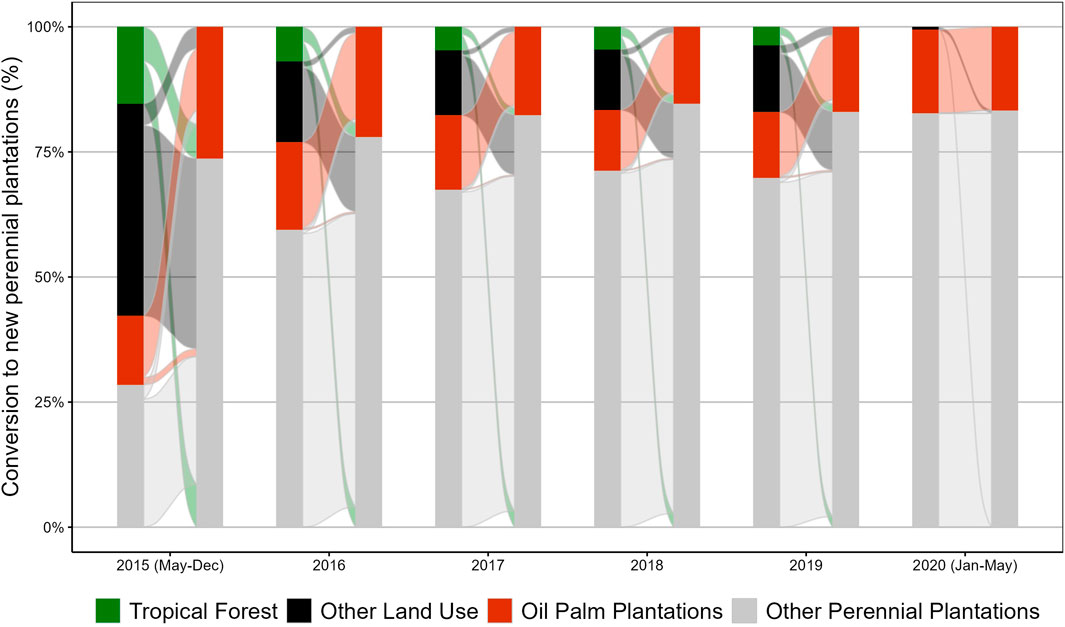
Figure 13. Sources of area allocated to new plantations, in 2015 (May 1 to December), 2016, 2017, 2018, 2019 and 2020 (January to May 1), in %. For each time step, the bar on the left represents land use at the beginning of the period, and the bar on the right, land use at the end of the period. Only conversions to “Oil Palm Plantations” and “Other Perennial Plantations” are counted.
Perennial plantations experienced a significant expansion in the “Tropical Forest” class in 2015, of the order of 15%. A similar trend can be observed for “Other Land Use” in 2015, with up to 42% of new plantations being established in this class. According to this study, this unexpected result can be explained by an update of the 2014 map, which includes the omission of plantations. The year 2020, with only 4 months of observation, has only 1% of expansion, which can be explained by post-classification errors in very young plantations. Years 2016–2019 are more stable in terms of the conversion of the “Tropical Forest” and “Other Land Use” classes. These classes represent approximately 17%–23% of the source of new plantations each year. Transfers from “Other Perennial Plantations” to “Oil Palm Plantations”, and vice versa, are low.
Initial estimates of industrial plantation dynamics, averaged over the years 2016–2019, indicate that new oil palm plantations cover approximately 3,064 km2; annually. Of this, 79% is due to rotations within existing plantations, while 21% represents expansion into new areas. Specifically, 11% of this expansion comes from tropical forests, 7% from other land uses, and 4% from other perennial plantations. Meanwhile, other perennial plantations are planted at a rate of about 13,875 km2; per year, with 81% coming from rotation within existing plantations and 19% from expansion into new areas. The expansion of these plantations includes 15% from other land uses and 4% from tropical forests.
4 Discussion
The PROBA-V surface reflectance preprocessing ensures temporal consistency even in the cloudiest regions and is suitable for monitoring industrial plantations. Cutting and planting patterns are well delineated, with deforestation and planting fronts visible at 15-day intervals. This study demonstrates the importance of near real-time detection, as the algorithm presented here can detect new plantations and subsequently characterize their type. This contrasts with the GPY dataset, which requires a mask of plantations and then applies an annual back-in-time change algorithm. This high temporal resolution enables precise detections of change events near the start or end of the calendar year. In traditional year-based algorithms, land clearing in November followed by replanting in February are often mixed into a single year signal, leading to an underestimation of disturbances or a time lag with actual events. In contrast, biweekly detections retain the temporal granularity needed to distinguish these sequential events.
The first limitation of the product is the 2014 map. These detections are based on training samples drawn from GOP detections (Descals et al., 2020), which miss young plantations, and GPY detections (Du et al., 2022), whose planting year accuracy is low. This means that the product is partially dependent on the quality of these inputs. The 2014 map is also composed of TMF (Vancutsem et al., 2021) and SDPT (Harris et al., 2019), which may have omission or commission errors. After these classification problems in 2014, the intention to classify bare soils ready for planting, which are kept in the processing chain, does not show good results. Too few pixels are classified as bare soil ready for planting and therefore any new plantation is not recorded if it does not follow a correctly identified bare soil. This processing problem explains the absence of detections in 2014 and the low number of detections in 2015. The series of annual land use maps therefore starts in 2015, and the year 2015 should be used with caution as it is incomplete. Similarly, the PROBA-V archive does not cover the full year 2020 (only until 30 April 2020).
Secondly, new plantations are detected using NDWVI, which captures the pattern of a sharp loss of vegetation followed by regrowth associated with deforestation and subsequent replanting. However, similar temporal dynamics can occur in other contexts, such as post-fire recovery or seasonal wetland drying. Despite differences in spectral signatures, these processes may produce comparable temporal profiles at a biweekly resolution. The algorithm may erroneously flag such events as new plantations, leading to commission errors. Additional spectral or contextual constraints would improve the specificity of change detection.
Thirdly, the algorithm can detect changes based on local statistical thresholds in 3° × 3° windows. It is therefore clear that rotations with less intense dynamics and less contrasting NDWVI distributions reduce the performance of the algorithm. Differences in deforestation dynamics and rotation practices, which may be more gradual than clear-cutting, explain most of the omission and commission errors.
Finally, the classes “Tropical Forest” and “Other Perennial Plantations”, although provided with the land use product, have not been rigorously validated and should be used with caution.
5 Conclusion and perspectives
The PROBA-V Land Use @100 m product includes annual land use maps from 2015 to 2020, and cutting and planting dates with a 15-day time step throughout the 6 years, allowing static and dynamic analysis of the LULCC with high temporal and spatial consistency. This study highlights the relevance of the PROBA-V satellite for global mapping. Its 100 m spatial resolution is suitable for monitoring industrial perennial plantations, and its temporal resolution supports biweekly monitoring between 2015 and 2020.
NDWVI distinguishes tropical forest and bare soil allowing to achieve high accuracy metrics using two different successive detections, i.e., a tree cutting and a planting event or a planting on bare soil detected in the baseline, to demonstrate the presence of a new perennial plantation. A local standardization approach proposed on
This sensor-agnostic approach relies on spectral bands common to most land imaging sensors, including MODIS, Landsat, Sentinel-2, and PlanetScope. By focusing on shared spectral features, it enables consistent land cover change detection across platforms with differing spatial, spectral, and temporal resolutions. This allows for its use in both global-scale monitoring and detailed local analyses. The method is also designed for long-term applicability. Its compatibility with a wide range of past, current, and future sensors ensures continued relevance as satellite missions evolve. The proposed algorithm is a scalable and resilient solution for large-scale environmental change monitoring.
The accuracy in detecting pan-tropical industrial plantations demonstrates that near real-time maps based on change detection can effectively compete with annual classifications at a global scale. This suggests a strong complementarity between static maps and dynamic updates. Static maps provide a basis for detecting well-established plantations, especially those with mature, closed canopies. However, they often miss young or newly planted areas. Our update method fills this gap by detecting not only new plantations, but also deforestation events and intra-plantation rotations. In practice, the static map provides a solid baseline, while the change detection system allows for continuous updates and improvements. Together, these approaches create a more robust and adaptable solution for monitoring the expansion and rotation of pan-tropical industrial plantations.
Finally, the planting detection figures show that LULCC assessment on a global scale remains a critical area of development. The classes identified here - tropical forests, bare soils and industrial perennial plantations - are LULC classes that remain fairly distinct. LULC transitions may occur in more specific environments, such as gradual natural regrowth of perennial plantations, plantation abandonment, agroforestry plantation rotations, which could not be detected. The method exploits the intrinsic behavior of expansion or rotation of industrial plantations in pan-tropical regions. It opens up the prospect of testing it in other forest environments.
The PROBA-V C2 archive is a powerful resource for developing sensor-agnostic algorithms, providing high-quality data that is perfect for testing and fine-tuning methods. Its excellent temporal coverage and consistency make it an ideal tool for real-time detection and updating static maps while ensuring spatial and temporal consistency. By complementing existing static plantation maps with dynamic updates, our method is designed to support deforestation monitoring frameworks and inform emerging regulatory initiatives, including the EUDR. PROBA-V not only lays the groundwork for scaling methods to higher-resolution datasets but also opens the door to advanced global monitoring of environmental dynamics with high precision.
Data availability statement
The datasets presented in this study can be found in online repositories. The names of the repository/repositories and accession number(s) can be found below: https://zenodo.org/records/14217166 Bos, A., Lamarche, C., Niro, F., and Defourny, P. (2024). PROBA-V Land Use @100 m (1.0) (Data set). Zenodo. https://doi.org/10.5281/zenodo.14217166.
Author contributions
AB: Conceptualization, Data curation, Formal Analysis, Investigation, Methodology, Software, Validation, Visualization, Writing – original draft, Writing – review and editing. CL: Conceptualization, Formal Analysis, Funding acquisition, Investigation, Methodology, Project administration, Supervision, Writing – review and editing. FN: Funding acquisition, Project administration, Resources, Supervision, Writing – review and editing. PD: Conceptualization, Formal Analysis, Funding acquisition, Investigation, Methodology, Project administration, Supervision, Writing – review and editing.
Funding
The author(s) declare that financial support was received for the research and/or publication of this article. The authors would like to thank the European Space Agency (ESA) for supporting and funding this project (Contract No.: 4000123626/18/I-SBo).
Conflict of interest
The authors declare that the research was conducted in the absence of any commercial or financial relationship that could be interpreted as a potential conflict of interest.
Generative AI statement
The author(s) declare that no Generative AI was used in the creation of this manuscript.
Publisher’s note
All claims expressed in this article are solely those of the authors and do not necessarily represent those of their affiliated organizations, or those of the publisher, the editors and the reviewers. Any product that may be evaluated in this article, or claim that may be made by its manufacturer, is not guaranteed or endorsed by the publisher.
References
Austin, K. G., Schwantes, A., Gu, Y., and Kasibhatla, P. S. (2019). What causes deforestation in indonesia? Environ. Res. Lett. 14, 024007. doi:10.1088/1748-9326/aaf6db
Carlson, K. M., Heilmayr, R., Gibbs, H. K., Noojipady, P., Burns, D. N., Morton, D. C., et al. (2018). Effect of oil palm sustainability certification on deforestation and fire in Indonesia. Proc. Natl. Acad. Sci. 115, 121–126. doi:10.1073/pnas.1704728114
Curtis, P. G., Slay, C. M., Harris, N. L., Tyukavina, A., and Hansen, M. C. (2018). Classifying drivers of global forest loss. Science 361, 1108–1111. doi:10.1126/science.aau3445
Danylo, O., Pirker, J., Lemoine, G., Ceccherini, G., See, L., McCallum, I., et al. (2021). A map of the extent and year of detection of oil palm plantations in Indonesia, Malaysia and Thailand. Sci. data 8, 96–98. doi:10.1038/s41597-021-00867-1
Descals, A., Wich, S., Meijaard, E., Gaveau, D. L., Peedell, S., and Szantoi, Z. (2020). High-resolution global map of smallholder and industrial closed-canopy oil palm plantations. Earth Syst. Sci. Data Discuss. 2020, 1–22. doi:10.5194/essd-13-1211-2021
Descals, A., Wich, S., Szantoi, Z., Struebig, M. J., Dennis, R., Hatton, Z., et al. (2023). High-resolution global map of closed-canopy coconut. Earth Syst. Sci. Data Discuss. 2023, 1–30. doi:10.5194/essd-15-3991-2023
Drusch, M., Del Bello, U., Carlier, S., Colin, O., Fernandez, V., Gascon, F., et al. (2012). Sentinel-2: ESA’s Optical High-Resolution Mission for GMES Operational Services. Remote Sensing of Environment. 120, 25–36. doi:10.1016/j.rse.2011.11.026
Du, Z., Yu, L., Yang, J., Xu, Y., Chen, B., Peng, S., et al. (2022). A global map of planting years of plantations. Sci. data 9, 141. doi:10.1038/s41597-022-01260-2
Duveiller, G., and Defourny, P. (2010). A conceptual framework to define the spatial resolution requirements for agricultural monitoring using remote sensing. Remote Sens. Environ. 114, 2637–2650. doi:10.1016/j.rse.2010.06.001
European Parliament and Council of the European Union (2023). Regulation (EU) 2023/1115 of the European parliament and of the Council of 31 may 2023 (EU) no 995/2010 (text with EEA relevance) EUR-lex official. Journal of the European Union. Available online at: http://data.europa.eu/eli/reg/2023/1115/oj
Gaveau, D., Sheil, D., Msi, H., Salim, M., Arjasakusuma, S., Ancrenaz, M., et al. (2016). Rapid conversions and avoided deforestation: examining four decades of industrial plantation expansion in borneo. Sci. Rep. 6, 32017. doi:10.1038/srep32017
Gaveau, D. L., Sloan, S., Molidena, E., Yaen, H., Sheil, D., Abram, N. K., et al. (2014). Four decades of forest persistence, clearance and logging on borneo. PloS one 9, e101654. doi:10.1371/journal.pone.0101654
Gibbs, H. K., Ruesch, A. S., Achard, F., Clayton, M. K., Holmgren, P., Ramankutty, N., et al. (2010). Tropical forests were the primary sources of new agricultural land in the 1980s and 1990s, Proc. Natl. Acad. Sci. U. S. A., 107, 16732–16737. doi:10.1073/pnas.0910275107
Glinskis, E. A., and Gutiérrez-Vélez, V. H. (2019). Quantifying and understanding land cover changes by large and small oil palm expansion regimes in the peruvian amazon. Land use policy 80, 95–106. doi:10.1016/j.landusepol.2018.09.032
Hansen, M. C., Krylov, A., Tyukavina, A., Potapov, P. V., Turubanova, S., Zutta, B., et al. (2016). Humid tropical forest disturbance alerts using landsat data. Environ. Res. Lett. 11, 034008. doi:10.1088/1748-9326/11/3/034008
Hansen, M. C., Potapov, P. V., Moore, R., Hancher, M., Turubanova, S. A., Tyukavina, A., et al. (2013). High-resolution global maps of 21st-century forest cover change. science 342, 850–853. doi:10.1126/science.1244693
Harris, N., Goldman, E. D., and Gibbes, S. (2019). Spatial database of planted trees (sdpt) version 1.0. Technical Note. World Resources Institute.
Huang, C., Goward, S. N., Masek, J. G., Thomas, N., Zhu, Z., and Vogelmann, J. E. (2010). An automated approach for reconstructing recent forest disturbance history using dense landsat time series stacks. Remote Sens. Environ. 114, 183–198. doi:10.1016/j.rse.2009.08.017
IPCC (2019). Climate change and land: an ipcc special report on climate change, desertification, land degradation, sustainable land management, food security, and greenhouse gas fluxes in terrestrial ecosystems
Kennedy, R. E., Yang, Z., and Cohen, W. B. (2010). Detecting trends in forest disturbance and recovery using yearly landsat time series: 1. landtrendr—temporal segmentation algorithms. Remote Sens. Environ. 114, 2897–2910. doi:10.1016/j.rse.2010.07.008
Lamarche, C., Santoro, M., Bontemps, S., d’Andrimont, R., Radoux, J., Giustarini, L., et al. (2017). Compilation and validation of sar and optical data products for a complete and global map of inland/ocean water tailored to the climate modeling community. Remote Sens. 9, 36. doi:10.3390/rs9010036
Lewis, S. L., Wheeler, C. E., Mitchard, E. T. A., and Koch, A. (2019). Restoring natural forests is the best way to remove atmospheric carbon. Nature 568, 25–28. doi:10.1038/d41586-019-01026-8
Li, L., Dong, J., Tenku, S. N., and Xiao, X. (2015). Mapping oil palm plantations in Cameroon using palsar 50-m orthorectified mosaic images. Remote Sens. 7, 1206–1224. doi:10.3390/rs70201206
Marta, S. (2018). Planet imagery product specifications, 91. San Francisco, CA, USA: Planet Labs, 170.
Meijaard, E., Garcia-Ulloa, J., Sheil, D., Wich, S., Carlson, K., Juffe-Bignoli, D., et al. (2018). Oil palm and biodiversity: a situation analysis by the IUCN Oil Palm Task Force. doi:10.2305/IUCN.CH.2018.11.en
Olofsson, P., Foody, G. M., Herold, M., Stehman, S. V., Woodcock, C. E., and Wulder, M. A. (2014). Good practices for estimating area and assessing accuracy of land change. Remote Sens. Environ. 148, 42–57. doi:10.1016/j.rse.2014.02.015
Ordway, E. M., Naylor, R. L., Nkongho, R. N., and Lambin, E. F. (2017). Oil palm expansion in Cameroon: insights into sustainability opportunities and challenges in africa. Glob. Environ. Change 47, 190–200. doi:10.1016/j.gloenvcha.2017.10.009
Pekel, J.-F., Cottam, A., Gorelick, N., and Belward, A. S. (2016). High-resolution mapping of global surface water and its long-term changes. Nature 540, 418–422. doi:10.1038/nature20584
Pendrill, F., Gardner, T. A., Meyfroidt, P., Persson, U. M., Adams, J., Azevedo, T., et al. (2022). Disentangling the numbers behind agriculture-driven tropical deforestation. Science 377, eabm9267. doi:10.1126/science.abm9267
Potapov, P., Li, X., Hernandez-Serna, A., Tyukavina, A., Hansen, M. C., Kommareddy, A., et al. (2021). Mapping global forest canopy height through integration of gedi and landsat data. Remote Sens. Environ. 253, 112165. doi:10.1016/j.rse.2020.112165
Radoux, J., Chomé, G., Jacques, D. C., Waldner, F., Bellemans, N., Matton, N., et al. (2016). Sentinel-2’s potential for sub-pixel landscape feature detection. Remote Sens. 8, 488. doi:10.3390/rs8060488
Reiche, J., Mullissa, A., Slagter, B., Gou, Y., Tsendbazar, N.-E., Odongo-Braun, C., et al. (2021). Forest disturbance alerts for the Congo basin using sentinel-1. Environ. Res. Lett. 16, 024005. doi:10.1088/1748-9326/abd0a8
Richter, J., Goldman, E., Harris, N., Gibbs, D., Rose, M., Peyer, S., et al. (2024). Spatial Database of Planted Trees (SDPT Version 2.0). World Resources Institute. doi:10.46830/writn.23.00073
Roy, D. P., Wulder, M. A., Loveland, T. R., Woodcock, C. E., Allen, R. G., Anderson, M. C., et al. (2014). Landsat-8: science and product vision for terrestrial global change research. Remote Sens. Environ. 145, 154–172. doi:10.1016/j.rse.2014.02.001
Strahler, A. H., Boschetti, L., Foody, G. M., Friedl, M. A., Hansen, M. C., Herold, M., et al. (2006). Global land cover validation: recommendations for evaluation and accuracy assessment of global land cover maps, 51. Luxembourg: European Communities, 1–60.
Vancutsem, C., Achard, F., Pekel, J.-F., Vieilledent, G., Carboni, S., Simonetti, D., et al. (2021). Long-term (1990–2019) monitoring of forest cover changes in the humid tropics. Sci. Adv. 7, eabe1603. doi:10.1126/sciadv.abe1603
Vancutsem, C., Pekel, J.-F., Bogaert, P., and Defourny, P. (2007). Mean compositing, an alternative strategy for producing temporal syntheses. concepts and performance assessment for spot vegetation time series. Int. J. Remote Sens. 28, 5123–5141. doi:10.1080/01431160701253212
Verbesselt, J., Hyndman, R., Newnham, G., and Culvenor, D. (2010). Detecting trend and seasonal changes in satellite image time series. Remote Sens. Environ. 114, 106–115. doi:10.1016/j.rse.2009.08.014
Whittaker, J. M. (1927). On the cardinal function of interpolation theory. Proc. Edinb. Math. Soc. 1, 41–46. doi:10.1017/s0013091500007318
Wolters, E., Toté, C., Dierckx, W., Paepen, M., and Swinnen, E. (2023). Proba-vcollection 2 products user manual
Zhu, Z., and Woodcock, C. E. (2014). Continuous change detection and classification of land cover using all available landsat data. Remote Sens. Environ. 144, 152–171. doi:10.1016/j.rse.2014.01.011
Keywords: PROBA-V, global, remote sensing, monitoring, land use land cover change, vegetation index, oil palm plantation, perennial plantation
Citation: Bos A, Lamarche C, Niro F and Defourny P (2025) Monitoring biweekly dynamics of pan-tropical industrial plantations over 6 years using 100 m PROBA-V data. Front. Remote Sens. 6:1575100. doi: 10.3389/frsen.2025.1575100
Received: 11 February 2025; Accepted: 20 May 2025;
Published: 19 June 2025.
Edited by:
Kristofer Lasko, Engineer Research and Development Center (ERDC), United StatesReviewed by:
Sadadi Ojoatre, Kyambogo University, UgandaJacob Abramowitz, University of Alabama in Huntsville, United States
Copyright © 2025 Bos, Lamarche, Niro and Defourny. This is an open-access article distributed under the terms of the Creative Commons Attribution License (CC BY). The use, distribution or reproduction in other forums is permitted, provided the original author(s) and the copyright owner(s) are credited and that the original publication in this journal is cited, in accordance with accepted academic practice. No use, distribution or reproduction is permitted which does not comply with these terms.
*Correspondence: Audric Bos, YXVkcmljLmJvc0B1Y2xvdXZhaW4uYmU=