 Jifu Zhang1
 Haijun Wang
- 1Engineering and Technical College of Chengdu University of Technology, Leshan, Sichuan, China
- 2School of Economics, Sichuan University of Science and Engineering, Zigong, Sichuan, China
- 3National Engineering Research Center of Geographic Information System, China University of Geosciences, Wuhan, China
- 4Faculty of Environment, Kasetsart University, Bangkok, Thailand
- 5College of Management Science, Sichuan University of Science and Engineering, Zigong, Sichuan, China
The alpine wetlands on the eastern Qinghai-Tibet Plateau (EQTP) serve as a critical global ecological barrier. Under the dual pressures of climate change and human activities, these wetland systems face environmental challenges such as retrogressive succession, aridification, and desertification. Based on the Google Earth Engine (GEE) cloud computing platform, this study integrates high-resolution imagery, multi-source geoscience datasets, and field survey samples. Object-based image analysis (OBIA), logistic regression, and species distribution models (SDMs) were employed to systematically assess the spatiotemporal differentiation characteristics and key driving factors of alpine wetlands in EQTP. The results indicate that: (1) When applying OBIA classification to alpine wetlands, as image resolution increased from 30 m to 5 m, classification accuracy exhibited an improvement–saturation–fragmentation pattern. At a resolution of 10 m (Scale = 26), marsh wetland structures and spatial distribution characteristics were accurately identified, with a total wetland resource area of 17,454.56 km2. (2) Wetland distribution is driven by multiple factors, including climate (temperature, precipitation), topography (elevation, slope), and human activities (road density, settlement distribution). The best explanatory performance for driving forces was observed at a 500 m spatial scale (AUC = 0.81), confirming that climate factors predominantly govern long-term changes, while human activities significantly influence ecological patterns. (3) During 2021–2040, under a low-emission scenario, the area of highly suitable wetland zones was larger than under a high-emission scenario, with warming causing very high suitability zones to shift toward higher elevations. From 2041 to 2060, as regional warming intensified, the area of excellent suitability wetlands decreased. Between 2081 and 2100, the high-carbon emission scenario increased temperature in the high-altitude central study area, improving wetland suitability. This study proposes a GEE-based OBIA method for estimating alpine wetland resources, integrating logistic regression and SDMs to reveal the spatiotemporal differentiation mechanisms of alpine wetlands. The findings provide an effective technical framework for wetland research on the Qinghai-Tibet Plateau.
1 Introduction
Alpine wetlands on the Qinghai-Tibet Plateau (QTP) are a critical component of global wetland ecosystems, providing essential ecological functions such as water conservation, carbon storage, and biodiversity protection (Zhang et al., 2023; Liu and Zhao, 2024; Wen et al., 2023). According to reports from the Ramsar Convention, global wetland areas have been continuously declining over the past decades (Hardouin et al., 2024; Huang et al., 2024), a trend that is particularly evident in the QTP region (Chen et al., 2023). As a wetland system of significant ecological value, QTP wetlands play an irreplaceable role in regional ecological regulation (Cheng et al., 2024) and have substantial implications for global climate change (Zeng et al., 2023). However, the combined effects of climate change and human activities pose severe threats to these wetlands, leading to shrinking wetland areas and the degradation of ecological functions, which have become key issues in global alpine wetland research (Maurischat et al., 2023; Vento et al., 2024). The eastern Qinghai-Tibet Plateau (EQTP), as a transition zone between the plateau and the basin, constitutes a vital part of the QTP. It is influenced by both continental climate and the southeastern monsoon, coupled with high-intensity human activities, placing significant pressure on its ecological environment. As a result, wetland systems in this region are experiencing retrogressive succession, aridification, and desertification (Wang et al., 2024), exacerbating ecological degradation risks and further threatening the stability of regional ecosystems (Zhang et al., 2023).
Wetlands on the eastern margin of the EQTP are subject to the dual impacts of climate change and human activities, yet the mechanisms underlying their spatiotemporal differentiation remain unclear. Existing studies have primarily focused on wetland temporal changes (Xu et al., 2023; Wang et al., 2024), ecological monitoring (Zhao et al., 2024), wetland function assessment (Chen et al., 2024), and carbon sink research (Song et al., 2024). However, while these studies have contributed to understanding individual factors influencing wetland changes, they often lack a comprehensive analysis of the complex, interactive mechanisms that govern the spatial differentiation of wetlands across scales. Most of the research either focuses on isolated environmental variables or specific regions, without fully addressing how multiple factors interact to influence the overall spatiotemporal patterns of wetland ecosystems in the EQTP. Therefore, there is a critical gap in the current literature regarding a systematic, multi-factorial analysis of the spatiotemporal differentiation of wetlands in this region.
This study aims to elucidate the spatiotemporal differentiation patterns of alpine wetlands on the EQTP and identify their dominant driving factors. By leveraging a remote sensing cloud computing platform (Goyal et al., 2023; Wang et al., 2022), high-resolution remote sensing imagery, large-scale geoscience datasets, and ground observation samples are integrated to systematically analyze wetland spatial differentiation and its influencing factors. The research focuses on exploring how climate change, human activities, and geographical characteristics affect wetland spatial suitability and its spatiotemporal dynamics. This approach addresses the research gap by providing a comprehensive analysis of the interaction between multiple drivers of wetland differentiation and their cumulative impact on wetland distribution patterns. The findings will also offer practical approaches for policy formulation in response to climate change.
2 Materials and methods
2.1 Study area
EQTP (Figure 1) primarily consists of the Ganzi-Aba Plateau and the western mountainous regions of Sichuan, with an average elevation of approximately 4,000–4,500 m. The region’s climate is influenced by both continental and monsoonal systems, with annual precipitation ranging from 600 to 1,000 mm. The area is densely covered by rivers, including major water systems such as the Yellow River, Jinsha River, Yalong River, Dadu River, and Min River. The EQTP hosts the largest alpine wetland zone in southern China, represented by the Zoige-Hongyuan-Aba wetland system, as well as numerous alpine lakes such as Xiaohai, forming an extensive alpine lake-wetland ecosystem. The study area encompasses 11 wetland ecological reserves, including three national-level and four provincial-level reserves. Wetlands are primarily distributed around alpine meadows and lakes, providing crucial habitats for rare and endangered species and serving as a core component of China’s key ecological function zones. The region’s vegetation is predominantly alpine meadow, which holds significant ecological and environmental value.
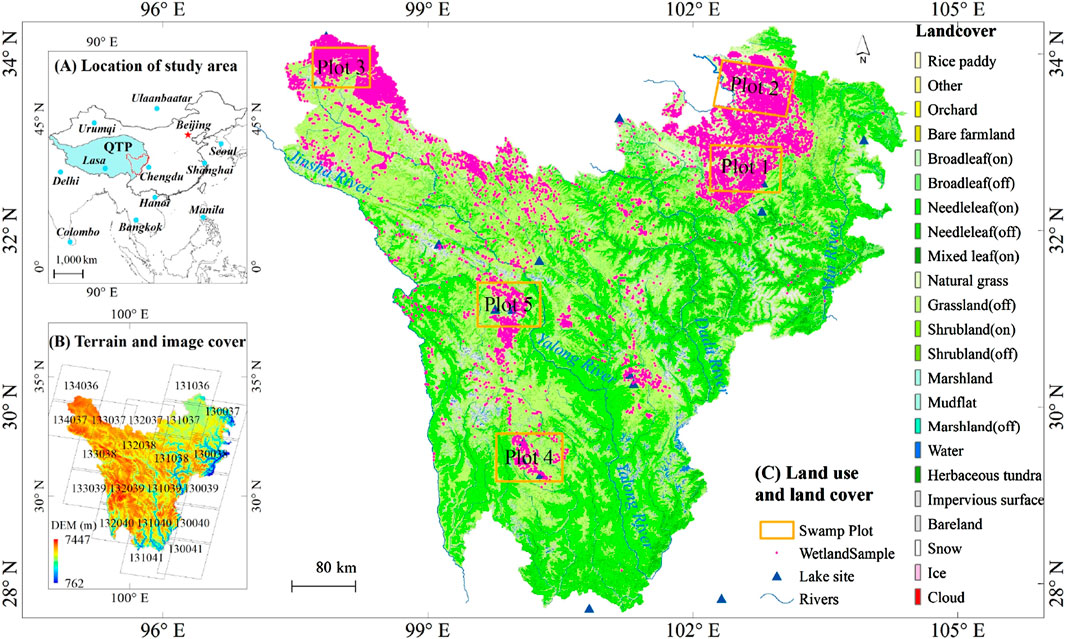
Figure 1. Geospatial feature in EQTP. (A) Location, (B) Terrain, (C) Land use and land cover.
2.2 Data processing
2.2.1 Image preprocessing
Remote sensing images of the EQTP from 2022 to 2024 were selected from the Google Earth Engine (GEE) database, focusing on the optimal periods for vegetation coverage and surface water detection (Figure 2). A total of 21 scenes of Landsat 8 surface reflectance data and 46 scenes of Sentinel-2 MSI surface reflectance data with cloud cover less than 5% were acquired. Additionally, 18 scenes of CBERS-04 P5 and P10 data were downloaded from external databases and uploaded to GEE. The original images from the three datasets were processed using GEE’s computing platform, including radiometric correction, geometric correction, and study area clipping. Furthermore, Landsat 8 multispectral and panchromatic bands were fused to generate data with a 15 m spatial resolution. As a result, three types of multispectral images—Landsat 8 (15 m), Sentinel-2 (10 m), and CBERS-04 (5 m)—were prepared for alpine wetland classification and accuracy validation.
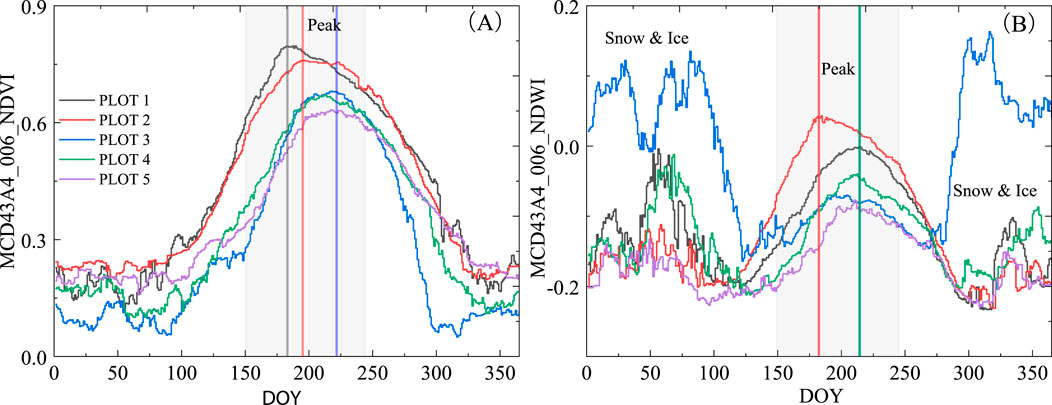
Figure 2. Intra-annual variations of NDVI and NDWI in the wetland plot of the EQTP (20-year average). (A) shows the intra-annual variation of NDVI for the five plots, and (B) shows the intra-annual variation of NDWI for the five plots. Plot1-Plot5 represent five alpine wetland transects, respectively. The gray shaded areas in the figure indicate the optimal periods for NDVI and NDWI.
2.2.2 Wetland sample collection
A multi-temporal wetland field survey dataset was used to establish a sample library for remote sensing classification and validation. Data sources included historical survey records from 2015 to 2016 (photographs and GPS points) and wetland patch data from the Second Sichuan Wetland Resources Survey (published in China Wetland Resources, Sichuan Volume, 2015 edition). To enhance data timeliness and accuracy, an updated field survey was conducted in selected wetland areas from 2022 to 2024, collecting in situ wetland data from the test region (Figure 3). Integrating remote sensing images, land use data, basic geographic information, and field survey materials, a total of 5,500–6,000 swamp wetland sample points were collected, with 70% used for algorithm training and image classification and 30% for classification accuracy validation.
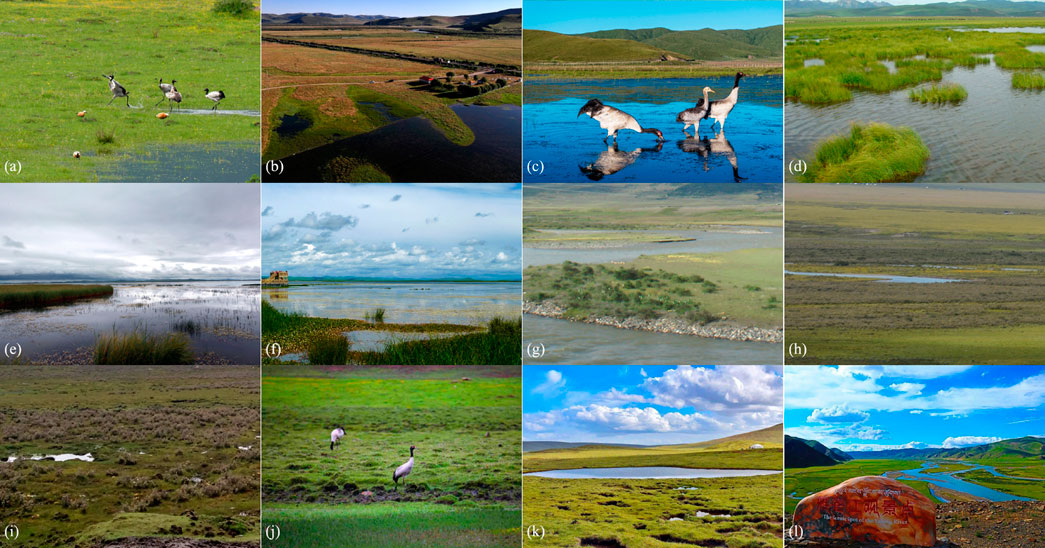
Figure 3. Field survey photographs of the study area (2022–2024). (a–c): Plot 1, (d–f): Plot 2, (g–i): Plot 4, (j–l): Plot 3.
2.2.3 Big data processing
The factors influencing wetland spatial differentiation are diverse and complex. Based on the study objectives, these factors are categorized into natural environment and human activities (Table 1). The EQTP is influenced by both continental and monsoon climates. As the plateau’s climate shifts from warm-dry to warm-wet, regional climate change inevitably affects surface vegetation and hydrological dynamics. The study area consists of the Ganzi-Aba Plateau and western Sichuan Mountains, characterized by extensive plateaus and alpine valleys, forming unique topographical and geomorphological features. These geographical landscapes, along with hydrological distribution, significantly impact wetland changes and are therefore selected as key influencing factors. Additionally, the study area contains over 60 nature reserves at various levels and is a key ecological functional zone in China’s national land-use planning. The construction of these ecological functional areas also influences wetland spatial differentiation. To analyze these impacts, data from five categories and 18 factors (Table 1) were processed through interpolation, reanalysis, resampling, and boundary clipping, generating raster datasets at 100 m, 250 m, 500 m, and 1,000 m resolutions.
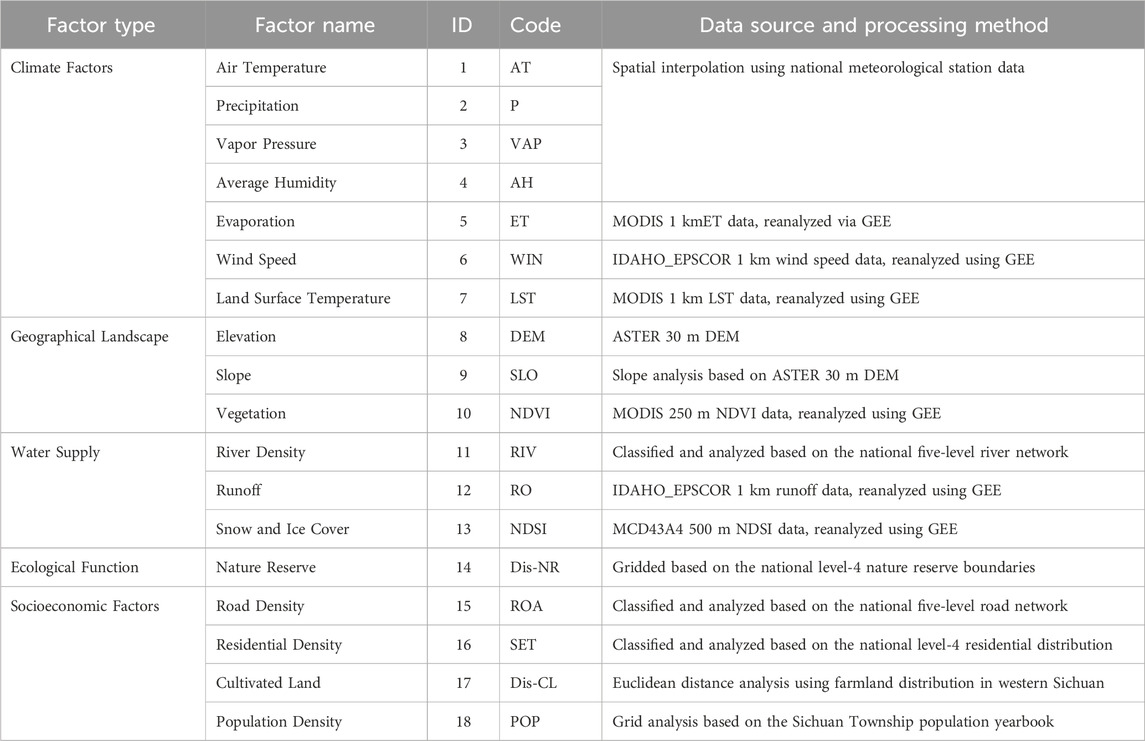
Table 1. Factors influencing the spatial differentiation of alpine wetlands in the EQTP.
2.3 Research methodology
2.3.1 Image OBIA classification
The objective of multi-scale segmentation is to partition remote sensing images at different scales to obtain image regions that better correspond to actual land cover characteristics. This process involves the iterative adjustment of segmentation parameters, such as smoothness (
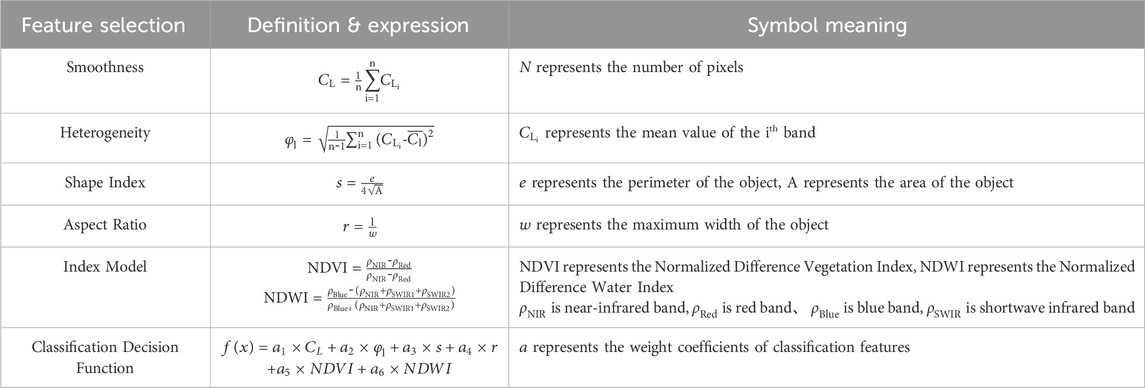
Table 2. Fundamental principles of OBIA classification.
2.3.2 Collinearity diagnosis
The issue of multicollinearity among influencing factors essentially pertains to the correlation among independent variables in regression analysis. While the likelihood of perfect correlation between independent variables is low, excessive correlation can reduce the accuracy of regression results and even lead to sign reversals of regression coefficients, rendering the analysis uninterpretable. The correlation coefficient R is used to assess the relationships among independent variables (Equation 1), while the variance inflation factor (VIF, Equation 2) further quantifies the degree of multicollinearity. Tolerance, which is closely related to VIF, is employed to further explain (Equation 3) the independence of variables.
R represents the correlation coefficient matrix of the observed independent variables, where
2.3.3 Spatial logical relationship
Traditional linear regression characterizes the continuous variation of a dependent variable in response to changes in independent variables. However, wetland spatial distribution exhibits a binary classification property, i.e., the presence or absence of wetlands in a given area (where the independent variable takes values of 1 or 0). Therefore, a binary logistic regression model is introduced to establish the relationship between wetland changes and influencing factors. The logistic regression model constructs a regression relationship between a dependent variable and multiple independent variables to predict the probability of an event occurring (Wang et al., 2019). The binary logistic function is employed to establish the correlation between wetland spatial differentiation and driving factors, enabling the analysis of key factors influencing wetland spatial distribution. Additionally, it quantifies the contribution of each influencing factor. The mathematical expression of the logistic regression function is given as follows:
2.3.4 Suitability assessment of distribution
By integrating driving factors and WorldClim climate model data, the Maximum Entropy (MaxEnt) model is utilized to assess the suitability of alpine wetland distribution under Shared Socioeconomic Pathway (SSP) scenarios. MaxEnt is a predictive model based on the principle of maximum entropy, which aims to construct the most balanced probability distribution while satisfying known constraints. The probability distribution of MaxEnt is formulated as follows (Equation 6):
The predictive performance of MaxEnt was evaluated using the area under the receiver operating characteristic curve (AUC). Under different emission scenarios, the AUC values were all above 0.80, indicating good model performance and reliable prediction results. In addition to MaxEnt, three classical Species Distribution Models were also applied: GARP, BIOCLIM, and DOMAIN. These models used the same environmental variables and species occurrence data to simulate the potential distribution of alpine wetlands. Their outputs were used to cross-validate the prediction results of MaxEnt, enhancing the robustness and credibility of the suitability assessment.
3 Results and analysis
3.1 Spatial distribution characteristics of wetlands
3.1.1 Image segmentation and classification
Multi-scale segmentation training was conducted on L8-30m, L8-15m, S2, and C04 images for representative plots to analyze and determine the optimal segmentation scale for different images (Figure 4). As shown in the figure, the Rate of Change (RC) curve exhibits multiple peaks corresponding to variations in Local Variance (LV). The segmentation scales associated with the RC peaks are likely the optimal scales for marsh wetland segmentation. Therefore, these RC peak values can be used as training thresholds for segmentation experiments to obtain the best segmentation results for alpine marsh wetlands. In terms of segmentation performance, higher spatial resolution leads to improved segmentation accuracy. Among the four image types, the C04 dataset yielded the most optimal segmentation results, followed by S2, then L8-15m. In contrast, L8-30m images failed to effectively distinguish between wet meadows and grasslands. The segmentation process and results indicate that spatial resolution plays a crucial role in image segmentation accuracy, while spectral information has a relatively weaker influence.
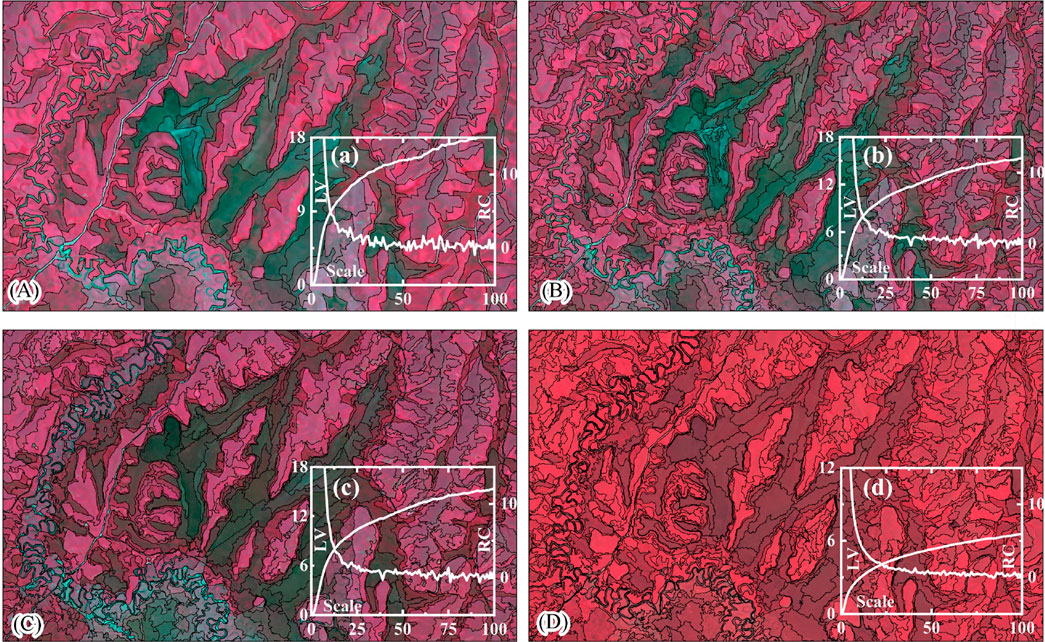
Figure 4. Optimal scale segmentation results of OBIA for typical alpine wetland plots. ((A–D) represents L8-30m, L8-15m, S2-10m, and C04-5m, respectively).
As the spatial resolution of the image increases, segmentation accuracy also gradually improves. When the resolution increases from 30 m to 15 m (Figures 4A,B), the segmentation results show significant enhancement. A further improvement is observed when the resolution increases from 15 m to 10 m (Figures 4B,C). However, when the resolution increases from 10 m to 5 m (Figures 4C,D), the improvement in segmentation accuracy becomes marginal. This phenomenon is attributed to the structural characteristics and object sizes of marsh wetlands. For marsh wetlands, an image resolution of 10 m with a segmentation scale of 26 (Figure 4C) yields an optimal wetland structure segmentation. Further increases in spatial resolution do not significantly enhance segmentation accuracy; instead, they reduce segmentation efficiency and lead to excessive fragmentation of land cover types. This finding provides valuable insights for selecting data sources and determining optimal segmentation scales for marsh wetland classification across the study area.
Based on the segmentation of the four experimental image datasets, the pre-established sample data were used to classify the segmented results, producing the OBIA-based marsh wetland classification results (Figure 5). The OBIA method effectively classified wetland structures into five categories: water bodies, peatlands, wet meadows, meadows, and grasslands. Referring to field survey data on wetland types within the study area, the OBIA algorithm demonstrated optimal performance in identifying wetland structures when applied to datasets with a spatial resolution of 5–10 m. To validate classification accuracy, a random subset of sample points (30% of the total samples) was extracted for accuracy assessment. The Kappa coefficients for the classification results of the C04, S2, L8-15m, and L8-30m datasets were 0.910, 0.939, 0.912, and 0.832, respectively. These results indicate a direct relationship between OBIA classification accuracy and the spatial resolution of the data source. Notably, the classification accuracies of S2 and C04 were highly similar, which aligns with their comparable segmentation performance.
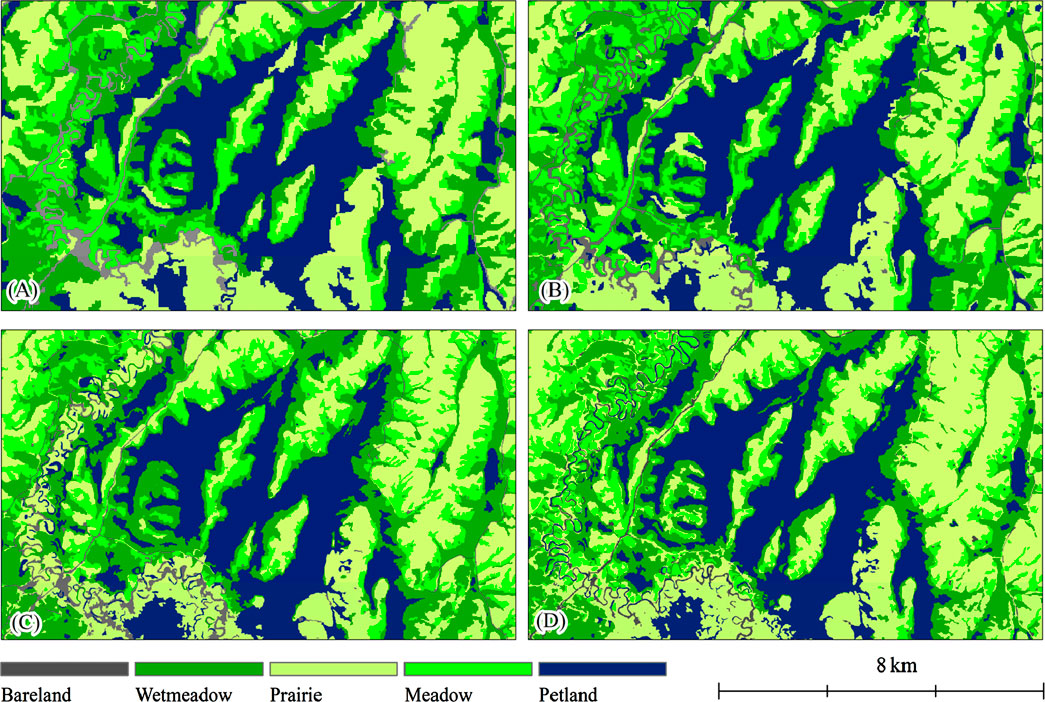
Figure 5. OBIA classification results for typical alpine wetland plots. ((A–D) represents L8-30m, L8-15m, S2-10m, and C04-5m, respectively).
3.1.2 Spatial distribution of alpine wetlands
A statistical analysis was conducted on marsh wetlands extracted from Landsat-8 and Sentinel-2 datasets, with the results presented in Figure 6. The total area of alpine marsh wetlands in western Sichuan was estimated at 17,438.96 km2 and 17,454.56 km2, respectively, for the two datasets, showing a minor difference of 15.59 km2. The wetlands were primarily concentrated in Xinlong, Shiqu, Ruoergai, Hongyuan, and Ganzi, with respective wetland areas of 4,703.08 km2, 2,757.97 km2, 2,755.50 km2, 2,066.52 km2, and 1,614.14 km2. Conversely, minimal wetland resources were found in Muli, Danba, Heishui, Lixian, Maerkang, and Maoxian. Using the remote sensing classification approach presented in this study, the total marsh wetland area extracted from Sentinel-2 data was 37.42 km2 larger than that reported in the Second Sichuan Wetland Resources Survey. The newly identified wetland areas were mainly located in Ganzi, Xinlong, Aba, Rangtang, and Maerkang. Specifically, Maerkang saw an increase of 0.81 km2, primarily along its border with Aba. These wetlands were not accounted for in the Second Sichuan Wetland Resources Survey. The improvement in wetland identification and extraction in this study can be attributed to the higher resolution of the data sources and the optimization of classification methods, which enabled more precise recognition of smaller wetland patches.
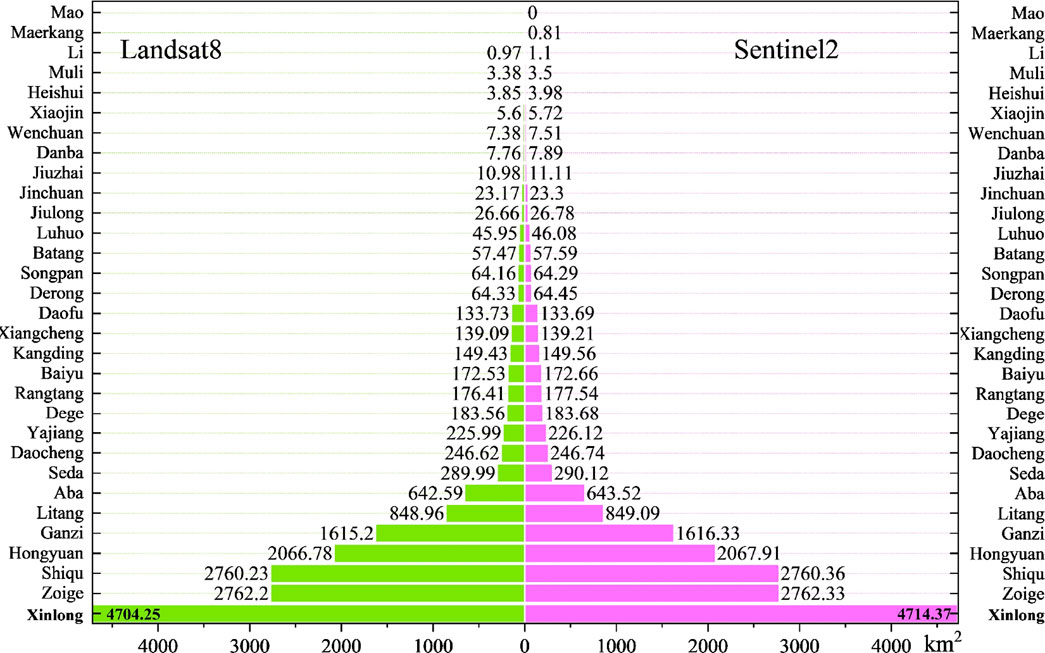
Figure 6. Alpine wetland resources and their spatial distribution characteristics.
3.2 Spatial characteristics and diagnosis of influencing factors
3.2.1 Spatial characteristics of influencing factors
Some influencing factors are discrete variables, necessitating processing to convert them into spatially continuous data. During the rasterization of discrete data, classification is required for variables such as road networks and river networks. The classified river and road networks were transformed into spatially continuous raster using spatial interpolation and density analysis (Figure 7). The climatic characteristics of the eastern margin of the Tibetan Plateau exhibit a southeast-wet to northwest-dry gradient (Figure 7A). The central-northern region has lower temperatures, while the southeastern part is warmer (Figure 7B). Evaporation rates are high in the eastern and southwestern regions (Figure 7D), and wind speeds are greater in high-altitude areas (Figure 7E). Surface temperatures are relatively high in the northern and southern valley areas (Figure 7F). The terrain is relatively flat in the northern and midwestern regions (Figure 7H), whereas the northeastern and southern of Zoige have high vegetation coverage (Figure 7I). Figure 7J illustrates that after classification and density analysis of the river network, the major rivers—Jinsha, Yalong, Dadu, and Min—significantly influence water resource distribution, aligning with the actual water resource patterns in the region. After classification of the road network (Figure 7N), it is evident that national and provincial roads exert a significantly greater radiation effect on the surrounding areas compared to county and township roads. The road network also exhibits differential impacts on wetland ecosystems. Furthermore, the spatial distribution of residential areas in Ganzi and Aba prefectures (Figure 7O) shows that prefecture-level cities and county seats have a more pronounced ecological impact than village-level settlements. The spatial distribution and radiation range of settlements further illustrate this characteristic. For meteorological and some socio-economic data, spatialization does not require classification (Figures 7A–C). Additionally, factors inherently in raster format, such as DEM and MODIS products, do not require further spatialization. Instead, these datasets undergo specific processing, including slope extraction, vegetation coverage calculation, and reclassification, to derive relevant influencing factor variables as needed for the study.
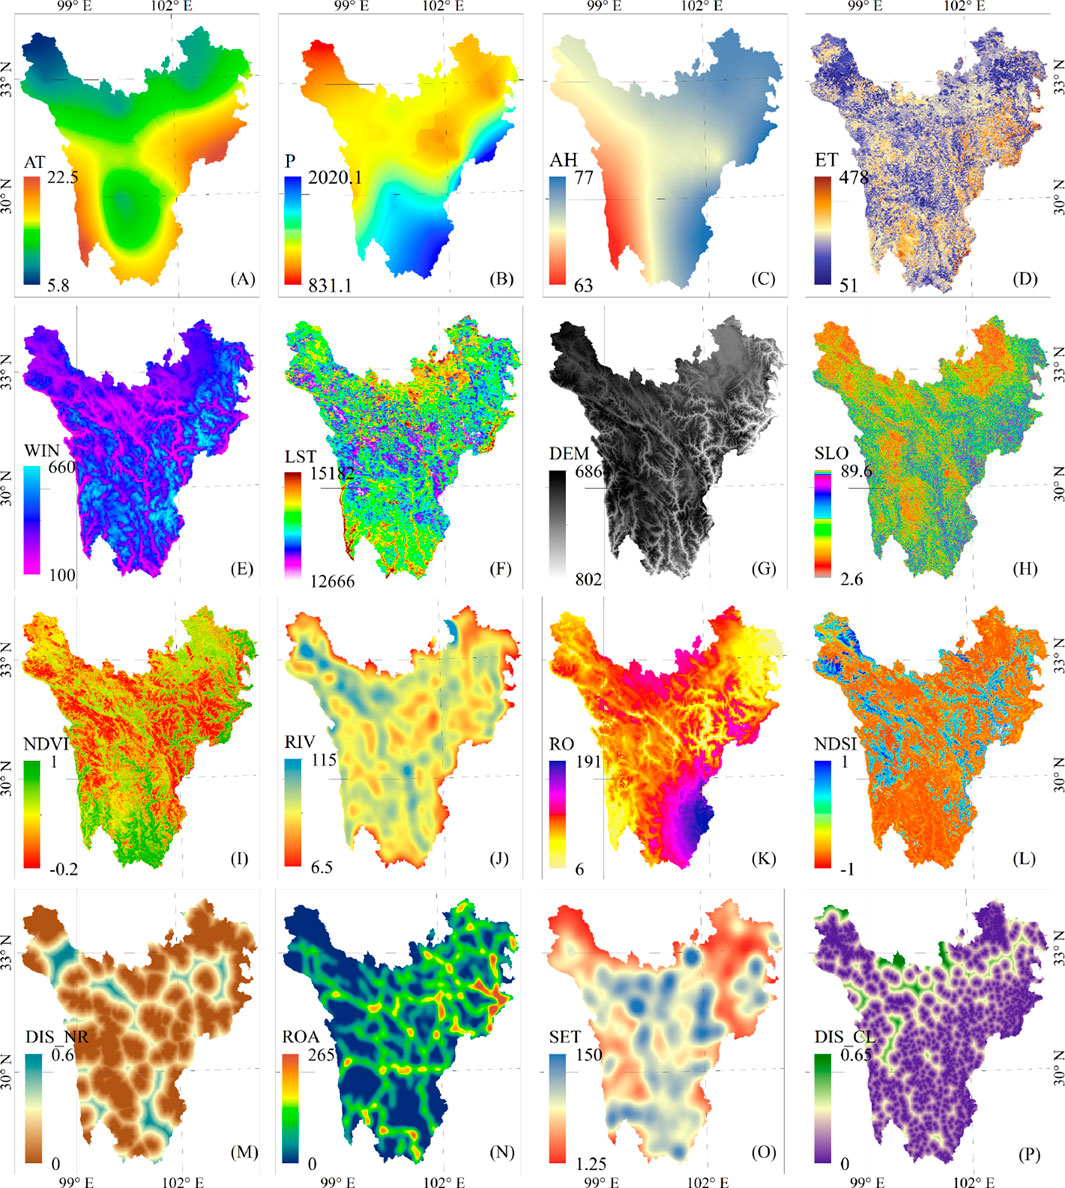
Figure 7. Spatial distribution of wetland influencing factors. (A–P) represent the spatial distribution of AT (air temperature), P (precipitation), VAP (vapor pressure), AH (humidity), ET (evaporation), WIN (wind speed), LST (land surface temperature), DEM (elevation), SLO (slope), NDVI (vegetation index), RIV (river density), RO (runoff), NDSI (snow/ice cover), Dis-NR (distance to nature reserves), ROA (road density), SET (settlement density), Dis-CL (distance to croplands), and POP (population density) in the study area.
3.2.2 Multicollinearity diagnosis
Multicollinearity among influencing factors refers to the correlation between independent variables in regression analysis. While perfect collinearity is rare, excessive correlation can reduce the accuracy of regression results and even lead to sign reversal in regression coefficients, making the analysis uninterpretable. This contradicts the fundamental purpose of regression analysis, which is to provide explanatory insights. To analyze the impact of influencing factors on wetland changes, we constructed six categories comprising 18 factor sets. To ensure objective results, we conducted a multicollinearity diagnosis on these 18 factors (Figure 8) to eliminate those exhibiting collinearity. Large samples tend to mitigate collinearity, whereas specific small samples can introduce statistical correlations among variables. Therefore, we randomly sampled 50% of the total dataset (approximately 400,000 samples) for the diagnosis. The results of the full-factor collinearity diagnosis (Figure 8) indicate a multicollinearity issue between P (precipitation) and VAP (vapor pressure), as reflected by a variance inflation factor (VIF) >10 and a tolerance (VOL) < 0.1. Additionally, AT (air temperature) and VAP also exhibit collinearity. This suggests that vapor pressure (VAP) is highly correlated with temperature and precipitation, necessitating its removal. Consequently, VAP is excluded from the analysis of wetland change drivers.
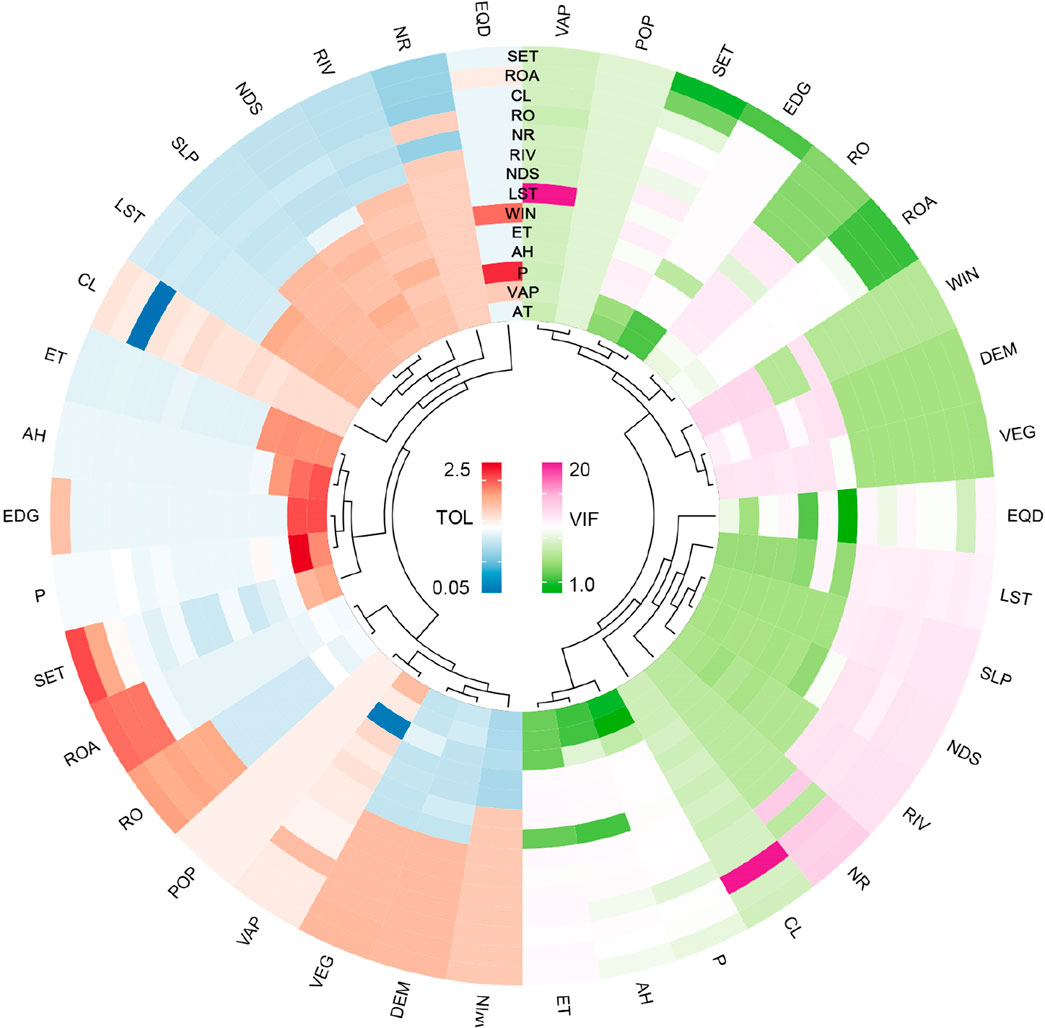
Figure 8. Collinearity diagnostics for the set of influencing factors. TOL refers to the Tolerance Coefficient, while VIF denotes the Variance Inflation Factor.
3.3 Mechanism of wetland spatial differentiation
3.3.1 Optimal analysis scale
Based on the spatial extent of the study area and referring to the National Geographic Grid Standards (Liu et al., 2022), we established four geographic grid scales: 100 m × 100 m, 250 m × 250 m, 500 m × 500 m, and 1000 m × 1000 m. Wetland distribution raster data and 16 driving factor values were extracted at these scales. We applied ROC curve analysis to assess the effectiveness of different scales (Dani and Ginting, 2023), treating wetland spatial distribution rasters as the state variable (binary values with wetlands assigned as 1) and the driving factors as test variables. Each scale generated 18 ROC curves, and the area under the curve (AUC) was used to evaluate the performance of different scales (Figure 9). The results show that, except for LST (Land Surface Temperature) and NDVI (Normalized Difference Vegetation Index), all 16 factors achieved an AUC greater than 0.75 across the four scales. The 500 m scale yielded the highest average AUC of 0.81, indicating that it is the optimal scale for subsequent logistic regression analysis.
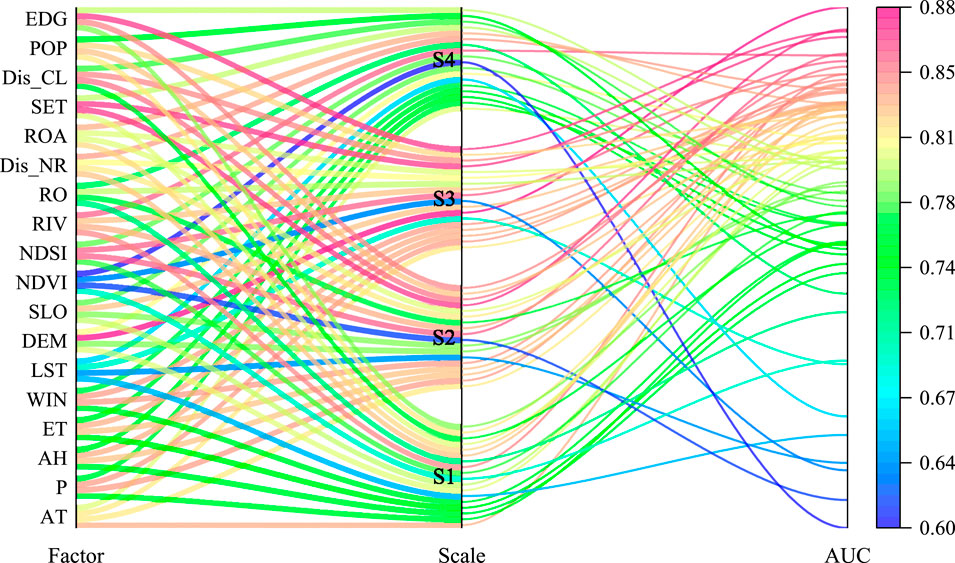
Figure 9. Multi-scale ROC analysis of the spatial relationship between influencing factors and wetland distribution. S1 = 100 m × 100 m, S2 = 250 m × 250 m, S3 = 500 m × 500 m, S4 = 1000 m × 1000 m.
3.3.2 Logistic regression analysis
The ROC analysis results indicate that the 500 m × 500 m grid is the most suitable analysis scale. Therefore, we used data at this scale for logistic regression analysis. To better assess the effect of logistic regression across different scales, we conducted regression analysis on all four scales. The sample sizes for the four scales were 24.8 million (100 m), 3.968 million (250 m), 992,000 (500 m), and 248,000 (1000 m). Due to computational limitations, we performed random sampling (20% for 100 m and 50% for 250 m) before regression analysis, while all data for the 500 m and 1,000 m scales were fully included. The regression analysis results are shown in Figure 10. We evaluated the statistical significance of the driving factors based on p-values from the regression results. Factors LST (Land Surface Temperature), NDVI (Normalized Difference Vegetation Index), and POP (Population Density) had p-values greater than 0.05, indicating no significant impact on wetland distribution. To further validate the influence of each factor, we performed ROC analysis for all four scales and computed the area under the curve (AUC) for each driving factor. When AUC <0.5, the factor lacks explanatory power for wetland distribution, meaning wetlands are not sensitive to changes in that factor. When AUC >0.75, the factor is considered a key driver of wetland spatial variation (Wang et al., 2019), indicating that the predicted wetland probability aligns well with actual wetland distribution. For the optimal 500 m scale, ROC analysis showed that LST and NDVI had AUC values of 0.69 and 0.63, respectively, consistent with the non-significance results from logistic regression.
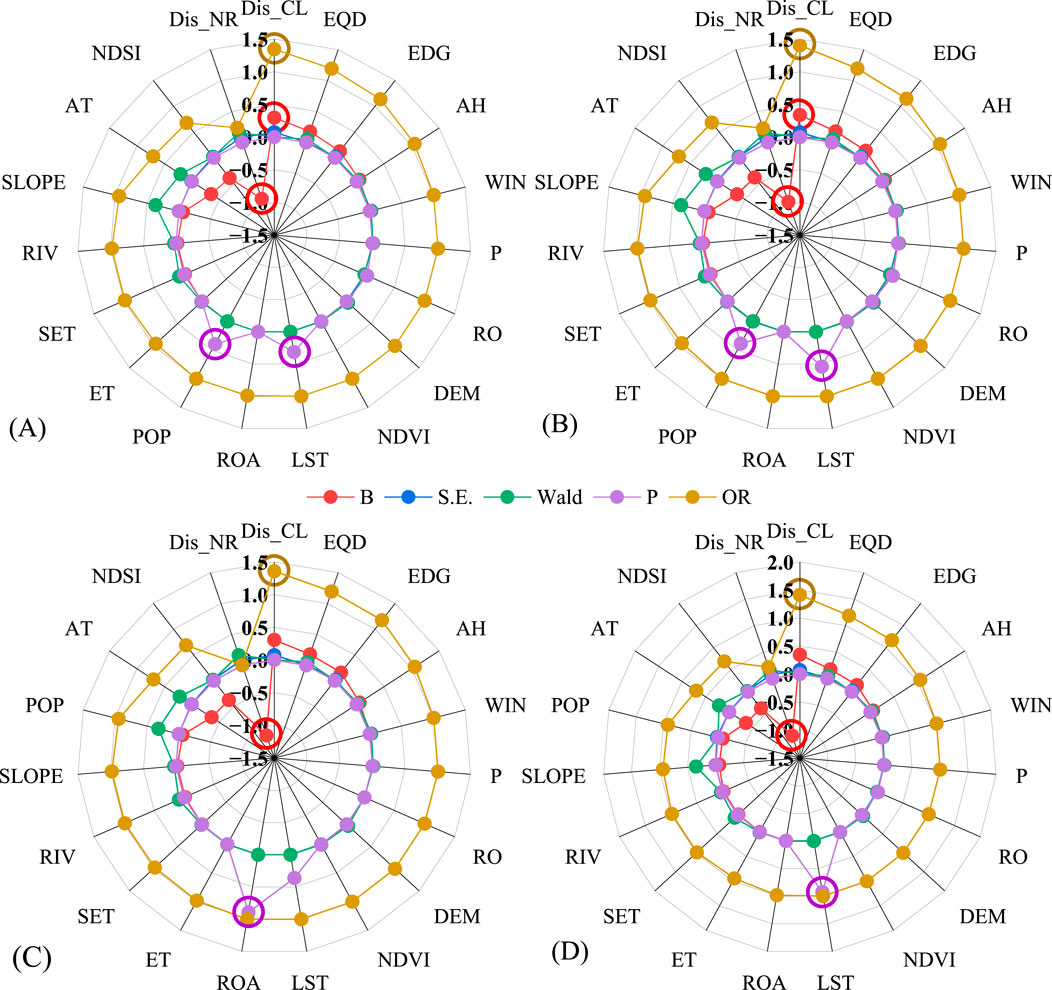
Figure 10. Parameters of logistic regression results at four scales. (A–D) correspond to the four analysis scales S1-S4 (S1 = 100 m × 100 m, S2 = 250 m × 250 m, S3 = 500 m × 500 m, S4 = 1000 m × 1000 m). B, S.E., Wald, and P represent the parameters of the logistic regression analysis, respectively.
3.3.3 Contribution of driving factors
Through multi-scale logistic regression analysis, we assessed the main factors influencing wetland spatial distribution and the contribution of each factor. After removing insignificant factors from the regression analysis, a total of 16 factors were found to affect wetland space (Table 3). The regression analysis results across the four scales show a consistent overall trend. At the optimal regression scale, logistic regression coefficients (B) and odds ratios (OR) indicate that atmospheric humidity and precipitation contribute positively to the development of alpine wetlands. In addition, areas with dense river networks and those far from farmland are favorable for the spatial expansion of alpine wetlands. Climate factors that negatively affect wetland development include temperature and evaporation. Specifically, the temperature factor has a B value of −0.354 and an OR of 0.701, indicating that with each unit increase in temperature, wetlands will decrease by 0.298 units. Among the socio-economic factors, population density significantly influences wetlands across all analysis scales, with population density being significant only at the 500 m × 500 m scale, where its B value and OR are high. Moreover, the establishment of nature reserves strongly promotes the potential development of wetlands, as indicated by its high regression coefficient and OR value in the regression equation. In terms of geographical landscape factors, terrain slope has a significant effect on wetland development (B = −0.062), with wetland development probability decreasing as the slope increases. Therefore, the main natural factors influencing wetland change in the EQTP region include temperature, slope, atmospheric humidity, and precipitation. The main socio-economic factors include nature reserves, agricultural cultivation, population density, and the distribution of settlements. It is also worth noting that due to the sparse distribution of meteorological stations, the full impact of climate factors on wetlands has not been fully reflected. Additionally, glacier coverage is another factor influencing wetland development, as shown by the regression coefficient and OR of the NDSI. After eliminating the insignificant factors (P ≥ 0.05), regression equations for the four scales were constructed (100 m, 250 m, 500 m, and 1000 m), and the specific equations are as follows.
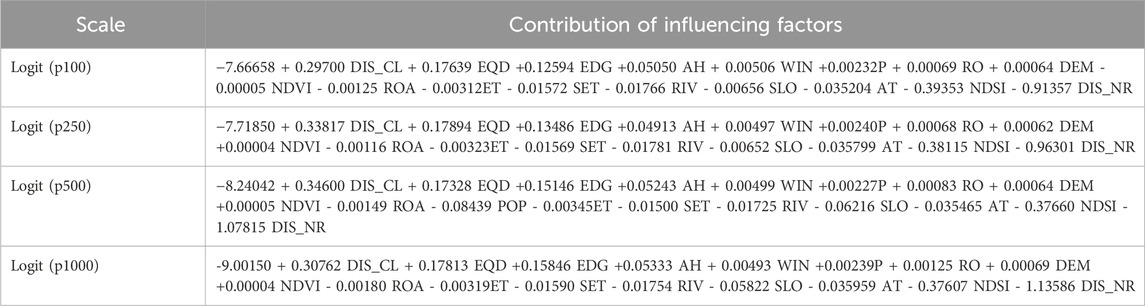
Table 3. Contribution of influencing factors to the spatial differentiation of alpine wetlands.
3.4 Wetland distribution suitability
By integrating data on nature reserves, agricultural cultivation, population density, and settlements as socio-economic driving factors and incorporating WorldClim climate model data, the MAXENT model was used to evaluate the spatial distribution suitability of alpine wetlands in western Sichuan from 2021 to 2,100 across four time periods. The results are shown in Figure 11. Analysis indicates that during 2021–2040, under the low-emission scenario (SSP2.6), the area of highly suitable wetland distribution is larger than that under the high-emission scenario (SSP8.5), particularly in the low-altitude areas of the northern part of the study region. As temperature increases from SSP2.6 to SSP8.5, the evaluation results show a decrease in the “Very High” suitability zone for alpine wetlands, while the “High” suitability area expands. These results suggest that regions highly suitable for alpine wetland distribution are shrinking. During 2041–2060, as regional temperatures rise, areas classified as “Excellent” for wetland distribution decrease, with a more pronounced reduction in “Very High” suitability zones in the alpine wetlands of Xinlong and Baiyu counties. The model results indicate that increased carbon emissions led to warming, which enhances surface evaporation, negatively impacting alpine wetland development. In the 2061–2080 period, the results show an expansion of the “High” suitability zone in high-altitude areas of Xinlong County and Haizi Mountain. This suggests that rising temperatures increase glacial meltwater in high-altitude regions, improving water replenishment for lakes and marsh wetlands, and leading to an expansion of wetland areas. In the 2081–2100 period, the results indicate that high-carbon emission scenarios cause warming in the central high-altitude areas of the study region, thereby increasing wetland distribution suitability.
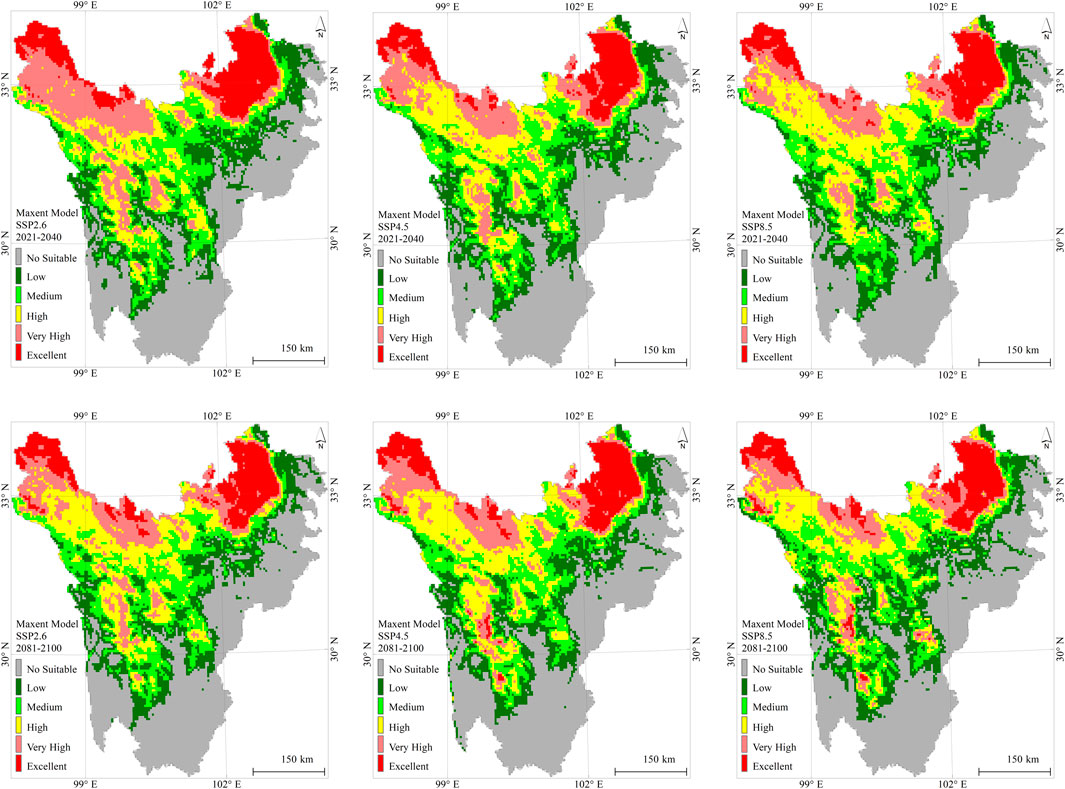
Figure 11. Evaluation results of the suitability of alpine wetland spatial distribution.
4 Discussion
4.1 Wetland classification validation
To better verify the accuracy of OBIA-based alpine wetland classification, we integrated field-surveyed GPS sample points with 1706 independently sampled points from GEE (including 186 field-measured samples) to compute confusion matrices for the classification results of four datasets, thereby assessing their classification accuracy. As shown in Table 4, the overall classification accuracy ranks from highest to lowest as follows: L8-15m, S2, C04, and L8-30m. Although the C04 dataset has the highest spatial resolution, its classification accuracy is not the highest, primarily because it contains only three spectral bands (lacking the blue band). Since the OBIA classification algorithm relies on spectral and textural features, the absence of the blue band affects classification results. As indicated in Table 4, the classification accuracy of wet meadows and meadows is relatively low, mainly due to the spectral similarity between wet meadows and forested areas, making them difficult to distinguish. The L8-15m dataset provides the most comprehensive spectral information with seven bands, while the S2 dataset includes four bands (blue, green, red, and near-infrared), and the C04 dataset has only three bands (red, green, and near-infrared). This highlights the importance of spectral richness in the OBIA classification algorithm. Therefore, when applying the OBIA classification method to alpine marsh wetland classification across the study area, the S2 and L8-15m datasets yield the best classification results. Overall, validation of the wetland classification results using field-measured samples shows that the Kappa coefficient is consistent with that of the OBIA classification, further confirming the high reliability of OBIA-based alpine wetland resource estimation.
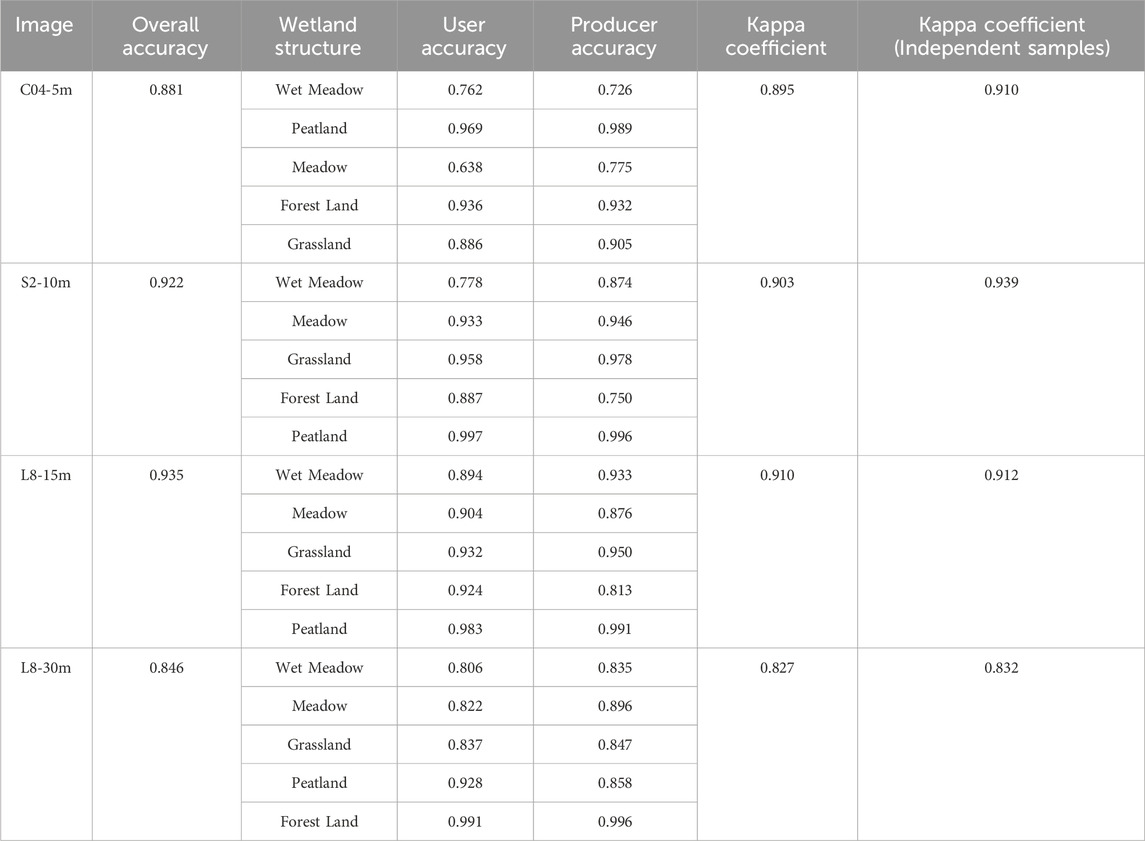
Table 4. Accuracy validation of OBIA classification results for images from different sensors.
4.2 Drivers and suitability of wetland distribution
The results of the multi-scale logistic regression analysis indicate that several socio-economic factors have a significant impact on wetland distribution. Among them, population density is a key factor, showing strong significance particularly at the 500 m × 500 m scale, with a high regression coefficient. This suggests that wetlands are more likely to degrade in densely populated areas. At the same time, agricultural activities, represented by the distance from farmland, exert a suppressive effect on wetland expansion. Areas farther from farmland are more likely to support wetland expansion, indicating that agricultural expansion is a major driving force behind wetland degradation. In addition, the distribution of settlements is also identified as an important variable affecting the spatial pattern of wetlands. In contrast, the establishment of nature reserves significantly promotes wetland development, suggesting that conservation policies play a positive role in mitigating the pressures of human activities. In summary, this study reveals that specific human activities such as population concentration, farmland expansion, and settlement development are important factors shaping the spatial dynamics of alpine wetlands in the eastern Qinghai–Tibet Plateau.
The future spatial distribution of wetlands is influenced by multiple factors, leading to considerable uncertainty in the spatial distribution patterns. To address this, we discuss the prediction accuracy by combining ROC analysis of the prediction process with findings from previous related studies. Following the methods of Jane et al. (2010); Merow et al. (2013); Wang et al. (2024), we evaluated the MAXENT prediction results. During the period 2021–2040, under three emission scenarios, the area highly suitable for alpine wetland spatial distribution decreased as emission concentrations increased. ROC analysis of the prediction results revealed AUC values (Figures 12A–C) of 0.816, 0.823, and 0.821, respectively, all exceeding 0.80 (Muschelli, 2020; Huang and Ling, 2005), indicating robust prediction performance. The wetland prediction results for the period 2041–2061 were similar to those for 2021–2040, with a noticeable reduction in highly suitable areas for alpine wetlands in Xinlong and Baiyu counties. During the periods 2061–2081 and 2081–2,100, warming in the high-altitude regions of central western Sichuan enhanced the suitability of wetland distribution. The AUC values for the wetland spatial distribution predictions during 2081–2100 (Figures 12D–F) were 0.825, 0.815, and 0.831, respectively, all above 0.80, demonstrating reliable prediction outcomes.
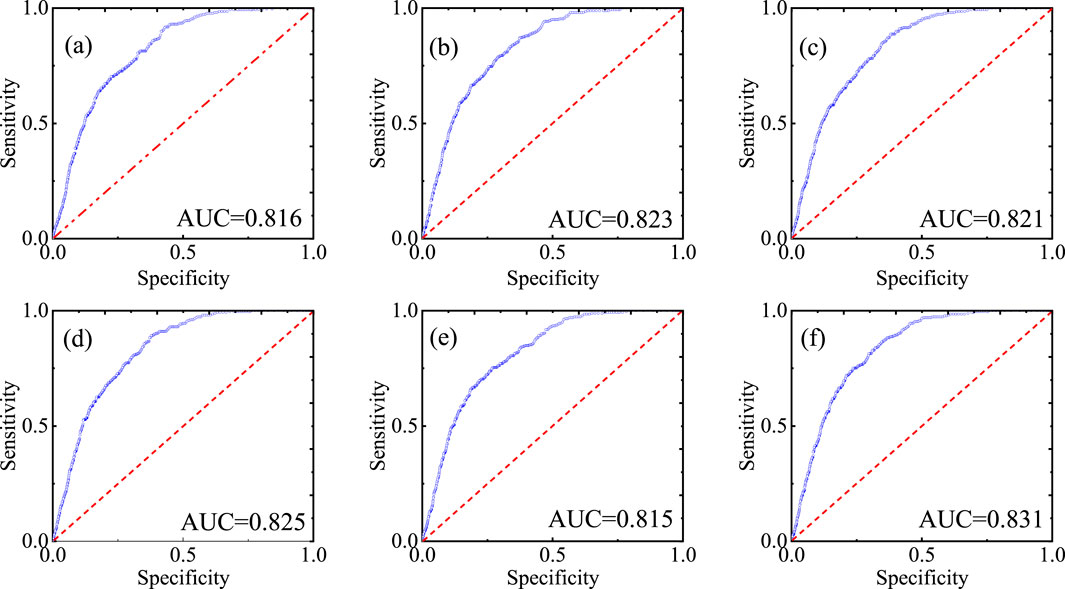
Figure 12. ROC analysis of wetland distribution suitability evaluation. (A–C) present the AUC values from the MaxEnt simulations under SSP2.6, SSP4.5, and SSP8.5 scenarios for the period 2021–2040, while (D–F) correspond to the period 2081–2100. AUC represents the area under the curve.
Although this study employed multiple SSP-based climate projections derived from CMIP6 to model the future distribution of alpine wetlands, it is important to recognize the inherent uncertainties associated with climate models (GCMs). Different GCMs vary in their projections of temperature and precipitation, especially in complex mountainous terrains where topography-induced microclimates are prevalent. These variations can influence suitability outputs generated by models such as mXENT when simulating alpine wetland distribution. Previous studies have shown that the choice of GCMs significantly affects spatial predictions of climate-sensitive ecosystems in mountainous regions (Wang et al., 2020; Eyring et al., 2024), highlighting the need to interpret model outputs with caution and, where possible, to adopt ensemble approaches to improve robustness.
Furthermore, while SSP narratives provide a globally harmonized framework for socio-economic pathways, their direct applicability to alpine environments is limited. SSPs assume generalized trajectories of population growth, land-use change, and economic development that may not reflect the socio-political and ecological realities of high-altitude regions. For instance, alpine areas in western Sichuan are characterized by sparse human populations, limited infrastructure development, and strong conservation policies that restrict intensive land use. These factors suggest that SSPs may overestimate anthropogenic pressures or underrepresent region-specific resilience in such contexts. Future research should consider downscaling SSPs or integrating locally informed socio-environmental scenarios to capture better the complexity of alpine wetland dynamics under climate change.
To further substantiate these patterns, the findings of this study are supported by similar research in other mountainous regions, such as the Andes and Himalayas, where climate warming, glacier retreat, and changes in hydrological regimes have been shown to drive significant shifts in alpine wetlands (Eyring et al., 2024; Bello et al., 2025; Quintana et al., 2025; Domic et al., 2025; Zimmer et al., 2024; Manzoor et al., 2024; Alam et al., 2024). These studies confirm that temperature rise is a dominant driver of wetland dynamics, reinforcing our conclusion that the spatial differentiation of alpine wetlands in western Sichuan is closely linked to warming trends. Notably, the observed patterns of post-glacial wetland expansion and increasing ecological vulnerability in these regions align with the spatiotemporal changes we identified under different emission scenarios.
4.3 Multi-model cross-validation
Using historical climate data combined with topographic data, we simulated the current distribution of wetlands in the eastern margin of the Tibetan Plateau and validated the results using wetland thematic data to evaluate the performance of Species Distribution Models (SDMs) in assessing wetland spatial distribution suitability. The results of the four SDMs simulating the current distribution of alpine wetlands in the eastern margin of the Tibetan Plateau are shown in Figure 13. The four models classified the spatial distribution of wetlands within the study area into non-suitable (No suitable), low suitability (Low), medium suitability (Medium), high suitability (High), very high suitability (Very High), and excellent suitability (Excellent) regions. Among them, the predictions of MAXENT (Figure 13B) and GARP (Figure 12C) were relatively similar, with comparable areas of non-suitable and low suitability regions. Overlay analysis of the excellent suitability regions predicted by MAXENT with actual wetland distribution yielded an α value of 91.6%, while GARP’s excellent suitability regions slightly exceeded the actual wetland distribution (α = 88.5%). In the BIOCLIM prediction results (Figure 13D), the area of excellent suitability regions was smaller than the actual wetland distribution (α = 79.5%), and the model performed poorly in predicting high-altitude regions. In contrast, the DOMAIN prediction results (Figure 13E) showed a more reasonable distribution of excellent suitability regions, but the area was larger than the actual wetland distribution (α = 76.3%). By comparing the α values of the four models’ predictions with the actual wetland distribution, it is evident that MAXENT performed the best, followed by GARP, BIOCLIM, and DOMAIN. Therefore, selecting MAXENT as the model for evaluating the suitability of alpine wetland distribution is scientifically justified.
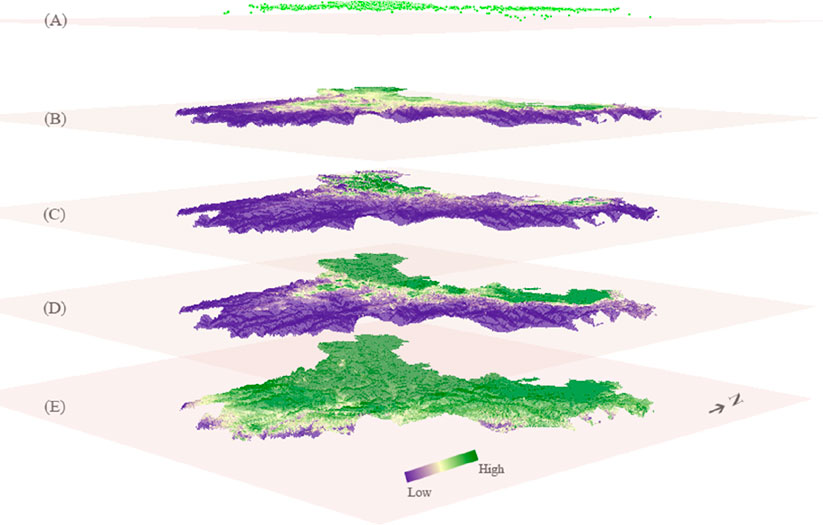
Figure 13. Cross-validation overlay maps of alpine wetland distribution suitability evaluation. ((A): Wetland samples, (B) MaxEnt, (C) BioClim, (D) GARP, (E) Domain).
5 Conclusion
This study examines the spatiotemporal changes in alpine wetlands based on multi-source remote sensing images and modeling, leveraging data processing and analytical techniques from the Google Earth Engine (GEE) platform. It systematically explores the optimization of wetland structure identification and classification methods, as well as the driving mechanisms of future wetland changes under multiple scenarios.
The findings reveal that OBIA classification accuracy improves significantly when the resolution increases from 30 m to 10 m, with the Kappa coefficient rising from 0.79 to 0.94. However, further increasing the resolution to 5 m leads to classification saturation, reduced efficiency, and fragmentation in wetland classification. This result provides important insights into selecting classification data sources and segmentation scale settings for marsh wetlands across the study area.
The spatial distribution of alpine wetlands is influenced by multiple factors, including climate, topography, hydrology, and human activities. At a 500 m scale, wetland-driving factor analysis achieves the highest ROC curve mean (AUC = 0.81), demonstrating the best explanatory power in spatial differentiation. Logistic regression analysis further indicates that wetland distribution strongly responds to key climatic variables such as local vapor pressure, temperature, and precipitation, confirming climate as the dominant driver of wetland change. Among socioeconomic factors, road networks and settlement distributions significantly impact wetland ecological structures and spatial patterns. These findings provide new insights into spatial optimization strategies for alpine wetland conservation and management.
Under future emission scenarios, wetland suitability varies across different periods. During 2021–2040, the low-emission scenario (SSP2.6) supports a larger area of highly suitable wetland distribution compared to the high-emission scenario (SSP8.5), especially in low-altitude regions in the northern study area. From 2041 to 2060, regional warming leads to a decline in “Excellent” suitability zones, with a particularly notable reduction in “Very High” suitability areas in Xinlong and Baiyu counties. Between 2061 and 2080, high-suitability zones expanded in high-altitude areas of Xinlong County and Haizi Mountain due to increased glacial meltwater supply, which enhances the extent of alpine lakes and marsh wetlands. By 2081–2100, the high-carbon emission scenario will cause further warming in the central high-altitude regions of the study area, improving overall wetland suitability.
Data availability statement
The original contributions presented in the study are included in the article/supplementary material, further inquiries can be directed to the corresponding authors.
Author contributions
JZ: Formal Analysis, Investigation, Writing – original draft, Writing – review and editing. HW: Funding acquisition, Investigation, Methodology, Software, Writing – original draft, Writing – review and editing. XK: Data curation, Methodology, Software, Writing – original draft, Writing – review and editing. OP: Conceptualization, Validation, Visualization, Writing – original draft, Writing – review and editing.
Funding
The author(s) declare that financial support was received for the research and/or publication of this article. This work was supported by the Open Fund of National Engineering Research Center of Geographic Information System (NERCGIS-202412), the Yangtze River Key Ecological Functional Area Protection Policy Research Center Project (YREPC2024-ZD001), the Key Laboratory of Digital-Intelligent Management and Ecological Decision Optimization for Liquor in the Upper Yangtze River Region Project (ZDSYS24-05), the Western Ecological Civilization Research Center Project (XBST2024-ZC005), the Agricultural Modernization and Rural Revitalization Research Center Project (AMRR2024001), the Opening Fund of the Sichuan Key Provincial Research Base of Intelligent Tourism Project (ZHZR24-03), the Rural Community Governance Research Center Project (SQZL2024A01), the Southern Sichuan Development Research Institute of the Chengdu-Chongqing Economic Circle Project (CYQCNY20242), the Social Development and Social Risk Control Research Center Project (SR24A14).
Acknowledgments
We thank Google Earth Engine for the computing platform and the Earth Science Dataset, the China Resource Satellite Application Center, and the China National Meteorological Science Data Center for providing data support, as well as the reviewers for their constructive and detailed comments.
Conflict of interest
The authors declare that the research was conducted in the absence of any commercial or financial relationships that could be construed as a potential conflict of interest.
Generative AI statement
The author(s) declare that no Generative AI was used in the creation of this manuscript.
Publisher’s note
All claims expressed in this article are solely those of the authors and do not necessarily represent those of their affiliated organizations, or those of the publisher, the editors and the reviewers. Any product that may be evaluated in this article, or claim that may be made by its manufacturer, is not guaranteed or endorsed by the publisher.
References
Alam, A., Bhat, M. S., Ahsan, S., Taloor, A. K., and Farooq, H. (2024). Earth observation satellite data–based assessment of wetland dynamics in the Kashmir Himalaya. Environ. Monit. Assess. 196 (1), 32. doi:10.1007/s10661-023-12185-7
Bello, C. M., Pissolito, C., Fernández, S. G., Campón, F. F., Fernández, M. E., Sassi, P. L., et al. (2025). Selection of ecological indicators to monitor the recovery of mountain wetlands in the Arid Andes. Restor. Ecol., e70007. doi:10.1111/rec.70007
Cao, S., Cao, G., Han, G., Wu, F., and Lan, Y. (2020). Comparison of evapotranspiration between two alpine type wetland ecosystems in Qinghai Lake Basin of Qinghai-Tibet Plateau. Ecohydrol. and Hydrobiology 20 (2), 215–229. doi:10.1016/j.ecohyd.2020.01.001
Chen, J., Wang, Y., Sun, J., Li, R., Wang, Y., Fu, Y., et al. (2023). Cost-effective priorities for prefectural biodiversity and ecosystem service conservation planning on the Qinghai-Tibet Plateau. Ecol. Indic. 156, 111122. doi:10.1016/j.ecolind.2023.111122
Chen, X., Wang, G., Li, N., Chang, R., Zhang, T., Mao, T., et al. (2024). Nitrogen dynamics of alpine swamp meadows are less responsive to climate warming than that of alpine meadows. Sci. Total Environ. 928, 172446. doi:10.1016/j.scitotenv.2024.172446
Cheng, A., Zuo, Y., Gao, C., Li, H., Wei, H., Wu, X., et al. (2024). Potentially toxic elements of lake and wetland in Northeastern Qinghai-Tibet Plateau: distribution, potential sources and risk assessment. Ecol. Indic. 166, 112427. doi:10.1016/j.ecolind.2024.112427
Dani, Y., and Ginting, M. A. (2023). Classification of predicting customer ad clicks using logistic regression and k-nearest neighbors. JOIV Int. J. Inf. Vis. 7 (1), 98–104. doi:10.30630/joiv.7.1.1017
Domic, A. I., Plata, O., and Mónica Moraes, R. (2025). Wetlands of mountain regions of Bolivia: landscapes, types, conservation, and livelihoods. Wetl. Mt. Regions Biodivers. Livelihoods Conservation, 255–276. doi:10.1002/9781394235230.ch10
Eyring, V., Collins, W. D., Gentine, P., Barnes, E. A., Barreiro, M., Beucler, T., et al. (2024). Pushing the frontiers in climate modelling and analysis with machine learning. Nat. Clim. Change 14 (9), 916–928. doi:10.1038/s41558-024-02095-y
Goyal, M. K., Rakkasagi, S., Shaga, S., Zhang, T. C., Surampalli, R. Y., and Dubey, S. (2023). Spatiotemporal-based automated inundation mapping of Ramsar wetlands using Google Earth Engine. Sci. Rep. 13 (17324), 17324–17413. doi:10.1038/s41598-023-43910-4
Hardouin, L., Decharme, B., Colin, J., and Delire, C. (2024). Climate-driven projections of future global wetlands extent. Earth's Future 12 (9), e2024EF004553. doi:10.1029/2024EF004553
Huang, J., and Ling, C. X. (2005). Using AUC and accuracy in evaluating learning algorithms. IEEE Trans. Knowl. Data Eng. 17 (3), 299–310. doi:10.1109/tkde.2005.50
Huang, N., Ge, R., Ma, C., and Liu, P. (2024). Evidence of degradation and disappearance of Ramsar Wetland No. 1148 (Chinese Relict Gull Nature Reserve) due to anthropogenic disturbance and climate change on the ORDOS Plateau for nearly half a century. Ecol. Indic. 158, 111418. doi:10.1016/j.ecolind.2023.111418
Jane, E., Steven, J., Phillips, S. J., Hastie, T., Dudík, M., Chee, Y. E., et al. (2010). A statistical explanation of MaxEnt for ecologists. Divers. Distrib. 17, 43–57. doi:10.1111/j.1472-4642.2010.00725.x
Li, Y., Zhou, Y., Liu, F., Liu, X., and Wang, Q. (2022). Diversity patterns of wetland angiosperms in the Qinghai-Tibet Plateau, China. Diversity 14 (10), 777. doi:10.3390/d14100777
Liu, F., Wu, H., Zhao, Y., Li, D., Yang, J. L., Song, X., et al. (2022). Mapping high resolution national soil information grids of China. Sci. Bull. 67 (3), 328–340. doi:10.1016/j.scib.2021.10.013
Liu, Y., and Zhao, M. (2024). Coupling coordination between carbon storage protection in alpine wetlands and SDGs: a case study of the Qinghai-Tibet Plateau, China. J. Clean. Prod. 483, 144260. doi:10.1016/j.jclepro.2024.144260
Manzoor, M., Ahmad, M., Gillani, S. W., Shaheen, H., Waheed, M., Sultana, S., et al. (2024). Assessment of long-term climate change impact on alpine vegetation of Western Himalaya, in Environment, climate, plant and vegetation growth (Cham: Springer Nature Switzerland), 523–542. doi:10.1007/978-3-031-69417-2_18
Maurischat, P., Seidel, M., Dittmar, T., and Guggenberger, G. (2023). Complex dissolved organic matter (DOM) on the roof of the world–Tibetan DOM molecular characteristics indicate sources, land use effects, and processing along the fluvial–limnic continuum. Biogeosciences 20 (14), 3011–3026. doi:10.5194/bg-20-3011-2023
Merow, C., Smith, M. J., and Silander, J. A. (2013). A practical guide to MaxEnt for modeling species’ distributions: what it does, and why inputs and settings matter. Ecography 36, 1058–1069. doi:10.1111/j.1600-0587.2013.07872.x
Muschelli, I. I. I. J. (2020). ROC and AUC with a binary predictor: a potentially misleading metric. J. Classif. 37 (3), 696–708. doi:10.1007/s00357-019-09345-1
Quintana, R. D., Abraham, E., Arzamendia, Y., Epele, L., Rubio, C., Baldo, J. L., et al. (2025). Mountain wetlands of Argentina. Wetl. Mt. Regions Biodivers. Livelihoods Conservation, 277–312. doi:10.1002/9781394235230.ch11
Song, C., Liu, S., Wang, G., Zhang, L., Rosentreter, J. A., Zhao, G., et al. (2024). Inland water greenhouse gas emissions offset the terrestrial carbon sink in the northern cryosphere. Sci. Adv. 10 (39), eadp0024. doi:10.1126/sciadv.adp0024
Vento, B., Rivera, J., and Ontivero, M. (2024). Climate influence on future suitability of high-altitude wetlands in two natural protected areas from the Central Andes of Argentina. Perspect. Ecol. Conservation 22, 240–249. doi:10.1016/j.pecon.2024.04.006
Wang, H., Kong, X., Luo, J., Li, P., Xie, T., Yi, X., et al. (2022). A novel approach for monitoring the eco-environment of alpine wetlands using big geospatial data and cloud computing. Adv. Meteorology 2022, 1–20. doi:10.1155/2022/7451173
Wang, H., Kong, X., Phewnil, O., Luo, J., Li, P., Chen, X., et al. (2024). Spatiotemporal prediction of alpine wetlands under multi-climate scenarios in the west of Sichuan, China. PeerJ 12, e18586. doi:10.7717/peerj.18586
Wang, H., Peng, P., Kong, X., Zhang, T., and Yi, G. (2019). Evaluating the suitability of urban expansion based on the logic minimum cumulative resistance model: a case study from leshan, China. ISPRS Int. J. Geo-Information 8 (7), 291. doi:10.3390/ijgi8070291
Wang, H., Peng, P., Kong, X., Zhang, T., and Yi, G. (2020). Vegetation dynamic analysis based on multi-source remote sensing data in the east margin of the Qinghai-Tibet Plateau, China. Peer J. 7e 8223, 1–20. doi:10.7717/peerj.8223/supp-2
Wang, Q., Liu, M., Wang, M., Yang, C., and Miao, L. (2024). Analysis of soil carbon, nitrogen and phosphorus storage and sequestration effects in alpine Grassland with different degradation levels in Maqu county, China. Eurasian Soil Sci. 57, 794–805. doi:10.1134/S1064229323602846
Wen, X., Shao, H., Wang, Y., Lv, L., Xian, W., Shao, Q., et al. (2023). Assessment of the spatiotemporal impact of water conservation on the Qinghai–Tibet Plateau. Remote Sens. 15 (12), 3175. doi:10.3390/rs15123175
Xu, R., Wang, Z., and Zhu, J. (2023). Effects of climate change and nitrogen addition on carbon loss in alpine wetland of Qinghai–Tibet plateau. Atmosphere 14 (9), 1342. doi:10.3390/atmos14091342
Zeng, J., Zhou, T., Xu, Y., Lin, Q., Tan, E., Zhang, Y., et al. (2023). The fusion of multiple scale data indicates that the carbon sink function of the Qinghai-Tibet Plateau is substantial. Carbon Balance Manag. 18 (1), 19. doi:10.1186/s13021-023-00239-9
Zhang, Z., Zhao, C. Z., Bai, X., Li, Q., and Ma, M. (2023). Examining soil organic carbon in the mountainous peat swamps of the Zoigê Plateau in China's Qinghai-Tibet Plateau. Soil Use Manag. 39 (2), 757–770. doi:10.1111/sum.12895
Zhao, M., Zhang, G., Han, X., Zhou, T., Xu, F., and Tang, C. (2024). Spatial and temporal changes of wetlands on the Tibetan Plateau between 1990 and 2020. IEEE J. Sel. Top. Appl. Earth Observations Remote Sens. 18, 769–784. doi:10.1109/jstars.2024.3495709
Zhao, Y., Su, C., He, B., Nie, R., Wang, Y., Ma, J., et al. (2023). Dispersal from the Qinghai-Tibet plateau by a high-altitude butterfly is associated with rapid expansion and reorganization of its genome. Nat. Commun. 14 (8190), 8190–8213. doi:10.1038/s41467-023-44023-2
Keywords: Qinghai-Tibet Plateau, alpine wetlands, change mechanisms, remote sensing cloud computing, Earth science dataset
Citation: Zhang J, Wang H, Kong X and Phewnil O (2025) The spatial differentiation of alpine wetlands on the eastern Tibetan Plateau using multi-source remote sensing images. Front. Remote Sens. 6:1577555. doi: 10.3389/frsen.2025.1577555
Received: 16 February 2025; Accepted: 10 April 2025;
Published: 01 May 2025.
Edited by:
Nuno Fachada, Lusofona University, PortugalReviewed by:
Zanpin Xing, Chinese Academy of Sciences (CAS), ChinaLei Yu, Nanjing Hydraulic Research Institute, China
Copyright © 2025 Zhang, Wang, Kong and Phewnil. This is an open-access article distributed under the terms of the Creative Commons Attribution License (CC BY). The use, distribution or reproduction in other forums is permitted, provided the original author(s) and the copyright owner(s) are credited and that the original publication in this journal is cited, in accordance with accepted academic practice. No use, distribution or reproduction is permitted which does not comply with these terms.
*Correspondence: Haijun Wang, d2FuZ2hhaWp1bkBzdXNlLmVkdS5jbg==; Xiangdong Kong, a29uZ3hpYW5nZG9uZ0BzdXNlLmVkdS5jbg==
†ORCID: Haijun Wang, orcid.org/0000-0001-9999-2430; Xiangdong Kong, orcid.org/0000-0003-3585-9897