 W. Brad Baxter1*
 Zachary Hoppinen2
 Kristofer Lasko3
 Tate Meehan2David Brodylo1Taylor D. Sullivan1Amanda J. Barker1Thomas A. Douglas1
- 1U. S. Army Cold Regions Research and Engineering Laboratory (CRREL), Alaska Research Office, Fort Wainwright, AK, United States
- 2U. S. Army CRREL Remote Sensing and Geographic Information Systems Center of Expertise, Hanover, NH, United States
- 3U. S. Army Geospatial Research Laboratory, Engineer Research and Development Center, Alexandria, VA, United States
Spatiotemporal patterns in soil moisture play a critical role in the near-surface energy balance in permafrost regions, yet soil moisture detection in periglacial environments is complicated by highly heterogeneous terrain conditions. We integrate ground-based and spaceborne microwave methods to investigate patterns and controls on surface soil moisture (SSM) in boreal and arctic permafrost environments of Alaska. Soil sampling, geophysics, and probing revealed heterogeneous SSM with significant fine-scale (1 m) variability by topographic setting (p < 0.001) and pedological characteristics (p = 0.01) in arctic tundra, and by land cover type (p < 0.001) in low-relief boreal forest. SSM spatial autocorrelation was greatest below 20 m thresholds demonstrating the adequate spatial resolution for capturing natural SSM heterogeneity at these sites. SMAP L-band was tested for coarse (9 km) soil moisture detection in boreal forest but demonstrated low representativeness from limited ground-based measurements. Finer resolution (∼20 m) relative SSM derived from Sentinel-1 C-band time series in arctic tundra more closely represents the noted SSM autocorrelation length and is explored for visualizing SSM landscape variability. Satellite detection biases created by high-profile tussocks and thick organic soil horizons identified with probe-SSM reveal the need for site-specific soil information in satellite-SSM interpretations. Lastly, time-series of C-band backscatter distributions in boreal forest demonstrated potential for tracking soil thaw onset beneath residual spring snowpack. These results illustrate the complexity of SSM monitoring in periglacial environments and the potential for C-band backscatter and L-band SMAP for large-scale tracking of SSM in these environments.
1 Introduction
In permafrost-affected regions the spatiotemporal variability in soil freeze-thaw and moisture content are important influences on the surface energy balance and thermal conductivity of seasonally thawed “active layer” soils (Jorgenson et al., 2010; Liljedahl et al., 2011; Zwieback et al., 2019) and mosses (Yoshikawa et al., 2004). The extent of downward thaw propagation is mediated each year by thaw season duration (Jorgenson et al., 2010), surface water content (Shiklomanov et al., 2010), and soil moisture content (Bonan, 1989), together impacting active layer thickness (Hinkel and Nelson, 2003; Jorgenson et al., 2010; Shiklomanov et al., 2010) and permafrost degradation (Jorgenson et al., 2020). In addition to thermal conditions, soil moisture content can critically impact biogeochemical cycling by influencing microbial activity (Barros et al., 1995; Holden et al., 2015; Borowik and Wyszkowska, 2016; Bian et al., 2022) and soil redoximorphic conditions (Zhang and Furman, 2021), with relevance for soil carbon respiration (Cook and Orchard, 2008) and chemical weathering (Barker et al., 2014; Barker et al., 2023) in permafrost environments.
Soil moisture distribution is a complex function of multiple landscape and pedophysical properties, biological influences, and weather conditions, that each vary in character by location (Moran et al., 2004; Barrett and Petropoulos, 2013). Due to the heterogeneous terrain conditions that abound in periglacial environments (i.e., cryoturbation, tussocks, patterned ground, catenary shifts; Siewert et al., 2021), soil moisture conditions can vary considerably with scale (i.e., micro and macro-scale heterogeneity) and timing (i.e., weather events; freeze-thaw stage) (French, 2017; Siewert et al., 2021). Assessments of spatiotemporal controls on soil moisture in these regions therefore require spatially encompassing, and sometimes multi-scale, approaches for capturing natural variability across terrain features and seasons. Remote detection approaches for mapping surface soil moisture (SSM) are regularly applied, deriving SSM from spaceborne microwave C (∼5.55 GHz) and L (∼1.4 GHz) -band Synthetic Aperture Radar (SAR) based on backscatter coefficients (e.g., Pulliainen et al., 2004; Barrett et al., 2009), inversion techniques (e.g., Dubois et al., 1995), interferometric approaches (e.g., De Zan et al., 2013), and fusion with in situ data (Huang et al., 2020).
Multiple overlapping land surface factors influence radar backscatter intensity including the ground surface roughness, local incidence angle, and interactions with vegetation canopy. However, backscatter changes related to volumetric soil moisture can create a particularly strong signal discernible from other scattering sources (Zakharov et al., 2020). Given the contrast in dielectric properties of liquid water (ɛ ∼ 80) and dry soil (ɛ ∼ 6), methods for estimating SSM from radar backscatter rely on the high attenuation of microwaves by liquid water to retrieve volumetric soil moisture (Barrett et al., 2009). Multiple retrieval algorithms for SAR-soil moisture have been proposed and are commonly used for moisture mapping in agricultural applications (e.g., Balenzano et al., 2010; Vreugdenhil et al., 2022) and wildfire post-burn soils (e.g., Bourgeau-Chavez et al., 2007). However, many of these retrieval approaches assume relatively static contributions to backscatter by plant volume scattering, making applications less suited for the typical phenology of plant species that characterize permafrost ecosystems. Short temporal change detection techniques can filter noise from vegetation scattering and remove the effects of surface roughness to optimize SSM retrievals (Punithraj et al., 2020; Zakharov et al., 2020), offering particular advantages for applications in densely vegetated permafrost environments. Other microwave applications in permafrost regions involve interferometric SAR (InSAR) interferogram differencing for change detection applications (Kääb, 2008; Liu et al., 2012; 2014; Schaefer et al., 2015; Parsekian et al., 2021) but these applications must consider depth-distributed water content throughout the active layer to optimize outputs. Multiple studies have addressed methodologies for modeling or quantifying soil moisture throughout the active layer, including integration of ground penetrating radar (GPR, Parsekian et al., 2021), pedotransfer functions (Bakian-Dogaheh et al., 2022), and soil physics models (De Zan et al., 2013). However, complete description of soil moisture characteristics throughout the active layer is outside of the scope of the present study.
In order to identify the spatiotemporal controls on SSM in densely vegetated permafrost regions, we combined field measurements with a Sentinel-1 C-band time-series approach to isolate backscatter distributions related to soil moisture in permafrost environments of Alaska. These results were assessed alongside coarser-scale (9 km) observations from the Soil Moisture Active Passive (SMAP) L-band sensor to provide a multi-scale perspective on SSM characterization in boreal forest and arctic tundra permafrost environments. The character of SSM at the sub-pixel scale was first investigated using a suite of field-based measurements integrating soil sampling, in situ measurements of surficial organic horizon (upper 6 cm) and composite organic-mineral soil material (upper 20 cm) volumetric water content (VWC) with handheld transmission line oscillation (TLO) probes, continual measurements of permittivity with buried multi-frequency time-domain reflectometry (TDR) sensors, and geophysical velocity profiling with GPR. The composition of ground-based measurements revealed crucial insights to SSM relationships with soil and substrate heterogeneity. We synthesized the ground-based and spaceborne detections to discuss controls on SSM at varying spatial scales in study locations of the boreal forest and arctic tundra biomes and used ground-based measurements to discuss potential SSM detection biases related to soil heterogeneity and material-specific moisture conditions. Ground-based results were used to inform Moran’s Index (I) (Moran, 1950) in quantifiably assessing spatial autocorrelation of SSM at each site to identify important scales that spatial controls operate. In assessing spatial variability in SSM we specifically aimed to address: (1) the importance of topography and biotic controls on SSM in boreal forest and tundra permafrost environments; (2) spatial autocorrelation in SSM and the optimal resolution for detecting natural SSM spatial variability in the study environments; (3) the sensitivity of remote sensing detections to different land features and soil stratigraphic units; and (4) temporal controls on SSM specific to permafrost affected soil profiles in the study areas.
2 Materials and methods
2.1 Study location and meteorological data
Ground validation sites were selected at Imnavait Creek in the Arctic Foothills of the central Brooks Range in northern Alaska to represent arctic tundra of the continuous permafrost region (Jorgenson et al., 2008), and above the U.S. Army Cold Regions Research and Engineering Laboratory Permafrost Tunnel near Fox, Alaska to represent boreal forest of the discontinuous permafrost region (Jorgenson et al., 2008). Areas of interest (AOIs) are displayed in Figure 1 and were designated at each site to focus ground-based collection efforts on capturing anticipated soil moisture heterogeneity related to differences in vegetation cover or topographic setting. Each AOI was instrumented with a local meteorological ClimaVUE monitoring station (Campbell Scientific, Logan, Utah) and SoilVUE soil temperature and permittivity logging station (Campbell Scientific).
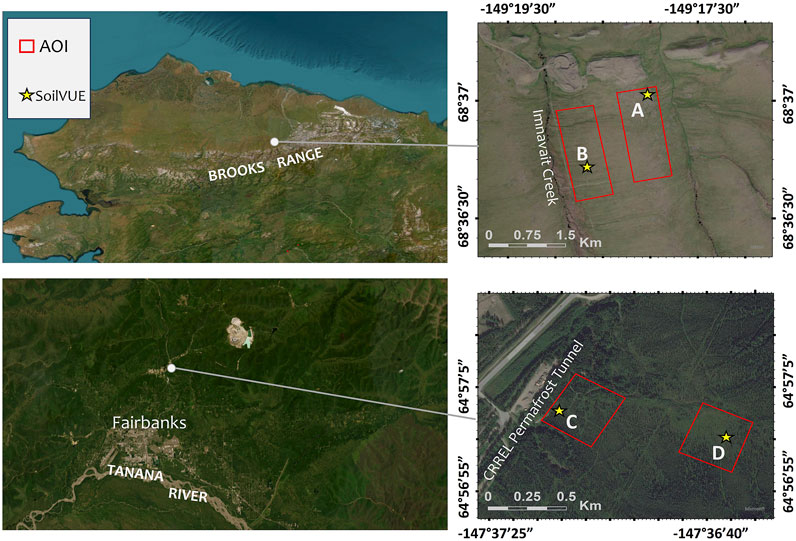
Figure 1. Map of the study locations showing the AOls of lmnavait ridgeline (A) and slope (B) the Permafrost Tunnel black spruce forest (C) and tussock flats (D).
Instrumentation at Imnavait Creek was positioned at a well-drained location on the ridgeline of the moraine/drift material embracing Imnavait Creek (A in Figure 1 at 149.3003514°W, 68.6169978°N), contrasting a second site situated in the poorly drained soils of the mid-slope region of this feature (B in Figure 1 at 149.3112691°W, 68.6118197°N). Although the valley bottom may serve as the optimal endmember in contrast to the ridgeline, the slope region was preferred to avoid inducing soil degradation in the waterlogged lowland soils and prevent artefact SSM. Local meteorological data for the 2024 thaw season was collected at each of the Imnavait Creek AOIs with the ClimaVUEs while longer term (9/2022 to 10/2023) precipitation and air temperature data were accessed from the University of Alaska Fairbanks Environmental Data Center (2024). The AOIs at Imnavait produce soil profiles that resemble USDA classified soils nearby: (i) the Arctic Foothills-Arctic Lowland Floodplains producing ∼20 cm of mucky peat above sandy loam in the lowland positions; and (ii) -Arctic Upland Glaciated Hills and Plains associated with ∼20 cm of partially decayed organic material overriding silt loam that grades to gravelly loam (Soil Survey Staff, 2024) on the sloping moraine feature.
Instrumentation at the Permafrost Tunnel were located in closed canopy black spruce forest (C in Figure 1 at 147.6196870°W, 64.9507707°N) and open canopy spruce woodland grading to tussock clearing (D in Figure 1 at 147.6100398°W, 64.9500277°N) to represent endmember soil moisture environments for low-relief boreal forest. Soils in the Permafrost Tunnel AOIs are grouped into the USDA classifications of Saulich Peat producing ∼40–50 cm of moss peat in contact with silt loam, and the Minto-Chatanika Complex featuring ∼40 cm of partially decayed organic material (O horizon) atop silt loam.
2.2 Soil moisture probes
We applied numerous soil permittivity sensors including handheld TLO HydroSense II (Campbell Scientific) and Stevens HydraGO (Stevens Water, Portland, Oregon) probes, and buried TDR SoilVUE and ECH2O (Decagon Devices, Inc.) probes to determine soil VWC. Amidst the primary soil constituents of organic material, inorganic material, air, and water, the liquid water dominates short-term variance in the dielectric permittivity of a soil. Therefore, time-domain electromagnetic measurements allow for estimation of VWC based on the travel time of a transmitted electrical signal over a known distance constrained by waveguides. Travel time and distance are described in terms of the wave period (τ) and wave guide length (L). These parameters physically relate to relative dielectric permittivity (
Here,
TLO probes were used between 6 June and 18 July 2024, to investigate sub- and intra-pixel spatial variability of SSM at ∼ 1 m collection intervals. Soil water content was measured for the upper 20 cm of soil at both the boreal forest and tundra sites with the HydroSense II, and for the upper 6 cm of soil at the arctic tundra site with the HydraGO. Probes were inserted vertically into the ground surface to calculate bulk VWC for the respective sensitive volume of each instrument, with special care taken to avoid compression of the ground surface and distortion of the natural substrate volume. The HydraGO VWC is derived from a bulk soil volume of 50–75 cm3 while the HydroSense II measures an approximately 180 cm3 zone. Positioning information was obtained by built-in GPS for each system, with accuracy of ± 1–5 m for the HydroSense II, and ± 2 m for the HydraGO. Each probe measurement was recorded alongside observations of the probed medium (e.g., tussock, moss, sedge-covered topsoil, etc.) and catchment position including riparian, valley bottom, toe slope, slope, slope shoulder, and ridgeline at Imnavait Creek. Collection points were organized within 100 × 100 m grids, with measurements collected at every meter along the grid boundaries and along three bisecting lines: 2 at the quarter points and 1 at the midpoint of the grid boundary lines (Supplemental Figure 1). Sampling locations were marked in the field using GPS and ground measurements before data collections were performed. Soil excavation revealed that in most cases, the 6 cm probe (HydraGO) terminated in moss or organic soil while the 20 cm probe (HydroSense II) incorporated some range of mineral soil with the overlying organic horizon. The most common exceptions were thin organic layers where the 6 cm probe encountered mineral soil, such as along the ridgeline at Imnavait Creek.
TDR-based measurements from the SoilVUE sensors were coded to continuously measure soil VWC at defined depth intervals extending throughout the active layer. For improved probe-moss contact in the low-density feathermoss substrate above the Permafrost Tunnel, ECH2O probes were installed, and the output mV were calibrated with the function developed in Overduin et al. (2005). Measurements in shallow soils were corrected for temperature influence on permittivity which showed negligible influence from temperature on the measured VWC values. An analysis of variance (ANOVA) was performed to evaluate the significance of variance in measured VWC between different landscape settings (slope and catchment regions), land cover types (i.e., spruce forest versus tussock clearing), and substrate types (i.e., moss versus tussock).
2.3 Ground penetrating radar
Geophysical investigations of near-surface permittivity were performed with GPR common midpoint (CMP) surveys at a 5–10 m spatial scale. GPR CMP surveys measure the travel times of electromagnetic wave pulses as a function of raypath length to estimate the wave propagation speed within a medium. This wave velocity measured in the CMP survey geometry allows for evaluation of bulk permittivity properties in the near surface. We performed these surveys using two shielded, 900 MHz antennas with a SIR4000 control unit (GSSI; Geophysical Survey Systems Inc., Nashua, NH). Instrument settings were tuned to 180 ns scan length with 2048 samples per scan to optimize temporal resolution of the radar traces. The incremental scan positions of CMP gathers permit multiple pathways for a radar pulse to travel between the antenna and a reflection point allowing for velocity stacking that is observable as coherence in semblance diagrams (Neal, 2004). Semblance diagrams were used to pick regions of high coherence to generate a stacking velocity profile for the survey locations. Stacking velocity profiles were then converted to interval velocities using Dix (1955) inversion. Soil interval velocities obtained from this method were checked against tabulated velocities for the observed soil media in the scan points to ensure accurate picking was performed. The soil material velocities, as a function of dielectric permittivity, were used to calculate soil VWC with the polynomial function of Engstrom et al. (2005) to enable comparison with TLO probes.
2.4 Soil sampling and seasonal thaw depth
Soil samples were mainly exhumed to inform interpretations of the geophysical data, while samples of various material types were collected in known volumes and processed for VWC via gravimetric methods. Samples were excavated with a shovel or AMS corer (Art’s Manufacturing and Supply Inc., American Falls, Idaho) and texture classes were determined on mineral samples by hydrometer. Soils at each field site were classified into material types including: (1) moss (both live and undecayed dead fascicles and capitulum); organic soil consisting of (2) unsaturated, undecayed organic material (fibric) including undecayed, non-moss materials, or (3) unsaturated, partially decayed organic material (including both hemic and sapric organic material) containing identifiable plant materials in addition to decomposed material of no longer identifiable source taxa, or (4) peat, defined here as saturated, dead organic material ranging from fibric to sapric; (5) mineral soils consisting of organic-rich loam, loam, or gravelly loam at the tundra site (for soil material definitions, see Soil Survey Staff, 2024). Organic soils were typically in direct contact with underlying mineral soil at both sites. In some instances, coarse surficial organic material graded to mucky peat at the tundra site. Other substrate samples consisted of fibric tussock peat or organic-rich mineral soil under deciduous land cover in the boreal forest site. Soil stratigraphy results gathered from soil sampling are displayed in Supplemental Tables 1, 2.
Seasonal thaw depth was monitored continually at each site with SoilVUE temperature sensors at 10 cm vertical spacing (reported instrument accuracy of ±0.15°C). Higher spatial density measurements were collected manually with a steel thaw probe marked with gradations at regular depth intervals. The thaw probe was manually inserted through thawed material until hitting firm refusal, then the corresponding depth from ground surface to refusal was noted as the thaw depth for the time of survey. Special attention to probe sound and resistance were used to determine whether refusal was caused by frost, or by rigid features such as rock or gravel above the frost table. Where possible, these interpretations were optimized by soil stratigraphy information gathered with the AMS soil corer.
2.5 Spatial autocorrelation analysis
Spatial autocorrelation of SSM was characterized with the global Moran’s index (I) (Moran, 1950) at each site to illustrate the scales that local controls on SSM operate in each location, and therefore suggest important detection resolution for characterization of SSM natural variability in the study environments. Global Moran’s I was performed on the TLO probe results in ArcGIS software (Esri, 2024) to evaluate spatial clustering or grouping of SSM versus random variability in a multidirectional context. An automated weighting matrix was applied to weigh the correlation of respective data points based on a distance threshold ranging from 2.5 m to 75 m at increments of 2.5 m to determine the importance of scale in spatial clustering at each site. Results are normalized so that I > 0 represents positive spatial autocorrelation or greater clustering of SSM while values closer to 0 represent randomness or no spatial autocorrelation. The Moran’s I coefficient at each distance threshold is defined in Equation 2:
where zi is deviation of an attribute for feature i from its mean
In instances where immediately adjacent collection points produced overlapping coordinates (within the inherent precision range of the integrated GPS), averaging was performed to reduce erroneous extreme outputs from the Moran’s analysis.
2.6 C-band SAR soil moisture estimation
To estimate SSM for the study locations, C-band SAR imagery from Sentinel-1 (European Space Agency, 2024) was acquired for all observation dates (12-day revisit interval) spanning January to August 2024 for Imnavait Creek and the Permafrost Tunnel. Radiometrically terrain corrected (RTC) 20-meter resolution images were downloaded from the Alaska Satellite Facility’s HyP3 pipeline (Hogenson et al., 2020). HyP3 preprocessing included a sigma naught calibration, speckle filtering, and orthorectification.
A relative SSM estimation was performed following Zakharov et al. (2020) using Equation 4:
where θ is the reference incidence angle (40°), t is time, σ0(θ,t) is the backscatter coefficient at the angle θ and time t,
Since varying incidence angles affect the backscatter values of SAR images all pixels were normalized to 40° incidence angle backscatter values using Equation 5:
where the
with a, b, c values taken from Zakharov et al. (2020) of -0.01541, -0.00133, 0.03643.
The driest conditions were determined using the Sentinel-1 acquisition with the lowest backscattered values while the wettest conditions were based on the scene with the highest backscatter values on a pixel-basis throughout the AOI.
The sensitivity of backscatter to soil moisture (S(θ) in Equation 7) was determined by subtracting the backscatter values at the wettest time (SSM = 1.0) from the driest time (SSM = 0.0) period to determine the change in backscatter from completely saturated to completely dry soil.
Sensitivity S spatial distribution at Imnavait Creek is provided in Figure 2 and represents the local backscatter dynamic range of 3–20.5 decibels. S depends generally on surface roughness and vegetation (Zakharov et al., 2020) and was lowest at our site along roadbeds, densely vegetated riparian zones, and steep slopes. The representative tundra soil surface, the topic of study here, demonstrated relatively high S across the study site.
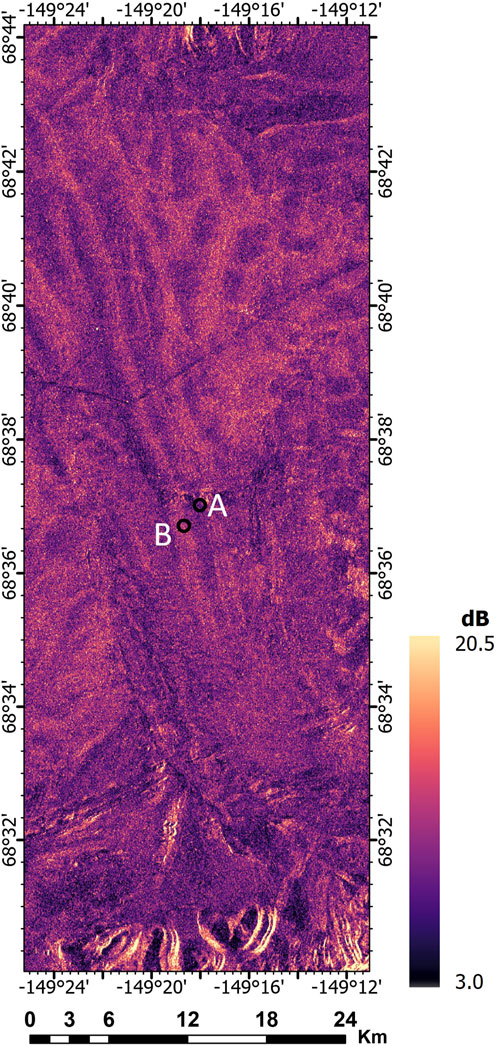
Figure 2. Sensitivity (S) of Sentinel-1 backscatter coefficient to soil moisture spatial variations [dB] at the Imnavait Creek site. Locations of SoilVUE and ClimaVUE stations for the ridge and slope sites are marked by points A and B, respectively.
The relative SSM content ranges from digital numbers of 0 = completely dry soil, to 1 = completely saturated soil. Zakharov et al. (2020) noted that backscatter associated with water bodies artificially expanded the index, however, large water bodies were absent at our field sites and surface water features were below detection resolution. Meteorological and TDR soil moisture data were acquired from the Toolik Field Station and the ClimaVUE/SoilVUE stations for comparison with satellite SSM estimations. Landsat-derived NDVI images were used to indicate changes in vegetation volume throughout the observation period.
2.7 L-band SAR soil moisture estimation
The Soil Moisture Active Passive (SMAP) instrument launched in 2015 contains a passive radiometer for monitoring soil moisture twice daily at 0600 and 1800 local solar time (reported as morning and afternoon observations). The radiometer instrument has a 1.41 GHz frequency with HV polarization operating at 9 km enhanced spatial resolution and a relative accuracy of 1.3 km. SMAP’s measurements are typically sensitive to the upper ∼5 cm surface layer of soil, with measurements recorded for only thawed and non-water covered pixels. Specifically, the SPL3SMP_E collection 5 dataset was used for dates on or before October 2023, while the collection 6 dataset was used for proceeding dates due to availability (O’Neill et al., 2018). The morning and afternoon retrieved soil moisture estimates were separately collected in volume fraction units. They are provided at 9 km resolution. The retrieval quality flag indicated acceptable or unacceptable data quality (i.e., frozen state). The data were acquired and processed corresponding to our 2023 and 2024 volumetric soil moisture field measurements for the aforementioned study sites. The SMAP data were analyzed in Google Earth Engine.
3 Results and discussion
3.1 Sub-pixel controls on SSM from in situ measurements
TLO data collected at approximately 1 m resolution revealed variance of 6.8% VWC for the upper 20 cm of soil across land cover types in the boreal forest site. Surface VWC were statistically different under dense (p < 0.001) and sparse (p < 0.001) spruce canopies relative to tussock clearings which likely reflects the importance of canopy coverage for blocking solar irradiance or may be a factor of species-specific evapotranspiration between the vegetation types (Bonan, 1989). Although differences in mean VWC were statistically different across all land cover types (p < 0.001, Table 1), mean VWC varied modestly, from 9.4% (standard deviation 0.8%) in the closed black spruce to 8.6% and 8.9% under sparse or absent canopies of woodlands or tussock meadows, respectively. The subtlety may stem from substrate specific VWC and nearly continuous Sphagnum and feather moss coverage across the vegetation types. Substrate comparisons demonstrated a mean VWC of 9.6% ± 0.8% [± standard error (StdE), n = 19] for the peat-composition of tussocks that deviated insignificantly (p = 0.1) from that of moss substrate 10.61% ± 0.3% (n = 380). However, moss VWC were associated with high standard deviation (6.2%) relative to tussocks (3.5%). This surface inhomogeneity of moss is likely compounded by the prominence of Sphagnum in the study area, as its morphological and cellular structure lead to greater water retention at the top of the plant, creating anisotropy (Yoshikawa et al., 2004). Disturbance that exposed mineral soil at the ground surface produced the highest VWC of all substrate types, with mineral soil in disturbed meadows and thermokarst features producing mean VWC of 30.7% ± 9.8% (StdE) and 33.8% ± 12%, respectively.

Table 1. Statistical results of VWC measured with handheld TLO probes including means and standard deviations listed according to landscape setting and substrate type for Imnavait Creek (top) and land cover type and substrate type for the Permafrost Tunnel (middle). Selected ANOVA results are displayed for each site (bottom).
At the arctic tundra site, surface VWC measured manually throughout the catchment varied significantly by topographic setting (p < 0.001), as mean VWC generally decreased with increasing elevation and distance from Imnavait Creek. Both the HydroSense and HydraGO probes reported the highest values for the riparian soils, where the effects of soil waterlogging are noticeable in a primary ground cover shift from Sphagnum to Eriophorum. Variance in measured VWC of the upper 20 cm was highest in this region of the valley bottom (standard deviation 15.1%, n = 134), where micro-scale differences in substrate covaried with water content. Topographically low-lying polygonal ground associated with ice wedges exhibited the highest mean VWC of 78.3% ± 2.6% (StdE) for the upper 6 cm and 65% ± 2.2% for 20 cm where massive ground ice appeared to be degrading. A gradient in VWC variance from toe slope (standard deviation 15.5%, n = 88) to slope shoulder (standard deviation 9.8%, n = 437) of the east catchment flank likely relates to topographical effects on soil drainage such as the depth to coarse soils with increased hydraulic conductivity. This is supported by an inverse relationship between the depth to gravel-bearing soil units versus elevation in the catchment noted from soil sampling and AMS coring, which likely promotes greater soil drainage (Saxton et al., 1986) in the slope region. The importance of topography on soil moisture in tundra environments has been noted elsewhere (Aalto et al., 2013) but can be site-specific, as shown in spatial comparisons across Northern Europe (Kemppinen et al., 2023). Unlike the boreal forest site, VWC of moss substrate varied significantly from that of tussocks at 2% significance in the tundra study site, which creates microscale VWC heterogeneity superimposed on topography-forced variability.
Soil velocities obtained from CMP surveys were translated to VWC and are primarily addressed in relevance to surface soils here, since the permittivity-VWC model transformation relies on a calibration that encompasses organic horizons and underlying mineral soil (Engstrom et al., 2005). The CMP-derived VWC demonstrates considerable variability at the 5–10 m spatial resolution across the Imnavait slope region in conjunction with a highly heterogeneous soil profile (Figure 3 and Supplemental Table 2). Surface VWC (upper 10 cm) at the 5–10 m scale demonstrated a standard deviation of 6% from a calculated mean of 17% ± 1.3% (StdE), with a standard deviation of 5.8% (mean = 16.1% ± 1.2%) in the upper 20 cm, contrasting the standard deviation of 13.65% and 29.1% mean noted at the 1 m scale with the HydroSense II. The higher VWC deviation detected with the finer sampling resolution suggests characterization of surface VWC at lower resolution captures less of the natural variability present in the tundra and in this instance resulted in a potential under-realization of SSM heterogeneity. Saturated conditions of the valley bottom led to GPR signal attenuation and reduced confidence in picking stratigraphic contacts for this region (CMP 51–53), however the average ground velocity of ∼0.08 m ns-1 is typical for waterlogged peat conditions, or proved faster where silt inclusions were noted (CMP 50). The relationships between SSM spatial variance and scale are explored further with spatial autocorrelation analysis in Section 3.3.
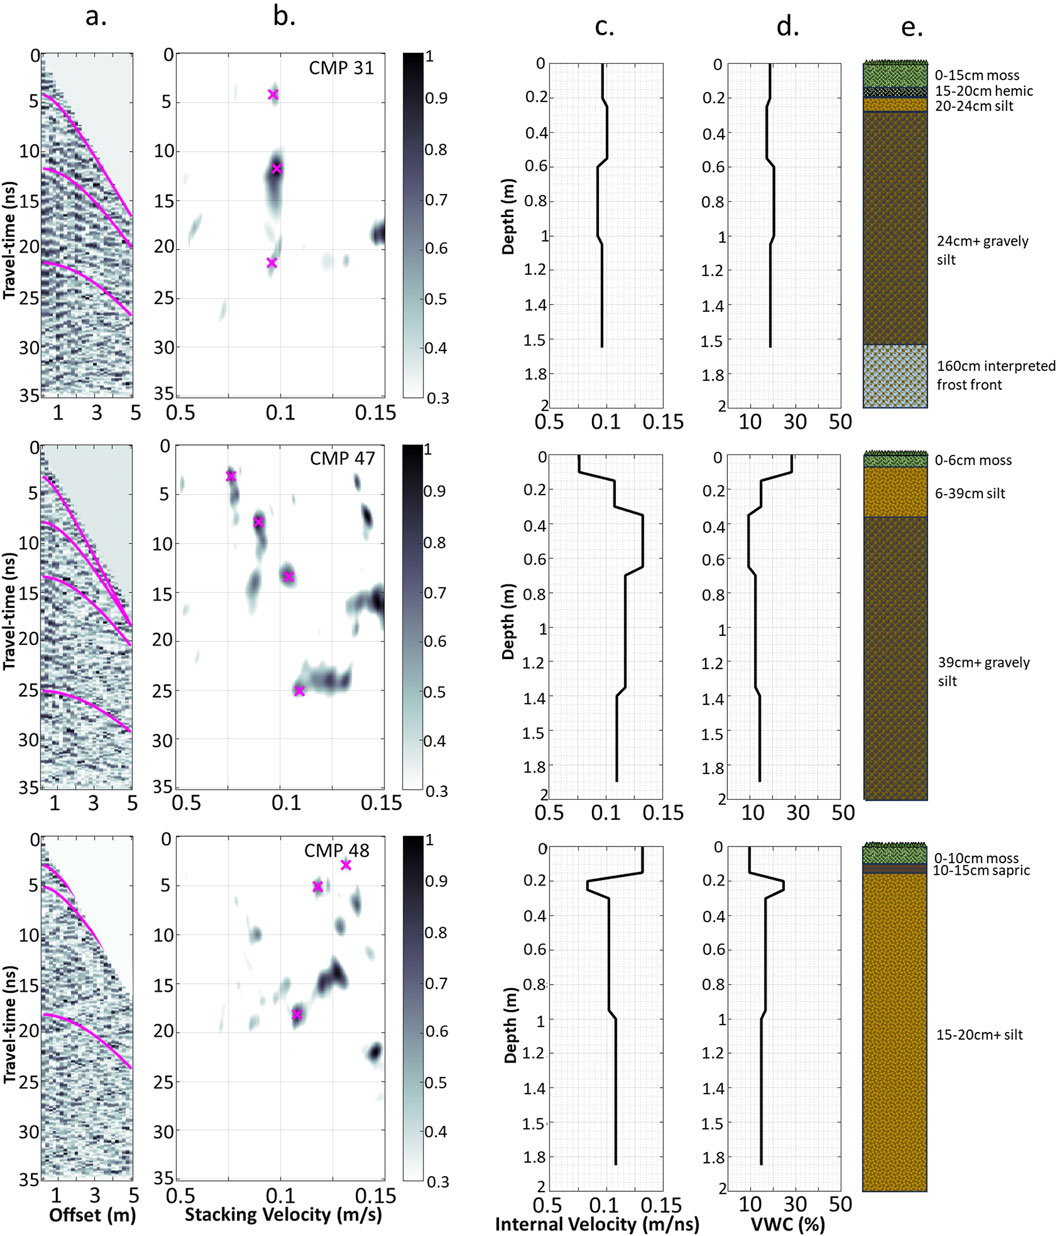
Figure 3. CMP radargrams (a), semblance diagrams (b), velocity profiles (c), and % water content profiles (d) for select survey sites at lmnavait Creek. Soil profiles (e) were determined by soil cores.
3.2 Temporal controls on SSM in permafrost environments
The noted SSM spatial relationships are likely to change throughout the thaw season in permafrost regions as seasonal frost and permafrost act as aquicludes impeding downward soil infiltration. The vertical extent of top-down thaw can therefore impact SSM in shallower soil layers (Rieger, 1963), especially following precipitation events, as revealed by buried TDR sensors at Imnavait Creek (Figure 4) and the Permafrost Tunnel (Figure 5). Additional influence from landscape setting at Imnavait Creek introduces a spatial component to this temporal trend. In the slope region at Imnavait Creek, shallow sensors within the top 30 cm demonstrated sensitivity to weather events, such as an increase in VWC centered on June 20 (Figure 4) caused by a period of rain and snow precipitation (Toolik Field Station; Imnavait ClimaVUE; field observation). The downward infiltration of moisture from this event is constrained within the seasonal thaw layer with the frost table serving as an impermeable confining layer, as evidenced by the frozen conditions at 40 cm and deeper (Figure 6), where there is no sensitivity to the soil wetting experienced above. Progression of top-down thaw to 40 cm depth by the end of June permitted deeper soil infiltration as evidenced by a coincident increase in VWC of the 40 cm depth. Deeper water infiltration is reflected in rising VWC at the 50 cm depth with downward thaw reaching these depths by July. This downward trend in moisture infiltration is likely to continue until reaching the maximum thaw depth and impedance to further infiltration at the permafrost table.
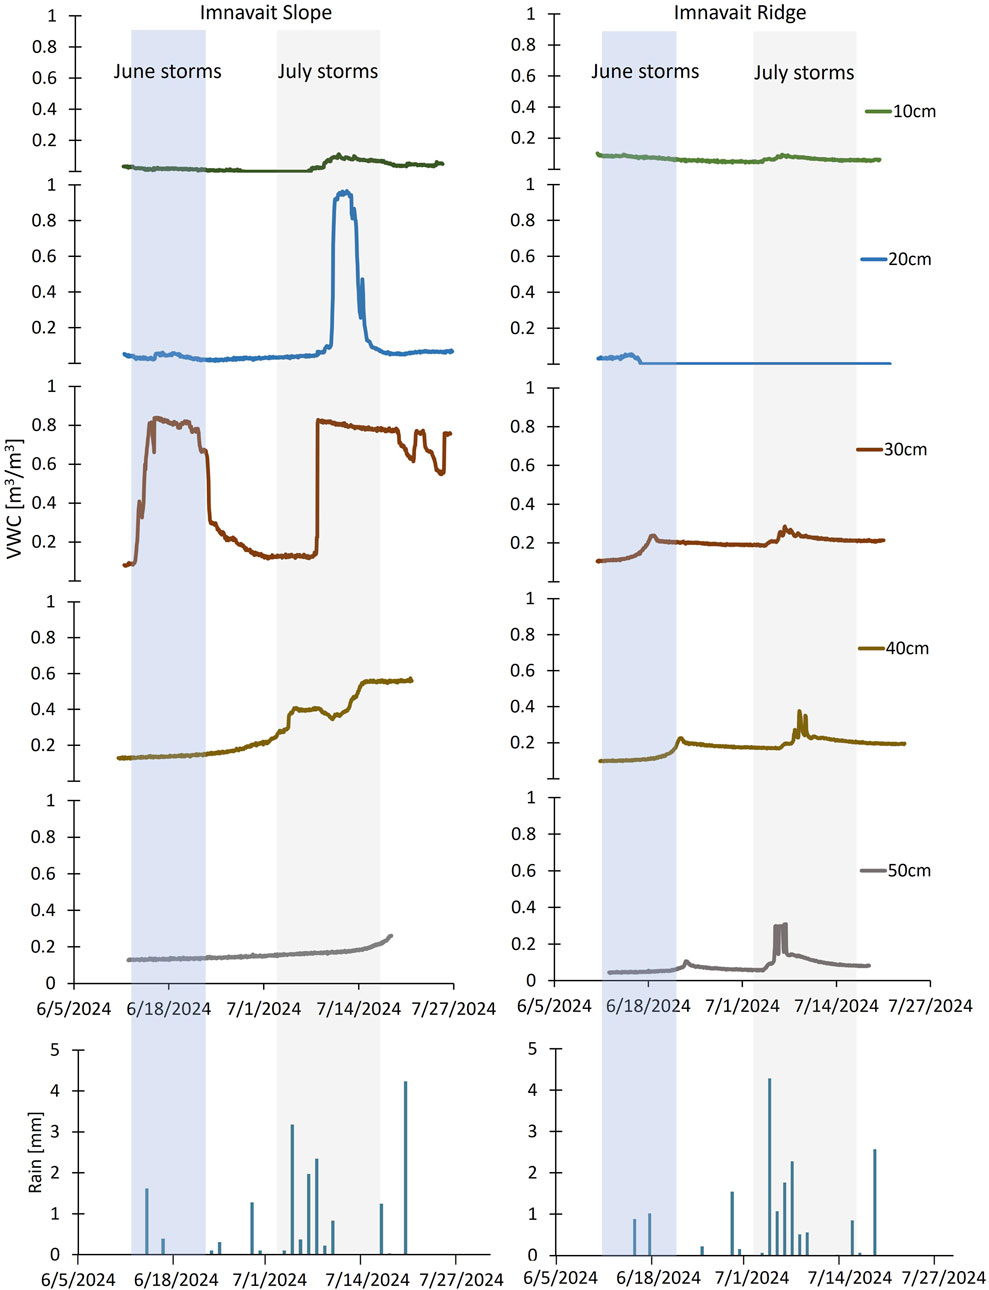
Figure 4. lmnavait slope and ridge soil moisture profiles from the SoilVUE loggers (upper 5 panels) and local precipitation from the ClimaVUE stations (bottom panel). Shading indicates the intervals of precipitation that are discussed in the text.
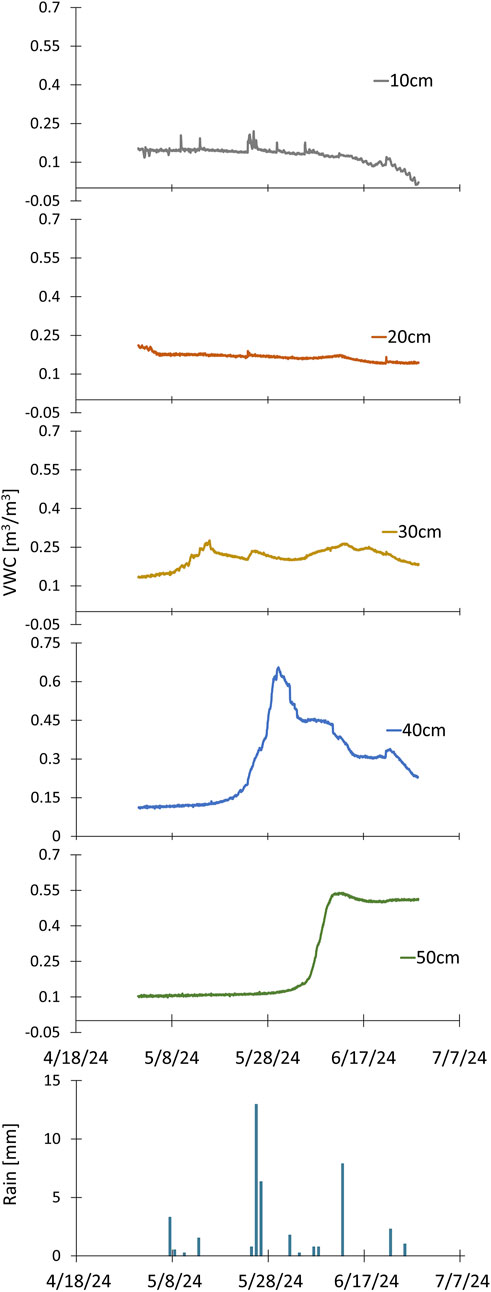
Figure 5. Permafrost Tunnel soil moisture profiles from the SoilVUE logger in the tussock clearing (upper 5 panels) and precipitation from the Fairbanks airport (bottom panel).

Figure 6. Depth-distributed soil temperatures for lmnavait (red) slope (top) and ridge (bottom), and Permafrost Tunnel (blue) tussock clearing (top) and black spruce forest (bottom).
The temporal variation in vertical VWC differed considerably at the ridgeline site, where soil infiltration reached the 50 cm depth (Figure 4) earlier in the thaw season (mid-June), enabled by a faster rate of top-down thaw (Figure 6) in the coarser textured soils (Bonan, 1989) of the ridgeline. The temporal pattern demonstrates the interplay of vertical thaw and pedophysical controls on temporal SSM variability, where the confinement of downward soil infiltration by the seasonal frost table can limit porewater access to deeper, more permeable soil layers.
Similar temporal patterns in VWC with thaw depth were noticeable at the Permafrost Tunnel (Figure 5), although the seasonal, top-down thaw rate was accelerated by its more southerly latitude. Soil observations for the greater Fairbanks area reveal the tendency for shallow permafrost to drive high water tables and active layer saturation in the boreal forest (Rieger, 1963; Bonan, 1989).
3.3 Spatial autocorrelation of SSM
The spatial autocorrelation structure of SSM data were assessed with global Moran’s I and displayed a negative relationship with distance weighting threshold (Figure 7), indicating that SSM clustering was greater at smaller spatial scales in the study sites. SSM values were spatially clustered at scales of 75 m or less (p < 0.05), with the highest positive spatial autocorrelation achieved at distance thresholds under 20 m. This relationship reflects the scale where the observed spatial controls on SSM, such as land cover and topography, are most relevant in these environments (Western et al., 2004).
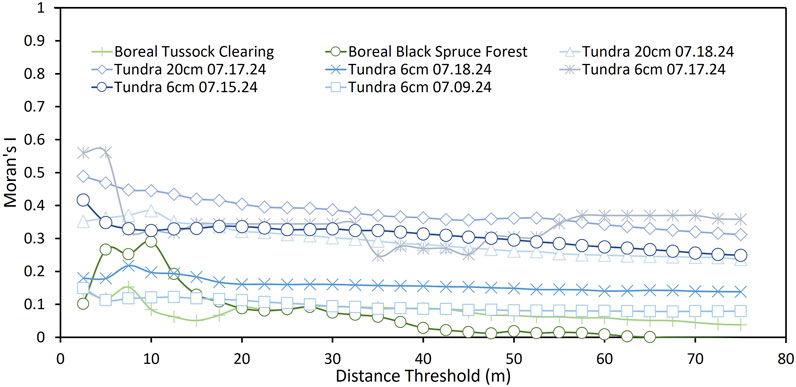
Figure 7. Moran's I as a function of lag distance for the boreal forest site (greens) and the arctic tundra site (blues), including multiple acquisition dates at the tundra site.
Spatial clustering was generally highest in the tundra site over all distance thresholds (mean I of 0.10–0.38) relative to more random values in the boreal forest (mean I of 0.07). Some degree of autocorrelation at the tundra site is likely related to precipitation events on July 8, 14, and 17 affecting antecedent conditions at the time of probe measurements on July 9, 15, 17, and 18. Spatial cluster of VWC for the upper 20 cm was higher than the top 6 cm on the same acquisition dates at the tundra site, likely due to deeper soil horizons having less exposure to ambient weather conditions. Additionally, probe contact with near saturated silts or peat beneath a variable vegetation layer likely contributes to the lower spatial variation observed in the 20 cm VWC, while the 6 cm detections terminate in a rhizosphere alternating between tussocks, other sedges, and mosses of varying wettability and air exposure.
Spatial clustering at the boreal forest site was related to vegetation type, with clustering at 12.5 m or less averaging at I = 0.22 under black spruce canopy coverage compared to I = 0.11 in the tussock clearing. Due to heterogeneity in spruce coverage over small spatial scales (∼20 m) at the site, distance thresholds greater than 20 m incorporated SSM values of small clearings within the black spruce AOI and wooded groves within the tussock AOI which homogenized the I values at each site. A comparison of distance threshold versus Z-scores (Supplemental Figure 2) represents deviations from randomness and yielded notable peaks in either series at 10 m in the black spruce and 7.5 m in the tussock clearing, demonstrating the scales at which the controls on spatial clustering are most pronounced under each land cover type. An additional peak in Z-score was noticeable at 67.5 m in the tussock site, perhaps demonstrating a lack of randomness at this scale due to greater averaging.
Increased spatial weighting distances (>20 m) resulted in increasingly comparable I values across land cover types (Permafrost Tunnel) and time (Imnavait) as such thresholds result in homogenization of the SSM clusters. Plots of distance threshold versus z-score did not produce notable peaks for the tundra site, however the greatest disparity was captured in the 2.5 m distance threshold for all sites, and Table 2 compares the differences in clustering noted at 2.5 m and 20 m thresholds. Therefore, intra-site variability in measured tundra SSM is significant within the landscape controls noted in the previous section and likely relate to micro-topographical controls and variations in ground cover. Together, these results suggest a spatial resolution of 20 m or less may prove ideal in capturing spatial heterogeneity in SSM of Alaska’s boreal forest and arctic tundra biomes.
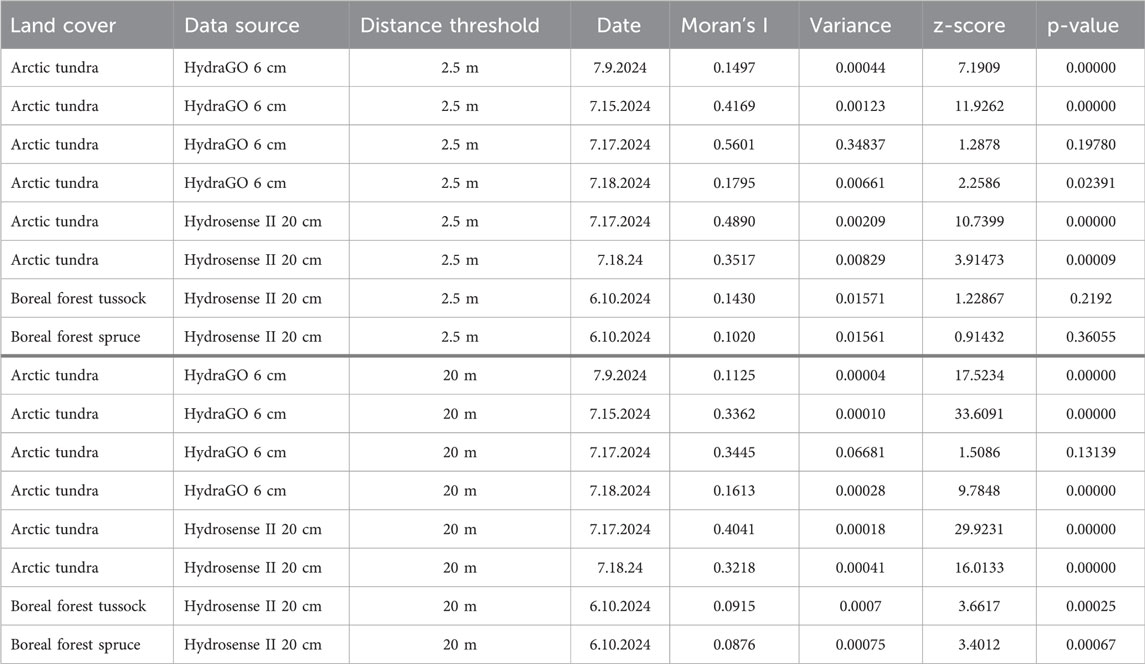
Table 2. Output Results for the Global Moran’s analysis of spatial autocorrelation in surface moisture values measured with calibrated TLO probes. Results are shown for 2.5 m and 20 m distance thresholds.
3.4 Soil material biases
Comparisons of TLO probe data that share the same permittivity-VWC transformation revealed a weak linear correlation (r2 = 0.13) between VWC of the upper 6 cm (HydraGO) to that of the upper 20 cm (HydroSense II) on 17 July 2024 at Imnavait Creek. The latter yielded a higher average VWC of 33.9% ± 0.5% (StE) for the top 20 cm (n = 1,373) than the mean of 24.6% ± 0.4% for the upper 6 cm. Some level of this discrepancy may relate to inconsistencies in measurement error between the respective instruments, but a weak correlation might be expected regardless due to interactions between the probed depth and the soil profile. The deeper probed zone of the HydroSense II was confirmed by soil sampling to reach wetter mineral loam or humic material while the 6 cm probe largely terminated in the surface, live, moss layer. A lab test on 22 volumetric samples of moss (mean = 14.0%) and silt (mean = 51.6%) within the top 20 cm of the soil profiles at each site revealed significant (p = 0.01) difference in VWC between these common stratigraphic units. Additionally, surface VWC at 6 cm was notably higher on average for tussocks (mean 28.6% ± 1.0%) than moss (mean 22.8% ± 0.4%) regardless of catchment setting in the arctic tundra, unlike the boreal forest site. The difference is likely related to the sole use of the HydroSense II at the boreal forest site since the longer waveguides pass through tussock peat to incorporate mineral soil into its bulk VWC calculation.
These results suggest any surficial (<20 cm) penetration of the radar signal expected from microwave frequencies (i.e., Srivastava et al., 2006) will likely experience influence from tussock moisture and can be less representative of soil VWC where tussock cover is dense. Furthermore, shallow microwave penetration likely yields SSM values that are most reflective of organic horizon VWC in permafrost environments due to their characteristically thick organic horizon development. This organic material layer demonstrated potentially greater sensitivity to ambient weather in the Moran’s analysis and weaker clustering relationships. Additionally, the spatially inhomogeneous soil profile thicknesses observed at each site (Supplemental Tables 1, 2) indicate that the occurrence of different soil materials within the surface radar penetration zone (ranging from centimeters to 1 m for C-band) is inconsistent across space. Consequently, microwave detected SSM variation may be affected by varying soil material profiles irrespective of landscape or vegetation controls. This illustrates the importance of collecting local soil information to more accurately inform interpretations of remotely sensed SSM in these environments.
3.5 20 m relative SSM with C-band SAR
Relative SSM products were derived from C-band images acquired throughout the frost-free season for the arctic tundra site at Imnavait Creek (Supplemental Figure 3). The spatial resolution of the relative SSM output can be controlled with the averaging filter (Zakharov et al., 2020) and was optimized at ∼20 m resolution for the study site based on the spatial autocorrelation results. The SSM products were compared to meteorological data and in situ monitoring from TDR stations for validation (Figure 8). Across acquisition dates, estimated SSM reveals generally high values in topographic lows and along creek channels (likely due to both waterlogged soils and greater vegetation density) with lower values along ridgelines in agreement with handheld probe measurements, together mirroring the importance of topography as a spatial control on SSM at the site. SSM variability is noticeable across the representative tundra ground surface and demonstrates no clear pattern but may reflect spatially inconsistent detection biases from inhomogeneous soil and substrate features noted in the previous section. Bedrock outcrops produced low SSM estimates in correspondence with low sensitivity S. Temporal controls on SSM were superimposed on the noted spatial relationships whereas the observed patterns between SSM and topography were subdued following pronounced precipitation events, such as a 6-day period of rain detected at the ClimaVUE station on July 3–8 (Figure 8) due to indiscriminate surface wetting. The high sensitivity of SAR SSM to discrete precipitation events and decrease in SSM variability with increased wetness have been noted elsewhere (Charpentier and Groffman, 1992; Zakharov et al., 2020).
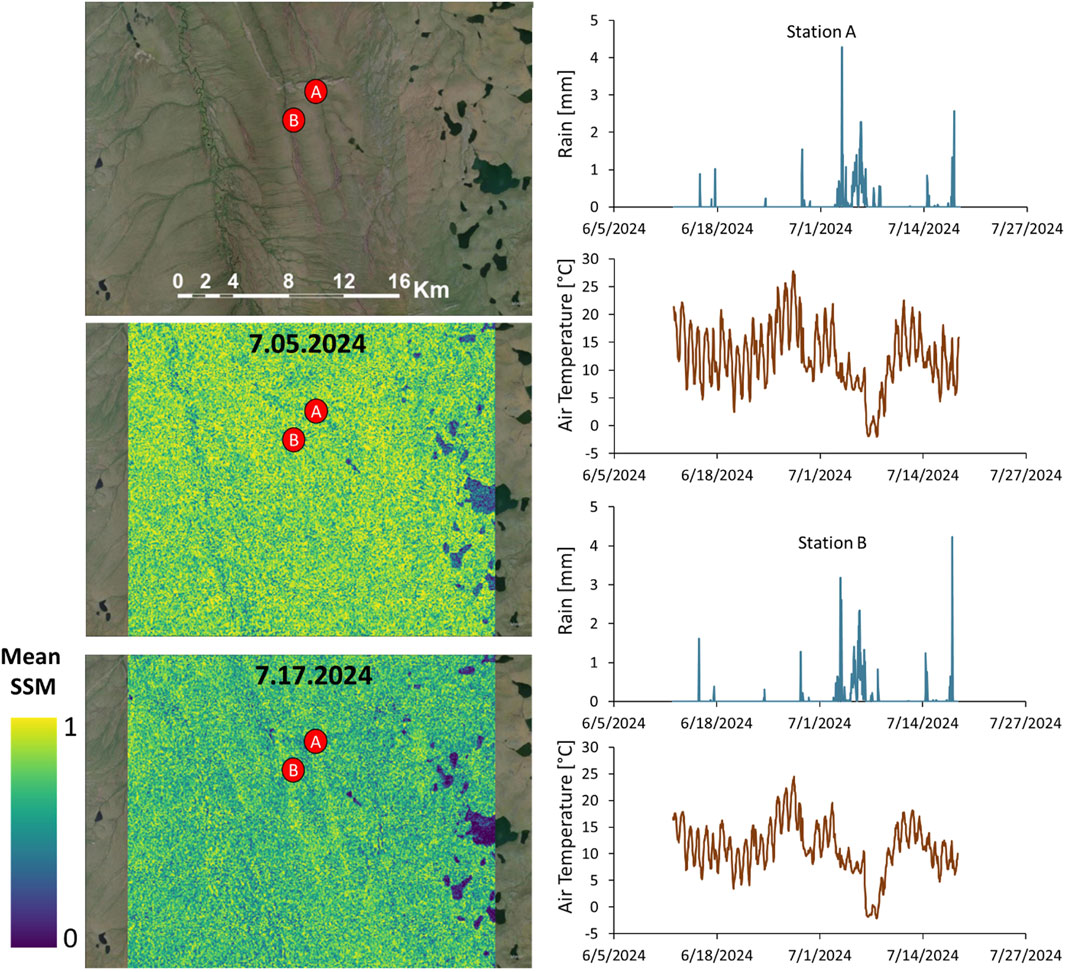
Figure 8. Selected SSM output scenes and lmnavait meteorological data from the ClimaVUE ridge (A) and slope (B) stations. Relative mean SSM color range representing 1 indicate saturated conditions while color representing 0 indicate dry conditions.
Meteorological data from the Toolik Weather Station and the local ClimaVUE were used to understand temporal changes in relative SSM related to weather conditions. In the Arctic Foothills summer, seasonal snowmelt, topography, and soil thermal status proved to be major controls on temporal variability in SSM at the study area. Low pixel values representing the virtual absence of liquid SSM (or frozen soil conditions) persisted until a major snowmelt event on May 14–17 correlating with above-freezing soil temperatures (Supplemental Figure 4) created thawing conditions and produced elevated SSM values across the scene by May 28. Low relative SSM was concentrated in topographic highs due to runoff. SSM continued to increase across the scene until June 2 as the snowpack diminished. However, SSM values remained relatively high into mid-June, likely due to poor downward soil infiltration, as observed in the TDR sensors, that was confined by the minimal active layer thaw (Figures 4–6).
As discussed in the previous section, site-specific terrain features such as tussocks and tundra foliage must be considered in SAR SSM outputs. Near continuous tussock coverage at the tundra site likely leads to the detection of high tussock VWC and the occlusion of the ground surface between tussocks. Field observations confirmed that soil between tussocks can be significantly wetter where frost boils occur, or drier where moss occurs. Therefore, any signal tendency towards tussock VWC may lead the SSM product to be over-representing the spatial homogeneity of SSM. Additionally, illustration of the spatial patterns in SSM are generally biased by the product output resolution. Resampling in permafrost scenes hypothetically averages micro-scale differences in SSM related to small (meters-wide) thaw features, although these were mainly constrained to riparian areas in the Imnavait AOIs. Avoidance of surface roughness effects with the time-series approach may be undermined by short term surface roughness change related to active layer freeze and thaw, which has been noted in tundra environments of Siberia (Högström et al., 2014). However, the early thaw season timing of this investigation likely precludes any significant roughness changes induced by thaw. Lastly, despite the absence of shrubs, low tundra vegetation can impart highly random polarimetric responses (Zwieback and Berg, 2019), although it is difficult to assess the degree of vegetation influence on the relative SSM products (Zakharov et al., 2020) for the tundra study location.
3.6 9 km soil moisture estimation with L-band SAR
A time-series of SMAP data was used to derive coarse-scale SSM at 9 km resolution for the Permafrost Tunnel site. SMAP was selected for the boreal forest application as the L-band frequency typically achieves greater canopy penetration than C-band (Konings et al., 2017; El Hajj et al., 2018) and has proven advantageous over other L-band products for a majority of global vegetated land surfaces (Kim et al., 2021). Initial comparison of the SMAP-retrieved SSM with TDR-measured VWC averaged across 8 sensors dispersed in black spruce forest (Supplemental Figure 5, TDR data from Vas et al., in review) revealed low correlation for the acquisition dates spanning October 2022 to November 2023 (r2 < 0.1). SMAP retrievals in boreal forest of Saskatchewan, Canada showed increased correlation with VWC of deeper mineral horizons (Ambadan et al., 2022), but at our site SMAP showed the greatest linear correlation with sensors deployed in mineral soil at 15 cm soil depth or shallower (r2 = 0.08), and correlation decreased at greater stratigraphic depths (r2 < 0.01). The general inconsistency between the SMAP-SSM and TDR-VWC likely reflect bias related to inherent incongruities between the 9 km resampling resolution and in situ data representativeness for intra-pixel variability in land cover-specific SSM observed in Section 3.1.
The spatial averaging required to optimize coherence for the SMAP product results in a composite SSM that encompasses contrasting soil moisture environments of the boreal forest. The limited coverage of 8 TDR sensors within the large 9 km scene best represent the closed black spruce forest at the scale of natural SSM heterogeneity (i.e., increased autocorrelation <20 m), while other vegetation types encompassed in the SMAP scene such as spruce woodland, tussock clearings, bogs, and disturbed or thermokarst sites are not as well represented with TDR. Under-estimation of SSM in the SMAP product is visualized in Figure 9 and quantified by a RMSE of 0.158 and unbiased RMSE (uRMSE) of 0.092, which is comparable to uRMSE of SMAP 9 km products in other boreal forest sites in Alaska (Jääskeläinen et al., 2025) but is, however, in excess of the standard deviation of 0.07 in our SMAP results. This bias likely decreases the SMAP-TDR correlation and may result from the increased SSM beneath the well-represented closed black spruce canopies. Therefore, the performance of the SMAP product may be better represented by greater diversity of in situ VWC coverage that captures more of the vegetation heterogeneity occurring within the 9 km SMAP image. However, validation of the SMAP 9 km grid is outside of the scope of this study, and this finding illustrates the major challenge in applying coarse resolution imagery for analyzing the natural scale of spatial SSM patterns in heterogeneous environments with significant SSM spatial variation and an autocorrelation distance of 20 m.
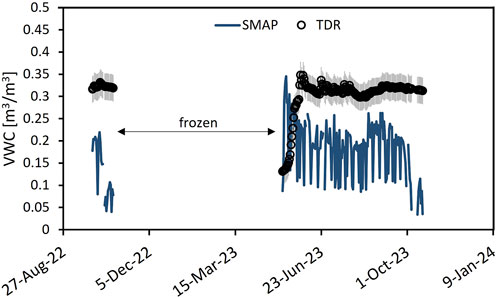
Figure 9. Time series of 9 km averaged SMAP and TDR measured volumetric soil moisture for the upper 10 cm of soil. Error bars for the ECH2O sensor present the 0.03 m3/m3 instrument error. Missing data reflects frozen soil conditions.
Distortion of SMAP results from vegetation biases are difficult to correct for and can be compounded by temporal variability in vegetation. For instance, an offset in the retrieved SSM from the measured soil VWC may be associated with errors in the vegetation correction that lead to time-variable biases (Zwieback et al., 2018). In this study, the SMAP product overestimated SSM relative to the TDR sensors in early spring, during leaf budding, but transitioned into underestimated SSM throughout the summer and autumn months. However, leaf loss in autumn did not seem to reduce the magnitude of SSM underestimation. The full time series of SMAP compared to TDR sensor VWC showing the ±0.03% instrument error is provided in Figure 9. Other sources for low correlation may stem from inherent pedophysical differences between the study site and the SMAP core calibration sites (Whitcomb et al., 2020).
Given the noted correlation bias in TDR coverage that represents the natural scale of SSM heterogeneity, finer spatial resolution may yet prove useful for characterizing the natural SSM variability in boreal forest at our site. The enhanced SSM clustering at 20 m or less suggested by Moran’s I indicate the importance of higher spatial resolution for realizing the natural spatial heterogeneity of boreal forest SSM. Future applications of higher resolution (3–50 m) UAS-based L-band sensors (Stern et al., 2024) may improve detections of SSM patterns in boreal forest.
3.7 Using Repeat C-band to track soil thaw
Polarimetric detection of soil thaw with C-band has previously been demonstrated by a change from surface-like scattering in frozen soils, to volume scattering in thawed soils (Jagdhuber et al., 2014). However, this approach assumed no contribution from vegetation cover on volume scattering, whereas vegetation influence is expected in our boreal forest site. Other approaches use autumn images to represent thawed soil conditions (Cohen et al., 2018; Cohen et al., 2021). Because snow cover tends to occur early in our study location, we focused on backscatter signals of spring thaw and vegetation green-up. To visualize potential differences in volume backscatter related to soil moisture from that associated with vegetation, backscatter in VH and VV polarizations for a time-series of Sentinel-1 images spanning January to July 2024 were viewed alongside in situ soil VWC and NDVI. The results (Figure 10) reveal an early rise in VWC of the upper 10 cm of soil in April, which is congruent with field observations of early soil thaw occurring beneath a residual snowpack of 38.6 cm on April 18. Thaw probing at this time confirmed the near complete thaw of the surface moss layer, with frost retreating to the mineral soil contact. Although early snowpack degradation and meltwater percolation to the ground surface is likely contributing to the SSM values, soil thaw is required for moisture infiltration and TDR detection of the VWC increase. Backscatter intensities compared for three orbits spanning January to July show a correlated increase in VH scattering for two of three orbits with this initial SSM signal, while VV shows less of a response. The residual snow cover and the dependence of plant leaf-out on snow disappearance for interior Alaska (Kawashima et al., 2021; 2023) lead to low NDVI for this interval, indicating that the observed peaks in backscatter are related to this early soil thaw signal. The results demonstrate the potential for time-series C-band backscatter in identifying soil thaw onset beneath the spring snowpack.
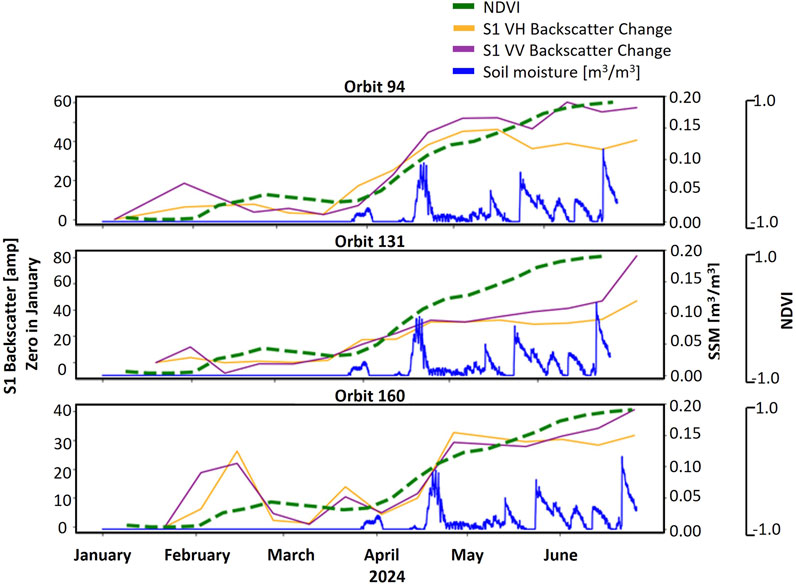
Figure 10. Sentinel- 1 backscatter change at VV and VH polarizations at three orbit geometries, each compared with NDVI and TDR soil VWC for the Permafrost Tunnel site. NDVI values are normalized to the maximum seasonal value for the scene.
Marked increases in backscatter, soil VWC, and NDVI patterns concurred in early May with onset of the spring freshet, when solar conditions were optimized for snowmelt and photosynthetic activity. The initial rise in spring NDVI is commonly attributed to snow disappearance prior to deciduous leaf-out in Alaska’s Arctic (Swanson, 2021), and similarly budburst tends to immediately follow snow disappearance in interior Alaska (Kawashima et al., 2021; Kawashima et al., 2023). Therefore, volume scattering from the snow-exhumed vegetation is likely reflected in both backscatter distributions at this stage in the thaw season, with the concomitant peak in SSM from meltwater runoff likely contributing significant scatter simultaneously. The culmination complicates any parsing of the importance of one scatter source from the other after snow disappearance.
Later in the thaw season, peaks in measured SSM correlate to precipitation events and vary irrespective of plant phenology as NDVI remains elevated from peak leaf volume through this interval. Deviations in backscatter intensity from this sustained peak in NDVI do not correlate with measured SSM, indicating substantial influence from vegetation volume scattering into the summer months.
4 Conclusions
The spatial variability and autocorrelation of SSM were investigated with relevance to site specific controls in permafrost environments of Alaska. Multi-platform ground-based measurements revealed significant fine-scale (∼1 m) variability in SSM by landscape setting (p < 0.001) and substrate type (p = 0.01) in an arctic tundra site, and by land cover type (p < 0.001) in a low-relief boreal forest site. Temporal variability in these patterns was related to active layer thaw extent which varied with site-specific soil properties, and by weather events such as snowmelt and precipitation. Spatial autocorrelation analysis revealed that the operating scales of the spatial controls vary from 2.5 m to 20 m clustering. These results suggest a spatial resolution of 20 m or less, and multi-scale mapping capabilities, are important for capturing the natural complexity of SSM spatial structure in Alaskan boreal forest and arctic tundra environments.
Comparisons of VWC for the upper 6 cm versus 20 cm with soil stratigraphic units revealed the potential for any shallow signal penetration from spaceborne microwave (<6 cm) to largely represent VWC of moss or organic soil in both boreal forest and arctic tundra where thick organic horizons are characteristic. Furthermore, dense cover of high-profile tussocks may create a detection bias towards VWC of the tussock peat which was generally wetter than adjacent substrate material. Therefore, site specific information on soil properties and substrate types are essential for improving the interpretation of remotely sensed SSM in these environments.
Relative SSM from C-band time series agreed with the ground-based SSM characterizations and meteorological data for the arctic tundra site. The time-series approach offers an appropriate means for reducing the effects of surface roughness and vegetation on SSM estimations in this study environment. Daily SSM estimated from coarse-resolution SMAP produced low correlation with TDR measured SSM (r2 = 0.08) and an uRMSE of 0.092, reflecting limited spatial representation by in situ data and spatial averaging of areas with differing SSM controls in the 9 km SMAP product. However, correction of potential time-dependent vegetation biases and the optimization of validation sensor coverage in high latitude environments may improve SMAP application for the coarse assessment of boreal forest SSM heterogeneity. Lastly, C-band time series demonstrated the potential utility for parsing backscatter distributions related to soil thaw beneath a residual spring snowpack (before deciduous leaf-out). Backscatter intensities compared for three orbits showed a correlated increase in VH scattering for two of three orbits with the initial spring SSM signal that correlated with field observations of sub-snowpack soil thaw, while VV showed less of a response. Further expansion on Sentinel-1 backscatter time-series applications to this end could enable C-band application for long-term tracking of active layer thaw initiation relevant for permafrost.
Data availability statement
The raw data supporting the conclusions of this article will be made available by the authors, without undue reservation.
Author contributions
WB: Conceptualization, Data curation, Investigation, Methodology, Resources, Supervision, Visualization, Writing – original draft, Writing – review and editing. ZH: Conceptualization, Data curation, Investigation, Methodology, Visualization, Writing – original draft, Writing – review and editing. KL: Conceptualization, Data curation, Investigation, Methodology, Writing – original draft, Writing – review and editing. TM: Conceptualization, Data curation, Methodology, Writing – review and editing. DB: Data curation, Methodology, Visualization, Writing – review and editing. TS: Conceptualization, Methodology, Resources, Writing – review and editing. AB: Conceptualization, Methodology, Resources, Funding Acquisition, Writing - Review and Editing. TD: Funding acquisition, Resources, Supervision, Writing – review and editing.
Funding
The author(s) declare that financial support was received for the research and/or publication of this article. This work was supported by the U.S. Army Engineer Research and Development Center Basic Research Portfolio through Program Element 06031198A “Ground Advanced Technology” and the DoD’s Environmental Security Technology Certification Program (project RC22-7408). Additional funding was provided under the project ‘Soil Moisture Controls on the Thermal Regime of Arctic Soils' by the Assistant Secretary for the Army Acquisition, Logistics, and Technology Basic and Applied Research programs. Any opinions expressed in this paper are those of the authors and are not to be construed as official positions of the funding agency.
Acknowledgments
The authors express their gratitude to Pratyusha Gonnuru, Lindsay Gaimaro, and Kate Liddle-Broberg for their assistance in collecting handheld probe data along extensive soil moisture transects, to Jon Maakestad, and Dragos Vas for their support with installing and maintaining soil moisture and weather monitoring instrumentation at each field site, to Elise Brehm for performing texture separations on soil samples, and to Isabelle Jacobson for assisting with GPR collection.
Conflict of interest
The authors declare that the research was conducted in the absence of any commercial or financial relationships that could be construed as a potential conflict of interest.
The author(s) declared that they were an editorial board member of Frontiers, at the time of submission. This had no impact on the peer review process and the final decision.
Generative AI statement
The author(s) declare that no Generative AI was used in the creation of this manuscript.
Publisher’s note
All claims expressed in this article are solely those of the authors and do not necessarily represent those of their affiliated organizations, or those of the publisher, the editors and the reviewers. Any product that may be evaluated in this article, or claim that may be made by its manufacturer, is not guaranteed or endorsed by the publisher.
References
Aalto, J., Le Roux, P. C., and Luoto, M. (2013). Vegetation mediates soil temperature and moisture in arctic-alpine environments. Arct. Antarct. Alp. Res. 45 (4), 429–439. doi:10.1657/1938-4246-45.4.429
Ambadan, J. T., MacRae, H. C., Colliander, A., Tetlock, E., Helgason, W., Gedalof, Z. E., et al. (2022). Evaluation of SMAP soil moisture retrieval accuracy over a boreal forest region. IEEE Trans. Geoscience Remote Sens. 60, 1–11. doi:10.1109/tgrs.2022.3212934
Bakian-Dogaheh, K., Chen, R. H., Yi, Y., Kimball, J. S., Moghaddam, M., and Tabatabaeenejad, A. (2022). A model to characterize soil moisture and organic matter profiles in the permafrost active layer in support of radar remote sensing in Alaskan Arctic tundra. Environ. Res. Lett. 17 (2), 025011. doi:10.1088/1748-9326/ac4e37
Balenzano, A., Mattia, F., Satalino, G., and Davidson, M. W. (2010). Dense temporal series of C-and L-band SAR data for soil moisture retrieval over agricultural crops. IEEE J. Sel. Top. Appl. Earth Observations Remote Sens. 4 (2), 439–450. doi:10.1109/jstars.2010.2052916
Barker, A. J., Douglas, T. A., Jacobson, A. D., McClelland, J. W., Ilgen, A. G., Khosh, M. S., et al. (2014). Late season mobilization of trace metals in two small Alaskan arctic watersheds as a proxy for landscape scale permafrost active layer dynamics. Chem. Geol. 381, 180–193. doi:10.1016/j.chemgeo.2014.05.012
Barker, A. J., Sullivan, T. D., Baxter, W. B., Barbato, R. A., Gallaher, S., Patton, G. E., et al. (2023). Iron oxidation–reduction processes in warming permafrost soils and surface waters expose a seasonally rusting arctic watershed. ACS Earth Space Chem. 7 (8), 1479–1495. doi:10.1021/acsearthspacechem.2c00367
Barrett, B., and Petropoulos, G. P. (2013). Satellite remote sensing of surface soil moisture. Remote Sens. energy fluxes soil moisture content 85, 85–119. doi:10.1201/b15610-6
Barrett, B. W., Dwyer, E., and Whelan, P. (2009). Soil moisture retrieval from active spaceborne microwave observations: an evaluation of current techniques. Remote Sens. 1 (3), 210–242. doi:10.3390/rs1030210
Barros, N., Gomez-Orellana, I., Feijóo, S., and Balsa, R. (1995). The effect of soil moisture on soil microbial activity studied by microcalorimetry. Thermochim. Acta 249, 161–168. doi:10.1016/0040-6031(95)90686-x
Bian, H., Li, C., Zhu, J., Xu, L., Li, M., Zheng, S., et al. (2022). Soil moisture affects the rapid response of microbes to labile organic C addition. Front. Ecol. Evol. 10, 857185. doi:10.3389/fevo.2022.857185
Bonan, G. B. (1989). A computer model of the solar radiation, soil moisture, and soil thermal regimes in boreal forests. Ecol. Model. 45 (4), 275–306. doi:10.1016/0304-3800(89)90076-8
Borowik, A., and Wyszkowska, J. (2016). Soil moisture as a factor affecting the microbiological and biochemical activity of soil. Plant Soil Environ. 62, 250–255. doi:10.17221/158/2016-pse
Bourgeau-Chavez, L. L., Kasischke, E. S., Riordan, K., Brunzell, S., Nolan, M., Hyer, E., et al. (2007). Remote monitoring of spatial and temporal surface soil moisture in fire disturbed boreal forest ecosystems with ERS SAR imagery. Int. J. Remote Sens. 28 (10), 2133–2162. doi:10.1080/01431160600976061
Charpentier, M. A., and Groffman, P. M. (1992). Soil moisture variability within remote sensing pixels. J. Geophys. Res. Atmos. 97 (D17), 18987–18995. doi:10.1029/92jd00882
Cohen, J., Rautiainen, K., Ikonen, J., Lemmetyinen, J., Smolander, T., Vehvilêinen, J., et al. (2018). A modeling-based approach for soil frost detection in the northern boreal forest region with C-Band SAR. IEEE Trans. Geoscience Remote Sens. 57 (2), 1069–1083. doi:10.1109/tgrs.2018.2864635
Cohen, J., Rautiainen, K., Lemmetyinen, J., Smolander, T., Vehviläinen, J., and Pulliainen, J. (2021). Sentinel-1 based soil freeze/thaw estimation in boreal forest environments. Remote Sens. Environ. 254, 112267. doi:10.1016/j.rse.2020.112267
Cook, F. J., and Orchard, V. A. (2008). Relationships between soil respiration and soil moisture. Soil Biol. Biochem. 40 (5), 1013–1018. doi:10.1016/j.soilbio.2007.12.012
De Zan, F., Parizzi, A., Prats-Iraola, P., and López-Dekker, P. (2013). A SAR interferometric model for soil moisture. IEEE Trans. Geoscience Remote Sens. 52 (1), 418–425. doi:10.1109/tgrs.2013.2241069
Dix, C. H. (1955). Seismic velocities from surface measurements. Geophysics 20 (1), 68–86. doi:10.1190/1.1438126
Dubois, P. C., Van Zyl, J., and Engman, T. (1995). Measuring soil moisture with imaging radars. IEEE Trans. geoscience remote Sens. 33 (4), 915–926. doi:10.1109/36.406677
El Hajj, M., Baghdadi, N., Bazzi, H., and Zribi, M. (2018). Penetration analysis of SAR signals in the C and L bands for wheat, maize, and grasslands. Remote Sens. 11 (1), 31. doi:10.3390/rs11010031
Engstrom, R., Hope, A., Kwon, H., Stow, D., and Zamolodchikov, D. (2005). Spatial distribution of near surface soil moisture and its relationship to microtopography in the Alaskan Arctic coastal plain. Hydrology Res. 36 (3), 219–234. doi:10.2166/nh.2005.0016
Environmental Data Center Team (2024). “Meteorological monitoring program at Toolik, Alaska,” in Toolik field station, institute of arctic biology (Fairbanks, AK: University of Alaska Fairbanks). Available online at: https://toolik.alaska.edu/edc/monitoring/abiotic/met-data-query.php.
Hinkel, K. M., and Nelson, F. E. (2003). Spatial and temporal patterns of active layer thickness at Circumpolar Active Layer Monitoring (CALM) sites in northern Alaska, 1995–2000. J. Geophys. Res. Atmos. 108 (D2). doi:10.1029/2001jd000927
Hogenson, K., Kristenson, H., Kennedy, J., Johnston, A., Rine, J., Logan, T., et al. (2020). Hybrid Pluggable Processing Pipeline (HyP3): a cloud-native infrastructure for generic processing of SAR data doi:10.5281/zenodo.4646138
Högström, E., Trofaier, A. M., Gouttevin, I., and Bartsch, A. (2014). Assessing seasonal backscatter variations with respect to uncertainties in soil moisture retrieval in Siberian tundra regions. Remote Sens. 6 (9), 8718–8738. doi:10.3390/rs6098718
Holden, S. R., Berhe, A. A., and Treseder, K. K. (2015). Decreases in soil moisture and organic matter quality suppress microbial decomposition following a boreal forest fire. Soil Biol. Biochem. 87, 1–9. doi:10.1016/j.soilbio.2015.04.005
Huang, J., Desai, A. R., Zhu, J., Hartemink, A. E., Stoy, P. C., Loheide, S. P., et al. (2020). Retrieving heterogeneous surface soil moisture at 100 m across the globe via fusion of remote sensing and land surface parameters. Front. Water 2, 578367. doi:10.3389/frwa.2020.578367
Jääskeläinen, E., Luoto, M., Putkiranta, P., Aurela, M., and Virtanen, T. (2025). High-resolution soil moisture mapping in northern boreal forests using SMAP data and downscaling techniques. Hydrology Earth Syst. Sci. Discuss. 2025, 1–33.
Jagdhuber, T., Stockamp, J., Hajnsek, I., and Ludwig, R. (2014). Identification of soil freezing and thawing states using SAR polarimetry at C-band. Remote Sens. 6 (3), 2008–2023. doi:10.3390/rs6032008
Jorgenson, M. T., Douglas, T. A., Liljedahl, A. K., Roth, J. E., Cater, T. C., Davis, W. A., et al. (2020). The roles of climate extremes, ecological succession, and hydrology in repeated permafrost aggradation and degradation in fens on the Tanana Flats, Alaska. J. Geophys. Res. Biogeosciences 125 (12), e2020JG005824. doi:10.1029/2020jg005824
Jorgenson, M. T., Romanovsky, V., Harden, J., Shur, Y., O’Donnell, J., Schuur, E. A., and Marchenko, S. (2010). Resilience and vulnerability of permafrost to climate change. Can. J. For. Res. 40 (7), 1219–1236.
Jorgenson, M. T., Yoshikawa, K., Kanevskiy, M., Shur, Y., Romanovsky, V., Marchenko, S., and Jones, B. (2008). “Permafrost characteristics of Alaska,” in Proceedings of the ninth international conference on permafrost (Fairbanks: University of Alaska), 3, 121–122.
Kääb, A. (2008). Remote sensing of permafrost-related problems and hazards. Permafr. Periglac. Process. 19 (2), 107–136. doi:10.1002/ppp.619
Kawashima, S., Ueyama, M., Harazono, Y., Iwata, H., and Kobayashi, H. (2023). Snow disappearance timing associated with elevation and vegetation type determines heterogeneity in spring onset in interior Alaska. Polar Sci. 35, 100918. doi:10.1016/j.polar.2022.100918
Kawashima, S., Ueyama, M., Okamura, M., Harazono, Y., Iwata, H., and Kobayashi, H. (2021). Spring onsets of a young forest in interior Alaska determined based on time-lapse camera and eddy covariance measurements. J. Agric. Meteorology 77 (3), 190–199. doi:10.2480/agrmet.d-21-00003
Kemppinen, J., Niittynen, P., Rissanen, T., Tyystjärvi, V., Aalto, J., and Luoto, M. (2023). Soil moisture variations from boreal forests to the tundra. Water Resour. Res. 59 (6), e2022WR032719. doi:10.1029/2022wr032719
Kim, S., Dong, J., and Sharma, A. (2021). A triple collocation-based comparison of three L-band soil moisture datasets, SMAP, SMOS-IC, and SMOS, over varied climates and land covers. Front. Water 3, 693172. doi:10.3389/frwa.2021.693172
Konings, A. G., Piles, M., Das, N., and Entekhabi, D. (2017). L-band vegetation optical depth and effective scattering albedo estimation from SMAP. Remote Sens. Environ. 198, 460–470. doi:10.1016/j.rse.2017.06.037
Liljedahl, A. K., Hinzman, L. D., Harazono, Y., Zona, D., Tweedie, C. E., Hollister, R. D., et al. (2011). Nonlinear controls on evapotranspiration in arctic coastal wetlands. Biogeosciences 8 (11), 3375–3389. doi:10.5194/bg-8-3375-2011
Liu, L., Jafarov, E. E., Schaefer, K. M., Jones, B. M., Zebker, H. A., Williams, C. A., et al. (2014). InSAR detects increase in surface subsidence caused by an Arctic tundra fire. Geophys. Res. Lett. 41 (11), 3906–3913. doi:10.1002/2014gl060533
Liu, L., Schaefer, K., Zhang, T., and Wahr, J. (2012). Estimating 1992–2000 average active layer thickness on the Alaskan North Slope from remotely sensed surface subsidence. J. Geophys. Res. Earth Surf. 117 (F1). doi:10.1029/2011jf002041
Mane, S., Das, N., Singh, G., Cosh, M., and Dong, Y. (2024). Advancements in dielectric soil moisture sensor Calibration: a comprehensive review of methods and techniques. Comput. Electron. Agric. 218, 108686. doi:10.1016/j.compag.2024.108686
Moran, M. S., Peters-Lidard, C. D., Watts, J. M., and McElroy, S. (2004). Estimating soil moisture at the watershed scale with satellite-based radar and land surface models. Can. J. remote Sens. 30 (5), 805–826. doi:10.5589/m04-043
Moran, P. A. (1950). Notes on continuous stochastic phenomena. Biometrika 37 (1/2), 17–23. doi:10.2307/2332142
Neal, A. (2004). Ground-penetrating radar and its use in sedimentology: principles, problems and progress. Earth-science Rev. 66 (3-4), 261–330. doi:10.1016/j.earscirev.2004.01.004
O'Neill, P., Bindlish, R., Chan, S., Njoku, E., and Jackson, T. (2018). Algorithm theoretical basis document. Level 2 and 3 soil moisture (passive) data products.
Overduin, P. P., Yoshikawa, K., Kane, D. L., and Harden, J. W. (2005). Comparing electronic probes for volumetric water content of low-density feathermoss. Sens. Rev. 25 (3), 215–221. doi:10.1108/02602280510606507
Parsekian, A. D., Chen, R. H., Michaelides, R. J., Sullivan, T. D., Clayton, L. K., Huang, L., et al. (2021). Validation of permafrost active layer estimates from airborne SAR observations. Remote Sens. 13 (15), 2876. doi:10.3390/rs13152876
Pulliainen, J., Hari, P., Hallikainen, M., Patrikainen, N., Peramaki, M., and Kolari, P. (2004). “Monitoring of soil moisture and vegetation water content variations in boreal forest from C-band SAR data,” in Igarss 2004. 2004 IEEE international geoscience and remote sensing symposium (IEEE), 2, 1013–1016. doi:10.1109/igarss.2004.1368582
Punithraj, G., Pruthviraj, U., and Shetty, A. (2020). “Surface soil moisture retrieval using C-band Synthetic Aperture Radar (SAR) over Yanco study site, Australia—a preliminary Study,” in Applications of geomatics in civil engineering: select proceedings of ICGCE 2018 (Singapore: Springer), 107–121.
Rieger, S. (1963). “Soil survey, Fairbanks area, Alaska (No. 1723),” in United States department of agriculture, soil conservation service.
Saxton, K. E., Rawls, W., Romberger, J. S., and Papendick, R. I. (1986). Estimating generalized soil-water characteristics from texture. Soil Sci. Soc. Am. J. 50 (4), 1031–1036. doi:10.2136/sssaj1986.03615995005000040054x
Schaefer, K., Liu, L., Parsekian, A., Jafarov, E., Chen, A., Zhang, T., et al. (2015). Remotely sensed active layer thickness (ReSALT) at Barrow, Alaska using interferometric synthetic aperture radar. Remote Sens. 7 (4), 3735–3759. doi:10.3390/rs70403735
Shiklomanov, N. I., Streletskiy, D. A., Nelson, F. E., Hollister, R. D., Romanovsky, V. E., Tweedie, C. E., et al. (2010). Decadal variations of active-layer thickness in moisture-controlled landscapes, Barrow, Alaska. J. Geophys. Res. Biogeosciences 115 (G4). doi:10.1029/2009jg001248
Siewert, M. B., Lantuit, H., Richter, A., and Hugelius, G. (2021). Permafrost causes unique fine-scale spatial variability across tundra soils. Glob. Biogeochem. Cycles 35 (3), e2020GB006659. doi:10.1029/2020gb006659
Soil Survey Staff (2024). Natural Resources conservation service, United States department of agriculture. Web Soil Surv.
Srivastava, H. S., Patel, P., and Navalgund, R. R. (2006). “How far SAR has fulfilled its expectation for soil moisture retrieval,” in Microwave remote sensing of the atmosphere and environment V (SPIE), 6410. doi:10.1117/12.693946
Stern, M., Ferrell, R., Flint, L., Kozanitas, M., Ackerly, D., Elston, J., et al. (2024). Fine-scale surficial soil moisture mapping using UAS-based L-band remote sensing in a mixed oak-grassland landscape. Front. Remote Sens. 5, 1337953. doi:10.3389/frsen.2024.1337953
Swanson, D. K. (2021). Start of the green season and normalized difference vegetation index in Alaska’s Arctic National Parks. Remote Sens. 13 (13), 2554. doi:10.3390/rs13132554
Vas, D. A., West, J. R., Brodylo, D., Barker, A. J., Baxter, W. B., and Barbato, R. A. (n.d.). Effects of permafrost thaw on seasonal soil CO2 efflux dynamics in a boreal forest site (in review).
Vreugdenhil, M., Greimeister-Pfeil, I., Preimesberger, W., Camici, S., Dorigo, W., Enenkel, M., et al. (2022). Microwave remote sensing for agricultural drought monitoring: recent developments and challenges. Front. Water 4, 1045451. doi:10.3389/frwa.2022.1045451
Western, A. W., Zhou, S. L., Grayson, R. B., McMahon, T. A., Blöschl, G., and Wilson, D. J. (2004). Spatial correlation of soil moisture in small catchments and its relationship to dominant spatial hydrological processes. J. Hydrology 286 (1-4), 113–134. doi:10.1016/j.jhydrol.2003.09.014
Whitcomb, J., Clewley, D., Colliander, A., Cosh, M. H., Powers, J., Friesen, M., et al. (2020). Evaluation of SMAP core validation site representativeness errors using dense networks of in situ sensors and random forests. IEEE J. Sel. Top. Appl. earth observations remote Sens. 13, 6457–6472. doi:10.1109/jstars.2020.3033591
Yoshikawa, K., Overduin, P. P., and Harden, J. W. (2004). Moisture content measurements of moss (Sphagnum spp.) using commercial sensors. Permafr. Periglac. Process. 15 (4), 309–318. doi:10.1002/ppp.505
Zakharov, I., Kapfer, M., Hornung, J., Kohlsmith, S., Puestow, T., Howell, M., et al. (2020). Retrieval of surface soil moisture from Sentinel-1 time series for reclamation of wetland sites. IEEE J. Sel. Top. Appl. Earth Observations Remote Sens. 13, 3569–3578. doi:10.1109/jstars.2020.3004062
Zhang, Z., and Furman, A. (2021). Soil redox dynamics under dynamic hydrologic regimes-A review. Sci. Total Environ. 763, 143026. doi:10.1016/j.scitotenv.2020.143026
Zwieback, S., and Berg, A. A. (2019). Fine-scale SAR soil moisture estimation in the subarctic tundra. IEEE Trans. Geoscience Remote Sens. 57 (7), 4898–4912. doi:10.1109/tgrs.2019.2893908
Zwieback, S., Colliander, A., Cosh, M. H., Martínez-Fernández, J., McNairn, H., Starks, P. J., et al. (2018). Estimating time-dependent vegetation biases in the SMAP soil moisture product. Hydrology Earth Syst. Sci. 22 (8), 4473–4489. doi:10.5194/hess-22-4473-2018
Keywords: soil moisture, synthetic aperture radar (SAR), geophysics, permafrost active layer, spatial autocorrelation, in situ, sentinel-1, Soil Moisture Active Passive (SMAP)
Citation: Baxter WB, Hoppinen Z, Lasko K, Meehan T, Brodylo D, Sullivan TD, Barker AJ and Douglas TA (2025) Using spaceborne SAR and ground-based measurements to identify spatial patterns in soil moisture and seasonal thaw timing in permafrost environments of Alaska. Front. Remote Sens. 6:1579261. doi: 10.3389/frsen.2025.1579261
Received: 19 February 2025; Accepted: 29 April 2025;
Published: 30 May 2025.
Edited by:
Kun-Shan Chen, Nanjing University, ChinaReviewed by:
Weitao Chen, China University of Geosciences Wuhan, ChinaYing Yang, Nanjing University, China
Copyright © 2025 Baxter, Hoppinen, Lasko, Meehan, Brodylo, Sullivan, Barker and Douglas. This is an open-access article distributed under the terms of the Creative Commons Attribution License (CC BY). The use, distribution or reproduction in other forums is permitted, provided the original author(s) and the copyright owner(s) are credited and that the original publication in this journal is cited, in accordance with accepted academic practice. No use, distribution or reproduction is permitted which does not comply with these terms.
*Correspondence: W. Brad Baxter, d2lsbGlhbS5iLmJheHRlckB1c2FjZS5hcm15Lm1pbA==