 Manizheh Rajab Pourrahmati1*
 Guerric Le Maire2,3
 Nicolas Baghdadi1
 Clayton Alcarde Alvares4,5
 José Luis Stape5
 Henrique Ferraco Scolforo4
 Otávio Camargo Campoe6
 Yann Nouvellon2,3
 Joannès Guillemot2,3,7
- 1CIRAD, CNRS, INRAE, TETIS, University of Montpellier, AgroParisTech, Montpellier, France
- 2CIRAD, UMR Eco&Sols, Montpellier, France
- 3Eco&Sols, CIRAD, INRAE, IRD, Institute Agro, University Montpellier, Montpellier, France
- 4Suzano SA, Limeira, São Paulo, Brazil
- 5Department of Forest, Soil and Environmental Sciences Sao Paulo State University (UNESP), Botucatu, Brazil
- 6Department of Forest Sciences, Federal University of Lavras (UFLA), Lavras, Minas Gerais, Brazil
- 7Department of Forest Sciences, ESALQ, University of São Paulo, São Paulo, Brazil
Accurate estimates of stand volume dynamics in Eucalyptus plantations is critical for sustainable forest management and wood production. This study investigates the integration of MODIS-derived indices, such as gross primary productivity (GPP), net photosynthesis (PSN) and normalized difference vegetation index (NDVI), with traditional age-based methods to improve stand volume estimation in Eucalyptus plantations. MODIS GPP was first evaluated against flux tower measurements, showing moderate agreement and systematic biases, particularly during periods of highest and lowest productivity in the first years after planting, with an RMSE of 19.65 gC m-2 8day-1 and R2 of 0.38. Multiple linear regression (MLR) and two machine learning models, including random forest (RF) and stochastic gradient boosting (SGB), were used to estimate stand volume by incorporating cumulative MODIS indices (Cgpp, Cpsn and Cndvi) and stand age. The SGB model showed the best performance using the full dataset, including stands aged from 1.6 to 8.4 years, with an RMSE of 22.63 m3 ha-1, an rRMSE of 17.15% and an R2 of 0.90. We showed that including cumulative indices from the first two years of growth significantly improved the model’s ability to predict growth dynamics in middle-aged to mature stands. These results highlight the utility of MODIS productivity products for medium to large-scale plantation management, providing scalable and cost-effective monitoring of stand volume.
1 Introduction
Forest plantations play an important economic and environmental role around the world. They contribute significantly to carbon sequestration, timber production and the supply of raw materials for industries such as paper, pulp and wood-based products. In 2023, the total area of planted trees in Brazil exceeded 10 million ha for the first time. Eucalyptus was the most common type of tree planted, covering 7.8 million hectares and accounting for 76% of the total area planted. This represents an increase of 41% over the last 10 years, highlighting the growing importance of this crop in the Brazilian forest economy (IBÁ - Indústria Brasileira de Árvores, 2024).
Timber production remains the primary ecosystem service of Eucalyptus plantations, and accurate assessments of stand productivity are critical for effective forest management. Traditionally, these assessments rely on field inventories to measure tree attributes such as diameter at breast height (DBH) and height. However, such methods are labor intensive, costly, spatially limited and often fail to capture variation caused by climatic anomalies. These challenges are particularly pronounced in fast-growing plantations, where cutting cycles for Eucalyptus can be as long as 5–7 years, depending on climatic and regional conditions.
Moreover, inventories are generally conducted by plantation owners and primarily used for wood stock calculations within business operations. However, tree growth databases hold broader significance, particularly for modelling applications in regional- and large-scale analyses (Alvares et al., 2023). Such analyses are important to understand broader patterns of Eucalyptus plantation dynamics, evaluate their environmental and socio-economic impacts, and support the development of regional policies for sustainable forest management.
Advances in remote sensing technologies have facilitated forest inventory and management practices, particularly in Eucalyptus plantations (e.g., Aló et al., 2024; Baghdadi et al., 2015; 2014; Dos Reis et al., 2019; 2018; Dube et al., 2017; Goral et al., 2025; Leite et al., 2020). Techniques such as LiDAR and synthetic aperture radar (SAR) effectively capture detailed structural information (Austin et al., 2003; Domingues et al., 2023; Fayad et al., 2021b; Gama et al., 2010), though their high cost and limited accessibility remain challenges. Freely available datasets such as NASA’s GEDI LiDAR and ESA’s Sentinel-1 SAR have improved accessibility, but processing these data still requires expertise and computational resources. Optical remote sensing offers a cost-effective alternative for large-scale monitoring, using vegetation indices like the normalized difference vegetation index (NDVI) and time-series analyses to estimate productivity and biomass. However, its effectiveness is limited by reflectance signal saturation in dense, high-biomass forests, which weakens the relationship between spectral reflectance and biomass. To address these limitations, studies have integrated optical and active remote sensing datasets to estimate Eucalyptus stand volume (Dos Reis et al., 2019; Souza et al., 2019). Combining these technologies with machine learning algorithms and integrating spatial, temporal, environmental and structural data further enhances prediction accuracy (e.g., Dube and Mutanga, 2016).
Age since planting gives a direct indication of plantation growth and volume in Eucalyptus plantations (Dos Reis et al., 2019). Therefore, integrating age with remote sensing parameters can greatly improve the accuracy of the estimate. Dos Reis et al. (2019) demonstrated that integrating stand age with multispectral (Landsat 8 OLI), SAR (Sentinel-1B), and DEM-derived data significantly enhanced Eucalyptus volume estimation accuracy (RMSE = 22.33 m3 ha−1), highlighting its potential for large-scale plantation monitoring and management. Another study by Le Maire et al. (2011) showed that the integration of MODIS-derived NDVI time series with bioclimatic data and stand age significantly improved the accuracy of stand-scale Eucalyptus volume (R2 = 0.90, RMSE = 25 m3 ha−1) and height predictions (R2 = 0.92, RMSE = 1.6 m). A recent study demonstrated similar results at a higher resolution (within-stand scale) (Aló et al., 2024). It combined NDVI time series from Landsat, from planting to inventory dates, with spatial modeling techniques such as kriging with external drift (KED) and generalized additive models (GAM). This approach significantly improved within-stand spatial predictions of Eucalyptus stem volume at a 30 m resolution. The best linear model achieved an R2 of 0.95 and RMSE of 12.44 m3 ha−1, while KED and GAM further improved accuracy to R2 of 0.96 and RMSE of 10.6 m3 ha−1. Marsden et al. (2010) investigated the relationships between MODIS NDVI time series covering the full rotation of Eucalyptus plantations in Sao Paulo State, Brazil, and stand characteristics such as volume, dominant height and mean annual increment. Their results showed strong correlations between cumulative NDVI and stem volume, highlighting the potential of NDVI as a productivity indicator. In addition, absorbed photosynthetic active radiation (APAR) derived from NDVI time series showed significant variability during the first 2 years of growth and was strongly correlated with stem wood production (R2 = 0.78). However, in later years APAR became less variable and showed a weaker relationship with biomass increment. These results highlight the value of integrating parameters such as age, NDVI and APAR to improve the accuracy of eucalyptus volume estimates, particularly during early growth stages when productivity metrics are most dynamic.
Given the strong relationship between forest productivity and carbon sequestration, accurate estimation of stand volume not only informs timber yield assessments but also informs on ecosystem functioning. In the volume estimations described above, the influence of environmental conditions is incorporated into the predictions only if these factors affect one of the predictors, such as NDVI or APAR time series. However, other environmental variables—such as temperature, radiation, or soil water content—may influence growth and, consequently, volume, but their effects may not be strong enough to significantly alter the remotely sensed variables, and thus they are not reflected in the predictions. This highlights the need to incorporate more effective forest growth indicators into the models—indicators that can more comprehensively account for environmental conditions. In this context, gross primary production (GPP) is a key indicator of ecosystem productivity, representing the total amount of carbon fixed by vegetation through photosynthesis. GPP can be estimated by measuring CO2 exchange between ecosystems and the atmosphere using eddy covariance techniques (Baldocchi et al., 2001; Chen et al., 2015; Mayen et al., 2023). However, the limited and sparse distribution of flux tower sites restricts their ability to provide continuous spatial data for GPP estimation (Mayen et al., 2023). The increasing availability of high spectral resolution satellite observations with global coverage and high temporal frequency has enabled the scientific community to revisit a number of existing approaches to modelling GPP (e.g., Plummer, 2006; Serbin et al., 2013; Running and Zhao, 2021). The US National Aeronautics and Space Administration (NASA) Earth Observing System (EOS) currently produces a regular global estimate of daily GPP, net photosynthesis (PSN), and annual net primary production (NPP) of the entire terrestrial earth surface at 500 m resolution. The core science of the GPP algorithm is an application of radiation conversion efficiency concept to predictions of daily GPP, using satellite-derived FPAR (the fraction of incident photosynthetically active radiation that is absorbed by the vegetation canopy, from MOD15), independent estimates of PAR, and other surface meteorological fields (GMAO/NASA). The subsequent estimation of maintenance and growth respiration terms is then subtracted from GPP to determine the annual NPP (Running and Zhao, 2021).
Several studies have evaluated the performance of MODIS GPP and FPAR products, examining their accuracy and applicability across various ecosystems and regions (e.g., Turner et al., 2006; Majasalmi et al., 2015; Yan et al., 2016; Wang and Mo, 2015; Wang et al., 2017; Brown et al., 2020; Sanchez-Azofeifa et al., 2024). For instance, a study evaluating MODIS GPP product (MOD17A2, 1,000 m resolution) across different forest ecosystems showed that while MODIS effectively captures broad GPP trends at an 8-day timescale for most forest types, its performance varies significantly among biomes. The product showed higher accuracy for deciduous broadleaf forests (DBF) and mixed forests (MF), moderate accuracy for evergreen needleleaf forests (ENF), and weaker performance for evergreen broadleaf forests (EBF). Seasonal analyses showed the best performance in ENF, followed by MF and DBF, with EBF lagging behind. These results highlight the need for improved upstream inputs and algorithm refinement to improve MODIS GPP estimates, especially for complex forest ecosystems (Tang et al., 2015). An evaluation of the MODIS GPP product MOD17A2H at 500 m resolution, using FLUXNET2015 data from 18 global sites across six ecosystems, revealed poor performance in estimating annual (R2 = 0.62) and 8-day (R2 = 0.52) GPP values, primarily due to errors in FPAR inputs (Wang et al., 2017). Specific causes of the low performance of MODIS GPP have been traced to algorithmic inputs, including the quality of meteorological data derived from coarse resolution datasets (Tang et al., 2015; Wang et al., 2017), errors in LAI and FPAR inputs (Propastin et al., 2012; Tang et al., 2015; Eenmäe et al., 2014), inaccuracies in land cover classification (Nilson et al., 2012; Krause et al., 2022), and light use efficiency calculated based on biome-specific physiological parameters (Wei et al., 2017; Pei et al., 2022).
Studies have shown the correlation between GPP and biomass growth during active growing seasons, particularly in specific ecosystems and under optimal conditions (Babst et al., 2014; Puchi et al., 2024). However, the strength and consistency of this relationship vary significantly across forest types and regions, influenced by factors such as species composition, climatic conditions, nutrient availability, and carbon allocation strategies (Ryan et al., 2010; Epron et al., 2012; Malhi et al., 2015). GPP reflects the total amount of carbon fixed through photosynthesis, but not all of this carbon is allocated to tree growth. Significant portions are used for the production and replacement of short-lived organs such as leaves and fine roots, and for autotrophic respiration, where carbon is used by the plant for maintenance and metabolic processes, rather than growth (Litton et al., 2007; Nouvellon et al., 2012; Rodrigues et al., 2021). Moreover, carbon allocation changes over time depending on factors such as tree age, environmental conditions, and resource availability (Ryan et al., 2004; Franklin et al., 2012; Guillemot et al., 2017). As a result, a direct correlation between GPP and forest volume increment can lead to large errors, including overestimating carbon sequestration potential.
While MODIS GPP has been widely validated across different forest ecosystems, as mentioned above, its performance in Eucalyptus plantations remains largely unexplored. Eucalyptus stands exhibit distinct physiological and structural traits, including high productivity, rapid biomass accumulation, and unique carbon allocation dynamics, which differ significantly from other forest types. Furthermore, existing volume estimation models for Eucalyptus plantations primarily rely on age-based approaches, which, although useful, fail to capture interannual variations driven by environmental factors such as drought stress, nutrient limitations, and site conditions. Some models use vegetation indices, which may include part of these environmental effects, but not entirely. Given that remote sensing-derived GPP accounts for dynamic environmental influences on productivity, integrating GPP within stand volume estimation models could improve predictions by incorporating environmental spatial and temporal variability that may not already be included in the vegetation indices. However, the extent to which MODIS GPP can enhance age-based and VI-based models for Eucalyptus volume estimation remains an open question.
This study aims to address these gaps by evaluating the utility of the latest version of the MODIS GPP product (MOD17A2HGF v061) in estimating Eucalyptus stand volume. The specific objectives were (a) to evaluate the accuracy of MOD17A2HGF derived GPP by comparing it to GPP obtained from eddy covariance flux tower measurements over Eucalyptus plantations; (b) to improve traditional age-based or VI-based Eucalyptus stand volume estimation by incorporating information on GPP (or PSN) derived from MODIS products; (c) to evaluate the performance of different machine learning methods for estimating Eucalyptus stand volume based on integrated remote sensing and field data.
2 Materials and methods
2.1 Study area and data collection
2.1.1 Study area
This research was carried out in Eucalyptus plantations in Mato Grosso do Sul state located in the southwestern Brazil. The climate of Mato Grosso do Sul can be classified as tropical wet and dry or savannah according to the Köppen climate classification. This results in hot, humid summers and mild to warm, dry winters. Throughout the year, the average temperature is between 20°C and 28°C (Alvares et al., 2013). Mato Grosso do Sul covers an area of approximately 35 million ha in a flat region with an altitude of 250–400 m. Eucalyptus plantations cover 1.3 million ha in this region (IBÁ - Indústria Brasileira de Árvores, 2024), and primarily consist of clonal seedlings of Eucalyptus grandis (W. Hill ex Maiden), E. urophylla (S.T. Blake), and various hybrids, planted in rows at densities of 1,200 trees per hectare. The average wood productivity is 40–45 m3 ha−1 year−1, with 80% of stands producing between 30 and 50 m3 ha−1 year−1 (Fayad et al., 2021a). The homogeneity of the stand is a key management objective, as it has a direct impact on the productivity of the stand (Stape et al., 2010). The plantations are managed at the stand level, with standardized practices including planting, harvesting, weed control, soil preparation, fertilization, and the use of consistent genetic materials. Over 82% of these plantations are located on flat to gently sloping terrains to minimize harvesting and logging costs (Fayad et al., 2021a).
2.1.2 In-situ stand scale measurement
The inventory data were collected in Eucalyptus plantations within inventory plots of 400 m2, laid out in a quasi-systematic grid at a density of approximately one plot every 10 ha. In each plot, the diameter at breast height (DBH) of all trees, the height of a central sub-sample of 10 trees and the height of the four trees with the largest DBH were measured. Individual tree volume was then calculated using volume equations such as the methodology presented by Nouvellon et al. (2012). Stand-level volume was determined by averaging all measured plots within each stand.
The field measurements were conducted at different stand ages, corresponding to the time elapsed since the planting date. There was no single measurement date for all stands; instead, each stand had a specific measurement date, recorded alongside its planting date from forest management records. The dataset included repeated measurements at different stand ages for some stands, with over 7,000 stands measured across the study area. The distribution of stand ages is shown in Figure 1.
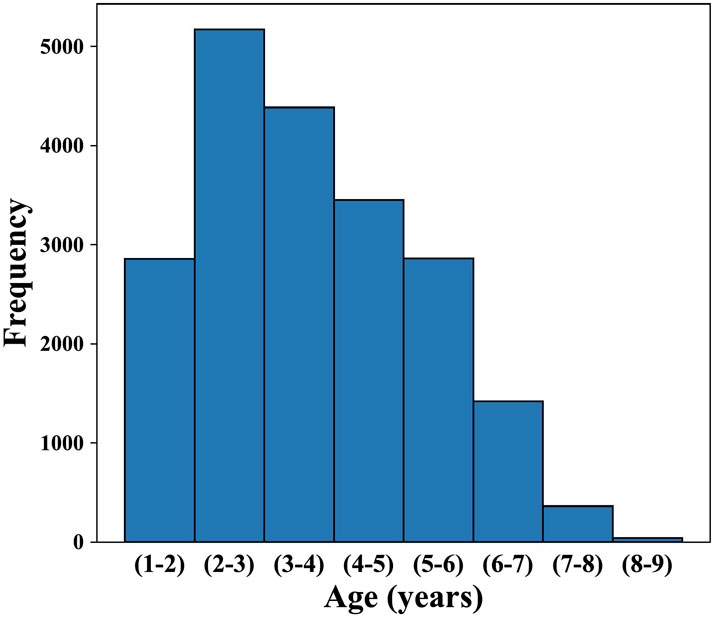
Figure 1. Distribution of stand age across the study area.
2.1.3 Eddy covariance flux tower data
The in-situ GPP data were collected using an eddy covariance (EC) flux tower, in the framework of the Eucflux cooperative research project (Guillemot et al., 2018) conducted by the Forestry Science and research Institute (IPEF). This tower is located in southwestern Brazil (22°58′04″S; 48°43′40″W, 750 m.a.s.l.) in a flat and homogeneous 200 ha Eucalyptus plantation. Eddy-covariance measurements were carried out from the top of the tower with an open-path system consisting of a Li-COR LI-7500A infrared gas analyzer (IRGA; LICOR Inc., Lincoln, NE, United States) and a 3D sonic anemometer (81,000 V, Young, Traverse City, MI, United States). Half-hourly meteorological measurements (air temperature and relative humidity, wind speed and direction, atmospheric pressure, rainfall, global and net radiation) were made at the same height as the EC system (Christina et al., 2017). Over the study period, the height of the tower was adjusted every 6–12 months to keep the sensors 5–7 m above the canopy (or above the soil, in post-harvest period). Net ecosystem exchange (NEE) was derived from the covariance of vertical wind velocity and CO2 concentrations measured at a high frequency (20 Hz) and integrated over 30-min intervals (Aubinet et al., 2012). Quality-control, data gap-filling and partitioning of NEE into GPP and Ecosystem Respiration (Reco) was performed according to Lasslop et al. (2010). Continuous measurements were made from February 2008 to September 2024, resulting in a comprehensive half-hourly GPP dataset encompassing the end of a first rotation (2008–2009), one harvest period in 2009, a complete rotation from 2009 to 2018, a second harvest in 2018, and the first years of the next rotation (2018–2024).
2.1.4 MODIS GPP product
The MOD17A2HGF version 6.1 Gross Primary Productivity (GPP) product provides cumulative 8-day composite data at a spatial resolution of 500 m. This product, derived from the radiation use efficiency model, serves as a valuable input for various data models used to analyze terrestrial energy, carbon, and water cycle processes, as well as vegetation biogeochemistry. It includes estimates of GPP and net photosynthesis (PSN), expressed in units of “kg C m−2 8 day−1.” The PSN values are calculated by subtracting maintenance respiration (MR) from GPP. The gap filled product of MOD17A2HGF is an improved MOD17, which is created annually after the complete 8-day MOD15A2H dataset becomes available. In this product, poor-quality inputs from 8-day leaf area index (LAI) and FPAR has been corrected based on pixel-specific quality control (QC) information (Running and Zhao, 2021). The resulting 8-day products, beginning in 2000 and continuing to the present, are archived at a NASA DAAC (distributed active archive center).
2.1.5 MODIS NDVI
The MCD43A4 V6.1 nadir bidirectional reflectance distribution function adjusted reflectance (NBAR) product provides 500 m resolution reflectance data for MODIS land bands 1–7. These reflectance values are adjusted using a bidirectional reflectance distribution function (BRDF) to represent observations as if collected from a nadir view. The product is generated daily using a 16-day retrieval period, with the reference date corresponding to the ninth day (Strahler et al., 1999). While the data are atmospherically corrected and cloud-free within the temporal aggregation period, there are some gaps in regions with persistent cloud cover or insufficient observations. To address these gaps, NDVI values calculated using red and near-infrared reflectance bands were linearly interpolated to a daily temporal resolution, a process performed as part of this study to produce a complete annual time series for the study period. To further improve data precision while preserving trends, the time series were smoothed using a Savitzky-Golay filter (Gallagher, 2020).
The overall data processing workflow is summarized in Figure 2.

Figure 2. Overview of the data processing workflow. Parallelograms represent input and output data; rectangles represent processing steps; ellipses indicate derived key variables.
2.2 Evaluation of GPP from MOD17A2HGF
The MODIS GPP product (MOD17A2HGF) was evaluated using in-situ GPP data from the eddy covariance flux tower. The flux tower is located within a MODIS pixel with a 500 m resolution, and the pixel is considered to be pure, meaning it predominantly represents the plantation area of interest (200 ha). The GPP value from this single MODIS pixel was used for direct comparison with the flux tower data. To align the time scales, half-hourly flux tower data were aggregated into 8-day periods for comparison with MODIS GPP. Both datasets were analyzed over the period covered by the flux tower measurements. The trends of the MODIS GPP and flux tower GPP were examined, and statistical metrics, including root mean square error (RMSE) and R2, were calculated to assess the accuracy and correlation between the two datasets.
2.3 Stand scale volume estimation
2.3.1 Data preparation
The stem volume of Eucalyptus stands at a given date, obtained from field inventories, was compared to the volume estimated from MODIS derived indices and plantation age. This comparison is possible only if the MODIS pixel is representative of the stand. Eucalyptus plantations are generally considered homogeneous at the stand-scale in terms of volume per hectare. This is largely due to regular planting of a single genotype, which is typically clonal, and the uniform stand age, as each stand follows a single silvicultural calendar. As a result, management practices remain consistent throughout the growth cycle. MODIS pixels have a spatial resolution of 500 m, which can limit the number of pixels that are fully contained within individual stands. In order to increase the number of possible comparisons between MODIS data and stand volume, we applied a spatial filtering approach that retained only the stands and MODIS pixels where at least 90% of the pixel area overlapped with a single stand. To achieve this, we overlaid the MODIS raster image on the shapefile layer of stands and computed the spatial intersection between each stand polygon and the corresponding MODIS pixels. Pixels with an overlap ratio of ≥90% were retained for further analysis. This filtering process resulted in 4,130 pixels distributed across 1,303 stands. The spatial distribution of Eucalyptus stands and the selected MODIS pixels within stands is illustrated in Figure 3.
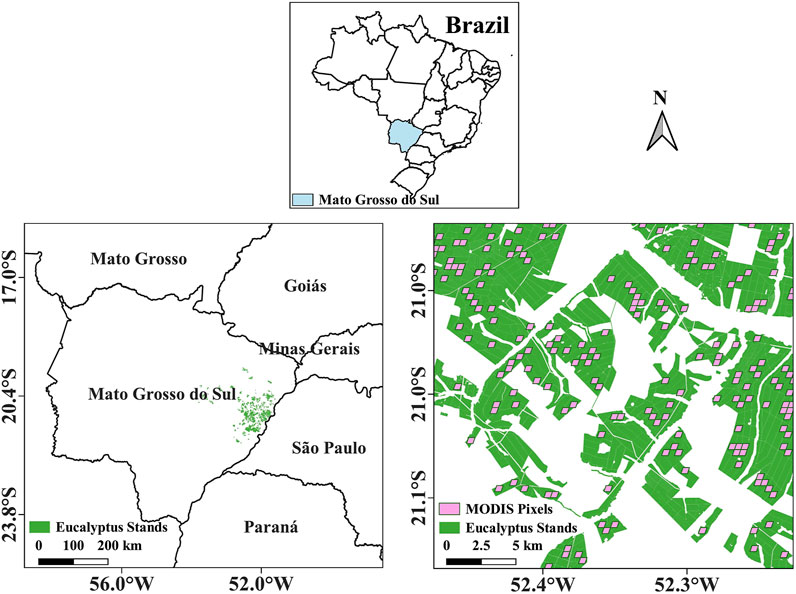
Figure 3. Spatial distribution of Eucalyptus stands and selected MODIS pixels within the study area.
2.3.2 Statistical modeling
Time series of MODIS products (GPP, PSN, and NDVI) were extracted specifically for the pure MODIS pixels identified previously to capture the growth dynamics of the stands. These particular MODIS variables were selected because they directly reflect vegetation productivity and photosynthetic activity, aligning with the objective of evaluating MODIS-derived metrics for improving volume estimation. Other MODIS indices (e.g., EVI, LAI) and external environmental variables (e.g., temperature, precipitation) were not included, as this study focused on assessing the added value of GPP and related indices beyond age-based models.
For each stand, cumulative values of the MODIS indices (e.g., GPP, PSN, and NDVI) were calculated from the planting date to the measurement date (referred to as Cgpp, Cpsn, and Cndvi, respectively). Statistical modelling was performed on different groups of datasets: (1) the entire data set, which includes the entire age range from 1.6 to 8.4 years (n = 4,130), (2) stands older than 3 years (n = 2,488), (3) stands older than 4 years (n = 1,582), and (4) stands older than 5 years (n = 933). We did not create a separate group for stands older than 2 years because the entire dataset (group 1) already includes stands of all ages, and our focus was to examine the effect of growth stage-specific variables on middle-aged and mature stands. We selected age thresholds of 3, 4, and 5 years to incorporate more cumulative variables and better capture growth dynamics at these stages. The analysis was not extended to stands older than 6 years because the number of samples decreased significantly with each additional age filter, limiting the reliability of the results for older age groups.
For the first group, cumulative MODIS indices were also calculated up to 1 year after the planting date. For groups 2–4, additional cumulative indices were calculated from the planting date to 1–N years after planting, where N corresponds to the minimum age of the group (i.e., N = 3, 4, and 5 for stands older than 3, 4, and 5 years, respectively). This approach was adopted to capture detailed growth patterns and dynamics over shorter time intervals, which may not be fully reflected in the overall cumulative variables. By including these intermediate cumulative variables, we aimed to account for variations in growth rates across different stages of stand development. These intermediate variables were ultimately incorporated into the statistical models to improve their ability to explain and predict stand volume. The extracted variables and their definitions are summarized in Table 1.
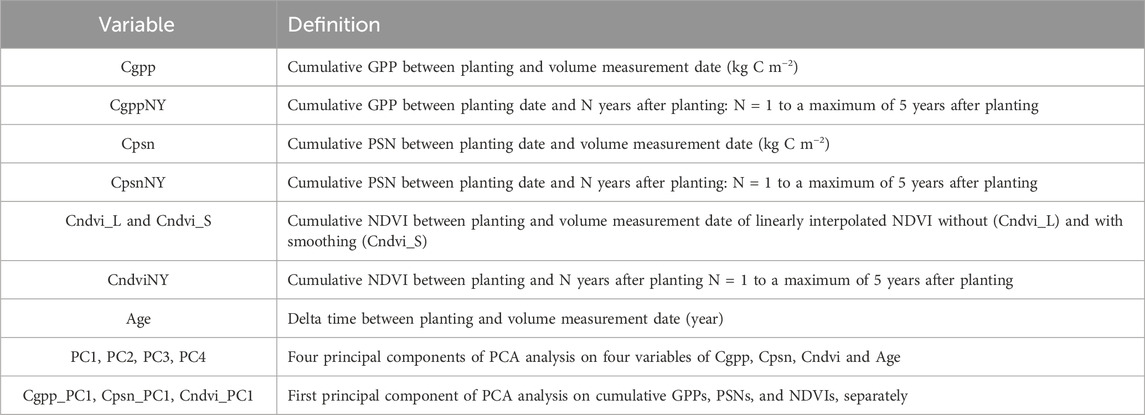
Table 1. Definition of variables used for Eucalyptus stand volume estimation.
Two non-parametric algorithms, stochastic gradient boosting (SGB) and random forest (RF), as well as multiple linear regression (MLR), were employed for Eucalyptus stand volume estimation. The models were developed and validated using a five-fold cross validation approach, which reduces the likelihood of overfitting by training and testing the models on multiple subsets of the dataset, ensuring their ability to generalize well to unseen data (Berrar, 2018; Charilaou and Battat, 2022).
SGB and RF are both non-linear ensemble learning methods based on decision trees, but they differ in their training strategies and handling of data variability. SGB employs a sequential boosting approach where each tree corrects the errors of its predecessor, leading to improved generalization but longer training times (Friedman, 2002). In contrast, RF utilizes bootstrap aggregation, where multiple decision trees are trained in parallel on random subsets of the data, resulting in faster training and greater robustness to noise and outliers (Breiman, 2001). Both models require careful hyperparameter tuning which was performed using RandomizedSearchCV. While SGB reduces variance through boosting, RF achieves stability by averaging multiple decision trees, making it well-suited for handling complex interactions and correlated inputs (Franklin et al., 2012; Talebiesfandarani and Shamsoddini, 2022). Both methods have been widely applied for Eucalyptus stand volume estimation, integrating age with environmental and spectral variables from satellite data. Examples include variables derived from MODIS NDVI time series and bioclimatic data (Le Maire et al., 2011); SPOT 5 spectral bands combined with rainfall metrics (Dube et al., 2017); Worldview-2 data alongside environmental variables such as rainfall, temperature, slope, aspect, elevation, soil wetness, and soil types (Dube and Mutanga, 2016); as well as Landsat-8 OLI or synthetic aperture radar (SAR) data (Dos Reis et al., 2019).
MLR is a parametric regression method that models the relationship between a dependent variable and multiple independent variables. It assumes a linear relationship between the predictors and the response variable. To address the multicollinearity among cumulative GPP, PSN, and NDVI variables, which is particularly critical for the stability and reliability of MLR models, principal component analysis (PCA) was applied separately to each set of cumulative variables and also to the combination of all variables. PCA transforms the original correlated variables into a set of uncorrelated components, with the first principal component (PC1) capturing the largest possible variance in the data, followed by additional components that successively account for the remaining variability (Çamdevýren et al., 2005; Gwelo, 2019). As the most informative and representative summary of the underlying variables, the first principal components of applying PCA on each set of variables were then used as inputs to the MLR models. We also applied PCA on combination of four different variables (Cgpp, Cpsn, Cndvi, Age) and used all four output components in the linear model after removing the problem of collinearity. It is worth nothing that, unlike typical PCA applications that reduce dimensionality by selecting only a few PCs, we retained all four principal components in our model. This approach effectively eliminated collinearity while ensuring that all information from the original variables was preserved. High collinearity among predictors can lead to inflated standard errors, unstable coefficient estimates, and unreliable conclusions. By using the PCs, which are uncorrelated, we ensured that the regression coefficients were more stable and reliable, allowing for more accurate model interpretation.
The statistical criteria for model performance evaluation, including RMSE, relative RMSE (rRMSE), and R2, were computed using Equations 1–3.
Where
3 Results
3.1 Comparison of MODIS GPP with flux tower data
The temporal dynamics of MODIS and flux tower GPP, and MODIS NDVI across 8-day intervals over 14 years are illustrated in Figure 4. While MODIS and flux tower GPP follow similar seasonal patterns, some discrepancies are apparent, particularly during periods of high productivity where MODIS tends to underestimate GPP compared to the flux tower. In Eucalyptus plantations, trees are typically harvested on a 6–8 years cycle. The pronounced drops in GPP observed in 2010 and 2018 correspond to these harvesting events. MODIS derived GPP appears to be noisy and potentially less accurate during the first year of stand growth, as evidenced by an overestimation of GPP compared to the flux tower (see the red circled areas in Figure 4). The NDVI trends (Figure 4B) show less pronounced fluctuations over time, particularly after reaching a threshold of canopy closure. NDVI primarily reflects the greenness and density of vegetation cover, saturating when the canopy reaches full closure. On the other hand, GPP is influenced not only by the vegetation cover but also by other environmental factors, such as radiation, temperature, and water availability, which drive photosynthesis. These factors introduce greater variability into GPP, especially during periods of high productivity or environmental stress.
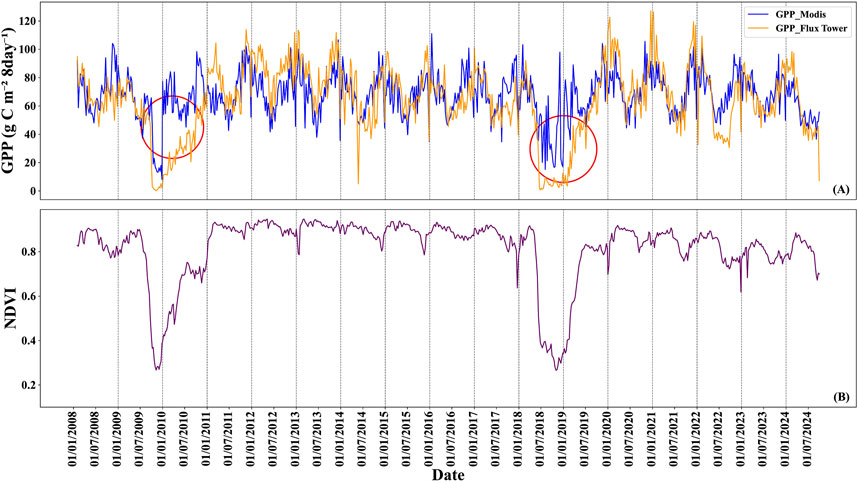
Figure 4. Dynamics of MODIS and flux tower GPP (A) and MODIS NDVI (B) during 2008–2024.
Figure 5, plots a and b show a scatter plot comparing MODIS and flux tower GPP values over 8-day and annual periods, respectively. It statistically validates the previously explained observations. The scatter plot comparing MODIS and flux tower GPP demonstrates a moderate level of agreement, with an R2 value of 0.38 and an RMSE of 19.65 g C m−2 8 day−1. Notably, systematic errors in the MODIS GPP estimation are evident. MODIS underestimates GPP at higher flux tower values, reflecting challenges in capturing peak productivity, and overestimates during periods of low GPP.

Figure 5. Comparison between MODIS and flux tower GPP at 8-day intervals (A) and annual (B) for the period 2008–2024. Note that full-year flux tower data for 2008 and 2024 are not available.
3.2 Stand volume estimation using variables at measurement date
The scatterplots in Figure 6 demonstrate the strong correlations between Eucalyptus stand volume and key variables derived from MODIS indices and stand age. The cumulative NDVI at measuring date (Cndvi) exhibited the highest correlation with volume (R2 = 0.81) followed by stand age with a correlation of R2 = 0.78. Cumulative GPP (Cgpp) also showed a notable correlation with stand volume (R2 = 0.74), suggesting its potential as a predictor of volume. While cumulative PSN (Cpsn) had a lower correlation (R2 = 0.52), it still indicates some relationship with stand volume. These relationships highlight the potential of time integrated MODIS indices and stand age as reliable indicators of Eucalyptus stand volume. Given the high correlation between volume and each variable, we explored whether combining multiple variables could improve predictive accuracy.

Figure 6. Correlation between Eucalyptus stand volume (m3 ha−1) and (A) stand age (years); (B) cumulative NDVI; (C) cumulative GPP (kg C m−2); and (D) cumulative PSN (kg C m−2). The cumulative of GPP, PSN and NDVI was calculated between the planting and volume measurement date.
The RF model demonstrated strong performance in predicting Eucalyptus stand volume, with the best model achieving an RMSE of 27.90 m3 ha−1, rRMSE of 21.15%, and R2 of 0.85 for the first group containing the entire data (Table 2). This model included the variables Cgpp, Cpsn, Cndvi_L, and Age. The variable importance analysis for this model, based on the %IncMSE method (Figure 7), ranked cumulative NDVI (Cndvi_L) as the most important variable, followed by cumulative GPP, stand age, and cumulative PSN. This order of importance aligns with the correlation strengths observed between volume and individual variables (Figure 6). A slightly simpler RF model, combining only Cgpp, Cndvi, and Age, showed comparable performance with an RMSE of 28.26 m3 ha−1, rRMSE of 21.42%, and R2 of 0.84. Similarly, the SGB model also demonstrated similar results. These findings suggest that cumulative PSN (Cpsn) adds limited improvement to predictive accuracy when combined with the other variables. It should be noted that during the NDVI extraction process (described in Section 2.1.5), two NDVI time series were evaluated: one generated through linear interpolation without smoothing (Cndvi_L) and the other using Savitzky-Golay smoothing (Cndvi_S). Both approaches gave similar prediction results. Therefore, in Table 2, results for both NDVI variables are presented only for some models to illustrate their comparability. For the remaining models, only the linearly interpolated NDVI is included to avoid redundant information.

Table 2. Performance metrics of MLR, RF and SGB models for predicting Eucalyptus stand volume (n = 4,130).
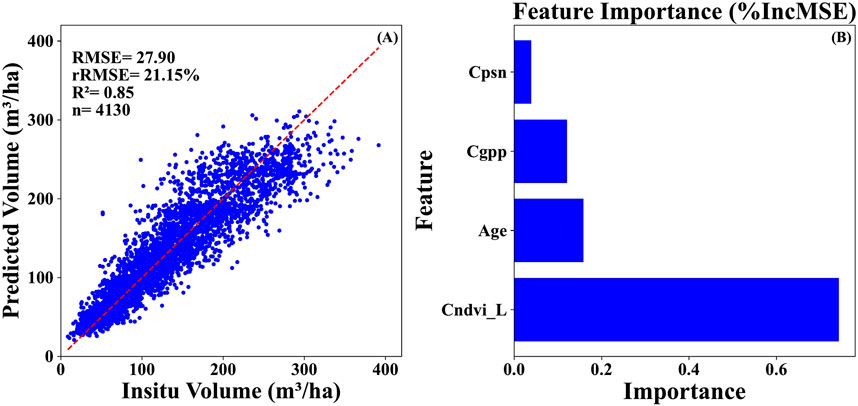
Figure 7. Random forest result for Eucalyptus stand volume. (A) Predicted versus observed volume. (B) Variable importance based on the %IncMSE method.
Due to the high multicollinearity among the variables, tested based on variance inflation factor (VIF), a PCA was performed to address this issue which is important for linear regression models (Gwelo, 2019). The best MLR result was obtained using the four principal components derived from PCA on variables Cgpp, Cpsn, Cndvi_L, and Age. This model achieved an RMSE of 29.59 m3 ha−1, rRMSE of 22.43%, and R2 = 0.83. Notably, the PCA approach reduced the VIF values for all predictors (PCA outputs) to 1, effectively eliminating multicollinearity. For reference, the original VIF values were 38.66 for Cgpp, 11.83 for Cpsn, 101.32 for Cndvi, and 77.29 for Age.
3.3 Impact of growth stage-specific variables on stand volume estimation
To better understand how changes in key variables over time affect stand volume estimation, we first examined the impact of including cumulative MODIS indices up to 1 year after plantation date for the entire dataset (first group, n = 4,130). By adding variables such as Cgpp1Y, Cpsn1Y, and Cndvi1Y_L alongside the existing predictors (Cgpp, Cpsn, Cndvi_L, and Age), significant improvements in model performance were observed. The RF model achieved an RMSE of 25.42 m3 ha−1 and an R2 of 0.87, while the SGB model exhibited superior accuracy with an RMSE of 22.63 m3 ha−1 and an R2 of 0.90 (Table 3). These results highlight the importance of cumulative indices from earlier growth stages in improving the overall prediction accuracy. Figure 8 illustrates the predicted volume using the SGB model versus the in-situ volume and the result of the feature importance analysis using the %IncMSE method.
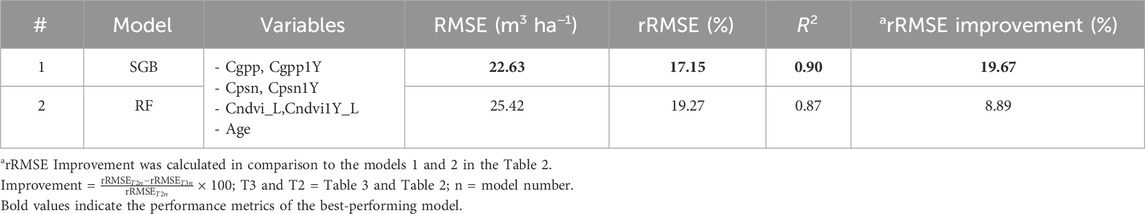
Table 3. Performance metrics of RF and SGB models for predicting Eucalyptus stand volume (n = 4,130).
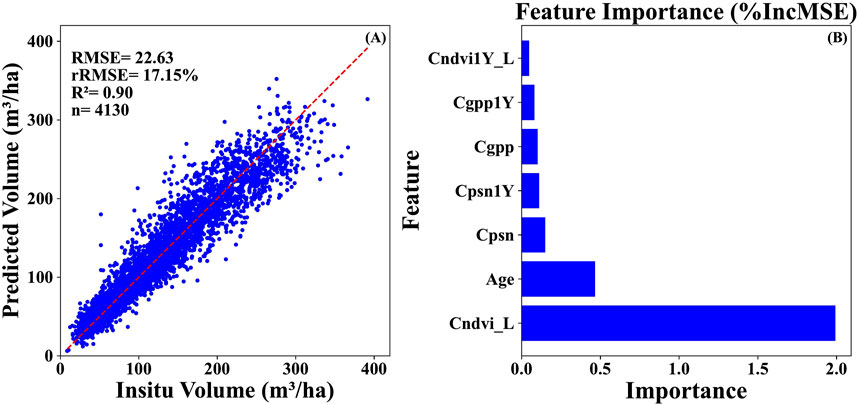
Figure 8. SGB result for Eucalyptus stand volume. (A) Predicted versus observed volume. (B) Variable importance based on the %IncMSE method.
The impact of hyperparameter tuning varied across models. For example, for the models presented in Table 3, performance remained stable for RF, with RMSE improving slightly from 25.71 m3 ha−1–25.42 m3 ha−1 (1.1%) and no change in R2 (0.87). These findings confirm that model robustness is more dependent on the quality of input data than on hyperparameter fine-tuning in this context. However, for SGB, tuning resulted in a more substantial improvement, reducing RMSE from 26.00 m3 ha−1–22.63 m3 ha−1 (13%) and increasing R2 from 0.87 to 0.90. This suggests that model robustness in this study depends more on the choice of the algorithm than on hyperparameter fine-tuning, with boosting-based models benefiting more from optimization.
Building on these findings, we conducted a detailed analysis of the cumulative MODIS indices across various growth stages by examining datasets representing stands older than 3, 4, and 5 years (groups 2–4, respectively). Both the RF and SGB models exhibited improvements in prediction accuracy as more cumulative indices were added. In general, the SGB algorithm outperformed the RF across all age groups, probably due to its adaptability and error-learning properties.
For stands older than 3 years (Table 4), the results showed that the inclusion of cumulative indices for the first and second year significantly (referring to the models number 2 and 3) improved model accuracy. However, adding cumulative values from the third year improved accuracy further, but to a lesser extent. The best result was obtained using the SGB model, which combines all cumulative variables from planting to the measurement date and also from planting to the third year of growth. This model gave an RMSE of 23.55 m3 ha−1, an rRMSE of 13.52% and an R2 of 0.84 (model 4). Figure 9 shows the scatter plot of the predicted volume versus true volume using model 4, and the order of feature importance for both RF and SGM models.
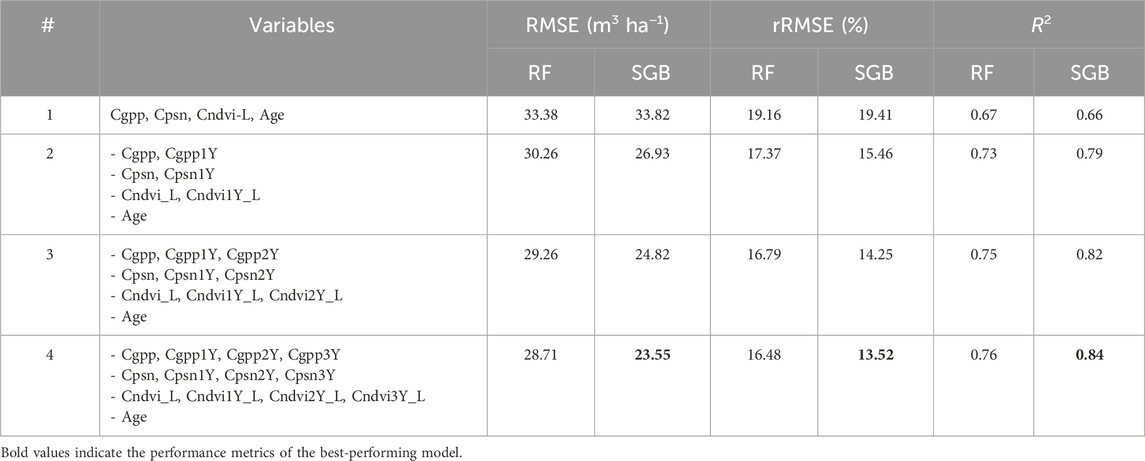
Table 4. Performance metrics of RF and SGB models for predicting Eucalyptus stand volume in stands older than 3 years (n = 2,488).
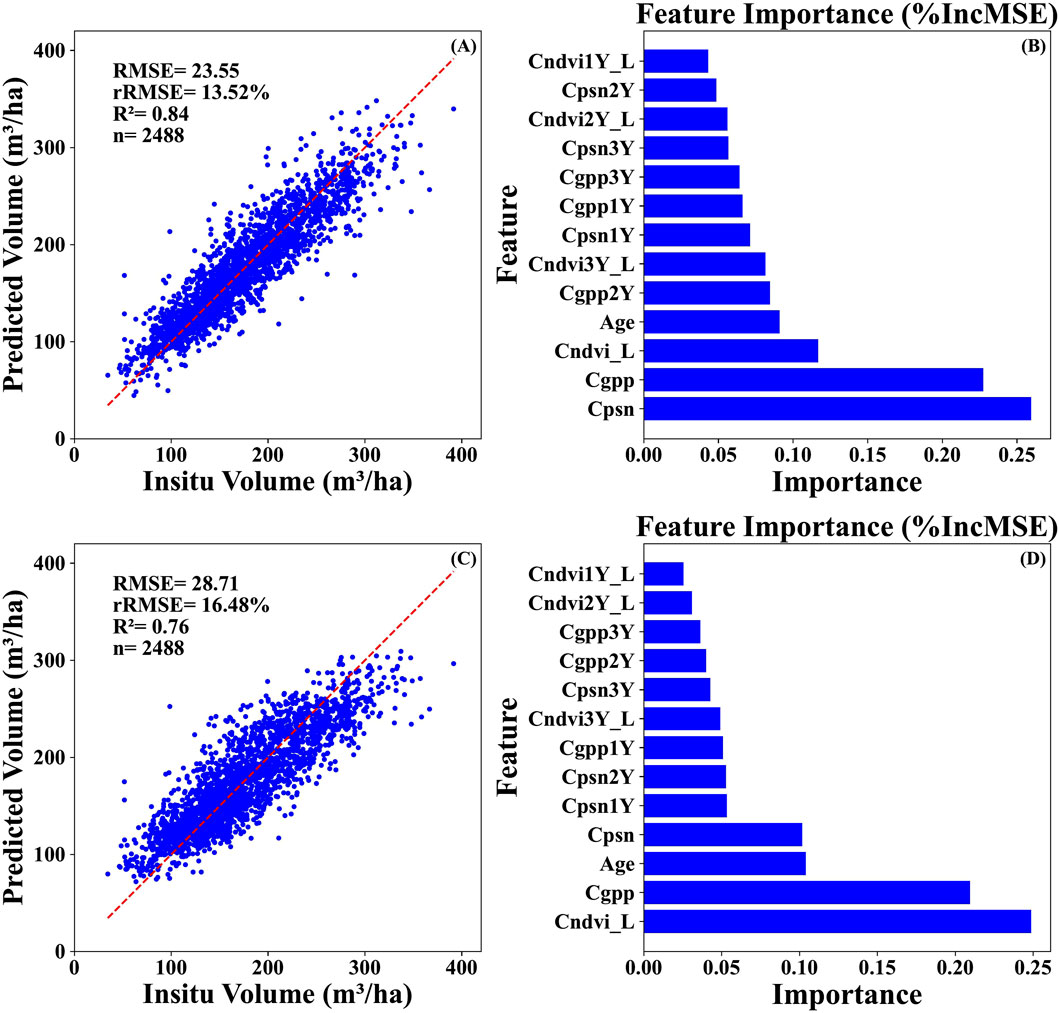
Figure 9. Predicted versus observed Eucalyptus stand volume for the SGB (A) and RF algorithms (C) for stands older than 3 years. Feature importance plots for the SGB and RF algorithms are shown in panels (B, D), respectively.
Interestingly, while direct correlations between stand volume and the predictor variables (cumulative NDVI, Age, cumulative GPP, and cumulative PSN) showed the strongest correlation for cumulative NDVI (Cndvi), followed by Age, cumulative GPP (Cgpp), and cumulative PSN (Cpsn), the SGB model ranked Cpsn as the most critical predictor. This was followed by Cgpp, Cndvi, and Age. Conversely, the RF model’s feature importance aligned more closely with the direct correlation results, with Cndvi ranked highest, followed by Cgpp, Age, and Cpsn. This inconsistency in the SGB model’s feature importance may be attributed to the algorithm’s sensitivity to interactions among predictors and the way it adjusts feature weights over successive boosting iterations. Cumulative NDVI, despite having the highest direct correlation with volume, might have interacted with other predictors in ways that reduced its relative importance in the SGB model.
Since the MLR models performed weaker than non-parametric models, as described in the previous section, our focus here is on understanding the effect of growth-stage variables over time on accuracy, which is better captured by the RF and SGB models. However, for completeness, the result of the MLR model using the first principal components of PCA analysis for cumulative GPPs, PSNs, and NDVIs produced an RMSE of 35.37, an rRMSE of 20.30%, R2 = 0.63, and R = 0.79. These weaker results reaffirm the greater efficacy of non-parametric approaches in capturing complex interactions between variables and improving predictive performance. Therefore, the detailed analysis presented in this section focuses exclusively on the RF and SGB models, which demonstrated overall superior accuracy.
For stands older than 4 years (Table 5), we included cumulative variables up to year 4 after plantation. As observed in the earlier group (older than 3 years), the inclusion of cumulative indices from the first 2 years was particularly influential in enhancing model performance. While the addition of cumulative data from the planting date to year 3 or from the planting date to year 4 further improved the accuracy, the improvements were less pronounced compared to the inclusion of indices from planting date to year 1 and 2. The best performance was obtained by combining cumulative variables from planting to measurement date and also from planting to year 4 and using the SGB model, which resulted in an RMSE of 27.38 m3 ha−1, an rRMSE of 13.62% and an R2 of 0.73 (model 5).

Table 5. Performance metrics of RF and SGB models for predicting Eucalyptus stand volume in stands older than 4 years (n = 1,582).
For stands older than 5 years, cumulative indices were analyzed up to the fifth year of growth. Referring to Table 6, the results reaffirm that while adding cumulative indices over successive years continues to improve predictive accuracy, the early growth period (especially years 1 and 2) remains the most critical for stand volume estimation. The accuracy improvements from including cumulative indices beyond the second year were still present, but the increase in accuracy was more moderate compared to earlier growth stages.

Table 6. Performance metrics of RF and SGB models for predicting Eucalyptus stand volume in stands older than 5 years (n = 933).
4 Discussion
4.1 Evaluation of MODIS GPP accuracy
The comparison between MODIS-derived GPP and flux tower measurements revealed that while MODIS captures the general seasonal trends, it underestimates high GPP values during periods of peak productivity and overestimates GPP during early regrowth stages. This systematic bias is consistent with findings in other ecosystems, including evergreen broadleaf forests (EBF), where MODIS GPP has been shown to underestimate high flux tower GPP values, especially during the peak of the vegetation period when canopy photosynthesis reaches its maximum (Tang et al., 2015; Wang et al., 2017).
The underestimation in MODIS GPP can be attributed to multiple factors, particularly the algorithmic saturation at high GPP levels. MODIS uses the light-use efficiency (LUE) model and relies on satellite-derived LAI/FPAR inputs, which are sensitive to canopy density. In highly productive ecosystems, such as Eucalyptus plantations, the MODIS algorithm becomes less sensitive to increases in photosynthesis as canopy density increases, resulting in an underestimation of GPP (Pu et al., 2024). The LUE is a plant functional type specific value. Eucalyptus plantations are an extreme case, with very high productivity clonal trees from a long history of breeding, fertilization, pest and disease control, site preparation, homogeneity of the plantation, deep rooting, and with elevated LUE rates (Stape et al., 2004) that can be significantly higher than the values typically used by MODIS. For instance, studies on Eucalyptus plantations reported rotation-averaged LUE for wood production ranging from 0.48 to 0.62 gC MJ−1 (Le Maire et al., 2013; Le Maire et al., 2019), while the LUE for GPP was estimated at 1.59–1.97 gC MJ−1 for rainfed Brazilian Eucalypt plantations (Nouvellon et al., 2012; Ryan et al., 2010), much higher than the MODIS LUE value of ∼0.57 gC MJ−1 for evergreen broadleaf forests. This difference in LUE values contributes to the MODIS underestimation of GPP, especially in Eucalyptus plantations when canopy photosynthesis is at its maximum.
The representation of FPAR in MODIS also introduces significant uncertainty. FPAR is derived as the maximum clear-sky value over an 8-day period, which assumes that the maximum FPAR is representative of clear conditions throughout the period. This works well for many ecosystems but can cause issues in highly productive areas like Eucalyptus plantations, where rapid canopy changes and cloud cover can distort the estimate (Plummer, 2006). This discrepancy leads to a consistent underestimation of GPP during high productivity periods (Tang et al., 2015). During the regrowth phase after harvesting (2010 and 2018), MODIS tends to overestimate productivity. This likely stems from the regrowth management such as planting of new seedlings or cuttings together with growth of weeds and their control. It can be also due to sparse canopy conditions that are misclassified as closed-canopy evergreen broadleaf forests, leading to inflated FPAR values and overestimated GPP. This effect is especially noticeable during the first year of regrowth, when the canopy is not fully developed and background reflectance contributes to the overestimation (Serbin et al., 2013; Brown et al., 2020).
Furthermore, errors in the meteorological inputs can propagate through the model and affect the accuracy of the GPP, but their impact is less than that of FPAR-related errors. Studies have shown that replacing coarse-resolution GMAO meteorological data with site-specific observations does not significantly improve GPP accuracy (Wang et al., 2017). In our study, the MOD17A2HGF product uses GMAO reanalysis data and incorporates enhancements like year-end gap-filling and climatology datasets. However, despite these improvements, our analysis revealed that the product exhibited poor performance (R2 = 0.38, rRMSE = 30.64%). These results, consistent with Wang et al.’s (2017) findings, indicate that FPAR remains a critical bottleneck for accurate GPP estimation.
Our findings, which represents the first comprehensive evaluation of the MOD17A2HGF GPP product specifically in Eucalyptus plantations, highlights the need for site specific comparison of MODIS GPP products to describe the uncertainties and biases before using the GPP product. This knowledge can be used afterwards to correct the MODIS GPP product for specific use, or use the product in combination with other information such as planting date, stand age, other spectral indices.
4.2 Model performance for stand volume estimation
The performance of the statistical models -MLR, RF, and SGB- demonstrated the utility of integrating MODIS-derived indices with traditional age-based methods to estimate Eucalyptus stand volume. Among the predictors, cumulative NDVI emerged as the most significant variable, followed by cumulative GPP and stand age. The strong correlation between cumulative NDVI and stand volume (R2 = 0.81) highlights its potential as a reliable indicator of plantation productivity. The importance rankings derived from the RF and SGB models corroborate these findings, with NDVI consistently identified as the most critical predictor.
In our study, RF and SGB models achieved rRMSE values of approximately 21% and R2 values of up to 0.85 by combining cumulative values of MODIS NDVI and productivity indices calculated at measuring date, and the age variable. A similar result was obtained by Dos Reis et al. (2019), estimating Eucalyptus volume using different machine learning methods. They reported that using multispectral, SAR, or DEM variables alone did not provide accurate estimates of volume compared to predictions based on age. However, a combination of these variables with age led to better volume estimates, specifically using the RF method (R2 = 0.71, rRMSE = 12.88%). Similarly, Dos Reis et al. (2018) demonstrated that integrating vegetation indices with machine learning methods resulted in lower RMSE values compared to traditional approaches. Their findings underscore the role of vegetation indices like NDVI in capturing canopy-level variations, which align closely with the improvements observed in our study when productivity indices such as GPP and PSN were combined with NDVI and age for volume estimation. They emphasized that mature Eucalyptus plantations (4–6 years) tend to reflect higher contributions from green leaves and lower contributions from shadows, and dry branches compared to younger plantations (<4 years) (Ponzoni et al., 2015). These spectral differences lead to stronger correlations with infrared bands and vegetation indices that include these bands, thereby enhancing volume estimation. Similarly, Dube et al. (2015) highlighted the importance of integrating multi-source data consisting of SPOT-5 raw spectral bands, 14 spectral vegetation indices, rainfall data, and stand age for predicting Eucalyptus stand volume and related tree-structural attributes. They reported accuracies of 17.63% and 0.83 respectively for rRMSE and R2 using SGB model.
While cumulative PSN (Cpsn) showed a relatively low correlation with volume (R2 = 0.52) and contributed less to predictive accuracy compared to NDVI and GPP, it still added value to multi-variable models by reflecting that spatio-temporal changes in foliage respiration have an effect on the final stand productivity. Its impact was further amplified when the effects of stand age and cumulative physiological changes, such as canopy closure and biomass accumulation, were explicitly incorporated into volume estimation, as will be discussed later in the next subsection.
The application of PCA within the MLR framework effectively addressed multicollinearity issues, while maintaining comparable accuracy to ensemble models. The use of principal components instead of raw remotely sensed variables has been considered widely in previous research (Dos Reis et al., 2019; Fayad et al., 2014; Rajab Pourrahmati et al., 2018; Silva et al., 2016). Silva et al. (2016) employed PCA to remove multicollinearity in MLR models by selecting LiDAR-based predictors of volume in Eucalyptus plantations in Minas Gerais State, Brazil, achieving high accuracy (adj. R2 = 0.87, RMSE = 27.60 m3 ha−1). Similarly, Dos Reis et al. (2019) extended the use of PCA to RF models, demonstrating that PCA can integrate multispectral SAR variables effectively to improve Eucalyptus volume estimation (RMSE = 22.33 m3 ha−1). However, our analysis revealed that for machine learning models like RF and SGB, using PCs derived from PCA did not lead to significant performance improvements compared to using original variables. This is likely because RF and SGB are inherently robust to multicollinearity, with RF using random feature selection at each split to reduce dependency on correlated features and SGB focusing on residual errors rather than absolute feature relationships. As such, the inclusion of original predictors preserved granularity and detailed information, which proved more beneficial for model accuracy in our study. Nonetheless, PCA remains a useful tool for dimensionality reduction and integrating diverse datasets, particularly when working with simpler or parametric models like MLR.
Overall, our results demonstrate the potential of integrating MODIS productivity indices with age-based methods for accurate and scalable volume estimation in Eucalyptus stands.
4.3 Prediction of volume by considering growth stage-specific variables
Incorporating cumulative MODIS indices across different growth stages led to a marked improvement in predictive accuracy, primarily due to their ability to capture temporal dynamics and integrate information on physiological changes during growth. Compared to the best model using only four variables of Cgpp, Cpsn, Cndvi_L (cumulative value of each index at the measuring date) and Age (Table 2), the SGB model with additional accumulated variables including Cgpp1Y, Cpsn1Y, and Cndvi1Y_L (representing cumulative values of each index 1 year after plantation) increased accuracy by 19.67%, achieving an RMSE of 22.63 m3 ha−1, rRMSE of 17.15%, and R2 of 0.90 (Table 3).
Further analysis on stands older than a given age (3–5 years) exhibited improvements in prediction accuracy as more cumulative indices were added, highlighting the value of these variables in representing integrated growth processes over time. For instance, for stands older than 3 years, adding cumulative values of MODIS indices at 1–3 years after plantation to the four base variables (Cgpp, Cpsn, Cndvi_L, Age) revealed an increasing enhancement in model accuracy by 20.35%, 7.83%, and 5.12%, respectively. Referring to the Supplementary Table S1, the same trend was observed for stands older than 4 and 5 years. However, the first 2 years of growth had a significantly higher impact on estimation accuracies.
This trend highlights the critical role of early growth stage indices, particularly during the first 2 years of stand development, in improving model performance. During these early years, rapid physiological changes such as canopy closure have a profound effect on productivity metrics. While NDVI captures these dynamics by integrating changes in leaf area index (LAI) and absorbed radiation (Marsden et al., 2010; Le Maire et al., 2011), providing a robust basis for subsequent volume predictions, the inclusion of GPP and PSN indices enhances this capability by reflecting gross and net carbon assimilation processes that are directly linked to stand productivity. The role of GPP in volume estimation is particularly evident in its representation of gross photosynthetic activity, which contributes to–but does not solely determine–biomass accumulation. Younger stands benefit from high photosynthetic rates during canopy development, whereas middle-aged and mature stands show sustained growth as carbon assimilation stabilizes. Studies by Le Maire et al. (2011) and Marsden et al. (2010) highlighted the importance of cumulative NDVI as a proxy for integrated photosynthetically active radiation (PAR), which is strongly correlated with stand productivity. They reported significant improvements in Eucalyptus plantation volume and height predictions when integrating NDVI time series with bioclimatic data and stand age, achieving R2 values of 0.90 and 0.92, respectively. Similarly, Marsden et al. (2010) highlighted that cumulative NDVI during the first 2 years of growth was highly correlated with Eucalyptus stem wood production (R2 = 0.78), which is consistent with our result. Our results also show the importance of GPP and PSN in predicting volume, as they directly represent photosynthetic activity, which is critical for biomass accumulation. However, NDVI emerges as the most significant variable in the majority of the models due to its ability to effectively capture canopy dynamics and temporal changes in greenness. But it can be important at early growth stages, but then at mid-age to late rotation the information of GPP really brings important new information.
The improvement trends can be further understood in light of findings discussed in Section 4.1, where we evaluated MODIS GPP against flux tower data. Similar to the observed saturation effects in high-productivity periods, GPP and NDVI exhibit limitations when canopy density becomes extremely high, reducing sensitivity to incremental changes in biomass or photosynthetic activity. This phenomenon is more likely to occur in older stands (>4 years) where canopy closure is complete, leading to reduced variability in MODIS indices Furthermore, the number of samples in our study decreases significantly as older stands are analyzed, with the total dataset of 4,130 samples reducing to 2,488, 1,582, and 933 for stands older than 3, 4, and 5 years, respectively. This reduction in sample size may affect the robustness and generalizability of the models for older stands. However, the accuracy of machine learning algorithms relies more on the representativeness and proportion of training samples than their absolute quantity (Fu et al., 2023), which partially mitigates the impact of reduced sample sizes in older stands.
Our results confirm that the early-growth stage of Eucalyptus plantations provides valuable information to predict the stand volume in the subsequent years, even at the end of the rotation. However, our comparison with eddy-covariance data revealed that the early growth GPP was not correctly estimated with MODIS. Improving the MODIS estimation of GPP in these early stages could further enhance the predictive performance of our models. One potential approach is refining MODIS-derived FPAR, which plays a crucial role in GPP calculations. Recent advancements, such as the sensor-independent LAI/FPAR climate data record (CDR) developed by Pu et al. (2024), address spatial–temporal inconsistencies and accuracy limitations in MODIS and VIIRS products by integrating multiple satellite sources and employing advanced gap-filling techniques (Pu et al., 2024). This refined dataset has demonstrated superior stability and accuracy, suggesting its potential for improving early-stage productivity estimates in plantation forests. Additionally, given that MODIS FPAR relies on biome property look-up tables (BPLUT), its accuracy may be limited when applied to highly productive or intensively managed plantations like Eucalyptus, which undergo harvesting cycles every 6–7 years. Additionally, MODIS GPP calculations use a fixed LUE value for each biome type based on BPLUT, which may not capture species-specific variations in photosynthetic efficiency. Refining both FPAR estimates and incorporating plant functional type-specific LUE values could improve the accuracy of GPP predictions. Wang et al. (2017) found that MODIS GPP estimates were more sensitive to FPAR quality than to meteorological inputs, suggesting that refining MODIS FPAR sources, such as incorporating improved datasets like global land surface satellite (GLASS) FPAR, could improve GPP estimates (Wang et al., 2017).
5 Conclusion
This study highlights the potential of integrating MODIS-derived indices, particularly the combined use of NDVI and GPP, with traditional age-based approaches for estimating Eucalyptus stand volume. Our analysis highlights key limitations in the use of MODIS GPP alone for stand volume estimation, as it represents gross photosynthetic activity but does not fully capture biomass accumulation processes, especially in the absence of complementary information.
The findings emphasize that cumulative indices provide a more reliable basis for biomass estimation than instantaneous values, reinforcing the importance of longer-term vegetation trends. Notably, the early growth stage of Eucalyptus plantations emerges as a critical period for predicting stand volume in later years. However, MODIS GPP data are subject to noise and uncertainty particularly in the first year after logging due to difficulties in accurately representing sparse canopies, rapid physiological changes, and inherent limitations in the MODIS GPP algorithm. The use of cumulative values helps to mitigate this short-term variability, but this underline the challenge of addressing biases in MODIS GPP and ensuring accuracy during early growth stages. While MODIS GPP incorporates a broader range of environmental variables, which should theoretically improve volume estimation accuracy compared to NDVI alone, our results show that the uncertainty of MODIS GPP during early growth stages reduces model efficiency. As a result, including NDVI in the model remains necessary to help counterbalance this effect.
It is worth mentioning that, despite the improvements in our volume estimation due to our dedicated approach to integrate the growth dynamics into the modeling framework, an uncertainty analysis will help quantify the reliability of the MODIS GPP product in our specific study context, addressing both systematic errors and random noise. By understanding the magnitude and sources of uncertainties, we can better refine our models and increase their robustness, particularly in early-growth stages and high-productivity periods where MODIS tends to struggle. This analysis would contribute directly to the research objectives by identifying key areas for product refinement and providing insights into how these uncertainties might affect operational use in vegetation monitoring and biomass estimation. Acknowledging these uncertainties allows for informed decision-making when using MODIS GPP in conjunction with other data sources.
From an operational perspective, our findings suggest that MODIS-derived indices, when aggregated over appropriate timeframes, can significantly enhance the estimation of stand volume, particularly for middle-aged to mature stands.
Data availability statement
The data analyzed in this study is subject to the following licenses/restrictions: The authors do not have permission to share data. Requests to access these datasets should be directed to Z3VlcnJpYy5sZV9tYWlyZUBjaXJhZC5mcg==.
Author contributions
MR: Formal Analysis, Investigation, Methodology, Visualization, Writing – original draft, Writing – review and editing. GLM: Methodology, Supervision, Writing – review and editing. NB: Methodology, Supervision, Writing – review and editing. CA: Data curation, Resources, Writing – review and editing. JS: Data curation, Resources, Writing – review and editing. HS: Data curation, Resources, Writing – review and editing. OC: Data curation, Resources, Writing – review and editing. YN: Data curation, Resources, Writing – review and editing. JG: Data curation, Resources, Writing – review and editing.
Funding
The author(s) declare that financial support was received for the research and/or publication of this article. This research was funded by the French Space Study Center (CNES, TOSCA 2024 project), and the National Research Institute for Agriculture, Food and the Environment (INRAE). The EucFlux project is coordinated by the Forestry Science and Research Institute (IPEF) and the French Agricultural Research Centre for International Development (CIRAD). For more information, please visit https://www.ipef.br/eucflux2/.
Conflict of interest
Authors CA and HS were employed by Suzano SA.
The remaining authors declare that the research was conducted in the absence of any commercial or financial relationships that could be construed as a potential conflict of interest.
The author(s) declared that they were an editorial board member of Frontiers, at the time of submission. This had no impact on the peer review process and the final decision.
Generative AI statement
The author(s) declare that no Generative AI was used in the creation of this manuscript.
Publisher’s note
All claims expressed in this article are solely those of the authors and do not necessarily represent those of their affiliated organizations, or those of the publisher, the editors and the reviewers. Any product that may be evaluated in this article, or claim that may be made by its manufacturer, is not guaranteed or endorsed by the publisher.
Supplementary material
The Supplementary Material for this article can be found online at: https://www.frontiersin.org/articles/10.3389/frsen.2025.1588387/full#supplementary-material
References
Aló, L. L., le Maire, G., Thiersch, C. R., Mota, T. S., Pinheiro, R. C., and de Souza Passos, J. R. (2024). Mapping stem volume in fast-growing eucalypt plantations: integrating spectral, textural, and temporal remote sensing information with forest inventories and spatial models. Ann. For. Sci. 81, 43. doi:10.1186/s13595-024-01255-6
Alvares, C. A., Cegatta, Í. R., Scolforo, H. F., and Mafia, R. G. (2023). Decision-tree application to predict and spatialize the wood productivity probabilities of Eucalyptus plantations. Forests 14, 1334. doi:10.3390/f14071334
Alvares, C. A., Stape, J. L., Sentelhas, P. C., de Moraes Gonçalves, J. L., and Sparovek, G. (2013). Köppen's climate classification map for Brazil. Meteorol. Z. 22, 711–728. doi:10.1127/0941-2948/2013/0507
Aubinet, M., Vesala, T., and Papale, D. (2012). Eddy covariance: a practical guide to measurement and data analysis (Netherlands, Dordrecht: Springer). doi:10.1007/978-94-007-2351-1
Austin, J. M., Mackey, B. G., and Van Niel, K. P. (2003). Estimating forest biomass using satellite radar: an exploratory study in a temperate Australian Eucalyptus forest. For. Ecol. Manag. 176, 575–583. doi:10.1016/S0378-1127(02)00314-6
Babst, F., Bouriaud, O., Papale, D., Gielen, B., Janssens, I. A., Nikinmaa, E., et al. (2014). Above-ground woody carbon sequestration measured from tree rings is coherent with net ecosystem productivity at five eddy-covariance sites. New Phytol. 201, 1289–1303. doi:10.1111/nph.12589
Baghdadi, N., le Maire, G., Fayad, I., Bailly, J. S., Nouvellon, Y., Lemos, C., et al. (2014). Testing different methods of forest height and aboveground biomass estimations from ICESat/GLAS data in Eucalyptus plantations in Brazil. IEEE J. Sel. Top. Appl. Earth Observations Remote Sens. 7, 290–299. doi:10.1109/JSTARS.2013.2261978
Baghdadi, N., Maire, G. L., Bailly, J.-S., Nouvellon, Y., Ose, K., Zribi, M., et al. (2015). Evaluation of ALOS/PALSAR L-band data for the estimation of Eucalyptus plantations aboveground biomass in Brazil. IEEE J. Sel. Top. Appl. Earth Observations Remote Sens. 8, 3802–3811. doi:10.1109/jstars.2014.2353661
Baldocchi, D., Falge, E., Gu, L., Olson, R., Hollinger, D., Running, S., et al. (2001). FLUXNET: a new tool to study the temporal and spatial variability of ecosystem-scale carbon dioxide, water vapor, and energy flux densities. Bull. Am. Meteorol. Soc. 82, 2415–2434. doi:10.1175/1520-0477(2001)082<2415:FANTTS>2.3.CO;2
Berrar, D. (2018). “Cross-validation” in Reference Module in Life Sciences, 542–545. doi:10.1016/B978-0-12-809633-8.20349-X
Brown, L. A., Meier, C., Morris, H., Pastor-Guzman, J., Bai, G., Lerebourg, C., et al. (2020). Evaluation of global leaf area index and fraction of absorbed photosynthetically active radiation products over North America using Copernicus Ground Based Observations for Validation data. Remote Sens. Environ. 247, 111935. doi:10.1016/j.rse.2020.111935
Çamdevýren, H., Demýr, N., Kanik, A., and Keskýn, S. (2005). Use of principal component scores in multiple linear regression models for prediction of Chlorophyll-a in reservoirs. Ecol. Model. 181, 581–589. doi:10.1016/j.ecolmodel.2004.06.043
Charilaou, P., and Battat, R. (2022). Machine learning models and over-fitting considerations. World J. Gastroenterol. 28, 605–607. doi:10.3748/wjg.v28.i5.605
Chen, Z., Yu, G., Zhu, X., Wang, Q., Niu, S., and Hu, Z. (2015). Covariation between gross primary production and ecosystem respiration across space and the underlying mechanisms: a global synthesis. Agric. For. Meteorology 203, 180–190. doi:10.1016/j.agrformet.2015.01.012
Christina, M., Nouvellon, Y., Laclau, J.-P., Stape, J. L., Bouillet, J.-P., Lambais, G. R., et al. (2017). Importance of deep water uptake in tropical eucalypt forest. Funct. Ecol. 31, 509–519. doi:10.1111/1365-2435.12727
Domingues, G. F., Souza, G. S. A. de, Barbosa, R. A., Marcatti, G. E., Lorenzon, A. S., and Leite, H. G. (2023). Estimated volume of eucalyptus plantations through ALOS satellite images. TreeDimensional J. 11, 1–8. doi:10.55746/treed.2023.09.025
Dos Reis, A. A., Carvalho, M. C., de Mello, J. M., Gomide, L. R., Ferraz Filho, A. C., and Acerbi Junior, F. W. (2018). Spatial prediction of basal area and volume in Eucalyptus stands using Landsat TM data: an assessment of prediction methods. N. Z. J. For. Sci. 48 (1), 1. doi:10.1186/s40490-017-0108-0
Dos Reis, A. A., Franklin, S. E., de Mello, J. M., and Acerbi Junior, F. W. (2019). Volume estimation in a Eucalyptus plantation using multi-source remote sensing and digital terrain data: a case study in Minas Gerais State, Brazil. Int. J. Remote Sens. 40, 2683–2702. doi:10.1080/01431161.2018.1530808
Dube, T., and Mutanga, O. (2016). The impact of integrating WorldView-2 sensor and environmental variables in estimating plantation forest species aboveground biomass and carbon stocks in uMgeni Catchment, South Africa. ISPRS J. Photogrammetry Remote Sens. 119, 415–425. doi:10.1016/j.isprsjprs.2016.06.017
Dube, T., Mutanga, O., Abdel-Rahman, E. M., Ismail, R., and Slotow, R. (2015). Predicting Eucalyptus spp. stand volume in Zululand, South Africa: an analysis using a stochastic gradient boosting regression ensemble with multi-source data sets. Int. J. Remote Sens. 36, 3751–3772. doi:10.1080/01431161.2015.1070316
Dube, T., Sibanda, M., Shoko, C., and Mutanga, O. (2017). Stand-volume estimation from multi-source data for coppiced and high forest Eucalyptus spp. silvicultural systems in KwaZulu-Natal, South Africa. ISPRS J. Photogrammetry Remote Sens. 132, 162–169. doi:10.1016/j.isprsjprs.2017.09.001
Eenmäe, A., Nilson, T., and Lang, M. (2014). A note on meteorological variables related trends in the MODIS NPP product for estonia/meteoroloogilised andmed põhjustavad vigu MODISe primaarproduktsiooni hinnangutes eesti alal. For. Stud. 55, 60–63. doi:10.2478/v10132-011-0102-x
Epron, D., Laclau, J.-P., Almeida, J. C. R., Gonçalves, J. L. M., Ponton, S., Sette, C. R., et al. (2012). Do changes in carbon allocation account for the growth response to potassium and sodium applications in tropical Eucalyptus plantations? Tree Physiol. 32, 667–679. doi:10.1093/treephys/tpr107
Fayad, I., Baghdadi, N., Alcarde Alvares, C., Stape, J. L., Bailly, J. S., Scolforo, H. F., et al. (2021a). Terrain slope effect on forest height and wood volume estimation from GEDI data. Remote Sens. 13, 2136. doi:10.3390/rs13112136
Fayad, I., Baghdadi, N., Bailly, J.-S., Barbier, N., Gond, V., Hajj, M. E., et al. (2014). Canopy height estimation in French guiana with LiDAR ICESat/GLAS data using principal component analysis and random forest regressions. Remote Sens. 6, 11883–11914. doi:10.3390/rs61211883
Fayad, I., Baghdadi, N. N., Alvares, C. A., Stape, J. L., Bailly, J. S., Scolforo, H. F., et al. (2021b). Assessment of GEDI’s LiDAR data for the estimation of canopy heights and wood volume of Eucalyptus plantations in Brazil. IEEE J. Sel. Top. Appl. Earth Obs. Remote Sens. 14, 7095–7110. doi:10.1109/JSTARS.2021.3092836
Franklin, O., Johansson, J., Dewar, R. C., Dieckmann, U., McMurtrie, R. E., Brännström, Å., et al. (2012). Modeling carbon allocation in trees: a search for principles. Tree Physiol. 32, 648–666. doi:10.1093/treephys/tpr138
Friedman, J. (2002). Stochastic gradient boosting. Comput. Statistics and Data Analysis 38, 367–378. doi:10.1016/S0167-9473(01)00065-2
Fu, Y., Shen, R., Song, C., Dong, J., Han, W., Ye, T., et al. (2023). Exploring the effects of training samples on the accuracy of crop mapping with machine learning algorithm. Sci. Remote Sens. 7, 100081. doi:10.1016/j.srs.2023.100081
Gallagher, N. (2020). Savitzky-golay smoothing and differentiation filter. doi:10.13140/RG.2.2.20339.50725
Gama, F. F., Dos Santos, J. R., and Mura, J. C. (2010). Eucalyptus biomass and volume estimation using interferometric and polarimetric SAR data. Remote Sens. 2, 939–956. doi:10.3390/rs2040939
Goral, M., Maire, G., Scolforo, H. F., Stape, J. L., Miranda, E. N., Silva, T. C. F., et al. (2025). Monitoring the early growth of forest plantations with Sentinel-2 satellite time-series. Int. J. Remote Sens. 46, 3110–3136. doi:10.1080/01431161.2025.2466763
Guillemot, J., Francois, C., Hmimina, G., Dufrêne, E., Martin-StPaul, N. K., Soudani, K., et al. (2017). Environmental control of carbon allocation matters for modelling forest growth. New Phytol. 214, 180–193. doi:10.1111/nph.14320
Guillemot, J., Le Maire, G., Alvares, C., Borges, J., Brito, J. O., Chaves, R., et al. (2018). “Studying ecophysiological patterns to improve the management of high-productivity Eucalypt plantations: the EUCFLUX project,” in Eucalyptus 2018: Managing Eucalyptus Plantation Under Global Changes. Available online at: https://agritrop.cirad.fr/589554/ (Accessed May 2, 2025).
Gwelo, A. (2019). Principal components to overcome multicollinearity problem. Oradea J. Bus. Econ. 4, 79–91. doi:10.47535/1991ojbe062
Krause, A., Papastefanou, P., Gregor, K., Layritz, L. S., Zang, C. S., Buras, A., et al. (2022). Quantifying the impacts of land cover change on gross primary productivity globally. Sci. Rep. 12, 18398. doi:10.1038/s41598-022-23120-0
Lasslop, G., Reichstein, M., Papale, D., Richardson, A. D., Arneth, A., Barr, A., et al. (2010). Separation of net ecosystem exchange into assimilation and respiration using a light response curve approach: critical issues and global evaluation. Glob. Change Biol. 16, 187–208. doi:10.1111/j.1365-2486.2009.02041.x
Leite, R. V., Amaral, C.H., Pires, R., de, P., Silva, C. A., Soares, C. P. B., et al. (2020). Estimating stem volume in Eucalyptus plantations using airborne LiDAR: a comparison of area- and individual tree-based approaches. Remote Sens. 12, 1513. doi:10.3390/rs12091513
Le Maire, G., Guillemot, J., Campoe, O. C., Stape, J.-L., Laclau, J.-P., and Nouvellon, Y. (2019). Light absorption, light use efficiency and productivity of 16 contrasted genotypes of several Eucalyptus species along a 6-year rotation in Brazil. For. Ecol. Manag. 449, 117443. doi:10.1016/j.foreco.2019.06.040
Le Maire, G., Marsden, C., Nouvellon, Y., Grinand, C., Hakamada, R., Stape, J.-L., et al. (2011). MODIS NDVI time-series allow the monitoring of Eucalyptus plantation biomass. Remote Sens. Environ. 115, 2613–2625. doi:10.1016/j.rse.2011.05.017
Le Maire, G., Nouvellon, Y., Christina, M., Ponzoni, F. J., Gonçalves, J. L. M., Bouillet, J.-P., et al. (2013). Tree and stand light use efficiencies over a full rotation of single- and mixed-species Eucalyptus grandis and Acacia mangium plantations. For. Ecol. Manag. Light Intercept. growth trees stands 288, 31–42. doi:10.1016/j.foreco.2012.03.005
Litton, C. M., Raich, J. W., and Ryan, M. G. (2007). Carbon allocation in forest ecosystems. Glob. Change Biol. 13, 2089–2109. doi:10.1111/j.1365-2486.2007.01420.x
Majasalmi, T., Rautiainen, M., Stenberg, P., and Manninen, T. (2015). Validation of MODIS and GEOV1 fPAR products in a boreal forest site in Finland. Remote Sens. 7, 1359–1379. doi:10.3390/rs70201359
Malhi, Y., Doughty, C. E., Goldsmith, G. R., Metcalfe, D. B., Girardin, C. A. J., Marthews, T. R., et al. (2015). The linkages between photosynthesis, productivity, growth and biomass in lowland Amazonian forests. Glob. Chang. Biol. 21, 2283–2295. doi:10.1111/gcb.12859
Marsden, C., le Maire, G., Stape, J.-L., Seen, D. L., Roupsard, O., Cabral, O., et al. (2010). Relating MODIS vegetation index time-series with structure, light absorption and stem production of fast-growing Eucalyptus plantations. For. Ecol. Manag. Prod. Trop. Plant. 259, 1741–1753. doi:10.1016/j.foreco.2009.07.039
Mayen, J., Polsenaere, P., Lamaud, É., Arnaud, M., Kostyrka, P., Bonnefond, J.-M., et al. (2023). Atmospheric CO2 exchanges measured by eddy covariance over a temperate salt marsh and influence of environmental controlling factors 21, 993–1016. doi:10.5194/egusphere-2023-1641
Nilson, T., Rennel, M., Luhamaa, A., Hordo, M., Olesk, A., Lang, M., et al. (2012). MERIS GPP/NPP product for Estonia: I. Algorithm and preliminary results of simulation/MERIS’e GPP/NPP tulem Eesti jaoks: I. Algoritm ja mudelarvutuste esialgsed tulemused. For. Stud. 56, 56–78. doi:10.2478/v10132-012-0005-5
Nouvellon, Y., Laclau, J.-P., Epron, D., Le Maire, G., Bonnefond, J.-M., Gonçalves, J. L. M., et al. (2012). Production and carbon allocation in monocultures and mixed-species plantations of Eucalyptus grandis and Acacia mangium in Brazil. Tree Physiol. 32, 680–695. doi:10.1093/treephys/tps041
Pei, Y., Dong, J., Zhang, Y., Yuan, W., Doughty, R., Yang, J., et al. (2022). Evolution of light use efficiency models: improvement, uncertainties, and implications. Agric. For. Meteorology 317, 108905. doi:10.1016/j.agrformet.2022.108905
Plummer, S. (2006). On validation of the MODIS gross primary production product. Geoscience Remote Sens. IEEE Trans.44, 1936–1938. doi:10.1109/TGRS.2006.872521
Ponzoni, F. J., Pacheco, L. R. F., Santos, S.B. dos, and Andrades Filho, C. de O. (2015). Caracterização espectro-temporal de dosséis de eucalyptus spp. mediante dados radiométricos TM/Landsat5. CERNE 21, 267–275. doi:10.1590/01047760201521021457
Propastin, P., Ibrom, A., Knohl, A., and Erasmi, S. (2012). Effects of canopy photosynthesis saturation on the estimation of gross primary productivity from MODIS data in a tropical forest. Remote Sens. Environ. 121, 252–260. doi:10.1016/j.rse.2012.02.005
Pu, J., Yan, K., Roy, S., Zhu, Z., Rautiainen, M., Knyazikhin, Y., et al. (2024). Sensor-independent LAI/FPAR CDR: reconstructing a global sensor-independent climate data record of MODIS and VIIRS LAI/FPAR from 2000 to 2022. Earth Syst. Sci. Data 16, 15–34. doi:10.5194/essd-16-15-2024
Puchi, P. F., Khomik, M., Helgason, W., Arain, M. A., and Castagneri, D. (2024). Different climate conditions drive variations in gross primary productivity and woody biomass accumulation in a temperate and a boreal conifer forest in Canada. Agric. For. Meteorology 355, 110125. doi:10.1016/j.agrformet.2024.110125
Rajab Pourrahmati, M., Baghdadi, N., Darvishsefat, A. A., Namiranian, M., Gond, V., Bailly, J.-S., et al. (2018). Mapping Lorey’s height over Hyrcanian forests of Iran using synergy of ICESat/GLAS and optical images. Eur. J. Remote Sens. 51, 100–115. doi:10.1080/22797254.2017.1405717
Rodrigues, G. G., Silva, L. D., and Nouvellon, Y. (2021). Production and carbon allocation in clonal Eucalyptus plantations under different planting spacings. For. Ecol. Manag. 493, 119249. doi:10.1016/j.foreco.2021.119249
Running, S., and Zhao, M. (2021). User’s guide daily GPP and annual NPP (MOD17A2H/A3H) and year-end GapFilled (MOD17A2HGF/A3HGF) products NASA earth observing system MODIS land algorithm (for collection 6.1).
Ryan, M. G., Binkley, D., Fownes, J. H., Giardina, C. P., and Senock, R. S. (2004). An experimental test of the causes of forest growth decline with stand age. Ecol. Monogr. 74, 393–414. doi:10.1890/03-4037
Ryan, M. G., Stape, J. L., Binkley, D., Fonseca, S., Loos, R. A., Takahashi, E. N., et al. (2010). Factors controlling Eucalyptus productivity: how water availability and stand structure alter production and carbon allocation. For. Ecol. Manag. Prod. Trop. Plant. 259, 1695–1703. doi:10.1016/j.foreco.2010.01.013
Sanchez-Azofeifa, A., Sharp, I., and Stan, K. (2024). MODIS fPAR products do not reflect in-situ conditions in a tropical dry forest based on wavelet and cross-wavelet transforms. Remote Sens. Appl. Soc. Environ. 36, 101298. doi:10.1016/j.rsase.2024.101298
Serbin, S. P., Ahl, D. E., and Gower, S. T. (2013). Spatial and temporal validation of the MODIS LAI and FPAR products across a boreal forest wildfire chronosequence. Remote Sens. Environ. 133, 71–84. doi:10.1016/j.rse.2013.01.022
Silva, C. A., Klauberg, C., Hudak, A. T., Vierling, L. A., Liesenberg, V., Carvalho, S. P. C., et al. (2016). A principal component approach for predicting the stem volume in Eucalyptus plantations in Brazil using airborne LiDAR data. For. Int. J. For. Res. 89, 422–433. doi:10.1093/forestry/cpw016
Souza, G. S. A. de, Soares, V. P., Leite, H. G., Gleriani, J. M., do Amaral, C. H., Ferraz, A. S., et al. (2019). Multi-sensor prediction of Eucalyptus stand volume: a support vector approach. ISPRS J. Photogrammetry Remote Sens. 156, 135–146. doi:10.1016/j.isprsjprs.2019.08.002
Stape, J. L., Binkley, D., and Ryan, M. G. (2004). Eucalyptus production and the supply, use and efficiency of use of water, light and nitrogen across a geographic gradient in Brazil. Synthesis Physiol. Environ. Genet. Silvic. 193, 17–31. doi:10.1016/j.foreco.2004.01.020
Stape, J. L., Binkley, D., Ryan, M. G., Fonseca, S., Loos, R. A., Takahashi, E. N., et al. (2010). The Brazil Eucalyptus Potential Productivity Project: influence of water, nutrients and stand uniformity on wood production. For. Ecol. Manag. Prod. Trop. Plant. 259, 1684–1694. doi:10.1016/j.foreco.2010.01.012
Strahler, A. H. S., Lucht, W., Barker Schaaf, C., Tsang, T., Gao, F., Li, X., et al. (1999). MODIS BRDF/albedo product: algorithm theoretical basis document version 5.0.
Talebiesfandarani, S., and Shamsoddini, A. (2022). Global-scale biomass estimation based on machine learning and deep learning methods. Remote Sens. Appl. Soc. Environ. 28, 100868. doi:10.1016/j.rsase.2022.100868
Tang, X., Li, H., Huang, N., Li, X., Xu, X., Ding, Z., et al. (2015). A comprehensive assessment of MODIS-derived GPP for forest ecosystems using the site-level FLUXNET database. Environ. Earth Sci. 74, 5907–5918. doi:10.1007/s12665-015-4615-0
Turner, D., Ritts, W., Cohen, W., Gower, S., Running, S., Zhao, M., et al. (2006). Evaluation of MODIS NPP and GPP products across multiple biomes. Remote Sens. Environ. 102, 282–292. doi:10.1016/j.rse.2006.02.017
Wang, L., Zhu, H., Lin, A., Zou, L., Qin, W., and Du, Q. (2017). Evaluation of the latest MODIS GPP products across multiple biomes using global eddy covariance flux data. Remote Sens. 9, 418. doi:10.3390/rs9050418
Wang, S., and Mo, X. (2015). Comparison of multiple models for estimating gross primary production using remote sensing data and fluxnet observations. Proc. Int. Assoc. Hydrological Sci. 368, 75–80. doi:10.5194/piahs-368-75-2015
Wei, S., Yi, C., Fang, W., and Hendrey, G. (2017). A global study of GPP focusing on light-use efficiency in a random forest regression model. Ecosphere 8, e01724. doi:10.1002/ecs2.1724
Keywords: eucalyptus plantations, volume estimation, MODIS gross primary productivity, MODIS net photosynthesis, MODIS normalized difference vegetation index
Citation: Rajab Pourrahmati M, Le Maire G, Baghdadi N, Alvares CA, Stape JL, Scolforo HF, Campoe OC, Nouvellon Y and Guillemot J (2025) Integrating MODIS-derived indices for eucalyptus stand volume estimation: an evaluation of MODIS gross primary productivity. Front. Remote Sens. 6:1588387. doi: 10.3389/frsen.2025.1588387
Received: 05 March 2025; Accepted: 22 April 2025;
Published: 14 May 2025.
Edited by:
Peter Potapov, University of Maryland, College Park, United StatesReviewed by:
Pengfei Chen, Sun Yat-sen University, ChinaZhenkun Tian, China University of Labor Relations, China
Copyright © 2025 Rajab Pourrahmati, Le Maire, Baghdadi, Alvares, Stape, Scolforo, Campoe, Nouvellon and Guillemot. This is an open-access article distributed under the terms of the Creative Commons Attribution License (CC BY). The use, distribution or reproduction in other forums is permitted, provided the original author(s) and the copyright owner(s) are credited and that the original publication in this journal is cited, in accordance with accepted academic practice. No use, distribution or reproduction is permitted which does not comply with these terms.
*Correspondence: Manizheh Rajab Pourrahmati, bWFuaXpoZWgucmFqYWItcG91cnJhaG1hdGlAaW5yYWUuZnI=