 Sunny Sun-Mack
 Yongxiang Hu
 Xiaomei Lu
 Yan Chen1
- 1Analytical Mechanics Associates, Inc., Hampton, VA, United States
- 2Science Directorate, NASA Langley Research Center, Hampton, VA, United States
Indroduction: Estimating snow depth over Arctic sea ice is essential for understanding climate processes and supporting operational forecasting. Previous work has demonstrated the use of lidar backscattering pathlength moments from Ice, Cloud, and land Elevation Satellite-2 (ICESat-2) for snow depth retrieval. However, passive microwave sensors like the Advanced Microwave Scanning Radiometer 2 (AMSR-2) offer the potential for more frequent and spatially extensive observations.
Methods: We developed a neural network (NN) algorithm to estimate snow depth over Arctic sea ice using multi-channel brightness temperatures from AMSR-2, combined with humidity profiles and surface temperatures from the Global Modeling and Assimilation Office (GMAO) Goddard Earth Observing System for Instrument Teams (GEOS-IT) product. The NN was trained with temporally and spatially matched ICESat-2 snow depth data from the 2018–2019 winter season. The trained NN was then applied to AMSR-2 clear-sky wide-swath observations for the 2018–2019 and 2019–2020 Arctic winters, generating daily snow depth estimates across Arctic sea ice.
Results: Validation against independent ICESat-2 data showed strong performance: the NN-based AMSR-2 snow depth retrievals had a near-zero bias and a root mean square error (RMSE) of 10 cm. Further validation using (a) instantaneous matchups, (b) daily geolocation comparisons, and (c) monthly Arctic-wide averages confirmed consistent results. Instantaneous comparisons yielded a 9 cm RMSE with minimal bias, daily comparisons showed a 3 cm underestimation and 9 cm RMSE, and monthly averages exhibited a 1 cm bias and 10 cm RMSE.
Discussion: These results confirm the reliability of the neural network-based method for snow depth retrieval from AMSR-2. The approach enables daily, long-term monitoring of snow depth over Arctic sea ice, offering significant benefits for climate research and operational applications such as snowstorm and blizzard monitoring.
1 Introduction
Snow depth is a key parameter for understanding the cryosphere and its interactions with the climate system, hydrology, and ecosystems. In the Arctic, snow depth on sea ice plays a crucial role in modulating sea ice thermodynamics and surface energy balance. Acting as an insulating layer, it regulates heat exchange between the ocean and atmosphere (Sturm et al., 2002), affects sea ice growth and melt (Maykut and Untersteiner, 1971), and contributes to climate feedbacks (Holland et al., 2006). It also impacts satellite-derived sea ice thickness estimates by altering freeboard-to-thickness conversions in altimetry-based retrievals (Kwok and Cunningham, 2008; Brucker and Markus, 2013; Newman et al., 2014; Kwok et al., 2020). Moreover, as a seasonal freshwater reservoir, snow depth influences ocean stratification, atmospheric moisture transport, river runoff, and continental freshwater availability through changes in precipitation and river discharge (Laxon et al., 2012; Pflug et al., 2025).
Traditionally, snow depth has been measured using in situ observations from weather stations and field surveys (Lejeune et al., 2019; Ménard et al., 2019; Wagner et al., 2021), as well as airborne suborbital snow radar missions such as Operation IceBridge (Kurtz and Farrell, 2011; Kurtz et al., 2013; Kwok et al., 2017). In situ measurements are considered the most accurate, with errors typically within a few centimeters under well-controlled conditions. Airborne radar systems, such as those used in Operation IceBridge, provide high-resolution snow depth estimates across broader spatial domains, with uncertainties generally ranging from 5 to 10 cm depending on snow properties and surface roughness (Kwok et al., 2017). Although these methods offer high accuracy and fine spatial resolution, their spatial and temporal coverage remains limited, especially in remote polar regions where logistical challenges and harsh environmental conditions restrict measurement frequency and continuity.
Passive microwave remote sensing, particularly using the Advanced Microwave Scanning Radiometer 2 (AMSR-2) onboard the Global Change Observation Mission 1st Water (GCOM-W1) satellite, provides large-scale, frequent snow depth retrievals (Comiso et al., 2008). However, AMSR data are constrained by relatively coarse spatial resolutions (12.5 km to ∼75 km for AMSR-E) (Kelly, 2009; Takala et al., 2011). Conventional retrieval algorithms, which rely on empirical relationships between brightness temperature differences and in situ measurements (Markus and Cavalieri, 1998), are subject to uncertainties due to assumptions about snow properties, ice types, and atmospheric conditions (Rostosky et al., 2018). Additionally, variability in snow microphysics, including grain size evolution and layering, further complicates retrieval accuracy (Sturm and Massom, 2016). To mitigate these uncertainties, AMSR-2 daily snow depth products are provided as 5-day running averages, primarily covering Arctic regions dominated by first-year or seasonal sea ice (Meier, 2018).
Satellite radar altimeters, such as CryoSat-2 and Sentinel-1, enable snow depth retrieval over sea ice (Kwok et al., 2020; Lievens et al., 2022). These altimeters measure the height of the snow-ice interface, representing the bottom of the snow layer, and require information on the snow surface height to derive snow depth estimates (Kacimi and Kwok, 2020; Kwok et al., 2020). This is typically achieved by combining CryoSat-2 measurements with the data from Advanced Topographic Laser Altimeter System (ATLAS) instrument onboard the Ice, Cloud, and land Elevation Satellite-2 (ICESat-2), which provides snow surface elevation. While such approaches yield valuable insights into snowpack characteristics, their limited temporal resolution restricts their ability to monitor snow depth changes on daily timescales.
Seasonal snow depths can be estimated using ICESat-2 ATL08 terrain elevation data (Neuenschwander et al., 2021; Enderlin et al., 2022), ATL06 land ice elevation data (Deschamps-Berger, et al., 2023), SlideRule Earth (Besso et al., 2024; Fair, et al., 2024) and multiple reference digital elevation models (DEMs) based on snow-on and snow-off measurements (Shean et al., 2021; Hu X. et al., 2022). However, the snow depth retrievals from currently available altimetry crossovers with snow-on and snow-off measurements are sparse and noisy (Shean et al., 2021). Moreover, the quality and vertical accuracy of reference DEMs (Treichler and Kääb, 2017; Liu et al., 2020), and the spatial resolution differences between ICESat-2 and the reference DEMs, can affect the snow depth retrievals as well.
To address these limitations, Hu X. et al. (2022) and Lu et al. (2022) developed a novel method for deriving snow depth using vertically resolved, multiply scattered lidar signals returned from within the snow layer. The ICESat-2 ATL03 global geolocated photon dataset (Neumann et al., 2021) provides exceptionally high vertical resolution, capturing both surface-returned photons as well as subsurface photons that penetrate the snowpack and undergo multiple scattering. This capability allows for high-precision snow depth retrievals, offering detailed mapping of snow cover, surface roughness, and optical properties on both land surfaces and sea ice (Lu et al., 2017; Lu et al., 2022; van Tiggelen et al., 2021; Hu Y. et al., 2022). ATLAS is a 532 nm photon-counting laser altimeter with a 10-kHz pulse repetition rate, a nominal 11-m footprint diameter with an along-track sampling interval of 0.7 m at the Earth’s surface (Magruder and Brunt, 2018; Martino et al., 2019; Neumann et al., 2019; Magruder et al., 2020). ICESat-2 operates on a 91-day nominal repeat cycle, and its narrow ground track results in sparse spatial sampling. This makes it challenging to provide continuous observation coverage over large areas. In contrast, passive microwave sensors such as AMSR-2 offer near daily global coverage at a coarser spatial resolution (10–25 km), making them more suitable for consistent large-scale monitoring of snow and sea ice conditions.
Given the importance of large-scale, high-temporal-resolution snow depth monitoring, integrating multiple remote sensing datasets is necessary. Machine learning (ML) techniques provide a promising data-driven approach to overcoming limitations associated with conventional retrieval algorithms. By capturing complex, nonlinear relationships between observed microwave signals and snow depth, ML-based models can improve retrieval accuracy and adaptability to varying sea ice conditions. This study integrates AMSR-2 observations with ancillary datasets and trains a neural network model using ICESat-2 snow depth data (Hu Y. et al., 2022; Hu et al., 2023; Lu et al., 2022) as ground truth. By integrating passive microwave and active altimetry, the results demonstrate that machine learning enhances retrieval accuracy, adapts to heterogeneous Arctic sea ice conditions, and generalizes effectively across the Arctic winter region. By leveraging ICESat-2’s high-precision snow depth estimates and AMSR-2’s broad spatial coverage, this study presents, for the first time, a daily global Arctic winter snow depth monitoring system.
This paper is organized as follows. Section 2 describes the datasets used in the study. Section 3 outlines the methodology employed for snow depth retrieval. Section 4 presents the resulting daily and monthly snow depth estimates over Arctic sea ice. Section 5 provides a detailed discussion and validation of the neural network-based retrieval system, including: (1) the system’s capability for daily snowfall monitoring, (2) independent monthly validation against ICESat-2 and CryoSat-2 freeboards as well as standard AMSR-2 products over both first-year and multi-year sea ice, and (3) an analysis of key sources of uncertainty. Finally, Section 6 summarizes the findings, outlines future plans and concludes the paper.
2 Data
The neural network for snow depth estimation is trained using input data from AMSR-2 brightness temperatures and numerical weather model reanalysis over Arctic sea ice during the winter season. Snow depth measurements from the active sensor ICESat-2 serve as the ground truth for training. Details of the datasets used in this study are provided in Sections 2.1–2.3, while those used for independent comparison are described in Sections 2.4, 2.5.
2.1 ICESat-2 snow depth
Hu X. et al. (2022) and Lu et al. (2022) developed an algorithm for deriving snow depth using Monte Carlo lidar radiative transfer simulations. Their approach utilizes the first-, second-, and third-order moments of the lidar backscattering pathlength distribution. These methods have been applied to ICESat-2 lidar measurements over Arctic sea ice (Hu Y. et al., 2022; Lu et al., 2022). ATLAS onboard ICESat-2 is a photon-counting lidar instrument with a unique six-beam configuration, consisting of three beam pairs—each pair containing one strong and one weak beam (Neumann et al., 2021). Snow depth is retrieved using the ICESat-2 Global Geolocated Photon Data (ATL03) from all three strong beams. To enhance the signal-to-noise ratio, snow surface photon returns are aggregated over 10 consecutive laser pulses. Each pulse has an along-track sampling interval of approximately 0.7 m at the Earth’s surface, resulting in an effective along-track resolution of about 7 m (Hu Y. et al., 2022; Lu et al., 2022). In this study, ICESat-2 snow depth measurements from December 2018 to March 2019 are used as the ground truth for training the neural network model. Snow depth data from December 2019 to March 2020 are used for validation of the AMSR-2 snow depths.
2.2 AMSR-2 brightness temperature
AMSR-2, a passive microwave sensor onboard the GCOM-W1 satellite (Cavalieri et al., 2014; Alsweiss et al., 2021), provides brightness temperature observations across multiple microwave frequencies and spatial resolutions, as summarized in Table 1. The AMSR-2 Level 1C product, Common Calibrated Brightness Temperature (GPM_1CGCOMW1AMSR-2), is obtained from the NASA Goddard Earth Sciences Data and Information Services Center (GES DISC) (Wesley, 2022).
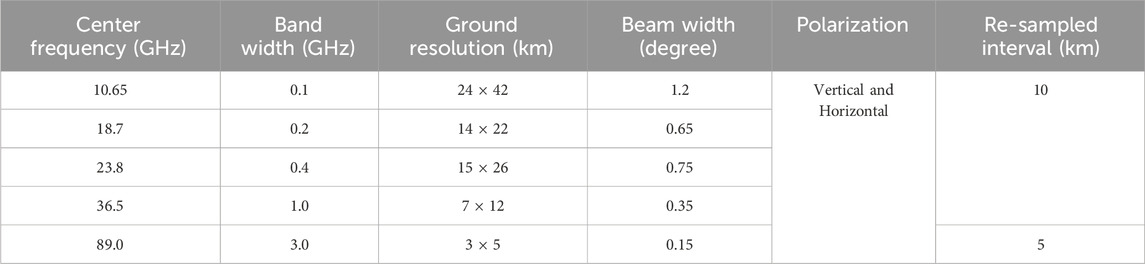
Table 1. AMSR-2 channels.
This dataset includes five frequency channels: 10.65 GHz (24 × 42 km), 18.7 GHz (14 × 22 km), 23.8 GHz (15 × 26 km), 36.5 GHz (7 × 12 km), and 89.0 GHz (3 × 5 km), with each available in both vertical (V) and horizontal (H) polarizations. The brightness temperature data are resampled to a uniform grid of 10 × 10 km for all frequencies, except for the 89 GHz channel, which is resampled to 5 × 5 km.
2.3 Input variables
The input variables for the AMSR-2 neural network (NN) snow depth retrieval over Arctic sea ice are summarized in Table 2. These inputs include latitude, longitude, brightness temperatures (BT), and brightness temperature differences (BTD). Specifically, brightness temperatures at 10.65, 18.7, 23.8, 36.5, and 89.0 GHz are utilized, along with the following BTDs: (10.65–18.7 GHz), (10.65–23.8 GHz), (10.65–36.5 GHz), (18.7–23.8 GHz), (18.7–36.5 GHz), and (23.8–36.5 GHz).
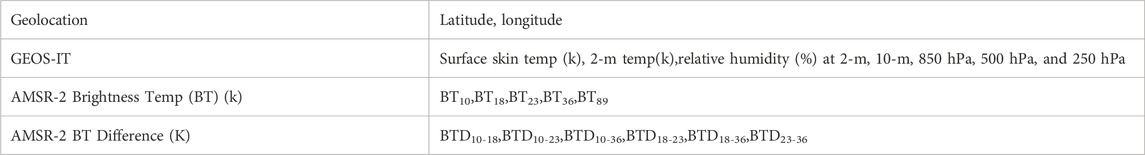
Table 2. Input parameters for NN AMSR-2.
In addition to microwave observations, relative humidity and temperature data from the Global Modeling and Assimilation Office (GMAO) Goddard Earth Observing System for Instrument Teams (GEOS-IT) datasets are incorporated. This includes relative humidity at surface levels (2 m and 10 m) as well as at key atmospheric pressure levels (850 hPa, 500 hPa, and 250 hPa), providing critical information on microwave radiance absorption for specific AMSR-2 channels. Additionally, surface skin temperature and 2-m surface air temperature are included as input parameters.
Both the training data and the AMSR-2 application of the trained neural network for snow depth retrieval are focused on Arctic sea ice. The Arctic sea ice extent is determined using sea ice concentration data from the Near-Real-Time NOAA/NSIDC Climate Data Record of Passive Microwave Sea Ice Concentration, provided by the National Snow and Ice Data Center (NSIDC) (Meier et al., 2024).
2.4 Standard AMSR-2 5-daily averaged snow depth
AMSR-E/AMSR-2 Unified L3 Daily 12.5 km Brightness Temperatures, Sea Ice Concentration, Motion, and Snow Depth Polar Grids, Version 1 (Meier, 2018) provides snow depth estimates over sea ice. This standard AMSR-E and AMSR-2 snow depth products rely on the relationship between passive microwave brightness temperature (TB) at 19 GHz and 37 GHz, which is sensitive to variations in snow cover (Markus and Cavalieri, 1998). Snow depth retrieval is based on an empirical linear relationship between the 37 GHz TB depression and measured snow depth. These empirical coefficients are derived from airborne and in situ measurements (Warren et al., 1999), allowing for large-scale snow depth monitoring across the polar regions.
However, the standard AMSR-2 snow depth retrieval is most effective for dry snow over first-year sea ice, particularly in seasonal sea ice zones (Meier, 2018). The AMSR snow-depth-on-sea-ice algorithm (Markus and Cavalieri, 1998; Kelly, 2009) relies on the spectral gradient ratio between the 18.7 GHz and 37 GHz vertical polarization channels. This method generally retrieves snow depths 50 cm or less, constrained by the limited penetration depth of the 18.7 and 36.5 GHz frequencies. Beyond this threshold, the microwave signal saturates and becomes insensitive to additional snow depth (Kelly, 2009; Meier, 2018). Accuracy decreases over multi-year sea ice due to increased surface roughness and complex snow layering, which introduce additional uncertainties. To improve the stability and consistency of snow depth estimates, the standard AMSR-2 daily snow depth products are provided as 5-day running averages, helping to smooth short-term fluctuations caused by atmospheric variability, sensor noise, and temporary surface changes. The standard 5-day averaged AMSR-2 snow depth data described here is utilized solely for validation and comparison purposes.
2.5 IS2-CS2 snow depth
The IS2-CS2 dataset is a synergistic product that combines observations from NASA’s ICESat-2, (abbreviated as IS2) and the European Space Agency’s (ESA) CryoSat-2 (CS2) to enhance measurements of Arctic sea ice properties, particularly snow depth (Markus et al., 2017; Kwok et al., 2020; Kacimi and Kwok, 2022). Snow depth estimates are calculated by taking the differences in freeboard measurements between ICESat-2 and CryoSat-2 Data from both satellites are combined on a 25 × 25 km grid.
Due to limited coverage within a single day, IS2-CS2 provides a monthly snow depth product for both first-year and multi-year sea ice. Its snow depth retrievals are restricted to the Beaufort Sea, Chukchi Sea, East Siberian Sea, Laptev Sea, and Kara Sea, as well as the Arctic Ocean region defined by key gateways, including the Bering Strait (Pacific Ocean), the Canadian Arctic Archipelago (CAA), Fram Strait (Greenland), and the Barents Sea. Similar to the standard 5-day averaged AMSR-2 data, IS2-CS2 snow depth is primarily used for validation and comparison purposes.
3 Methodology
In this study, ICESat-2 snow depth is used as the target variable for training the neural network, as it is derived from photon-counting lidar measurements that are physically independent of passive microwave retrievals and provide higher accuracy and spatial resolution. This choice enables the model to learn a more reliable relationship between AMSR-2 brightness temperatures and true snow depth, improving retrieval performance compared to training on existing passive microwave-derived products.
Vertically polarized brightness temperatures from AMSR-2 are used to minimize surface emissivity effects from snow. To construct the neural network training dataset, AMSR-2 measurements are geo-collocated with ICESat-2 snow depth retrievals. AMSR-2 data, with a spatial resolution of approximately 10 km, are reported with geolocation coordinates corresponding to the center of each pixel. Around each AMSR-2 pixel center, ICESat-2 snow depth footprints within a 1 km radius are identified. This ensures that the high-resolution ICESat-2 measurements (∼7 m in-track resolution) are spatially representative of the AMSR-2 footprint, while remaining well within its boundary to minimize sub-pixel variability and edge effects. Temporal collocation is performed by selecting ICESat-2 data acquired within ±1 h of the AMSR-2 overpass time. This 2-hour window helps limit the influence of short-term changes in atmospheric or surface conditions, while still allowing for sufficient ICESat-2 sampling coverage, especially in the polar regions where the satellite ground tracks may be sparse or offset in time. Across winter season of 2018–2019, this collocation method yields approximately one million matched pixels using the 1 km and ±1 h thresholds. If the spatial threshold is expanded to 2 km, the number of matched pixels increases significantly, reaching approximately 8.4 million per season. However, in this study, we adopt the 1 km spatial and ±1 h temporal criteria to prioritize spatial representativeness and temporal proximity over sample size, thus ensuring a higher-quality training dataset.
The AMSR-2 neural network for snow depth estimation was trained using a feedforward neural network implemented in MathWorks. The Levenberg-Marquardt training function (Levenberg, 1944; Marquardt, 1963; The MathWorks, 2024) was selected for its ability to efficiently handle large datasets with numerous iterations. A single hidden layer was utilized, as adding a second layer did not significantly improve accuracy but substantially increased training time. The activation functions used were the logarithmic sigmoid (logsig) and hyperbolic tangent sigmoid (tansig) functions. The hidden layer consisted of 50 neurons, determined by incrementally adding neurons until further increases no longer improved accuracy. Model performance was evaluated using mean squared error (MSE). For final training, data from the sampled winter months (December 2018 to March 2019) were split into 60% for training, 20% for testing, and 20% for validation.
To prevent local minima during neural network training, multiple runs were conducted using varied dataset samplings (e.g., selecting every second or third pixel), different random initial weights, and various proportions for training, testing, and validation. Local minima were identified by unusually short convergence times during training. Overfitting was mitigated by utilizing a very large dataset (typically exceeding one million data points), which encouraged the network to generalize, as well as by minimizing the number of neurons in the hidden layer. Unreasonable data, such as fill values, were filtered out to reduce noise, and range limits were applied to exclude obviously erroneous data, as retaining such data in the input set could hinder generalization. Unnecessary input parameters were also removed through a trial-and-error process to optimize the training. The network’s reliability was confirmed by its comparable performance when applied to the AMSR-2 neural network snow depth results for the 2018–2019 winter training dataset and the independent 2019–2020 validation dataset. This consistency demonstrated that the network achieved global minima without overfitting. During the initial training, potential input variables were evaluated by adding one parameter at a time. After each addition, the model’s performance was assessed by comparing its accuracy against the training truth–ICESat-2 snow depth. If a parameter did not improve accuracy, it was excluded. This process continued until the final set of input variables was determined, as listed in Table 2.
While AMSR can penetrate some cloud cover to retrieve snow depth, thick or persistent cloud cover, particularly in regions like the Arctic and Southern Ocean, can degrade the quality of microwave measurements and reduce the accuracy of neural network-based retrievals. To mitigate this issue, it is important to apply a cloud screen to filter out unreliable observations.
The Cloud-Aerosol Lidar with Orthogonal Polarization (CALIOP), instrument, aboard the CALIPSO satellite launched in 2006 as part of the A-Train constellation, operates both day and night with repeat cycle of 16 days. CALIOP can detect a wide range of cloud thicknesses, from thin cirrus clouds to thick cumulus clouds. These capabilities enable more precise and comprehensive assessments of global cloud cover, especially in polar regions where passive remote sensing instruments face challenges in distinguishing snow surfaces from low altitude clouds. A neural network-based cloud detection algorithm for AMSR-2, developed using CALIOP cloud identification as ground truth for training with spatially and temporally collocated AMSR-2 and CALIOP lidar data, was applied in this study to screen high confident cloudy scenes. While the development and validation of the cloud screening neural network algorithm will be presented in a separate publication, its application is essential to the data processing in the current study. In this study, each AMSR-2 pixel is first screened to exclude high-confidence cloudy pixels before applying the neural network-based snow depth retrieval. The proportion of excluded pixels varies daily, ranging approximately from 10% to 18%, depending on the specific day, month, and year of the winter season.
4 Snow depth results
The results presented here consist of the AMSR-2 snow depth results along the temporally and geographically collocated ICESat-2 tracks, as well as snow depth results across AMSR-2 swaths. Comparisons were made between AMSR-2 snow depth estimates and the corresponding ICESat-2 snow depth values using the training dataset from the Arctic winter season of 2019 (December 2018 – March 2019), with independent data from the 2020 winter season to validate the robustness of the estimates. Weights and constants of the neural network were optimized during the training phase and subsequently applied to independent datasets over Arctic sea ice.
4.1 Results along the temporally and geographically collocated ICESat-2 path
Figure 1 illustrates snow depth comparisons between AMSR-2 and ICESat-2 for both training (Figures 1a–c) and validation (Figures 1d–f) datasets. The validation data in Figure 1 is from January 2020. Data points were selected where the two instruments were within 1 km of each other and recorded measurements within ±1 h. Scatterplots in Figure 1a (training) and 1d (validation) compare snow depths from ICESat-2 (x-axis) and AMSR-2 (y-axis). Histograms in Figures 1b,e show snow depth distributions for training and validation, respectively. Figures 1c,f present the snow depth differences for training and validation, respectively.
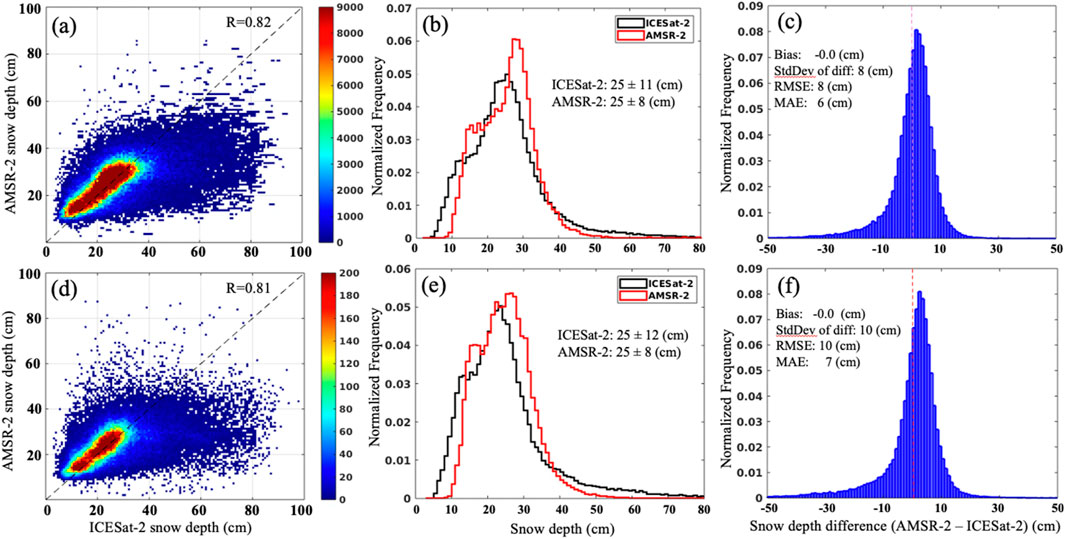
Figure 1. Comparison of AMSR-2 and ICESat-2 Snow Depths: The top row (a–c) represents results from the training dataset (Arctic winter season 2019), while the bottom row (d–f) shows results from the validation dataset for January 2020. The left panel displays scatterplots comparing snow depth estimates from AMSR-2 (y-axis) and ICESat-2 (x-axis). The middle panel illustrates the normalized frequency distributions of snow depth for ICESat-2 (black) and AMSR-2 (red). The right panel depicts the normalized frequency distributions of the snow depth differences (AMSR-2 minus ICESat-2).
The training dataset contains about 3.5 million data points, but the neural network tends to focus on the most frequently occurring data. For snow depths greater than 60 cm or less than 7 cm, where data is sparse, the training process largely ignores these regions (as shown by the red histogram in Figure 1b). This issue is also reflected in the standard deviation: AMSR-2 has a standard deviation of 8 cm, while ICESat-2 has a larger spread with a standard deviation of 11 cm. From the statistics shown in Figure 1c, the neural network’s predicted snow depths have minimal bias compared to ICESat-2, with the root mean square error (RMSE) of 8 cm and a mean absolute error (MAE) of 6 cm.
The validation dataset shows promising consistency with the training results. Like the training data (Figure 1c), the validation data shows no bias (Figure 1f). The validation RMSE and MAE are slightly higher at 10 cm and 7 cm, respectively, compared to 8 cm and 6 cm for training. Additionally, the correlation remains consistent, with a value of 0.82 for training (Figure 1a) and 0.81 for validation (Figure 1d). These results demonstrate that the training process is robust and performs well on unseen data.
Figures 2a–h plot the snow depths from time and geolocation matched AMSR-2 and ICESat-2 over Arctic sea ice for four randomly selected days, each representing a validation month during the Arctic winter of 2020. The lines of dots in Figures 2a,c,e,g indicated ICESat-2 tracks that are time matched and geo-collocated with AMSR-2. The colors of the data points indicate ICESat-2 snow depths, and some (not all) associated hours for each track are labeled nearby. The four selected days are: 28 December 2019 (Figures 2a,b), 22 January 2020 (Figures 2c,d), 27 February 2020 (Figures 2e,f), and 2 March 2020 (Figures 2g,h). The snow depth results (y-axis) from AMSR-2 are shown in Figures 2b,d,f,h, where AMSR-2 in red and ICESat-2 in blue. X-axis presents the hours (top row) and latitude and longitude (bottom row). Note the spacing between hours on the x-axis is uneven, as the data points are sequentially ordered by time for instances where AMSR-2 and ICESat-2 are time-matched and geographically collocated.
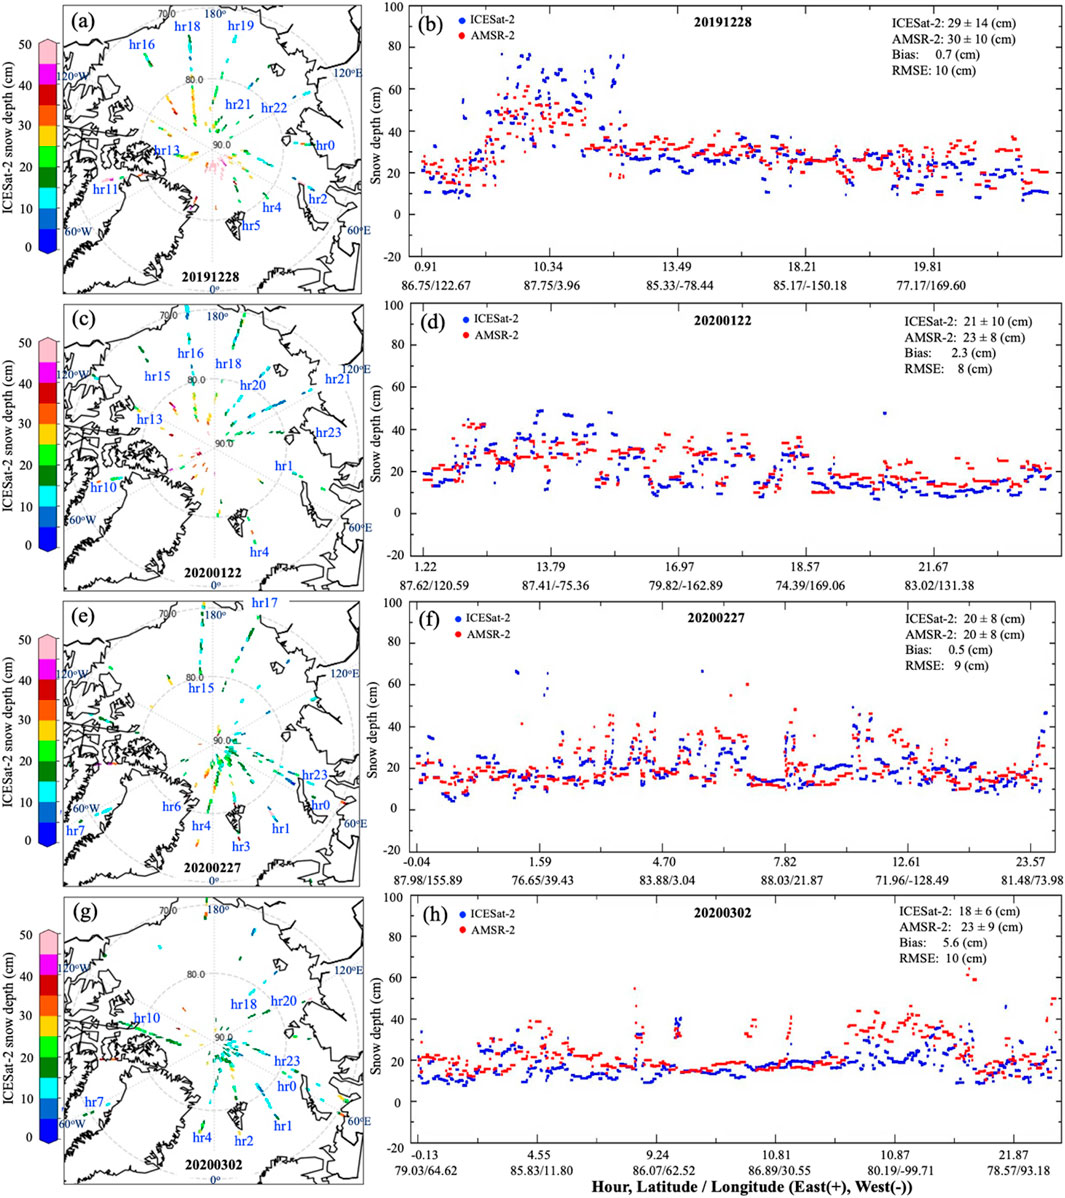
Figure 2. Snow depth comparisons between AMSR-2 and ICESat-2 for four selected dates: 28 December 2019 (a, b), 22 January 2020 (c, d), 27 February 2020 (e, f), and 2 March 2020 (g, h). (a, c, e, g) display the time and location-matched tracks between AMSR-2 and ICESat-2, with a color bar representing ICESat-2 snow depth values. (b, d, f, h) compare AMSR-2 (red) and ICESat-2 (blue) snow depths. The x-axis indicates the hour of the day (top row of x-label) and latitude/longitude (bottom row of x-label) of ICESat-2.
Between the hours of 5:00 and 11:00 on 28 December 2019, as shown in Figures 2a,b, the observations are primarily concentrated at latitudes above 80°N, spanning the region between 60°W and 20°E. This area is characterized by multi-year sea ice, where snow depths are typically significant ∼30–50 cm (Warren et al., 1999). In Figure 2b, ICESat-2 data indicates snow depths as high as 60–80 cm (blue points). AMSR-2 also shows large snow depths in this region, reaching up to 60 cm (red points), although not as high as ICESat-2. After 11:00, during the hours from 11:00 to 23:00, AMSR-2 and ICESat-2 data agree more closely, with both showing snow depths between 15–30 cm, a bias of 0.7 cm, and a RMSE of 10 cm. The agreement is reflected in a minimal bias of 0.7 cm and an RMSE of 10 cm.
Figures 2c,d shows that AMSR-2 accurately captures most of the smaller snow depths compared to ICESat-2 on 22 January 2020, particularly in the first-year snow region during hours 16–23. However, around hours 13–14, AMSR-2 underestimates the snow depths. Overall, AMSR-2 snow depths generally follow the same patterns of increase and decrease as those observed by ICESat-2. The comparison reveals a small bias of 2.3 cm and a RMSE of 8 cm.
The snow depths shown in Figures 2e–h are primarily from the eastern Arctic sea ice on 27 February 2020, and 2 March 2020. Notably, AMSR-2 captures most of the larger snow depths accurately for 27 February 2020. However, it tends to overestimate many snow depths on 2 March 2020. The mean and standard deviation for AMSR-2 and ICESat-2 are identical for 27 February 2020, both measuring 20 ± 8 cm. On 2 March 2020, the statistics differ: AMSR-2 reports 23 ± 9 cm, while ICESat-2 reports 18 ± 6 cm.
4.2 Results across the AMSR-2 swath
4.2.1 Daily snow depth
Figure 3 presents daily snow depths over Arctic sea ice for 27 February 2020. In cases where there are overlapping swaths from AMSR-2 or overlapping tracks from ICESat-2 within the same region, snow depth values are averaged across all overpasses or tracks. Figure 3a shows snow depths derived from ICESat-2 across all Arctic crossing tracks throughout the day, with a daily mean snow depth of 22 cm and a standard deviation of 9 cm. Figure 3b illustrates averaged snow depths from AMSR-2, but only over regions where ICESat-2 has overpasses, resulting in a mean of 20 cm and a standard deviation of 7 cm. Note, the AMSR-2 snow depths along ICESat-2 tracks shown here are matched by geolocation but not by observation time. Both ICESat-2 and AMSR-2 data over ICESat-2 tracks reveal smaller snow depths (blue regions) over first-year sea ice, primarily located between 170°W and 60°E north of 70°N, and larger snow depths (green, yellow, and red regions) over multi-year sea ice, mostly west of the Arctic Ocean to ∼170oW.The snow depth differences between AMSR-2 (on ICESat-2 tracks) and ICESat-2 are shown in Figure 3c, with ICESat-2 snow depths being slightly higher on average, resulting in a bias of 3 cm and RMSE of 9 cm. Figure 3d depicts averaged snow depths from AMSR-2 swaths for the entire day, with a mean of 22 cm and a standard deviation of 9 cm. The snow depth patterns observed over first-year and multi-year sea ice in this figure are consistent with those in Figures 3a,b. This result highlights the strength of machine learning, as the neural networks trained on ICESat-2 tracks can effectively generalize to wide-swath AMSR-2 data. Notably, AMSR-2 provides full coverage of the entire Arctic Ocean within a single day, a significant advantage over other active sensors.
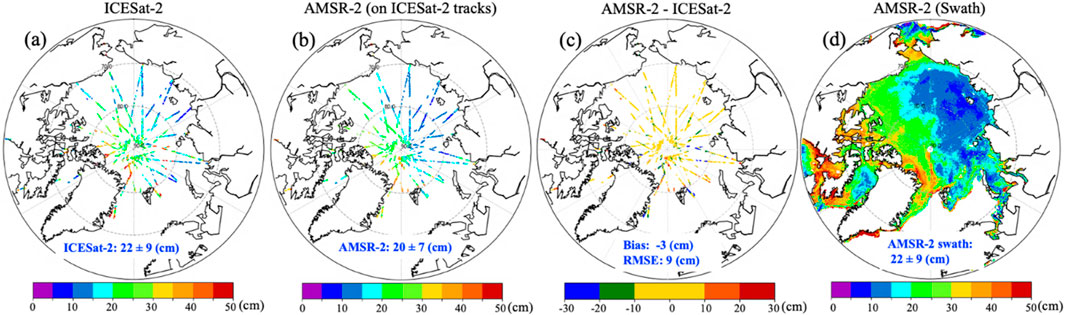
Figure 3. Daily Snow Depths on 17 February 2020: (a, b) are daily snow depths from ICESat-2 and AMSR-2, respectively, with AMSR-2 snow depth values sampled along ICESat-2 overpass tracks. (c) shows the differences in snow depth between AMSR-2 and ICESat-2 (AMSR-2 minus ICESat-2). (d) presents the daily snow depths from AMSR-2 over its wide swath overpasses.
4.2.2 Monthly snow depth
Figure 4 presents the monthly mean snow depths for February 2020. Although ICESat-2’s extremely high spatial resolution of 7 m limits its coverage on a daily basis, it achieves near-global coverage over the course of a month. As shown in Figure 4a, the global monthly mean snow depth is 23 cm with a standard deviation of 10 cm. In contrast, AMSR-2, which has a much lower spatial resolution (∼10 km) but a wider swath, retrieves monthly mean snow depths as depicted in Figure 4b. The AMSR-2 monthly mean snow depth is also 23 cm, with a standard deviation of 8 cm. The monthly mean snow depths retrieved by AMSR-2 (Figure 4b show excellent agreement with those from ICESat-2. Both datasets display similar spatial patterns, with smaller snow depths over first-year sea ice and larger snow depths over multi-year sea ice. The statistical measures for the two datasets are also closely aligned; Figure 4c illustrates the difference between AMSR-2 and ICESat-2 snow depths, revealing a bias of 1 cm (with ICESat-2 values being slightly larger) and a too mean square error of 10 cm. Figure 4d shows the spatial distribution of the standard deviation of AMSR-2 (swath) snow depth retrievals. The standard deviation ranges from less than 2 cm in the central Arctic Ocean to over 8 cm near coastal regions and marginal seas. The central Arctic exhibits more consistent snow conditions, reflected in lower standard deviations.
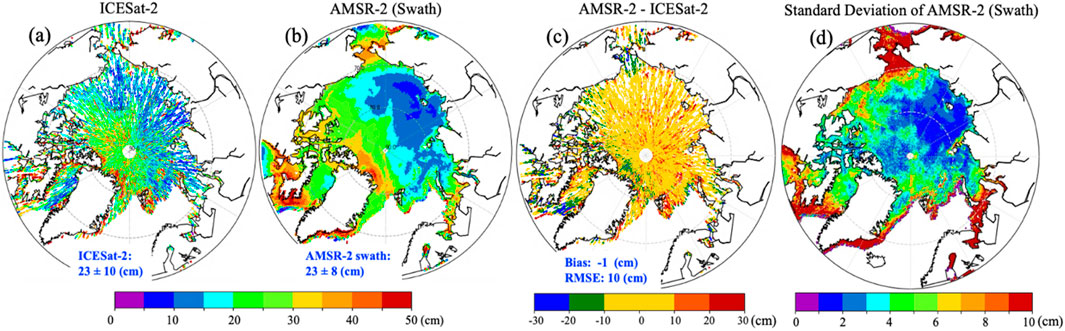
Figure 4. Monthly mean snow depths for February 2020: (a) ICESat-2, (b) swath AMSR-2, and (c) the difference (AMSR-2 minus ICESat-2), shown only along ICESat-2 tracks, (d) the standard deviation of swath AMSR-2 shown in (c).
5 Discussion
5.1 Daily monitoring for snowfall, snowstorm or blizzard
Snowfall and snowstorms in the Arctic can vary significantly from day to day. This work introduces a method for monitoring daily snowfall and snowstorms by analyzing changes in snow depth measurements over consecutive days. The approach involves subtracting the snow depth of 1 day from that of the previous day or earlier days to calculate regional snow accumulation over the specified period across the entire Arctic sea ice. Figure 5 illustrates this process. Figure 5a shows the snow depth on 4 February 2020, while Figures 5b–d present the snow accumulation over one, two, and 3 days, respectively. Note that persistent cloud cover in the Central Arctic near Greenland (white area marked as “Overcast” in Figure 5a) on 4 February 2020, prevented snow depth measurements in that region. Regions such as the Laptev Sea, off the coast of Siberia, frequently experience snowfall and snowstorms in early winter, driven by the interaction between cold Siberian air masses and Arctic cyclones. During the deep winter months, light snowfall and blizzards can still occur over the sea ice. For example, from February 4 to 7 February 2020, snowfall persisted across the Laptev Sea and parts of the Central Arctic. Snow accumulation during this period measured 2 cm after 1 day, 4 cm after 2 days, and 6 cm after 3 days. This study demonstrates a system for monitoring daily snowfall and snowstorms, which is particularly valuable in remote regions like Arctic sea ice, where ground-based observations are extremely challenging.
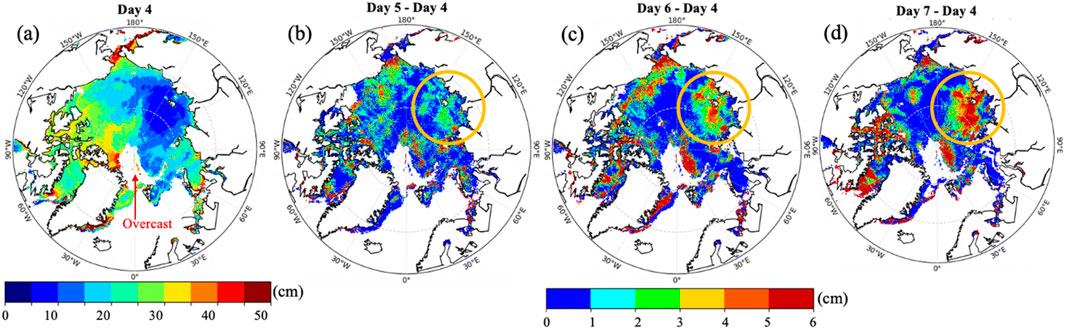
Figure 5. (a) AMSR-2 snow depth measurements for 4 February 2020. (b) Snow accumulation from 4 February to 5 February 2020. (c) Snow accumulation from 4 February to 6 February 2020. (d) Snow accumulation from 4 February to 7 February 2020.
Figure 6 provides another example. As mentioned in Section 2.5, the standard AMSR-2 daily snow depth product (Meier, 2018) provides 5-day running mean values. Figures 6d–f display snow depth results from the standard AMSR-2 product. Figures 6d,e show snow depths from 2 February 2019, and 5 February 2019, respectively. Figure 6f represents the snow accumulation between Day 2 and Day 5, calculated by taking the difference between the snow depths on February 5 and 2 February 2019. In the East Siberian Sea, the standard AMSR-2 product indicates a snow accumulation of just under 2 cm. In contrast, Figures 6a–c show snow accumulation data from this study, with an accumulation of ∼6 cm, compared to the 2 cm indicated by the standard AMSR-2 product. While the two methods report different snow accumulation values, they both highlight similar areas of snowfalls, as shown by the yellow circles. The standard AMSR-2 snow depth product represents a 5-day running average, which can result in muted values. Therefore, it is not surprising that the standard AMSR-2 product shows lower snow accumulation compared to the results from this work. Another important point to note is the snow depth coverage. The standard AMSR-2 product is limited to snow cover on first-year sea ice and does not provide snow depth retrievals over multi-year sea ice (Kelly, 2009; Meier, 2018), as shown over Central Arctic in Figures 6d–f. In contrast, the AMSR-2 snow depth retrievals presented in this paper cover both first-year and multi-year sea ice, as illustrated in Figures 6a–c.
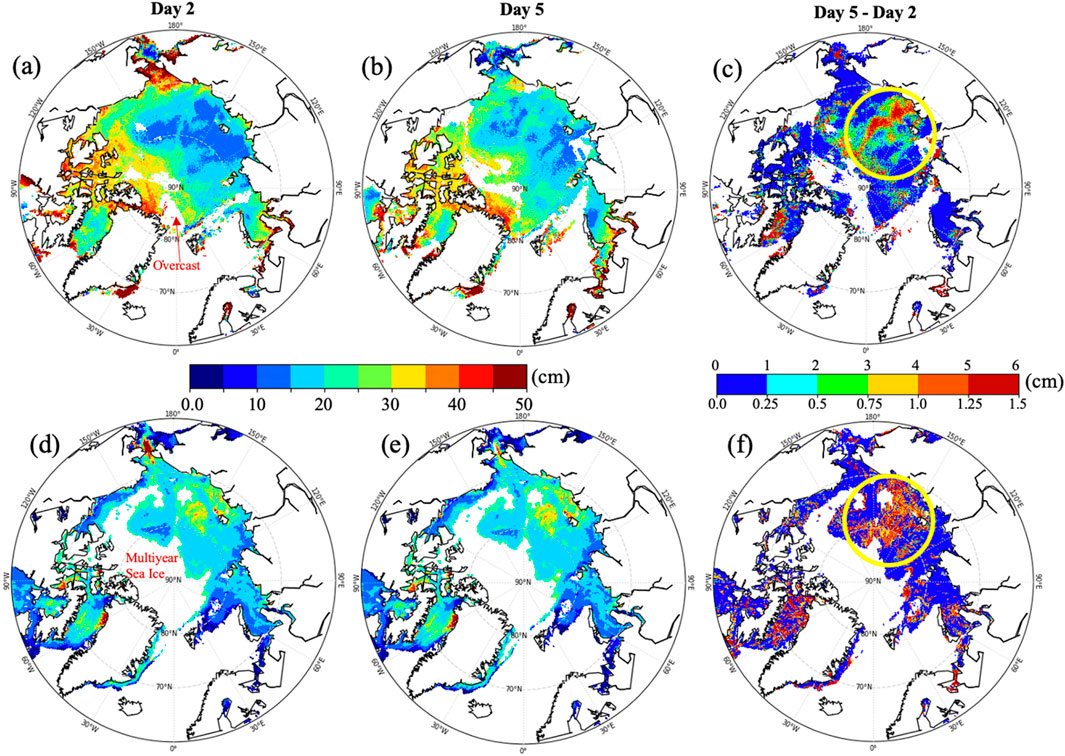
Figure 6. (a, b, c) show snow accumulation data from this study. (d, e, f) display snow depth results from the standard AMSR-2 product. (c, f) show snow accumulation from 2 February 2019 to 5 February 2019, respectively.
5.2 Independent validation
As mentioned earlier, snow depth has been the focus of numerous algorithmic studies (Warren et al., 1999; Kwok et al., 2017; Kwok et al., 2020; Hu Y. et al., 2022; Kacimi and Kwok, 2022; Lu et al., 2022), making it essential to understand how the current approach compares with other algorithms. Figure 7 illustrates the monthly snow depth results over Arctic sea ice for four winter months—December, January, February, and March—across two winter seasons (2018–2019 and 2019–2020). From left to right, Figure 7 presents results from ICESat-2 (Figure 7a), AMSR-2 (Figure 7b), IS2-CS2 (Figure 7c), and standard AMSR-2 (Figure 7d). In the Beaufort Sea, Chukchi Sea, East Siberian Sea, and Laptev Sea regions, all four snow depth datasets exhibit an increase in snow depth from December to March, as shown in the top four rows of Figure 7 for 2018–2019 and the bottom four rows for 2019–2020. This progression is evident in Figure 7, with colors transitioning from dark blue in December to light blue in March for both winter seasons, except in the standard AMSR-2 dataset (Figure 7d), where the colors shift from light blue to green-blue. There is good agreement in snow depth patterns, including highs and lows, among ICESat-2, AMSR-2, and IS2-CS2 over sea ice in regions where IS2-CS2 provides snow depth coverage (Figure 7c).
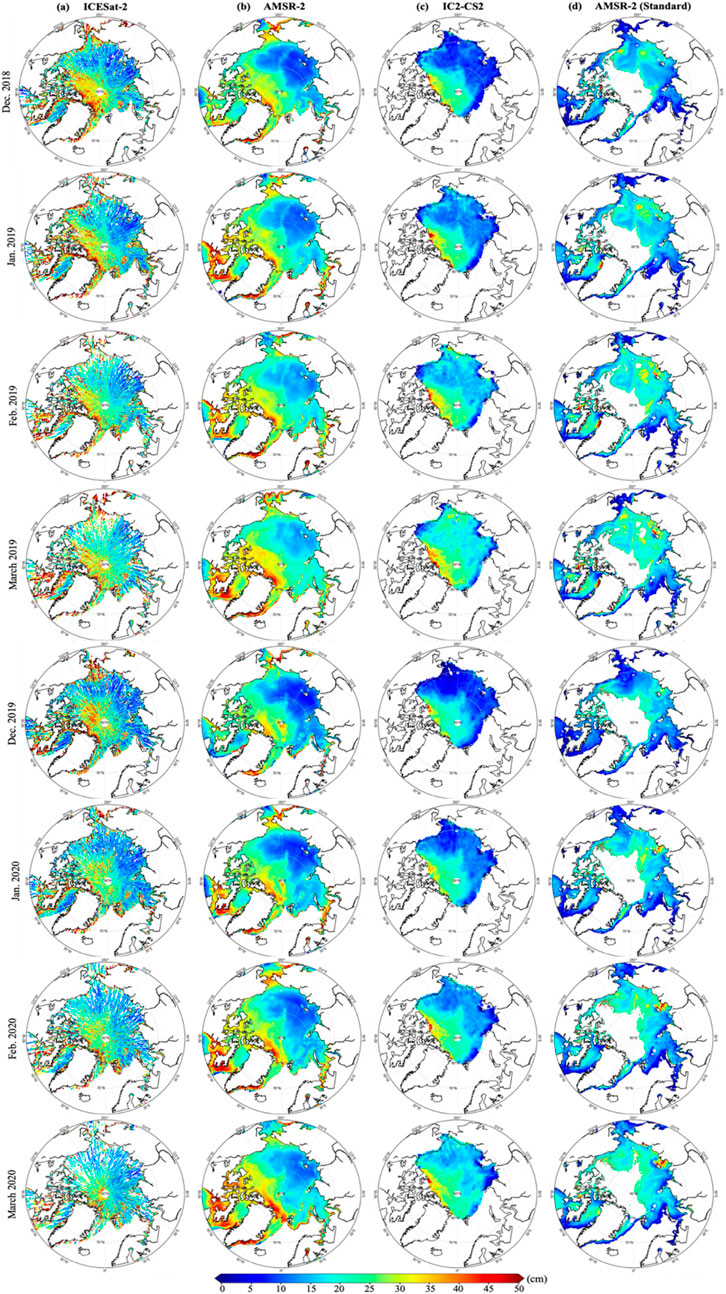
Figure 7. Monthly snow depths from left to right: (a) ICESat-2, (b) AMSR-2, (c) IS2-CS2, and (d) standard AMSR-2, covering two winter seasons: December 2018 (top row) to March 2019 (fourth row), and December 2019 (fifth row) to March 2020 (bottom row).
In the central Arctic, snowpacks are not uniform and tend to have variations in depth and structure, often forming what one might call “snow valleys” and “snow peaks.” ICESat-2 snow depth, with its aggregated spatial resolution of ∼7 m, captures these features in detail, as shown in Figure 7a. The other snow depth datasets—AMSR-2 (7–10 km resolution), IS2-CS2 (24 km resolution), and standard AMSR-2 (24 km resolution)—represent averaged snow depth, appearing as smoothed reddish-yellow patterns.
Another notable aspect is the variation in coverage among the different snow depth datasets. Snow depths from ICESat-2 and AMSR-2 (Figures 7a,b) provide full coverage of the Arctic Ocean. Snow depth from IS2-CS2 is limited to the Arctic Ocean region defined by the gateways into the Pacific Ocean (Bering Strait), the Canadian Arctic Archipelago (CAA), and the Greenland (Fram Strait) and the Barents Seas, as shown in Figure 7c (Kacimi and Kwok, 2022). Standard AMSR-2, on the other hand, only provides snow depth over first-year sea ice (Kelly, 2009; Meier, 2018). Consequently, the AMSR-2 snow depth from this work is the only dataset offering complete snowpack coverage across the entire Arctic Ocean.
The enhanced monthly snow depth maps from the neural network-based AMSR-2 retrievals offer significantly broader spatial coverage compared to IS2-CS2 and standard AMSR-2 datasets, particularly over multi-year sea ice and peripheral Arctic regions. This expanded coverage enables a range of important applications in sea ice research, climate studies, and operational forecasting.
One major benefit is the improvement in sea ice mass balance estimates. Snow depth is a critical parameter for converting satellite freeboard measurements into ice thickness. With more complete and frequent snow depth data, especially in regions and months where IS2-CS2 data are sparse, researchers can derive more accurate estimates of sea ice volume and its seasonal evolution. These improvements are particularly valuable for assessing long-term changes in Arctic sea ice in the context of climate change.
The detailed snow depth data also support sea ice thermodynamic modeling. Snow insulates the underlying ice, regulating heat exchange and influencing ice growth and melt rates. Monthly maps with comprehensive coverage allow for better initialization and validation of thermodynamic sea ice models, leading to improved simulations of ice processes across varying Arctic conditions. From a modeling perspective, the monthly AMSR-2 snow depth maps can be used to validate outputs from regional climate models like RACMO, MAR, and HIRHAM. These datasets are particularly useful for evaluating model performance in marginal seas and transition zones between first-year and multi-year ice, where snow accumulation patterns can vary widely.
In addition, these AMSR-2 datasets with global Arctic Sea coverage are valuable for atmospheric reanalyses and operational forecasting systems, such as those from European Centre for Medium-Range Weather Forecasts (ECMWF) or NASA’s GMAO. Accurate snow depth inputs can enhance model initialization and improve forecasts of sea ice extent and condition. The ability to monitor snowfall and snow accumulation continuously throughout the winter also helps characterize storm events and assess their impacts, contributing to a deeper understanding of Arctic precipitation variability and trends.
Finally, the improved snow depth information has practical applications in Arctic logistics. Snow conditions over sea ice affect surface roughness, albedo, and bearing capacity—all of which are important for planning shipping routes, ice road construction, and other Arctic operations. By providing broader coverage and higher temporal resolution, the AMSR-2 snow depth maps, daily and monthly, can inform safer and more efficient navigation and planning in the Arctic.
Direct comparisons are challenging due to the different coverage areas of each algorithm. To facilitate a quantitative comparison, snow depth values from all four datasets will be extracted exclusively from regions where IS2-CS2 provides valid snow depth measurements (Figure 7c). For simplicity, this area will be referred to as the “IS2-CS2 Region.” Figure 8 presents the monthly relative frequency histograms of snow depth within the IS2-CS2 region for all four snow depth datasets. Figure 8a displays monthly relative frequency histograms of snow depth over first-year sea ice in IS2-CS2 region for the four winter months, December to March, of 2018–2019 and 2019–2020. Figure 8b shows snow depth over multi-year sea ice. The various snow depths are represented as follows: ICESat-2 (blue), AMSR-2 (red), IS2-CS2 (green), and Standard AMSR-2 (orange). The mean and standard deviation for each of the four snow depth algorithms are shown next to their respective histograms. Overall, the snow depth estimates from the four datasets agree within their respective standard deviations. However, the Standard AMSR-2 snow depth shows the largest mode in December for both winter seasons, a difference that gradually diminishes and disappears by March.
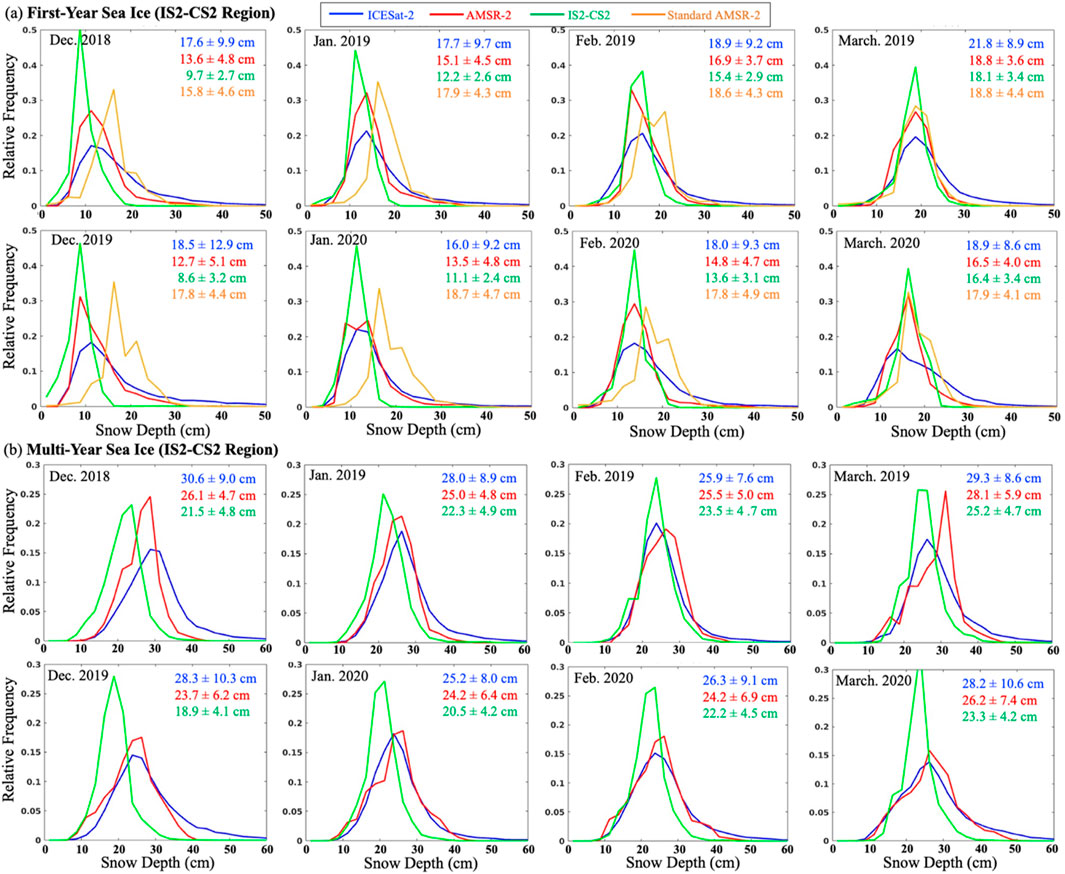
Figure 8. Monthly relative frequency histograms of snow depth in the IS2-CS2 region for the two winter seasons (December to March) of 2018–2019 and 2019–2020. (a) shows snow depth over first-year sea ice, while (b) represents multi-year sea ice. The snow depths are indicated as follows: ICESat-2 (blue), AMSR-2 (red), IS2-CS2 (green), and Standard AMSR-2 (orange). The mean and standard deviation for each of the four snow depth algorithms are displayed next to their corresponding histograms.
As noted earlier, ICESat-2 in Figure 8a, with its extremely high spatial resolution, captures fine-scale snow “valleys” and “peaks,” resulting in the largest snow depth variability (standard deviation) among the algorithms, ranging from 8.6 (March 2020) to 12.9 (December 2019) cm. In contrast, IS2-CS2 snow depths are more uniform and exhibit the smallest variability, with a standard deviation of 2.4 (January 2020) to 3.4 (March 2019 and 2020) cm. The standard deviation for AMSR-2 ranges from 3.6 (March 2019) to 5.1 (December 2019) cm, while for Standard AMSR-2, it is 4.1 (March 2020) to 4.9 (February 2020) cm. Since both AMSR-2 and Standard AMSR-2 use data from the same instrument, their snow depth variations are similar. However, AMSR-2 exhibits a slightly larger spread due to its neural network algorithm, which utilizes all six channels listed in Table 1, whereas Standard AMSR-2 relies only on the 18.7 GHz and 36.5 GHz channels.
Figure 8b shows the snow depth results over multi-year sea ice in IS2-CS2 region from ICESat-2, AMSR-2, and IS2-CS2. The three datasets show excellent agreement in snow depth estimates over multi-year sea ice. However, the mode of the snow depth from IS2-CS2 tends to be smaller compared to both ICESat-2 and AMSR-2, especially in December and January, with the differences becoming less pronounced in February and March. Figures 8a,b demonstrate that snow depths over multi-year sea ice are consistently thicker than those over first-year sea ice. During all four winter months of both the 2018–2019 and 2019–2020 seasons, the difference in mean snow depth between multi-year and first-year sea ice remains consistent at 9–10 cm across all three datasets.
To further evaluate the reasonableness and reliability of AMSR-2 neural network-based snow depth, we draw on validation studies and comparisons with independent IceBridge measurements. Lu et al. (2020) validated ICESat-2-derived snow depths by comparing them with co-located IceBridge snow depth measurements over Arctic sea ice. The comparison showed good agreement, with an RMSE of 7.8 cm, corresponding to 29.2% of the mean snow depth.
Although IceBridge measurements are not temporally aligned with the current AMSR-2 dataset, we conduct a comparative analysis to assess the reasonableness of the AMSR-2 snow depth retrievals. Specifically, we use IceBridge snow radar data collected during an 8-day period in March 2017 (days 3–24) and compare them with AMSR-2-derived snow depth from March 2020 over the same spatial domain, along the IceBridge flight tracks. As shown in Figure 9, the IceBridge snow depth exhibits a broader distribution with a mean of 26.8 ± 11.4 cm, while the AMSR-2 retrievals show a narrower peak centered around a mean of 28.7 ± 6.2 cm. Despite the different years of observation, the two datasets show comparable mean snow depths, though with distinct variability characteristics. Due to IceBridge’s high spatial resolution (on the order of meters), it can capture the full range of snow depth variability, including both shallow and deep snow. In contrast, AMSR-2’s coarser resolution (tens of kilometers) results in a spatially averaged snow depth estimate, which tends to smooth out local variability. Despite these differences, AMSR-2 snow depth shows a bias of approximately 4 cm with AMSR-2 snow depth larger and an RMSE of 10 cm relative to IceBridge, suggesting a reasonable level of agreement—particularly given that the datasets come from different years.
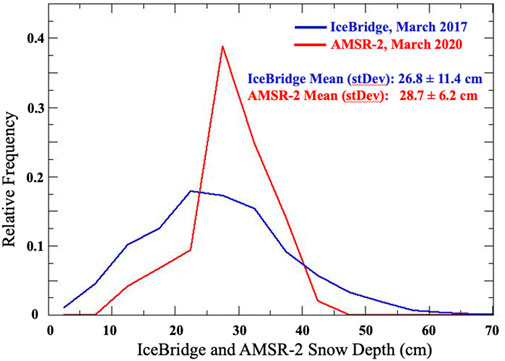
Figure 9. Relative frequency distributions of snow depth measured from IceBridge (March 2017, blue) and retrieved from AMSR-2 (March 2020, red). The mean and standard deviation for each of the two snow depths are displayed next to their corresponding histograms.
5.3 Uncertainty
Overall, there is good agreement between AMSR-2 and ICESat-2 (Figures 1a,b) for snow depths less than ∼50 cm over both first-year and multi-year sea ice. Similarly, reasonable consistency is observed among ICESat-2, AMSR-2, IS2-CS2, and Standard AMSR-2 (Figures 7, 8) for snow depth estimates across both sea ice types. However, despite this general agreement, uncertainties remain in AMSR-2 snow depth retrievals, particularly as snow depth increases. This section examines the key factors contributing to these uncertainties.
One primary source of uncertainty arises from the non-linearity in the relationship between snow depth and brightness temperature. At shallow snow depths, variations in snow depth lead to pronounced changes in brightness temperature, making retrievals more sensitive. However, as snow depth increases, this sensitivity diminishes, causing the relationship to flatten. This behavior is evident in Figures 1a,d, where the neural network algorithm retrieves snow depth effectively up to approximately ∼50 cm. Beyond this threshold, the retrievals become increasingly saturated, making it difficult to distinguish further increases in snow depth. This saturation effect can be attributed to the physical properties of microwave radiation in deeper snowpacks. As snow depth increases, radiation emitted from the lower layers undergoes scattering and absorption before reaching the surface, resulting the observed brightness temperature to become saturated and less responsive to additional increases in snow depth. Additionally, larger snow grains, which are more prevalent in deeper snow, enhance microwave scattering at higher frequencies (e.g., 37 GHz and 89 GHz), further exacerbating this saturation effect (Rostosky et al., 2018).
Another source of uncertainty is the neural network’s ability to learn and generalize from its training data. While AMSR-2 does have inherent limitations in sensitivity to deep snow depending on the frequencies used in the training, the reduced retrieval performance for snow depths exceeding ∼50 cm in this study is primarily due to the scarcity of such cases in the training dataset. As shown in the histograms in Figure 1b, snow depths greater than 50 cm are underrepresented, ∼4.5% of training data, preventing the network from effectively learning the relationship between brightness temperatures and deep snow conditions.
Beyond the training representation challenges in the retrieval algorithm, differences in spatial resolution between ICESat-2 and AMSR-2 contribute to uncertainty. ICESat-2 measurements are based on a 10-shot laser average, yielding a horizontal resolution of approximately 7 m, while the resampled AMSR-2 footprint covers a much larger 10 × 10 km area. Within this footprint, snow depth can vary significantly due to surface roughness features such as wind-formed snowdrifts, ridges, and depressions. Consequently, representing snow depth with a single AMSR-2 value introduces uncertainty, as subpixel variability cannot be fully accounted for. Lower frequency channels are often relied upon for their ability to retain sensitivity to snow depth in case where higher frequency channels become saturated over deep snow. However, AMSR-2 lower frequency channels come with much coarser spatial resolutions, 35 × 62 km for 6.9 GHz and 24 × 42 km for 10.7 GHz, which further exacerbate the mismatch with the high-resolution ICESat-2 data and increase uncertainty due to subpixel variability.
Additionally, uncertainties vary with latitude due to differences in satellite coverage and data density. As a polar-orbiting satellite, ICESat-2 has a higher overpass density at high latitudes than at lower latitudes, as shown in Figure 4a. This results in a greater density of training data at high latitudes (e.g., 80°–90°) compared to lower latitudes (e.g., 60°–70°). Consequently, snow depth retrievals over sea ice at lower latitudes tend to have higher uncertainties due to the relatively sparse training data available in these regions, as clearly illustrated in Figure 4d.
The snow depth retrieval process begins with a neural network-based cloud mask that screens out pixels identified as cloudy with high confidence, typically thick clouds. The snow depth retrieval is then applied to the rest of snow pixels. This mask, neural network trained with AMSR-2 as input and CALIOP as the reference, is essential for ensuring accurate retrievals. However, if the cloud mask fails to detect clouds, particularly thick clouds, and incorrectly classifies a cloudy pixel as clear, snow depth retrieval will still proceed. This misclassification can lead to underestimation errors in the retrieved snow depth, adding another layer of uncertainty to the dataset.
In this study, AMSR2 data for the Arctic Ocean during winter seasons are limited to nighttime observations. When conducting snow depth studies in summer, an additional source of error arises in ICESat-2 snow depth retrievals due to photon count noise from solar background radiation and the detector’s dark current. These noise sources can contaminate the observed photon pathlengths, particularly those associated with snow multiple scattering. If solar background noise is not properly removed from daytime measurements, snow depth may be overestimated by approximately 5–20 cm (Lu et al., 2022). To address this, retrieval algorithms typically utilize the solar background photon counts provided in the ATL03 product. In contrast, the detector’s dark count—approximately five to six orders of magnitude weaker than the snow signal—introduces a negligible bias of less than 0.2 cm (Lu et al., 2022).
6 Summary
A neural network method has been developed to retrieve snow depth on sea ice over the Arctic during winter months. The algorithm utilizes various input data, including radiances and brightness temperature differences from AMSR-2, atmospheric temperature and humidity profiles from GMAO-IT, and sea ice extent from Near-Real-Time NOAA/NSIDC Climate Data Record of Passive Microwave Sea Ice Concentration.
By combining spaceborne lidar and microwave data with state-of-the-art artificial neural networks, this study offers a significant advancement by providing daily, Arctic-wide coverage over both first-year and multi-year sea ice, surpassing the spatial and temporal limitations of existing datasets such as ICESat-2, IS2-CS2, and Standard AMSR-2. These daily estimates enable continuous monitoring of snowfall and snowstorms during Arctic winters and support improved scientific understanding, operational forecasting, and community preparedness. Trained with ICESat-2 data, the retrievals yield unbiased estimates with an RMSE of 8 cm and show strong agreement across multiple independent validation approaches, including instantaneous, daily, and monthly comparisons, with RMSE values ranging from 9 to 10 cm and minimal biases. In key Arctic regions where IS2-CS2 provides valid estimates, AMSR-2 snow depth differences ranged from 0 to 4 cm, remaining within the standard deviation of IS2-CS2 across all months during the 2018–2019 and 2019–2020 winter seasons. Compared to Standard AMSR-2, the neural network estimates are slightly thinner (by 1–5 cm), yet offer improved temporal resolution and broader applicability, including over multi-year sea ice. To further evaluate the robustness and reliability of the method, associated retrieval uncertainties were also thoroughly analyzed and discussed.
A possible alternative approach to snow depth retrieval would involve deploying a high-density array of laser beams alongside radar instruments. In this scenario, lidar would measure the snow surface, while radar would measure the ice surface, with snow depth derived from their difference, similar to the IS2-CS2 methodology. However, such a mission would require an investment of hundreds of millions of dollars and would likely take at least a decade to develop, build, and launch.
In contrast, the method presented in this study leverages existing satellite observations, incurring virtually no additional cost. By utilizing the fine spatial resolution and high accuracy of ICESat-2 snow depth measurements, this approach enables the reconstruction of daily snow depth records spanning the AMSR-E observational period (June 2002–December 2011) and the AMSR-2 era (May 2012–present). Moreover, this method is highly time-efficient—while a new satellite mission would take over a decade to realize, nearly 20 years of snow depth records can be processed in a matter of months rather than years.
Through comprehensive validation and comparisons with ICESat-2, IS2-CS2, and standard AMSR-2 datasets, this study demonstrates that high-accuracy snow depth retrieval can be achieved efficiently and cost-effectively through innovative algorithm development and a strategic approach, utilizing existing satellite observations rather than relying on new satellite missions. However, given the limitations and uncertainties discussed earlier, the deployment of a new satellite with enhanced capabilities at high resolution could further refine this method and improve retrieval accuracy.
The current study focuses on Arctic snow measurements during the winter months, where relatively stable and predominantly nighttime conditions allow for more reliable satellite observations. However, extending the analysis to the summer season presents significant challenges for both ICESat-2 and AMSR-2. During the Arctic summer, ICESat-2 measurements are affected by increased background noise from continuous sunlight. The presence of solar photons introduces contamination in the photon detection process, making it more difficult to distinguish actual surface returns from background noise. Similarly, AMSR-2 faces substantial challenges in summer due to changes in the physical properties of the snowpack. The presence of liquid water from melting snow and rainfall alters the microwave emissivity, reducing the contrast between snow-covered and bare ice surfaces. This effect weakens the sensitivity of AMSR-2’s spectral signatures to snow depth variations. Furthermore, increased atmospheric moisture and cloud cover during summer storms can introduce additional interference, complicating the retrieval of accurate snow depth measurements. To address these challenges, future algorithm development will require modifications to improve retrieval accuracy under summer conditions. Such algorithm refinements will be essential for extending the current snow retrieval framework to year-round Arctic monitoring.
Data availability statement
The raw data supporting the conclusions of this article will be made available by the authors, without undue reservation.
Author contributions
SS-M: Writing – original draft, Writing – review and editing. YH: Writing – review and editing. XL: Writing – review and editing. YC: Writing – review and editing. AO: Writing – review and editing.
Funding
The author(s) declare that financial support was received for the research and/or publication of this article. Funding for the lead author was provided by the NASA ICESat-2 award (grant number 80NSSC21K0910).
Acknowledgments
The authors thank the NASA ICESat-2 program, NASA Remote Sensing Theory program, and NASA ESTO’s IIP program for supporting this research.
Conflict of interest
Authors SS-M and YC were employed by Analytical Mechanics Associates, Inc.
The remaining authors declare that the research was conducted in the absence of any commercial or financial relationships that could be construed as a potential conflict of interest.
Generative AI statement
The authors declare that no Generative AI was used in the creation of this manuscript.
Publisher’s note
All claims expressed in this article are solely those of the authors and do not necessarily represent those of their affiliated organizations, or those of the publisher, the editors and the reviewers. Any product that may be evaluated in this article, or claim that may be made by its manufacturer, is not guaranteed or endorsed by the publisher.
References
Alsweiss, S., Sapp, J., Jelenak, Z., and Chang, P (2021). “An operational all-weather wind speed from AMSR2,” in 2021 IEEE international geoscience and remote sensing symposium IGARSS, 11-16 July 2021, Brussels, Belgium, 7334–7337. doi:10.1109/IGARSS47720.2021.9553710
Besso, H., Shean, D., and Lundquist, J. D. (2024). Mountain snow depth retrievals from customized processing of ICESat-2 satellite laser altimetry. Remote Sens. Environ. 300, 113843. doi:10.1016/j.rse.2023.113843
Brucker, L., and Markus, T. (2013). Arctic-scale assessment of satellite passive microwave-derived snow depth on sea ice using Operation IceBridge airborne data. J. Geophys. Res. Oceans 118, 2892–2905. doi:10.1002/jgrc.20228
Cavalieri, D. J., Markus, T., and Comiso, J. C. (2014). AMSR-E/Aqua daily L3 12.5 km brightness temperature, Sea Ice concentration, and snow depth polar grids, version 3. Boulder Colo. doi:10.5067/AMSR-E/AE_SI12.003
Comiso, J. C., Parkinson, C. L., Gersten, R., and Stock, L. (2008). Accelerated decline in the Arctic sea ice cover. Geophys. Res. Lett. 35. doi:10.1029/2007GL031972
Deschamps-Berger, C., Gascoin, S., Shean, D., Besso, H., Guiot, A., and López-Moreno, J. I. (2023). Evaluation of snow depth retrievals from ICESat-2 using airborne laser-scanning data. Cryosphere 17, 2779–2792. doi:10.5194/tc-17-2779-2023
Enderlin, E. M., Elkin, C. M., Gendreau, M., Marshall, H. P., O’Neel, S., McNeil, C., et al. (2022). Uncertainty of ICESat-2 ATL06-and ATL08-derived snow depths for glacierized and vegetated mountain regions. Remote Sens. Environ. 283, 113307. doi:10.1016/j.rse.2022.113307
Fair, Z., Vuyovich, C., Neumann, T. A., Larsen, C. F., Stuefer, S. L., Mason, M., et al. (2024). Characterizing ICESat-2 snow depths over the boreal forests and tundra of Alaska in support of the SnowEx 2023 campaign. Ess. Open Arch. doi:10.22541/essoar.172927223.38169790/v1
Holland, M. M., Bitz, C. M., and Tremblay, B. (2006). Future abrupt reductions in the summer Arctic sea ice. Geophys. Res. Lett. 33. doi:10.1029/2006GL028024
Hu, X., Hao, X., Wang, J., Huang, G., Li, H., and Yang, Q. (2022a). Can the depth of seasonal snow be estimated from ICESat-2 products: a case investigation in altay, northwest China. IEEE Geosci. Remote Sens. Lett. 19, 1–5. doi:10.1109/LGRS.2021.3078805
Hu, Y., Lu, X., Zeng, X., Gatebe, C., Fu, Q., Yang, P., et al. (2023). Linking lidar multiple scattering profiles to snow depth and snow density: an analytical radiative transfer analysis and the implications for remote sensing of snow. Front. Remote Sens. 4. doi:10.3389/frsen.2023.1202234
Hu, Y., Lu, X., Zeng, X., Stamnes, S. A., Neuman, T. A., Kurtz, N. T., et al. (2022b). Deriving snow depth from ICESat-2 lidar multiple scattering measurements. Front. Remote Sens. 3. doi:10.3389/frsen.2022.855159
Kacimi, S., and Kwok, R. (2020). The Antarctic sea ice cover from ICESat-2 and CryoSat-2: freeboard, snow depth, and ice thickness. Cryosphere 14, 4453–4474. doi:10.5194/tc-14-4453-2020
Kacimi, S., and Kwok, R. (2022). Arctic snow depth, ice thickness, and volume from ICESat-2 and CryoSat-2: 2018–2021. Geophys. Res. Lett. 49, e2021GL097448. doi:10.1029/2021GL097448
Kelly, R. (2009). The AMSR-E snow depth algorithm: description and initial results. J. Remote Sens. Soc. Jpn. 29, 307–317. doi:10.11440/rssj.29.307
Kurtz, N. T., and Farrell, S. L. (2011). Large-scale surveys of snow depth on Arctic sea ice from Operation IceBridge. Geophys. Res. Lett. 38. doi:10.1029/2011GL049216
Kurtz, N. T., Farrell, S. L., Studinger, M., Galin, N., Harbeck, J. P., Lindsay, R., et al. (2013). Sea ice thickness, freeboard, and snow depth products from Operation IceBridge airborne data. Cryosphere 7, 1035–1056. doi:10.5194/tc-7-1035-2013
Kwok, R., and Cunningham, G. F. (2008). ICESat over Arctic sea ice: estimation of snow depth and ice thickness. J. Geophys. Res. Oceans 113. doi:10.1029/2008JC004753
Kwok, R., Kacimi, S., Webster, M. A., Kurtz, N. T., and Petty, A. A. (2020). Arctic snow depth and Sea Ice thickness from ICESat-2 and CryoSat-2 freeboards: a first examination. J. Geophys. Res. Oceans 125, e2019JC016008. doi:10.1029/2019JC016008
Kwok, R., Kurtz, N. T., Brucker, L., Ivanoff, A., Newman, T., Farrell, S. L., et al. (2017). Intercomparison of snow depth retrievals over Arctic sea ice from radar data acquired by Operation IceBridge. Cryosphere 11, 2571–2593. doi:10.5194/tc-11-2571-2017
Laxon, S., Ridout, A., Wingham, D., Bacon, S., and Giles, K. (2012). Western Arctic Ocean freshwater storage increased by wind-driven spin-up of the Beaufort Gyre. Nat. Geosci. - Nat. Geosci. 5, 194–197. doi:10.1038/ngeo1379
Lejeune, Y., Dumont, M., Panel, J.-M., Lafaysse, M., Lapalus, P., Le Gac, E., et al. (2019). 57 years (1960–2017) of snow and meteorological observations from a mid-altitude mountain site (Col de Porte, France, 1325 m of altitude). Earth Syst. Sci. Data 11, 71–88. doi:10.5194/essd-11-71-2019
Levenberg, K. (1944). A method for the solution of certain nonlinear problems in least squares. Q. Appl. Math. 2, 164–168. doi:10.1090/qam/10666
Lievens, H., Brangers, I., Marshall, H.-P., Jonas, T., Olefs, M., and De Lannoy, G. (2022). Sentinel-1 snow depth retrieval at sub-kilometer resolution over the European Alps. Cryosphere 16, 159–177. doi:10.5194/tc-16-159-2022
Liu, Z., Zhu, J., Fu, H., Zhou, C., and Zuo, T. (2020). Evaluation of the vertical accuracy of open global DEMs over steep terrain regions using ICESat data: a case study over hunan province, China. Sensors 20, 4865. doi:10.3390/s20174865
Lu, X., Hu, Y., Liu, Z., Rodier, S., Vaughan, M., Lucker, P., et al. (2017). Observations of Arctic snow and sea ice cover from CALIOP lidar measurements. Remote Sens. Environ. 194, 248–263. doi:10.1016/j.rse.2017.03.046
Lu, X., Hu, Y., Zeng, X., Stamnes, S. A., Neuman, T. A., Kurtz, N. T., et al. (2022). Deriving snow depth from ICESat-2 lidar multiple scattering measurements: uncertainty analyses. Front. Remote Sens. 3. doi:10.3389/frsen.2022.891481
Magruder, L., and Brunt, K. (2018). Performance analysis of airborne photon- counting lidar data in preparation for the ICESat-2 mission. IEEE Trans. Geosci. Remote Sens. 56, 2911–2918. doi:10.1109/TGRS.2017.2786659
Magruder, L., Brunt, K., and Alonzo, M. (2020). Early ICESat-2 on-orbit geolocation validation using ground-based corner cube retro-reflectors. Remote Sens. 12, 3653. doi:10.3390/rs12213653
Markus, T., and Cavalieri, D. J. (1998). “Snow depth distribution over Sea Ice in the Southern Ocean from satellite passive microwave data,” in Antarctic Sea ice: physical processes, interactions and variability (American Geophysical Union AGU), 19–39. doi:10.1029/AR074p0019
Markus, T., Neumann, T., Martino, A., Abdalati, W., Brunt, K., Csatho, B., et al. (2017). The ice, cloud, and land elevation satellite-2 (ICESat-2): science requirements, concept, and implementation. Remote Sens. Environ. 190, 260–273. doi:10.1016/j.rse.2016.12.029
Marquardt, D. W. (1963). An algorithm for least-squares estimation of nonlinear parameters. J. Soc. Ind. Appl. Math. 11, 431–441. doi:10.1137/0111030
Martino, A. J., Neumann, T. A., Kurtz, N. T., and McLennan, D. (2019). ICESat-2 mission overview and early performance. Proceedings of the SPIE 11151, 11. doi:10.1117/12.2534938
Maykut, G. A., and Untersteiner, N. (1971). Some results from a time-dependent thermodynamic model of sea ice. J. Geophys. Res. 76, 1550–1575. doi:10.1029/JC076i006p01550
Meier, M., (2018). AMSR-E/AMSR2 unified L3 daily 12.5 km brightness temperatures, Sea Ice concentration, motion and snow depth polar grids, version 1. NASA Natl. Snow Ice Data Cent. Distrib. Act. Arch. Cent. doi:10.5067/RA1MIJOYPK3P
Meier, W. N., Fetterer, F., Windnagel, A. K., Stewart, J. S., and Stafford, T. (2024). Near-real-time NOAA/NSIDC climate data record of passive microwave Sea Ice concentration. (G10016, version 3). Boulder Colo, USA: Natl. Snow Ice Data Cent. doi:10.7265/j0z0-4h87
Ménard, C. B., Essery, R., Barr, A., Bartlett, P., Derry, J., Dumont, M., et al. (2019). Meteorological and evaluation datasets for snow modelling at 10 reference sites: description of in situ and bias-corrected reanalysis data. Earth Syst. Sci. Data 11, 865–880. doi:10.5194/essd-11-865-2019
Neuenschwander, A., Pitts, K. L., Jelley, B. P., Robbins, J., Klotz, B., Popescu, S. C., et al. (2021). ATLAS/ICESat-2 L3A land and vegetation height, version 5. Boulder Colo. doi:10.5067/ATLAS/ATL08.005
Neumann, T. A., Brenner, A., Hancock, D., Robbins, J., Saba, J., Harbeck, K., et al. (2021). ATLAS/ICESat-2 L2A global geolocated photon data, version 5. Boulder, Colorado USA: NASA National Snow and Ice Data Center Distributed Active Archive Center. doi:10.5067/ATLAS/ATL03.005
Neumann, T. A., Martino, A. J., Markus, T., Bae, S., Bock, M. R., Brenner, A. C., et al. (2019). The ice, cloud, and land elevation satellite – 2 mission: a global geolocated photon product derived from the advanced topographic laser altimeter system. Remote Sens. Environ. 233, 111325. doi:10.1016/j.rse.2019.111325
Newman, T., Farrell, S. L., Richter-Menge, J., Connor, L. N., Kurtz, N. T., Elder, B. C., et al. (2014). Assessment of radar-derived snow depth over Arctic sea ice. J. Geophys. Res. Oceans 119, 8578–8602. doi:10.1002/2014JC010284
Pflug, J. M., Kumar, S. V., Livneh, B., Gutmann, E. D., Gangrade, S., and Kao, S.-C. (2025). Comparisons of montane snow water equivalent projections: calculating total snow mass in regions with projection agreement and divergence in the western United States. J. Clim. 38, 855–874. doi:10.1175/JCLI-D-24-0128.1
Rostosky, P., Spreen, G., Farrell, S. L., Frost, T., Heygster, G., and Melsheimer, C. (2018). Snow depth retrieval on Arctic Sea Ice from passive microwave radiometers—improvements and extensions to multiyear ice using lower frequencies. J. Geophys. Res. Oceans 123, 7120–7138. doi:10.1029/2018JC014028
Shean, D. E., Bhushan, S., Smith, B. E., Besso, H., Sutterley, T. C., Swinski, J.-P., et al. (2021). Evaluating and improving seasonal snow depth retrievals with satellite laser altimetry. AGU Fall Meet New Orleans, LA, C33B–C04.
Sturm, M., Holmgren, J., and Perovich, D. K. (2002). Winter snow cover on the sea ice of the Arctic Ocean at the surface heat budget of the Arctic Ocean (SHEBA): temporal evolution and spatial variability. J. Geophys. Res. Oceans 107, 23. doi:10.1029/2000JC000400
Sturm, M., and Massom, R. (2016). “Snow in the sea ice system: friend or foe?,” in Sea ice Third Edn. (John Wiley & Sons) (Hoboken, NJ: John Wiley & Sons, Ltd)), 65–109. doi:10.1002/9781118778371.ch3
Takala, M., Luojus, K., Pulliainen, J., Derksen, C., Lemmetyinen, J., Kärnä, J.-P., et al. (2011). Estimating northern hemisphere snow water equivalent for climate research through assimilation of space-borne radiometer data and ground-based measurements. Remote Sens. Environ. 115, 3517–3529. doi:10.1016/j.rse.2011.08.014
The MathWorks (2024). MATLAB for Artificial Intelligence. Available online at: https://www.mathworks.com.
Treichler, D., and Kääb, A. (2017). Snow depth from ICESat laser altimetry — a test study in southern Norway. Remote Sens. Environ. 191, 389–401. doi:10.1016/j.rse.2017.01.022
van Tiggelen, M., Smeets, P. C. J. P., Reijmer, C. H., Wouters, B., Steiner, J. F., Nieuwstraten, E. J., et al. (2021). Mapping the aerodynamic roughness of the Greenland Ice Sheet surface using ICESat-2: evaluation over the K-transect. Cryosphere 15, 2601–2621. doi:10.5194/tc-15-2601-2021
Wagner, D. N., Shupe, M. D., Persson, O. G., Uttal, T., Frey, M. M., Kirchgaessner, A., et al. (2021). Snowfall and snow accumulation processes during the MOSAiC winter and spring season. Cryosphere Discuss. 2021, 1–48. doi:10.5194/tc-2021-126
Warren, S. G., Rigor, I. G., Untersteiner, N., Radionov, V. F., Bryazgin, N. N., Aleksandrov, Y. I., et al. (1999). Snow depth on Arctic Sea Ice. J. Clim. 12, 1814–1829. doi:10.1175/1520-0442(1999)012<1814:sdoasi>2.0.co;2
Keywords: snow depth, AMSR-2, ICESat-2, microwave, lidar, neural network, pathlength distribution, multiple scattering
Citation: Sun-Mack S, Hu Y, Lu X, Chen Y and Omar A (2025) Neural network-based snow depth retrieval from AMSR-2 brightness temperatures using ICESat-2 measurement as ground truth. Front. Remote Sens. 6:1591276. doi: 10.3389/frsen.2025.1591276
Received: 10 March 2025; Accepted: 23 May 2025;
Published: 04 June 2025.
Edited by:
Jing Li, Peking University, ChinaReviewed by:
Zachary Fair, University of Maryland, United StatesYan Songhua, Wuhan University, China
Copyright © 2025 Sun-Mack, Hu, Lu, Chen and Omar. This is an open-access article distributed under the terms of the Creative Commons Attribution License (CC BY). The use, distribution or reproduction in other forums is permitted, provided the original author(s) and the copyright owner(s) are credited and that the original publication in this journal is cited, in accordance with accepted academic practice. No use, distribution or reproduction is permitted which does not comply with these terms.
*Correspondence: Sunny Sun-Mack, c3plZHVuZy5zdW4tbWFjay0xQG5hc2EuZ292