 Simon Chidodo
 Lulu Zhang2
 Karl-Heinz Feger
- 1Institute of Soil Science and Site Ecology, Faculty of Environmental Sciences, Technische Universität Dresden, Dresden, Germany
- 2Institute for Integrated Management of Material Fluxes and of Resources (UNU-FLORES), United Nations University, Dresden, Germany
Introduction:: Agricultural expansion and intensification have driven substantial land use/land cover (LULC) changes. These changes have caused a drastic reduction in ecosystem services. Understanding the spatial and temporal patterns of LULC change in relation to topographic attributes is essential for effective watershed management, as it provides insights into landscape heterogeneity and supports evidence-based conservation planning. This study analyzed LULC dynamics from 1983 to 2022 in the Sigi River watershed (887 km2) in the East Usambara Mountains, a biodiversity hotspot and critical water source in northeastern Tanzania.
Methods:: Multi-temporal Landsat satellite images were classified using the Random Forest algorithm to assess LULC transitions across elevation and slope gradients.
Results:: The results revealed marked variations in LULC change across topographic zones. The foothill and escarpment areas experienced extensive deforestation and the rapid expansion of small-scale cultivation, whereas upland areas exhibited relatively lower levels of change, primarily transitioning from forest to spice agroforestry. These spatial patterns reflect the influence of population pressure, socio-economic transformations, government land policies, and the establishment of protected areas in the uplands. Slope steepness further modulated LULC dynamics, with steeper slopes across all elevations showing notable forest loss, while gentler slopes may have undergone earlier land conversion, preceding the study period.
Discussion:: The study underscores the importance of integrating topographic attributes into LULC assessments to better understand landscape transformation processes and support sustainable land-use planning and watershed management.
1 Introduction
A change in Land Use/Land Cover (LULC) is widely recognized as a crucial driver of environmental transformations across various disciplines, including soil science, hydrology, natural resource conservation, and regional planning (Mwangi et al., 2017; Msofe et al., 2019; Amini et al., 2022; Rotich et al., 2022; Abuhay et al., 2023; Zarei et al., 2024). The expansion and intensification of agriculture, combined with rapid population growth, are among the primary drivers of LULC changes (cf. Abuhay et al., 2023; Kayitesi et al., 2022; Mangi et al., 2022; Rotich et al., 2022). A critical concern within these changes is the widespread conversion of forestlands and shrublands into agricultural land, which poses significant environmental and ecological challenges (Kirsten et al., 2016; Mwangi et al., 2017; Kayitesi et al., 2022; Mangi et al., 2022). These transformations have profound and far-reaching consequences for ecosystem services, particularly those related to soil and water resources at the watershed scale. In tropical regions, LULC changes are typically fast-paced and pronounced, often resulting in severe environmental impacts within short timeframes (e.g., Mwangi et al., 2017). Addressing these challenges requires a comprehensive approach to land management that balances the competing demands of natural resource conservation such as soil, water, and biodiversity with the need for sustained agricultural productivity to support a growing population (Shokri et al., 2025). This dual mandate presents a significant challenge for national and local authorities, practitioners, and watershed managers. In this context, understanding the temporal and spatial dynamics of LULC changes is essential for developing adaptive and sustainable land management strategies. These strategies should align with the principles of Integrated Watershed Management, ensuring the preservation of ecological integrity while also meeting socio-economic needs (Mwangi et al., 2016a; Mwangi et al., 2016b). Against this background, this study is intended to contribute to this understanding by assessing the patterns and drivers of LULC changes. Results may provide valuable insights to inform the development of sustainable land management practices.
The use of generalized LULC classes instead of detailed and finer classes presents significant challenges in analyzing specific changes within an area (Feng et al., 2022). For example, land uses such as tea, sisal, and small-scale agricultural plots are often grouped under the broad category of “agriculture”, which leads to overly simplified LULC classifications. This limitation hampers the ability to accurately capture the diversity of land uses and their changes. To improve the precision of LULC assessment, it is essential to incorporate more detailed LULC classes. With regard to possible explanations the understanding of the relationship between LULC changes and topographic features appears to be important. Such an approach is crucial for optimizing land use in watersheds and improving natural resource management. Assessments based on oversimplified LULC maps, particularly those not considering topographic features, are more likely to result in incorrect conservation strategies or inaccurate modeling outcomes (cf. Mwangi et al., 2017; Feng et al., 2022). Several studies have demonstrated the influence of topographic features, such as elevational gradient and slope characteristics (including slope inclination and aspect), on LULC changes over time (Birhane et al., 2019; Wang and Cheng, 2023). For instance, slope inclinations, elevations, and slope orientations have been shown to significantly influence land accessibility for cultivation and associated activities, such as water management, crop selection, erosion control, and machinery requirements (Wondie et al., 2012; Birhane et al., 2019; Wang and Cheng, 2023). Furthermore, the microclimate created by these topographic features can influence planting decisions. Birhane et al. (2019) and Wang and Cheng (2022) demonstrated that terrain attributes also affect land susceptibility to natural disasters, such as floods and landslides.
Many LULC classification efforts have historically been limited by the availability and quality of detailed land use and land cover (LULC) products. These limitations are often driven by constraints in spatial and temporal resolution, as well as the reliability of input data sources (Feng et al., 2022). As a result, substantial uncertainty can be introduced into classification outputs, which may obscure the fine-scale heterogeneity and functional characteristics of terrestrial ecosystems. Accurate and detailed LULC classification is particularly critical in applications such as hydrological modelling, where land cover features strongly influence surface and subsurface hydrological processes. Recent technological advancements have significantly improved the potential for accurate LULC mapping. These include the increasing availability of long-term satellite datasets offering high spectral, spatial, and temporal resolution, and the development of advanced remote sensing products (Feng et al., 2022; Muro et al., 2018; Xu et al., 2022). Alongside these improvements, machine learning techniques—such as Random Forest (RF), Support Vector Machines (SVM), and Decision Trees—have become essential tools for LULC classification due to their ability to model complex, nonlinear relationships and handle high-dimensional input data (Feng et al., 2022). In this study, we evaluated multiple classification algorithms, including RF and SVM, during preliminary testing. Random Forest was selected for final LULC classification based on its superior performance in terms of overall accuracy, class-specific precision, and robustness across diverse topographic and ecological settings. RF also demonstrated greater consistency in handling mixed-pixel effects and minimizing classification error in transitional areas, which are common in mountainous and agroforestry-dominated landscapes. The final RF model was trained using a combination of spectral bands, vegetation indices, topographic variables, and ancillary land cover data to enhance classification precision.
The Sigi River watershed in northeastern Tanzania is notable for several reasons, including its relatively long time series of observed data and significant LULC changes. Since Tanzania’s independence in the 1960s, a substantial portion of the natural forestlands and shrublands in the both upper and lower reaches of the watershed have been converted into agricultural land (Hamilton and Bensted-Smith 1989; Yanda and Munishi, 2007). This transformation has led to a decline in both water quantity and quality in the downstream reservoir, primarily driven by increased soil erosion and related siltation (NERC, 1990; Yanda and Munishi, 2007; Duden and Tollenaar, 2011; Tresierra, 2013). These changes have caused numerous challenges for reservoir operations, including a rising water supply shortage, which is further intensified by the growing population in the area (NERC, 1990; Yanda and Munishi, 2007).
Although a few studies by Hamilton and Bensted-Smith (1989), Reyes et al. (2006), Yanda and Munishi (2007) have investigated LULC changes in the Sigi River watershed, a comprehensive catchment-scale assessment of spatially explicit and dynamic LULC patterns over multiple decades is still lacking. Furthermore, there is insufficient information regarding the relationship between LULC changes and topographic features, particularly how these changes vary across different slopes and elevations within the region’s complex landforms. Previous research has mainly focused on smaller sub-catchments or a specific landscape, such as plateau areas (Hamilton and Bensted-Smith, 1989; Reyes et al., 2006; Yanda and Munishi, 2007). To enable more robust model-based evaluations of landscape adaptation at a watershed scale, it is crucial to address existing knowledge gaps. In this context, a major challenge is to develop advanced LULC maps that offer detailed insights into past LULC changes over both time and space. Accordingly, this study aims to identify and map spatiotemporal changes in LULC across various topographic features by integrating remote sensing techniques. The specific research questions addressed in this study are as follows: (1) What are the historical and current LULC patterns in the watershed, and how do they vary across different elevation classes? (2) How does the magnitude of LULC change differ across elevations? (3) How does the magnitude of LULC change vary by slope within different elevation ranges?.
This study presents the first digital LULC maps for a typical watershed in northern Tanzania, providing a level of information beyond any existing maps. The findings of this research can create a plausible basis and inputs for hydrological modeling that are intended to derive adaptive and resilient land uses and management practices for the East Usambara Mountains, a region recognized for its rich biodiversity and a crucial regional source of water supply. Additionally, the developed methods could be adapted for use in other regions with similar objectives.
2 Materials and methods
2.1 Study area
The Sigi River watershed is located in northeastern Tanzania, with geographic coordinates spanning from −5°12′S, 38°36′E to −4°48′S, 38°70′E. It is situated within the East Usambara Mountains and their foothills, transitioning into the coastal plain (Figure 1). Our study covers the watershed area defined by the outlet of the Mabayani Reservoir, which serves as a vital water resource for the greater Tanga region, home to Tanzania’s second-largest port. The total watershed area covers 887 km2, with elevation ranging from 90 m to 1,200 m asl. The region has experienced substantial environmental changes over decades, particularly due to deforestation driven by the expansion of smallholder agriculture linked to population growth. According to Yanda and Munishi (2007), forest cover in the Sigi River watershed was reduced to 33% (3,896 ha) between 1955 and 1995, while cultivated land increased by 37% (4,341 ha) over the 11,728 ha area of the watershed. This deforestation has led to severe soil erosion and sedimentation, which have adversely impacted downstream water bodies, including the Mabayani Reservoir. The siltation has threatened the reservoir’s operational capacity, reducing its storage potential and posing a risk to urban water supply (NERC, 1994; Yanda and Munishi, 2007). Population figures for the study area have increased from 169,200 in the 1980s to 238,260 in 2022 (URT, 2022).
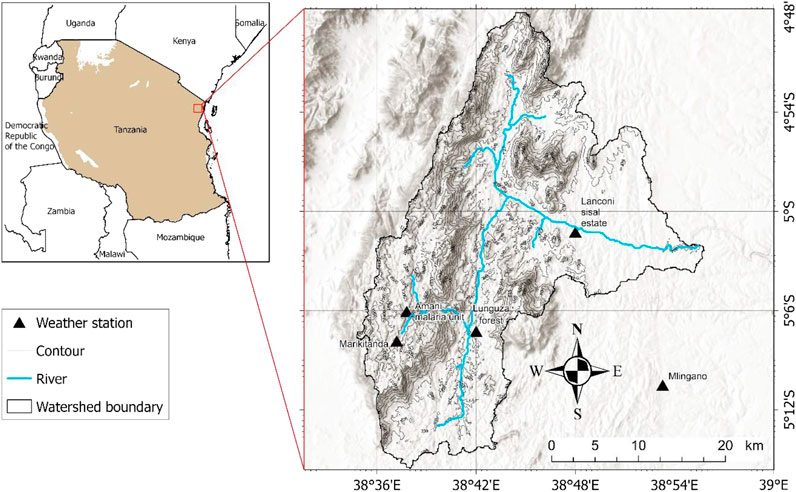
Figure 1. Location of the Sigi River watershed in northeastern Tanzania, highlighting the watercourse, sub-catchments, protected forests, and weather stations.
The climate of the region is humid, characterized by a bimodal rainfall pattern. Rainfall occurs primarily from March to May and from October to December (Hamilton and Bensted-Smith, 1989), with a dry season between January and February, marked by occasional rainfall events. The upland areas receive an average annual rainfall of 1,540 mm and have temperature around 20°C, as observed at the Amani station, while the lowland Lanconi station near the reservoir records an average of 1,173 mm of rainfall and temperature averaging 27°C (Figure 2).
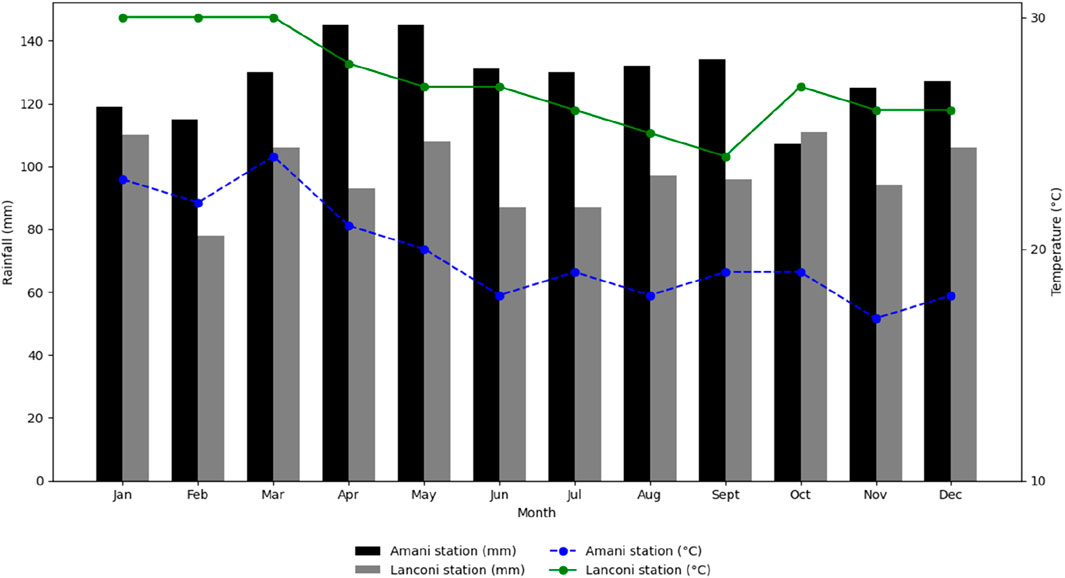
Figure 2. Mean monthly temperature and rainfall at two stations, Amani (upland, 910 m asl) and Lanconi (lowland, 121 m asl) in the Sigi River watershed in 1990–2020 period. Source: Tanzania Meteorological Authority.
Geologically, the catchment is dominated by crystalline bedrocks in the mountain block and escarpment regions, with sedimentary bedrocks found in the foothills and coastal plain. The soil in the mountainous areas are primarily classified as Acrisols, which are nutrient-poor, acidic, and loamy in texture resulting in low soil fertility that is quickly depleted by continuous cultivation (Hartemink, 1997; Kirsten et al., 2016). In contrast, soils at lower elevations are more fertile and better suited for agriculture (Hartemink, 1997). The alluvial valleys are characterized by Fluvisols, which are nutrient-rich and more conducive to cultivation (Ministry of WaterUNDP and GEF, 2019).
2.2 Datasets and data preprocessing
This study used Landsat imagery from Landsat 5 (TM) for 1983, 1996, and 2009, and Landsat eight for 2022, obtained from the USGS via Earth Explorer (http://earthexplorer.usgs.gov). The selected time intervals were chosen to capture long-term LULC trends, minimizing short-term variability and seasonal fluctuations. Images were acquired during December to February, coinciding with the short dry season, which is typically characterized by reduced rainfall and lower cloud cover, increasing the likelihood of cloud-free imagery suitable for analysis. For visual interpretation, field verification, and the assignment of LULC labels for the selected historical years (1983, 1996, and 2009), high-resolution imagery from Google Earth and SPOT 4 (10 m resolution) were also used. These images were crucial for accurate LULC classification during the training data collection. Additionally, a 30-m-resolution Digital Elevation Model (DEM) from the Shuttle Radar Topography Mission (SRTM) was downloaded from the USGS and processed using ArcGIS Pro (version 3.1.0) to derive topographic attributes. Before extracting vegetation indices (VIs), the Landsat Level 2 Science Product (L2SP) data underwent several preprocessing steps to ensure high-quality inputs for analysis. Atmospheric correction was applied to convert the data to Top of Atmosphere (TOA) reflectance. Radiometric correction, including adjustments for TOA reflectance and brightness temperature, was performed to minimize radiometric distortions. Geometric correction was applied to ensure precise spatial alignment of the imagery. Additionally, topographic correction was carried out using the C-correction algorithm to account for the effects of terrain-induced illumination variations (Yin et al., 2022). These preprocessing tasks were executed using ArcGIS Pro and QGIS software to prepare the data for vegetation index extraction and subsequent land use/land cover analysis.
2.3 Land use/land cover (LULC) classification
The LULC classes was identified using a combination of field surveys and expert knowledge, which were instrumental in defining 13 distinct LULC classes (Table 1). The study area was stratified into four elevation zones: Upland (>850 m), Escarpment (350–850 m), Foothill (175–350 m), and Lowland (<175 m). Additionally, the slope was classified into four categories based on terrain steepness: gentle (<5°), moderate (5°–15°), steep (15°–35°), and very steep (>35°) (Figure 3). These classification criteria align with approaches used in previous studies (e.g., Wondie et al., 2012; Birhane et al., 2019; Wang and Cheng, 2022), which underscore the influence of both elevation and slope on land cover patterns.
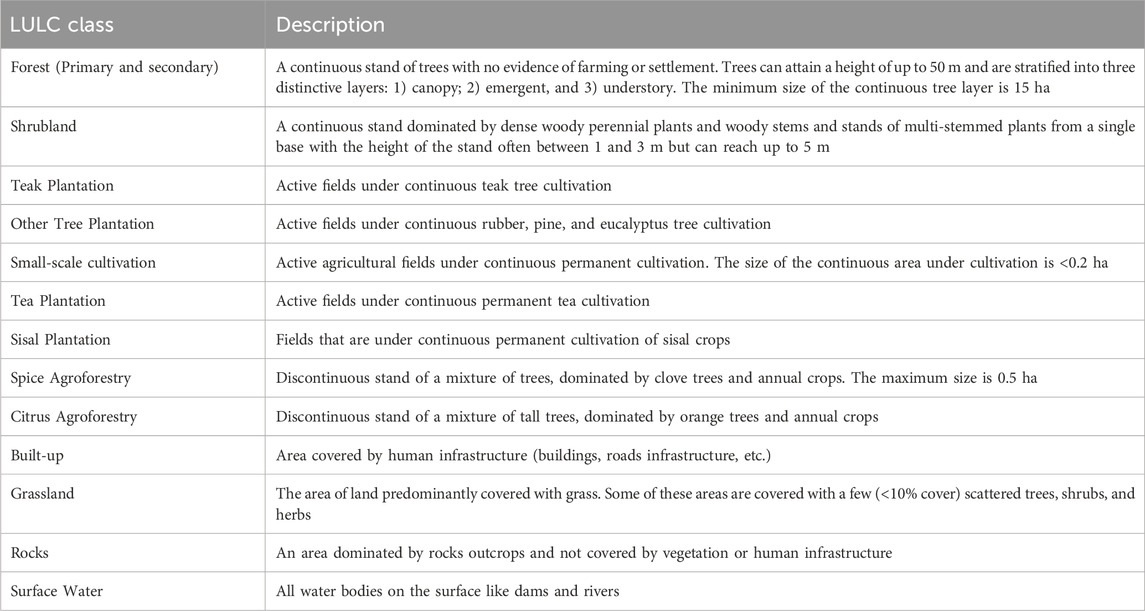
Table 1. List of the 13 selected LULC classes with their corresponding description of land properties.
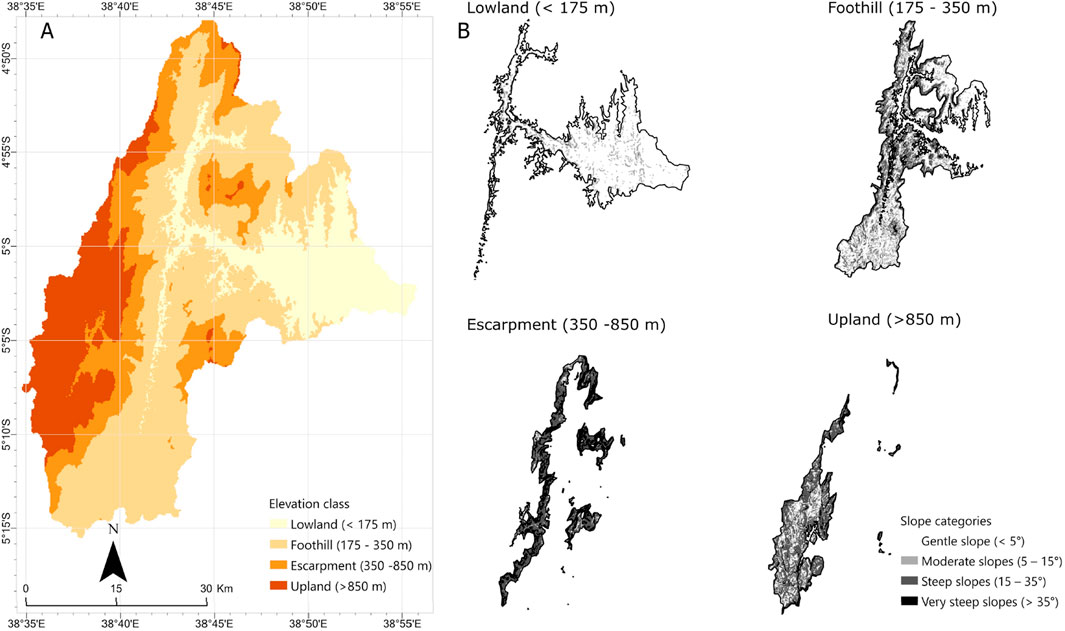
Figure 3. Map of the Sigi River catchment with (A) elevation classes and (B) slope categories across elevation classes.
To ensure representative sampling for LULC classification, a stratified random sampling method was applied within each elevation zone following the approach of Olofsson et al. (2014). Specifically, 100 random samples were selected for each LULC class within each elevation zone, resulting in a total of 5,200 samples per year. Historical training data for the years 1983, 1996, and 2009 were obtained from high-resolution imagery (Google Earth, SPOT 4), and these samples were cross validated with field data to ensure the correctness of the LULC labels. To address potential bias from equal allocation of samples across classes, we additionally applied weighted stratified random sampling, where the number of validation samples was proportional to the actual area of each class. The accuracy metrics obtained through this approach showed only minimal differences compared to the original method, confirming the robustness of the classification results. Precision metrics were also included to provide a more comprehensive evaluation of model performance. To select the most appropriate classification model, we evaluated multiple machine learning algorithms, including Random Forest (RF) and Support Vector Machines (SVM), during the model development phase. Random Forest consistently produced the highest overall accuracy and class-specific precision, especially in complex, topographically variable areas. Given its robustness and reliability, RF was selected for final classification.
LULC classification was performed using the Random Forest algorithm in ArcGIS Pro. The model incorporated Landsat spectral bands (B1–B6), along with several derived indices including the Normalized Difference Vegetation Index (NDVI), Normalized Difference Built-up Index (NDBI), Modified Soil-Adjusted Vegetation Index (MSAVI), Soil-Adjusted Vegetation Index (SAVI), and Modified Normalized Difference Water Index (MNDWI). A supervised classification approach was also employed, using expert-driven sampling points and SPOT four imagery to refine results. The Random Forest classifier, was configured with 200 trees and a maximum depth of 500, ensuring strong predictive performance. The dataset was divided into 70% for training and 30% for validation, enabling a thorough assessment of classification accuracy.
2.4 Post-classification and temporal change analysis
Post-classification corrections were carried out using the ArcGIS Pro Pixel Editor to rectify unrealistic transitions between LULC classes, such as implausible changes (e.g., from agricultural cultivation to forest) that are inconsistent with natural land cover dynamics (Figure 4).
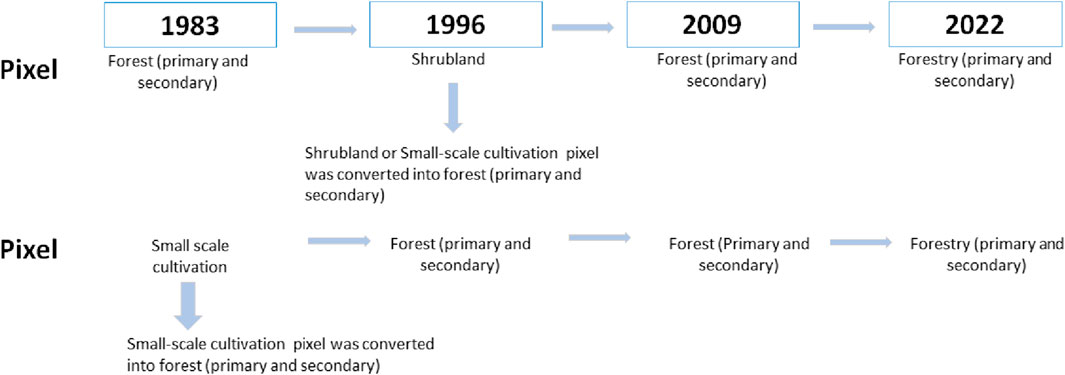
Figure 4. Illustration of the post-classification analysis applied to identify unrealistic LULC changes.
In addition to the LULC classification, temporal land cover changes were analyzed using the OpenLand package in R. Sankey diagrams were created to illustrate transitions between LULC classes across the years 1983, 1996, 2009, and 2022, following the methodology proposed by Aldwaik and Pontius (2012). Such diagrams provide a comprehensive visual representation of land cover dynamics, highlighting significant changes over time. To further explore the spatial distribution of these changes, the final LULC maps were overlayed with elevation and slope layers. This spatial analysis offered valuable insights into the relationship between LULC changes and topographic factors, enabling the identification of spatial patterns and trends in the study area.
2.5 Model performance evaluation
The performance of the classification model was evaluated for the years 1983, 1996, 2009, and 2022 using four key metrics: Accuracy (ACC), recall, precision and the F1-Score, based on a 30% sample of the validation data. Accuracy was calculated as the ratio of correctly predicted pixels (both true positives and true negatives) to the total number of pixels, as shown in Equation 1:
where:
TP (True Positive): Number of features correctly predicted for the observed category; TN (True Negative): Number of features correctly predicted as not belonging to the observed category; FP (False Positive): Number of features incorrectly predicted as belonging to the observed category; FN (False Negative): Number of features incorrectly predicted as not belonging to the observed category.
Recall was calculated as the proportion of correctly predicted features within a given category, as expressed in Equation 2:
where:
TP: True Positives (correctly predicted instances of the observed category); FN: False Negatives (incorrectly predicted instances that do not belong to the observed category).
Precision was calculated as the proportion of correctly predicted positive instances out of all instances predicted as positive. It indicates how many of the predicted positive cases are actually correct. As expressed in Equation 3:
The F1-score was computed as the harmonic mean of precision and recall, expressed in Equation 4:
Where, TP: True Positives (correctly predicted instances of the observed category); FN: False Negatives (incorrectly predicted instances not belonging to the observed category); FP: False positive (incorrectly predicted instances belonging to the observed category).
3 Results
3.1 Current LULC distribution
The LULC distribution in the Sigi River catchment for 2022 (Figure 5; Table 2) reveals that small-scale cultivation is the dominant land use class, covering 360.4 km2, primarily in the foothills and lowland regions, with minimal coverage in the upland. Shrubland (213.4 km2) is the second most prevalent class, concentrated in the foothills, followed by the escarpment and least in the upland areas.
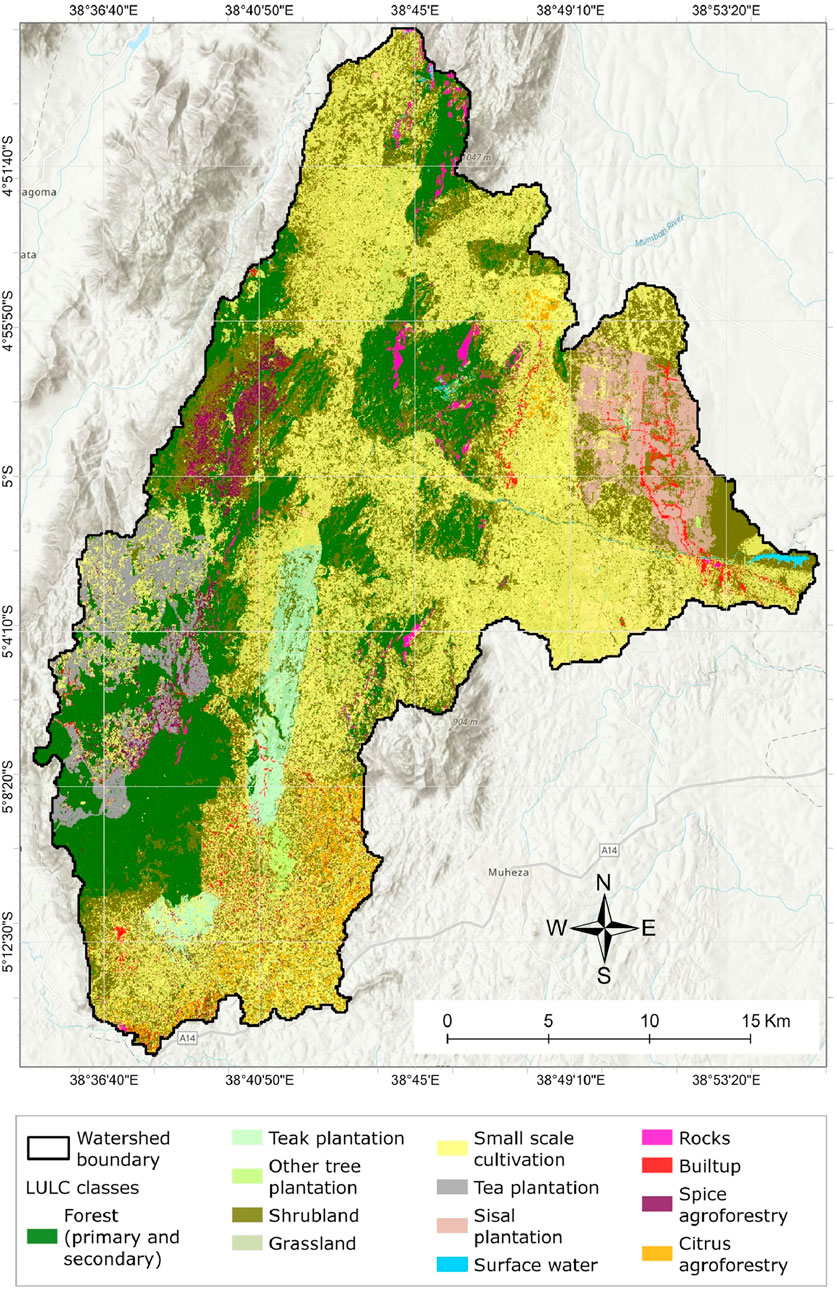
Figure 5. Distribution of LULC in the Sigi River catchment for the year 2022 based on Landsat image analysis.
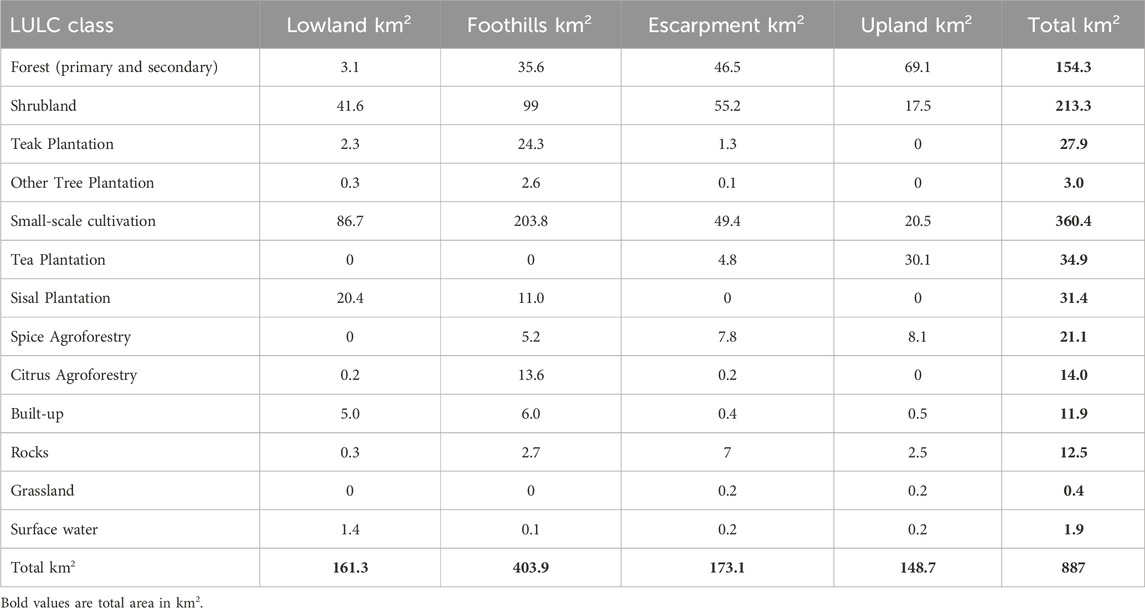
Table 2. Distribution of LULC classes (area segments) across elevation classes and total area of the Sigi River catchment based on the Landsat imagery of 2022.
Forest (primary and secondary), covering 154.3 km2, is predominantly located in the upland regions, followed by the escarpment and with the least area in the lowland. Tea plantations (34 km2) and spice agroforestry (21.1 km2) are concentrated in the escarpment and upland, while sisal plantations (31.5 km2) are most common in the lowland and foothills, and teak plantations (27.9 km2) and citrus agroforestry (14.0 km2) are predominantly found in the foothills. The builtup class, covering 12 km2, is primarily located in the foothills and lowlands. These patterns reflect the topographic and climatic suitability of different regions in the watershed, with agricultural activities and plantations being most concentrated in the lower elevation zones (foothills and lowland), while the upland and escarpment areas are more dominated by forests (primary and secondary) and specialized agroforestry systems.
3.2 Classification accuracy evaluation
The performance of the classification model was evaluated using four metrics: recall, precision, accuracy, and the F1-score, calculated for each LULC class across different time periods. Recall measures the model’s ability to correctly identify positive cases, accuracy reflects the overall correctness of the classifications, and the F1-score provides a balance between recall and precision, particularly in cases where there is class imbalance or costly false predictions. As detailed in Figure 6, Forest (primary and secondary), along with small-scale cultivation, consistently exhibited high recall, precision, accuracy, and F1-scores throughout the study period. Shrubland demonstrated moderate to high performance across the years, although with some variation in its metrics. Teak plantations, although generally classified with high accuracy, showed moderate recall. Other LULC categories, such as tea plantations, sisal plantations, spice agroforestry, and citrus agroforestry, exhibited more variable performance across the time slices. Built-up areas, rocks, grasslands, and surface water consistently achieved high accuracy, although their recall and F1-scores varied.
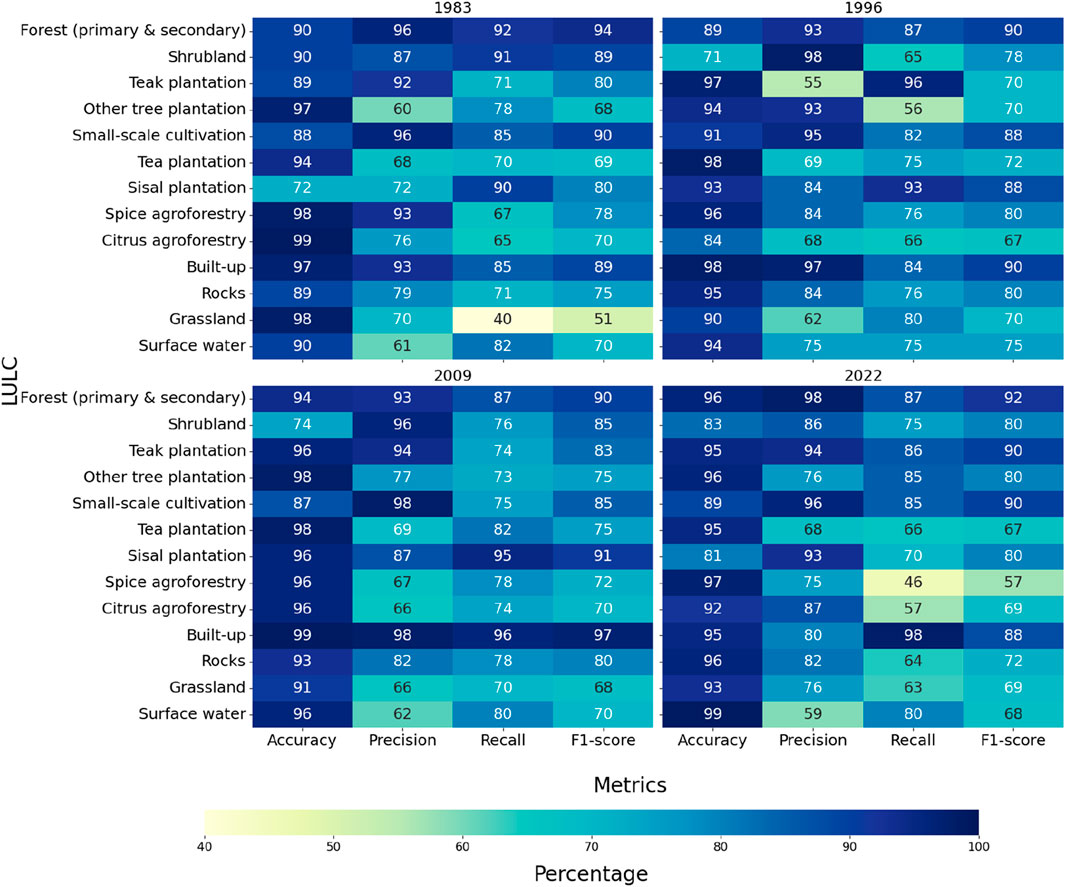
Figure 6. Error matrix of estimated error of sample counts with, accuracy, recall, precision and F1-score for each LULC class across the four time slices (1983, 1996, 2009, and 2022).
3.3 Temporal LULC changes (1983–2022)
3.3.1 Overall LULC changes
The LULC changes in the Sigi River catchment from 1983 to 2022 are illustrated in Figures 7–9. Figure 7 presents classified LULC maps for the four time slices, while Figures 8, 9 detail the LULC changes across the three intervals (1983–1996, 1996–2009, and 2009–2022), highlighting total changes, net gains and losses, and transitions using Sankey diagrams. The Sankey diagrams are particularly effective for visualizing LULC dynamics, as they reveal transition pathways and provide a clearer understanding of spatiotemporal patterns. Forest (primary and secondary) experienced a consistent decline throughout the study period, with a net loss of 96 km2 between 1983 and 1996, increasing slightly to 97 km2 between 1996 and 2009, and then slowing to 23 km2 between 2009 and 2022. This trend highlights ongoing deforestation, with the most significant losses occurring in the mid-period (1996–2009). Small-scale cultivation, in contrast, showed a marked increase, particularly between 1996 and 2009, with a net gain of 180 km2. However, this growth slowed during the last interval (2009–2022), with a net gain of only 49 km2, suggesting a potential stabilization of agricultural expansion.
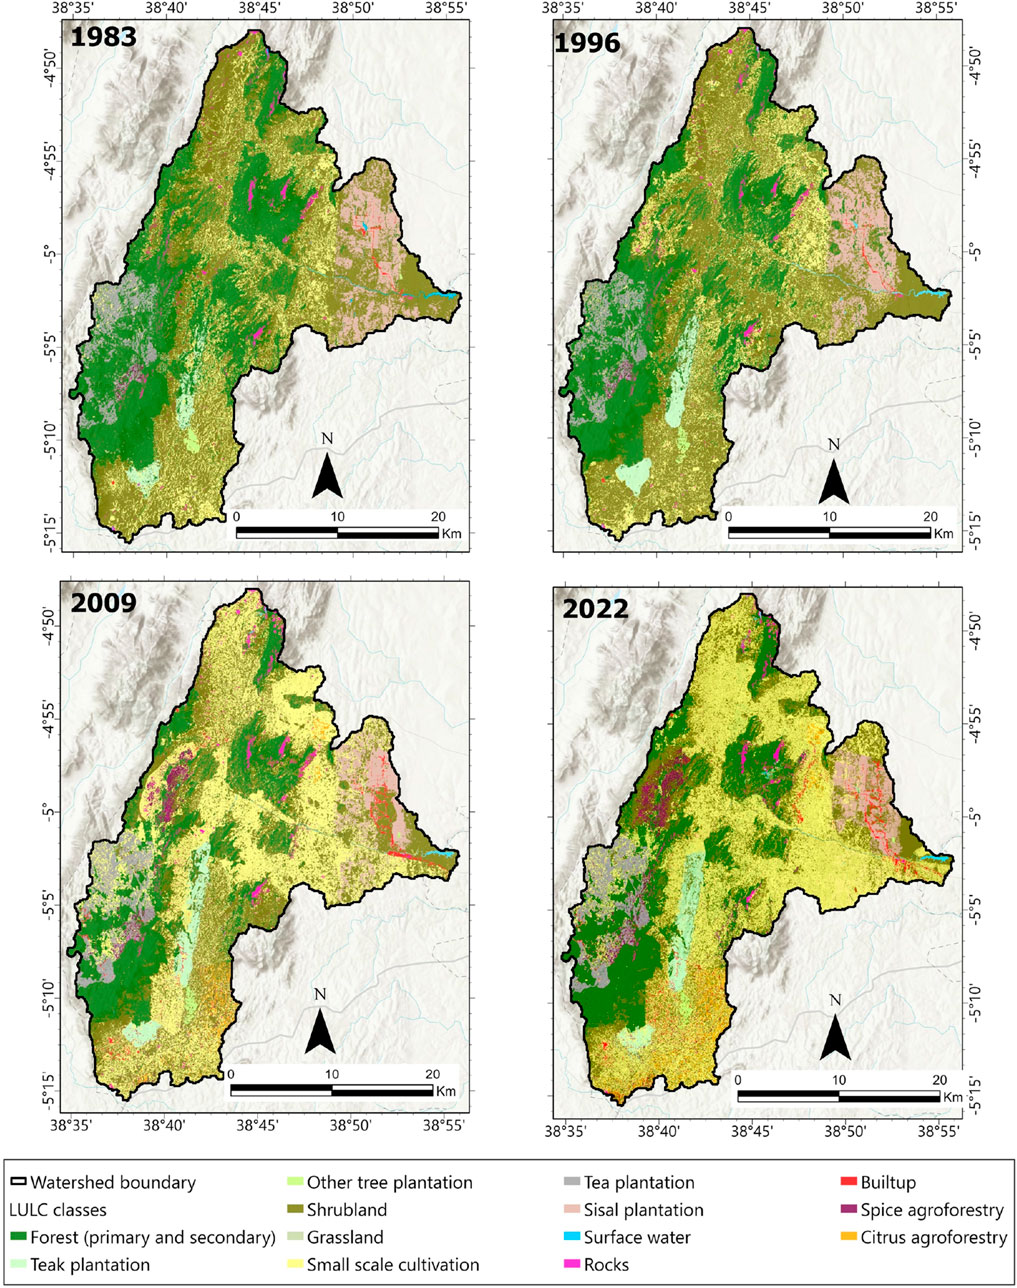
Figure 7. LULC distribution maps for the Sigi River catchment in 1983, 1996, 2009, and 2022 based on Landsat images analysis.
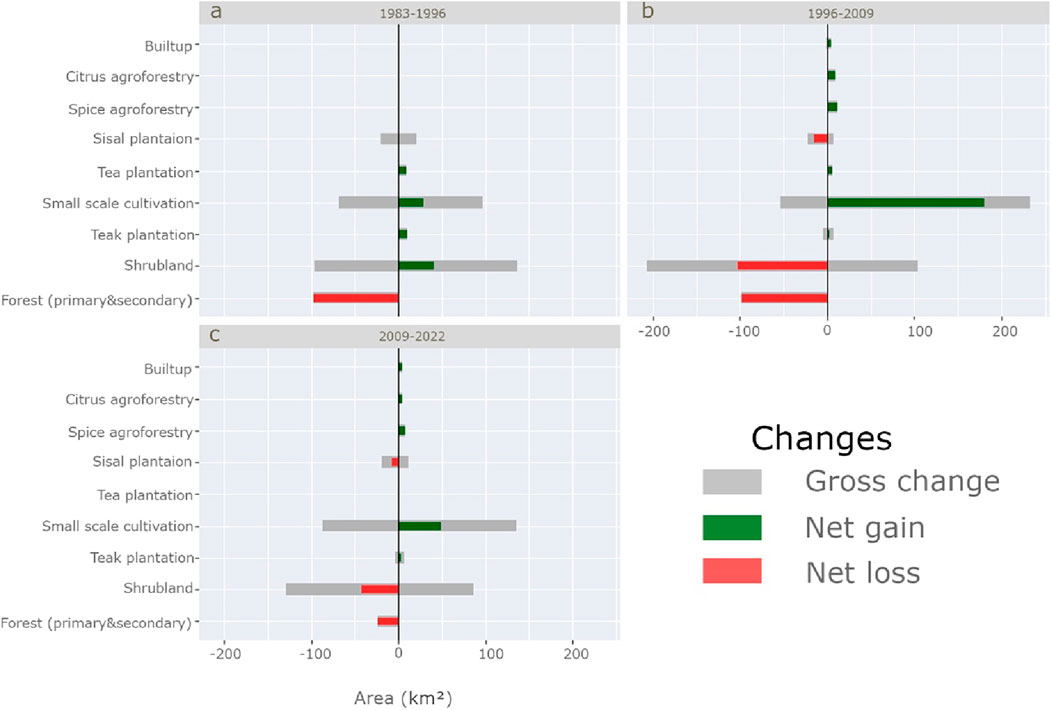
Figure 8. Total and net changes in LULC classes during three time intervals: (a) 1983–1996, (b) 1996–2009, and (c) 2009–2022. Gross change = gross gain + gross loss; Net change = gross gain – gross loss.
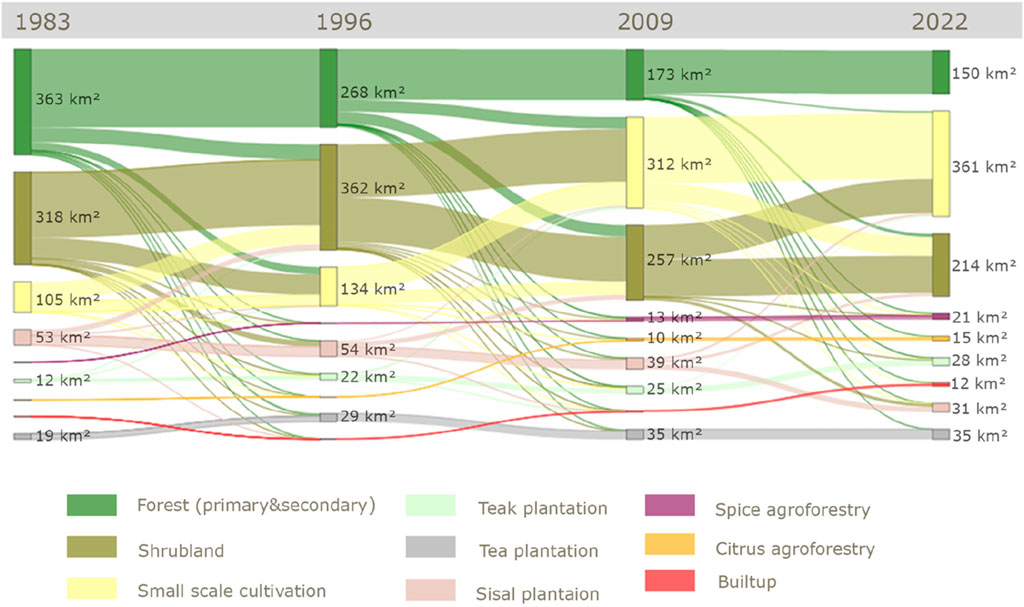
Figure 9. Sankey diagram showing the distribution and transition of LULC between the years 1983, 1996, 2009, and 2022. Node and links represent the number of LULC pixels in the image that either remained or changed over the years.
Shrubland and Sisal plantations followed contrasting patterns. Shrubland increased significantly between 1983 and 1996, gaining of 41 km2, but then experienced a sharp decline, losing 102 km2 between 2009 and 2022. Sisal plantations saw a modest gain of 1 km2 between 1983 and 1996, followed by a decline of 15 km2 during the last interval (2009–2022).
The detailed visualizations in Figures 8A–C, 9 emphasize these transitions, showing not only gross changes but also net gains and losses across the three time intervals. These figures and diagrams provide a comprehensive understanding of the spatiotemporal dynamics of land use in the Sigi River catchment. The observed patterns reflect the interplay of natural and anthropogenic factors, including agricultural expansion, deforestation, and changes in land management practices over the past 4 decades.
3.3.2 LULC transitions across elevation classes
Changes in LULC were analysed in relation to elevation classes, with the findings visualized using Sankey diagrams (Figure 10). These diagrams illustrate the transitions and shifts in major LULC classes from 1983 to 2022. The analysis reveals distinct patterns and dynamics across elevation gradients, with the foothill areas exhibiting the most pronounced changes, while the upland areas showed the least variability.
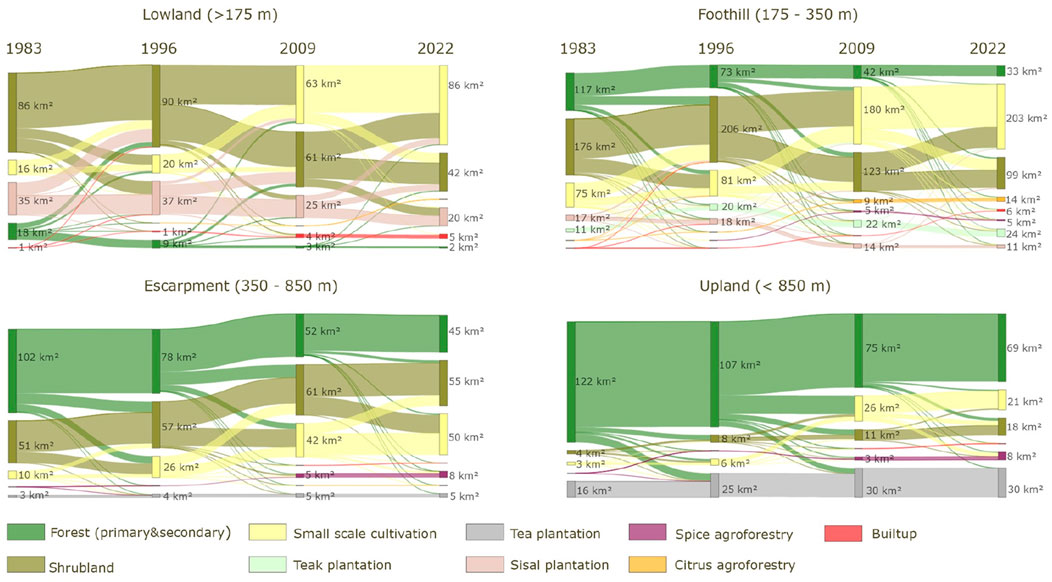
Figure 10. Sankey diagrams showing the distribution and transition of LULC across elevation classes for the four time slices (1983, 1996, 2009 and 2022). The nodes and links in the diagrams represent the number of LULC pixels that either remained in the same class or transitioned to a different class during each time interval.
In the foothill areas, significant loss of Forest (primary and secondary) was consistently observed, accompanied by an increase in small-scale cultivation. The escarpment and lowland areas followed similar trends, with notable forest loss in the escarpment and a more pronounced expansion of small-scale cultivation in the lowlands. Shrubland showed an increase in the foothills and lowlands between 1983 and 1996, followed by a decline from 2009 to 2022. In contrast, upland and escarpment areas experienced a gradual and consistent increase in shrubland throughout the study period.
The foothills experienced substantial increases in teak plantations and citrus agroforestry, while the lowlands saw an expansion of sisal plantations between 1983 and 1996, followed by a decrease from 2009 to 2022. In the upland and escarpment regions, tea cultivation and spice agroforestry demonstrated steady growth throughout the study period. Notably, spice agroforestry became increasingly prominent in the escarpment by 2009, while tea cultivation remained dominant in upland areas across all time intervals.
The analysis highlights distinct transitions in LULC across elevation classes. In the lowland, foothill, and escarpment areas, substantial portions of forest (primary and secondary) were converted into shrubland. A significant proportion of shrubland subsequently transitioned into small-scale cultivation. In the upland areas, forest loss primarily contributed to the expansion of small-scale cultivation. From 1983 to 2022, plantations of teak, citrus, and sisal expanded extensively from shrubland in the lowland and foothill areas. In contrast, in the escarpment and upland areas, spice agroforestry expanded primarily from small-scale cultivation, while tea cultivation notably increased, often replacing forest (primary and secondary) areas in these regions.
3.3.3 Effect of slope steepness on LULC changes
An in-depth analysis of land use and land cover (LULC) transitions across slope steepness gradients and elevation classes from 1983 to 2022 reveals pronounced spatial patterns (Figure 11). The Sankey diagrams clearly demonstrate that slope steepness plays a significant role in influencing the direction and intensity of LULC changes, particularly forest loss and the corresponding land use gains. Across all elevation classes, steep slopes experienced the most substantial forest (primary and secondary) loss over the 39-year period. This trend is especially evident in the foothill zone (175–350 m), where a total of 33 km2 of forest was lost on steep slopes, followed by 28 km2 in both the escarpment (350–850 m) and upland (<850 m) regions. The Sankey flows illustrate that this forest loss did not occur in isolation; it was largely accompanied by gains in specific LULC categories. Classes that benefited most from forest loss on steep slopes include:
- Shrubland: Significant expansion occurred across all elevation classes, particularly on steep and very steep slopes. In the foothills, for example, shrubland gained approximately 12 km2, much of it sourced from degraded forest.
- Small-scale cultivation: This class consistently increased on steep slopes where forest cover declined. The foothill and escarpment regions show strong transitions from forest to smallholder agricultural areas.
- Spice agroforestry: This class exhibited marked expansion in the escarpment and upland zones, particularly on steep and very steep slopes. In the upland steep slope class, for example, spice agroforestry increased from 2 km2 in 1983 to 11 km2 in 2022, indicating a clear pattern of forest conversion to this economically motivated land use.
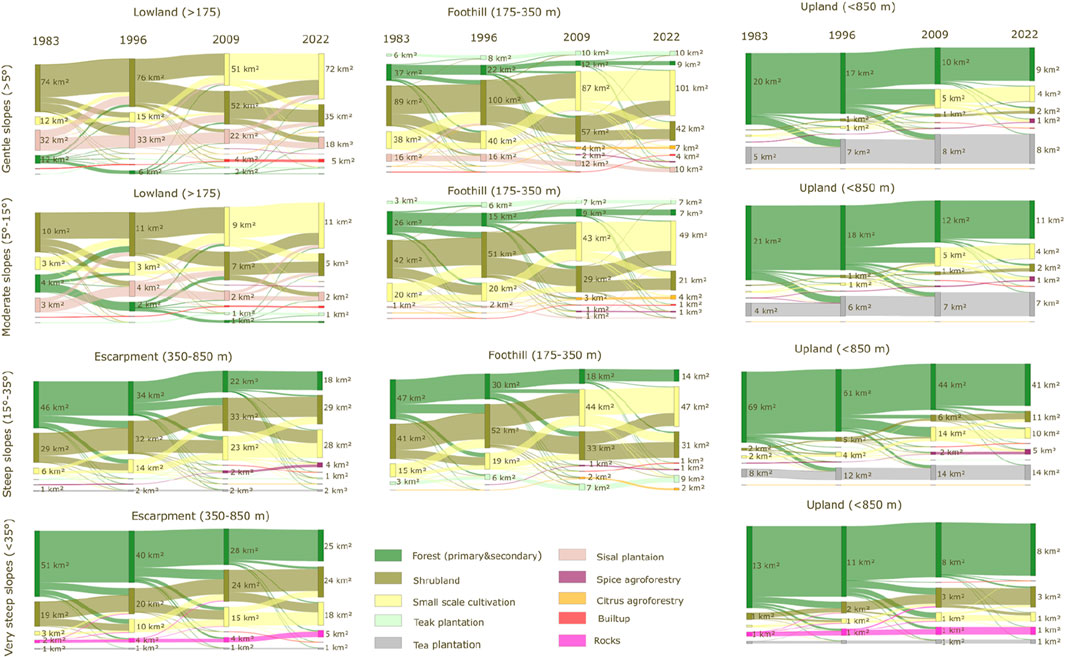
Figure 11. Sankey diagrams showing the distribution and transition of LULC classes as affected by slope characteristics across elevation classes between 1983, 1996, 2009 and 2022.
In contrast, on gentle and moderate slopes, while forest loss was also evident, the transitions favored different land use types. In the foothills, citrus agroforestry expanded predominantly on gentle slopes, suggesting that accessibility and slope stability influenced the type of agroforestry practiced. Similarly, shrubland and small-scale cultivation were more prevalent on moderate slopes in lowland and foothill areas, likely due to their relative ease of conversion and lower risk of erosion. Overall, the Sankey diagram in Figure 11 vividly captures these dynamics, illustrating not only the magnitude of forest loss but also how different land use classes capitalize on that loss depending on topographic conditions.
4 Discussion
This study presents a catchment-scale analysis of land use/land cover (LULC) changes in the Sigi River watershed over the past 4 decades. Through the integration of remote sensing techniques with topographic attributes, spatiotemporal LULC patterns and their relationships with elevation and slope were identified. The findings reveal significant land cover transitions, primarily driven by agricultural expansion, deforestation, and shifts in land management practices. These insights enhance our understanding of landscape dynamics and offer a foundation for developing adaptive land use strategies in the East Usambara Mountains.
4.1 LULC change across elevation zones
Significant LULC changes were observed in the foothills and escarpment regions, while changes in the upland areas were relatively minor. The primary changes involved deforestation and the expansion of small-scale cultivation. Earlier studies in the Sigi River catchment have noted that substantial LULC changes in the upland occurred prior to 1983, beginning in the early 1900s with the introduction of coffee and tea cultivation by German and British colonizers, respectively (Milne, 1937; Hyytitiinen 1995). After World War I, the British replaced poorly performing coffee with tea, which then became the dominant crop in the upland areas (Milne, 1937; Hamilton and Mwasha, 1989). In addition, Sikh Sawmills, a subsidiary of the Tanzanian Wood Industry Corporation, conducted logging operations in the East Usambara Mountains until the mid-1980s. These activities were criticized for causing habitat destruction and damaging non-harvested trees, leading to severe ecological impacts, including significant soil erosion (Newmark, 2002). However, from 1983 onwards, LULC changes in the upland have been less pronounced, likely due to the implementation of various regulations and external interventions, such as the designation of nature protection areas and the promotion of sustainable agricultural practices.
Due to the high rate of deforestation in the past, significant efforts have been made to rehabilitate and conserve the area through the establishment of protected areas conservation agriculture since 1988. The gazettement of protected areas, such as Amani, Kambai and Nilo Nature Reserves, has restricted local communities from encroaching on forestlands, thereby reducing the rate of deforestation and expansion of small-scale cultivation (Kessy, 1998; Hall et al., 2014). Newmark (2002) and Hall et al. (2014) observed that most reserve adjacent to protected areas did not experience high rates of deforestation or small-scale cultivation expansion, particularly in the upland and headwater areas of the Sigi River catchment. However, the foothills and escarpment experienced a higher rate of deforestation and small-scale cultivation expansion, as much of the land, particularly primary and secondary forests, is public lands. This made forests vulnerable to deforestation, as land can be cleared for cultivation without special permits. Consequently, this has led to a high rate of deforestation in these regions. The presence of protected areas has also strengthened conservation efforts to reduce LULC fragmentation. Over the years, various projects have been launched to counteract trends in LULC change (Hamilton and Bensted-Smith, 1989; Kessy, 1998; Yanda and Munishi, 2007; Hall et al., 2014). However, these projects primarily focused on the upland areas, promoting agroforestry practices to curb the formerly rapid expansion of small-scale cultivation (Bullock et al., 2014). The effects of these efforts are evident in our study, where a distinct portion of small-scale cultivation areas in the upland have been transformed into spice agroforestry, indicating that the goals of these conservation projects have been partially achieved. On the other hand, there are reports that cardamom agroforestry, in particular, has led to encroachment on natural forests (Reyes et al., 2006).
Population growth appears to be a significant driver of the observed land use and land cover (LULC) changes in the lowland, foothill and escarpment areas. These regions, with higher population densities than the upland areas, face considerable pressure on arable land, which has predominantly been converted from primary and secondary forests to small-scale cultivation. The expansion of small-scale agriculture in these areas is largely driven by population growth and the increased demand for land to sustain livelihoods (Bwagalilo et al., 2015; Basche and DeLonge, 2019; Clement et al., 2021). In this context, the frequency of man-made fires used to clear land for cultivation has also risen. Newmark (2002) reported that in 1998, over 600 ha of forest (<600 m asl) in the East Usambara Mountains were destroyed by fires that spread from nearby agricultural fields into adjacent forested areas. Additionally, much of shrubland, which is often abandoned after cultivation, has been converted into small-scale agricultural land. These areas are relatively easy to clear due to the absence of strict regulations governing land development. As a result, the rate of small-scale cultivation expansion is higher in the lowland, foothill and escarpment areas compared to the upland regions.
External market demands on agricultural products and government policies have played a significant role in shaping the differential land use and land cover (LULC) changes across elevation zones. Crops are often cultivated in response to high economic returns (Kihiyo, 1992; Kimaro et al., 1994; Bayliss, 2008). The decline in global markets for certain commercial crops such as sisal and tea, combined with shifts in government policies towards privatization, have led to increased unemployment. In response, local communities have turned to alternative income sources, often encroaching on forested areas to cultivate high-return crops (Kihiyo, 1992; Reyes et al., 2006; Kimaro et al., 1994). This dynamic has driven significant changes in land use and land cover (LULC) in the lowland, foothill, and escarpment areas, which are characterized by large areas of public land, less protected forests, and easier accessibility compared to the uplands. Our study found a notable decrease in sisal cultivation following the shift from communal farming to private ownership in 1996 (Figure 8). This transition coincided with substantial forest loss and an increase in small-scale agriculture in both the foothill and escarpment regions.
4.2 LULC transitions across elevation zones
Figure 10 illustrates that in foothill, lowland, and escarpment areas, forest (both primary and secondary) were first converted to shrubland before being transformed into small-scale cultivation. It appears that shrubland acted as a transitional land cover during the deforestation process from forest (primary and secondary) to small-scale agriculture. In contrast, the upland areas followed a different path, where forest (primary and secondary) was directly converted to small-scale cultivation without passing through a transitional land cover. This distinction underscores the varying dynamics of land transformation across different elevations, driven by a range of factors. For example, in the foothill, lowland, and escarpment areas, the transition typically begins with the opening of primary and secondary forestland through activities like timber harvesting, charcoal production, and fuelwood collection. As the forest becomes degraded, the land is gradually repurposed for agricultural crops, and over time, the remaining trees are cleared, making way for small-scale cultivation (Newmark, 2002; Yanda and Munishi, 2007). In contrast, in the upland areas, forest (primary and secondary) is initially encroached upon, with the understory cleared to make space for the cultivation of spice crops like cardamom (cf. Reyes et al., 2006; Reyes et al., 2009).
4.3 Impact of slope steepness on LULC dynamics
The pronounced loss of both primary and secondary forests on steep slopes may be attributed to the earlier clearing of forests in flat and gently sloping areas before 1983. Population growth in recent decades has driven settlements into steeper terrain, necessitating agricultural expansion in these areas. Additionally, land tenure patterns have played a critical role in shaping land use dynamics. While gentle and moderately sloping areas are predominantly designated as forest reserves for government teak plantations, cash crop estates, and large-scale citrus agroforestry, village-owned lands on steeper slopes have become the primary areas for small-scale cultivation (Yanda and Munishi, 2007). Local households have increasingly encroached on steeply sloped forestlands due to the fertility of these soils, which offer higher organic matter and nutrient content, enhancing crop productivity (Hamilton and Bensted-Smith, 1989; Mwanyoka, 2005; Yanda and Munishi, 2007; Reyes et al., 2009). Notably, our findings indicate that upland areas with steep slopes exhibit the highest coverage of small-scale agriculture compared to other slope classes. This trend may be linked to historical land-use patterns, where tea plantations established primarily by the British after World War I, often replacing abandoned German coffee plantations were preferentially located on gentler slopes (Milne, 1937; Hamilton and Mwasha, 1989). In contrast, in the foothill and lowland areas, small-scale cultivation is more concentrated on gentle slopes, likely due to greater accessibility, ease of management, and technological applications (Newmark, 2002; Yanda and Munishi, 2007). Our results highlight that steep slopes have experienced significant LULC transitions, primarily through the conversion of forests to shrubland then small-scale agriculture. Given the susceptibility of these areas to soil erosion and water resource degradation, they should be prioritized for targeted soil and water conservation measures. While afforestation efforts have been implemented in the foothills, agroforestry may offer a more sustainable approach for steep slope areas, mitigating erosion while supporting local livelihoods.
4.4 Evaluation of classification accuracy
The performance of our models in identifying various land-use/land-cover (LULC) classes reveals important insights into the strengths and limitations of the classification process. Our results show that the models effectively distinguished between forestland (both primary and secondary) and small-scale cultivation yet faced challenges in accurately classifying shrubland and teak plantations. This discrepancy likely arises from the visual similarities between shrubland, small-scale cultivation, and young teak plantations, which complicates the differentiation process and can lead to reduced classification precision (cf. Zhao et al., 2014; Feng et al., 2022). Furthermore, the varying performance metrics for more complex LULC categories, such as tea plantation, sisal plantations, spice agroforestry, and citrus agroforestry reflect the inherent diversity and complexity within these land-use systems. These classes represent a wide range of vegetation types, management practices, and environmental conditions, contributing to significant variability in their spectral signatures and spatial patterns. The diverse nature of these land-use systems presents additional challenges for accurate classification, highlighting the need for more refined techniques and additional data sources. To address these challenges and enhance classification accuracy, we incorporated high-resolution, multi-temporal imagery, complemented by field observations. His integration not only improved the model’s ability to differentiate between similar land-use types but also provided valuable insights into the nuanced characteristics of these complex land-use systems (cf. Feng et al., 2022). These strategies proved effective in refining the model’s ability to differentiate between land-use types and underscored the importance of leveraging both remote sensing data and ground-truth observations in capturing the diverse dynamics of land-use change.
5 Conclusion
This study demonstrates that the integration of remote sensing and GIS techniques offers a powerful framework for analyzing temporal landscape dynamics. The Random Forest classifier, in particular, consistently produced high-accuracy LULC maps, effectively managing complex datasets and diverse spectral signatures. These results underscore the reliability of this approach for capturing and analyzing temporal changes in land use/land cover (LULC), which can significantly enhance environmental management efforts.
LULC changes exhibited considerable variation across elevation classes. In the foothill and escarpment areas, deforestation and the expansion of small-scale cultivation were prominent, whereas upland areas followed a unique transition directly from forest to cultivation. These spatial patterns are influenced by a combination of factors, including population growth, government policies, and economic shifts. Additionally, Slope characteristics played a pivotal role, with steeper slopes showing pronounced forest loss across all elevation zones, while agroforestry expansion followed distinct elevation-based trajectories.
The refined LULC maps generated in this study are invaluable for improving GIS-based hydrological models, such as SWAT model. These maps will contribute to better-informed land-use planning, supporting the optimization of land use by balancing environmental conservation, sustainable resource utilization, and the preservation of critical ecosystem services.
Data availability statement
The raw data supporting the conclusions of this article will be made available by the authors, without undue reservation.
Author contributions
SC: Conceptualization, Writing – original draft, Writing – review and editing, Resources, Investigation, Project administration, Formal Analysis, Data curation, Methodology, Visualization. LZ: Writing – review and editing, Project administration, Supervision, Formal Analysis, Methodology, Writing – original draft, Data curation, Resources, Investigation, Visualization, Validation, Funding acquisition, Conceptualization. AZ: Formal Analysis, Writing – review and editing, Visualization, Methodology. KHF: Conceptualization, Investigation, Writing – review and editing, Funding acquisition, Resources, Supervision, Writing – original draft, Project administration, Validation, Formal Analysis, Data curation, Methodology, Visualization.
Funding
The author(s) declare that financial support was received for the research and/or publication of this article. This research was supported by the Saxon State Ministry for Energy, Climate Protection, Environment, and Agriculture (SMEKUL) through a PhD scholarship awarded to the first.
Acknowledgments
Special thanks to Aloyce F. Mkongewa (Lushoto, Tanzania) for assistance with data collection in the field and Prof. Matthias Forkel (Environmental Remote Sensing Group, TU Dresden) for his valuable basic advice on the evaluation of satellite image data.
Conflict of interest
The authors declare that the research was conducted in the absence of any commercial or financial relationships that could be construed as a potential conflict of interest.
Generative AI statement
The author(s) declare that no Generative AI was used in the creation of this manuscript.
Publisher’s note
All claims expressed in this article are solely those of the authors and do not necessarily represent those of their affiliated organizations, or those of the publisher, the editors and the reviewers. Any product that may be evaluated in this article, or claim that may be made by its manufacturer, is not guaranteed or endorsed by the publisher.
Supplementary material
The Supplementary Material for this article can be found online at: https://www.frontiersin.org/articles/10.3389/frsen.2025.1594331/full#supplementary-material
References
Abuhay, W., Gashaw, T., and Tsegaye, L. (2023). Assessing impacts of land use/land cover changes on the hydrology of Upper Gilgel Abbay watershed using the SWAT model. J. Agric. Food Res. 12, 100535. doi:10.1016/J.JAFR.2023.100535
Aldwaik, S. Z., and Pontius, R. G. (2012). Intensity analysis to unify measurements of size and stationarity of land changes by interval, category, and transition. Landsc. Urban Plan. 106, 103–114. doi:10.1016/j.landurbplan.2012.02.010
Amini, S., Saber, M., Rabiei-Dastjerdi, H., and Homayouni, S. (2022). Urban land use and land cover change analysis using random forest classification of Landsat time series. Remote Sens. 14, 2654–23. doi:10.3390/rs14112654
Basche, A. D., and DeLonge, M. S. (2019). Comparing infiltration rates in soils managed with conventional and alternative farming methods: A meta-analysis. PLoS ONE 14 (9), e0215702. doi:10.1371/journal.pone.0215702
Bayliss, K. (2008). “Tanzania: from nationalization to privatization—and back?,” in Privatization and alternative public sector reform in Sub-Saharan Africa: delivering on electricity and water (London: Palgrave Macmillan UK), 151–180. doi:10.1057/9780230286412_7
Birhane, E., Ashfare, H., Fenta, A. A., Hishe, H., Gebremedhin, M. A., Solomon, N., et al. (2019). Land use land cover changes along topographic gradients in Hugumburda national forest priority area, Northern Ethiopia. Remote Sens. Appl. Soc. Environ. 13, 61–68. doi:10.1016/j.rsase.2018.10.017
Bullock, R., Mithöfer, D., and Vihemäki, H. (2014). Sustainable agricultural intensification: the role of cardamom agroforestry in the East Usambaras, Tanzania. Int. J. Agric. Sustain. 12 (2), 109–129. doi:10.1080/14735903.2013.840436
Bwagalilo, F., Liwa, E., and Shemdoe, R. (2015). Indigenous knowledge of Zigi community and forest management decision-making: a perspective of community forest interaction. JNRD - Journal of Natural Resources and Development, 6, 14–21. doi:10.5027/jnrd.v6i0.03
Clement, M., Mwakalila, S., and Norbert, J. (2021). Implications of land use and climate change on water balance components in the Sigi catchment, Tanzania. J. Geogr. Assoc. Tanzan. 39 (1), 142–159. doi:10.56279/jgat.v39i1.37
Duden, A., and Tollenaar, M. (2011). Equitable payments for watershed services in the Sigi catchment, Tanzania: the hydrological perspective. Consult. Rep. World Wide Fund Nat. (WWF), 59.
Feng, S., Li, W., Xu, J., Liang, T., Ma, X., Wang, W., et al. (2022). Land use/land cover mapping based on GEE for the monitoring of changes in ecosystem types in the upper Yellow River basin over the Tibetan Plateau. Remote Sens. 14 (21), 5361. doi:10.3390/rs14215361
Hall, J. M., Burgess, N. D., Rantala, S., Vihemäki, H., Jambiya, G., Gereau, R. E., et al. (2014). Ecological and social outcomes of a new protected area in Tanzania. Conserv. Biol. 28 (6), 1512–1521. doi:10.1111/cobi.12335
A. C. Hamilton, and R. Bensted-Smith (1989). Forest conservation in the East Usambara mountains, Tanzania (IUCN.Gland/Cambridge). New York: Springer-Verlag, 15, 392.
Hamilton, A. C., and Mwasha, I. V. (1989). History of resource utilization and management. In A. C. Hamilton, and R. Bensted-Smith (Eds.), Forest Conservation in the East Usambara Mountains Tanzania. IUCN. 45–56.
Hartemink, A. E. (1997). Soil fertility decline in some major soil groupings under permanent cropping in Tanga region, Tanzania. Geoderma 75 (3-4), 215–229. doi:10.1016/S0016-7061(96)00087-0
Hyytitiinen, K. (1995). Land use classification and mapping for the East Usambara Mountains. East Usambara Catchment Forest Project Technical Paper No 12, Vantaa.
Kayitesi, N. M., Guzha, A. C., and Mariethoz, G. (2022). Impacts of land use land cover change and climate change on river hydro-morphology-a review of research studies in tropical regions. J. Hydrology 615, 128702. doi:10.1016/J.JHYDROL.2022.128702
Kessy, J. F. (1998). Conservation and utilization of natural resources in the East Usambara forest reserves: conventional views and local perspectives. Netherlands: Wageningen University and Research.
Kihiyo, V. B. M. S. (1992). Farm forestry for the market: the declining status of black wattle (Acacia mearnsii de Wild.) as a cash crop in West Usambara, Tanzania. Beiträge zur Trop. Landwirtsch. Veterinärmedizin 30 (3), 315–322.
Kimaro, D., Msanya, B. M., and Takamura, Y. (1994). Review of sisal production and research in Tanzania. Afr. Study Monogr. 15 (4), 227–242. doi:10.14989/68124
Kirsten, M., Kaaya, A., Klinger, T., and Feger, K. H. (2016). Stocks of soil organic carbon in forest ecosystems of the Eastern Usambara Mountains, Tanzania. Catena 137, 651–659. doi:10.1016/j.catena.2014.12.027
Mangi, H. O., Onywere, S. M., Kitur, E. C., Lalika, M. C., and Chilagane, N. A. (2022). Hydrological response to land use and land cover change on the slopes of Kilimanjaro and Meru Mountains. Ecohydrol. Hydrobiology 22 (4), 609–626. doi:10.1016/j.ecohyd.2022.08.002
Milne, G. (1937). Essays in applied pedology: I.—soil type and soil management in relation to plantation agriculture in East Usambara. East Afr. Agric. J. 3 (1), 7–20. doi:10.1080/03670074.1937.11663717
Ministry of Water, UNDP, and GEF (2019). Environmental flow Assessment for zigi River catchment. Report submitted to PBWB under WATERSHED and SLM project. FORCONSULT. Morogoro, Tanzania: Sokoine University of Agriculture.
Msofe, N. K., Sheng, L., and Lyimo, J. (2019). Land use change trends and their driving forces in the Kilombero Valley Floodplain, Southeastern Tanzania. Sustainability 11 (2), 505. doi:10.3390/su11020505
Muro, J., Strauch, A., Heinemann, S., Steinbach, S., Thonfeld, F., Waske, B., et al. (2018). Land surface temperature trends as indicator of land use changes in wetlands. Int. J. Appl. earth observation geoinformation 70, 62–71. doi:10.1016/j.jag.2018.02.002
Mwangi, H. M., Julich, S., and Feger, K. H. (2016a). “Introduction to watershed management,” in Tropical forestry handbook. Editors L. Pancel,, and M. Köhl (Berlin Heidelberg, Berlin, Heidelberg: Springer), 1869–1896. Available online at: https://link.springer.com/referenceworkentry/10.1007/978-3-642-54601-3_153.
Mwangi, H. M., Julich, S., and Feger, K. H. (2016b). “Watershed management practices in the tropics,” in Tropical forestry handbook. Editors L. Pancel,, and M. Köhl (Berlin Heidelberg, Berlin, Heidelberg: Springer), 1897–1915.
Mwangi, H. M., Lariu, P., Julich, S., Patil, S. D., McDonald, M. A., and Feger, K. H. (2017). Characterizing the intensity and dynamics of land-use change in the mara river basin, East africa. Forests 9 (1), 8. doi:10.3390/f9010008
Mwanyoka, I. R. (2005). Payment for water serveices as a mechanism for watershed management. Dar es Salaam: University of Dar es Salaam.
NERC (1994). “Tanzania urban sector engineering project – yield estimates for Tanga and morogoro,” in Report natural environment research council (Wallingford, UK: Institute of Hydrology), 42.
Newmark, W. D. (2002). Conserving biodiversity in East african forests: a study of the eastern arc mountains, 155. Berlin, Heidelberg: Springer Science and Business Media, 200. doi:10.1007/978-3-662-04872-6
Olofsson, P., Foody, G. M., Herold, M., Stehman, S. V., Woodcock, C. E., and Wulder, M. A. (2014). Good practices for estimating area and assessing accuracy of land change. Remote Sens. Environ. 148, 42–57. doi:10.1016/j.rse.2014.02.015
Reyes, T., Luukkanen, O., and Quiroz, R. (2006). Small cardamom: precious for people, harmful for mountain forests: possibilities for sustainable cultivation in the East usambaras, Tanzania. Mt. Res. Dev. 26, 131–137. doi:10.1659/0276-4741(2006)26[131:scfphf]2.0.co;2
Reyes, T., Quiroz, R., Luukkanen, O., and De Mendiburu, F. (2009). Spice crops agroforestry systems in the East Usambara Mountains, Tanzania: growth analysis. Agrofor. Syst. 76, 513–523. doi:10.1007/s10457-009-9210-5
Rotich, B., Kindu, M., Kipkulei, H., Kibet, S., and Ojwang, D. (2022). Impact of land use/land cover changes on ecosystem service values in the cherangany hills water tower, Kenya. Environ. Challenges 8, 100576. doi:10.1016/J.ENVC.2022.100576
Shokri, N., Aminzadeh, M., Flury, M., Jin, Y., Matin, M. A., Panagos, P., et al. (2025). Sustainability Nexus AID: soil health. SNF 33, 3. doi:10.1007/s00550-025-00560-6
Tresierra, J. C. (2013). Equitable payments for watershed services: financing conservation and development-case studies on remuneration of positive externalities (RPE)/Payment for Environmental Services (PES) Paper prepared for multi-stakeholder dialogue. Rome: FAO.
Wang, B., and Cheng, W. (2022). Effects of land use/cover on regional habitat quality under different geomorphic types based on InVEST model. Remote Sens. 14 (5), 1279. doi:10.3390/rs14051279
Wang, B., and Cheng, W. (2023). Geomorphic influences on land use/cover diversity and pattern. Catena 230, 107245. doi:10.1016/j.catena.2023.107245
Wondie, M., Teketay, D., Melesse, A. M., and Schneider, W. (2012). Relationship between topographic variables and land cover in the simen mountains national park, a World heritage site in northern Ethiopia. Int. J. Remote Sens. Appl. 2 (2), 36–43.
Xu, L., Liu, X., Tong, D., Liu, Z., Yin, L., and Zheng, W. (2022). Forecasting urban land use change based on cellular automata and the PLUS model. Land 11 (5), 652. doi:10.3390/land11050652
Yanda, P. Z., and Munishi, P. K. T. (2007). Hydrologic and land use/cover change analysis for the ruvu river (uluguru) and Sigi River (East Usambara) watersheds. Final Rep. WWF/CARE, 80. Available online at: http://citeseerx.ist.psu.edu/viewdoc/download?doi=10.1.1.575.2361andrep=rep1andtype=pdf.
Yin, H., Tan, B., Frantz, D., and Radeloff, V. C. (2022). Integrated topographic corrections improve forest mapping using Landsat imagery. Int. J. Appl. Earth Observation Geoinformation 108, 102716. doi:10.1016/j.jag.2022.102716
Zarei, A., Madani, K., Guenther, E., Nasrabadi, H. M., and Hoff, H. (2024). Integrated nexus approach to assessing climate change impacts on grassland ecosystem dynamics: a case study of the grasslands in Tanzania. Sci. Total Environ. 952, 175691. doi:10.1016/j.scitotenv.2024.175691
Keywords: topographic attributes, land use/land cover (LULC), deforestation, random forest classification, small-scale cultivation, spatiotemporal analysis
Citation: Chidodo S, Zhang L, Zarei A and Feger K-H (2025) Remote sensing-based assessment of four decades of land use/land cover change in the Sigi River Watershed, East Usambara Mountains, Tanzania. Front. Remote Sens. 6:1594331. doi: 10.3389/frsen.2025.1594331
Received: 15 March 2025; Accepted: 28 May 2025;
Published: 19 June 2025.
Edited by:
Yuchao Yan, Peking University, ChinaReviewed by:
Nathan Moore, Michigan State University, United StatesBertrand Ygorra, INRAE Nouvelle-Aquitaine Bordeaux, France
Copyright © 2025 Chidodo, Zhang, Zarei and Feger. This is an open-access article distributed under the terms of the Creative Commons Attribution License (CC BY). The use, distribution or reproduction in other forums is permitted, provided the original author(s) and the copyright owner(s) are credited and that the original publication in this journal is cited, in accordance with accepted academic practice. No use, distribution or reproduction is permitted which does not comply with these terms.
*Correspondence: Simon Chidodo, c2ltb24uY2hpZG9kb0BtYWlsYm94LnR1LWRyZXNkZW4uZGU=, Y2hpZG9kb3NpbW9uQHVudS5lZHU=