 Lien Rodríguez-López1*
 David Francisco Bustos Usta2
 Iongel Duran-Llacer3,4
 Lisandra Bravo Alvarez5
 Luc Bourrel6
 Frédéric Frappart7Roberto Urrutia8
- 1Facultad de Ingeniería, Universidad San Sebastián, Concepción, Chile
- 2Facultad de Oceanografía, Universidad de Concepción, Concepción, Chile
- 3Escuela de Ingeniería en Medio Ambiente y Sustentabilidad, Escuela de Ingeniería Forestal, Facultad de Ciencias, Ingeniería y Tecnología, Universidad Mayor, Santiago, Chile
- 4Hémera Centro de Observación de la Tierra, Facultad de Ciencias, Ingeniería y Tecnología, Universidad Mayor, Santiago, Chile
- 5Department of Electrical Engineering, Universidad de Concepción, Concepción, Chile
- 6Géosciences Environnement Toulouse, UMR 5563, Université de Toulouse, CNRS-IRD-OMP-CNES, Toulouse, France
- 7ISPA, UMR 1391 INRAE/Bordeaux Sciences Agro, Villanve-d'Ornon, France
- 8Facultad de Ciencias Ambientales, Universidad de Concepción, Concepción, Chile
In this study, multispectral images were used to detect toxic blooms in Villarrica Lake in Chile, using a time series of water quality data from 1989 to 2024, based on the extraction of spectral information from Landsat 8 and 9 satellite imagery. To explore the predictive capacity of these variables, we constructed 255 multiple linear regression models using different combinations of spectral bands and indices as independent variables, with phycocyanin concentration as the dependent variable. The most effective model, selected through a stepwise regression procedure, incorporated seven statistically significant predictors (p < 0.05) and took the following form: FCA = N/G + NDVI + B + GNDVI + EVI + SABI + CCI. This model achieved a strong fit to the validation data, with an R2 of 0.85 and an RMSE of 0.10 μg/L, indicating high explanatory power and relatively low error in phycocyanin estimation. When applied to the complete weekly time series of satellite observations, the model successfully captured both seasonal dynamics and interannual variability in phycocyanin concentrations (R2 = 0.92; RMSE = 0.05 μg/L). These results demonstrate the robustness and practical utility for long-term monitoring of harmful algal blooms in Lake Villarrica.
1 Introduction
Algal blooms in oligotrophic lakes have become a growing concern for inland aquatic systems, where their frequency is increasing at an alarming rate (Feng et al., 2024). These lakes, once characterized by low nutrient levels and clear waters, are now vulnerable to the impacts of the triple planetary crisis of climate change, biodiversity loss and water pollution (Jenny et al., 2020; Mishra, 2023). These interconnected challenges have created conditions that exacerbate algal bloom, posing significant risks to aquatic ecosystems, water quality and human health (Igwaran et al., 2024).
Among the most damaging blooms are those caused by cyanobacteria, also known as blue-green algae (Vadeboncoeur et al., 2021). Cyanobacterial blooms are especially dangerous because many species of this group produce toxins that can be harmful to aquatic life, terrestrial animals and humans (Chorus, I., & Welker, 2021; Moreira et al., 2022; Svirčev et al., 2022). These blooms are characterized by the presence of both general pigments, such as chlorophyll-a, and more specific pigments, such as phycocyanin, a marker for cyanobacteria (Konik et al., 2023). Phycocyanin is not only crucial for the photosynthetic processes of cyanobacteria but also serves as a valuable indicator to monitor their presence and growth (Almuhtaram et al., 2021). Detection of this pigment has become essential for tracking bloom dynamics and assessing water quality in affected lakes (Binding et al., 2021). Rising global surface temperatures, driven by climate change, have created increasingly favorable conditions for the growth and persistence of cyanobacterial blooms (Zepernick et al., 2023). Warmer waters favor stratification of lakes, reducing water circulation and creating nutrient-rich environments in the upper layers where cyanobacteria thrive (Chorus, I., & Welker, 2021). In addition, warmer temperatures can increase the metabolic rate of these algae, further accelerating the formation of blooms (Wu et al., 2024). The cumulative effects of climate change, combined with nutrient enrichment from agricultural runoff and urbanization, have intensified the frequency and severity of these toxic blooms, turning once pristine oligotrophic lakes into sites of ecological concern (Sivarajah, 2020; Devlin and Brodie, 2023).
The need for advanced monitoring and mitigation strategies is more urgent than ever, as harmful algal blooms threaten not only aquatic biodiversity, but also the sustainability of freshwater resources for human use (Ahmed et al., 2022; Kazmi et al., 2022). Remote sensing technologies, especially those capable of detecting phycocyanin, are increasingly important for early detection and management of these blooms (Zahir et al., 2024). On the other hand, we acknowledge the complexity of inland water optics, including the influence of inherent optical properties that can introduce uncertainty into reflectance-based estimates. Additionally, the use of multispectral satellite data particularly from the Landsat series is limited by its relatively broad spectral bands, which can hinder the accurate detection of narrow absorption features, such as those associated with phycocyanin. A wide range of indices have been created and evaluated, from those adapted from agricultural and terrestrial vegetation applications to combinations of spectral bands specifically designed to detect primary productivity in aquatic environments (Luo et al., 2023). For example, spectral indices such as Surface Algal Bloom Index (SABI) (Alawadi, 2010) and Flotation Algal Index (FAI) (Ma et al., 2021) have been used in Lake Villarrica to determine the spatial distribution of Chl-a, while Green Normalized Difference Vegetation Index (GNDVI) and Normalized Difference Vegetation Index (NDVI) have been applied to measure chlorophyll concentration in the aquatic system of Lake Laja (Rodríguez-López et al., 2020). Despite these advances, significant challenges remain. Many indices do not perform optimally in aquatic ecosystems other than those for which they were initially developed and validated (Lukhabi et al., 2023). This is because conditions in different lakes are influenced by a variety of factors, including geographic, meteorological, and physicochemical characteristics (Melese and Debella, 2023). It is therefore essential to fill these gaps by developing methods that are more accurate site-specific based on the predominant optical characteristics of the aquatic system under study.
Statistical techniques, such as linear regression, are commonly used to estimate water quality parameters (Gad et al., 2023; Adjovu et al., 2023). For example, Rodríguez-López (2020) developed models to estimate chlorophyll concentrations in six lakes in south-central Chile. In a subsequent study (Rodríguez-López et al., 2020), it was shown that combining regression techniques with remote sensing data could achieve the same objective, allowing the study of spatial and temporal variability in these aquatic systems. The integration of statistical methods with data from a variety of sources including in situ water quality monitoring and satellite observations can improve the ability to monitor and manage aquatic vegetation (Mukonza and Chiang, 2023; Batina and Krtalić, 2024). Compared with nonlinear models or analytical approaches, linear regression offers the advantages of simplicity, interpretability, and computational efficiency, which are valuable when establishing baseline predictive models for water quality. This, in turn, will contribute to the conservation and sustainable management of these critical natural resources. In Chile, species responsible for harmful algal blooms, mainly cyanobacteria, have been reported in lakes such as Villarrica, Laguna Grande de San Pedro, Vichuquén and Laja (Rodríguez-López et al., 2020; Rodríguez-López et al., 2023; Yépez et al., 2024). Therefore, the objective of this work is to develop statistical models to estimate algal pigments by combining water quality data with satellite observations.
2 Materials and methods
2.1 Lake Villarrica description
This lake system located at 39°18′S latitude and 72°05′W longitude is one of the most studied Chilean lakes due to its environmental, economic and social importance (Rodríguez-López et al., 2023). Its basin has multiple uses including tourism and agriculture. In addition, it has two important cities in the Araucanía Region on its banks: the city of Villarrica and the city of Pucón. A secondary water quality standard has been implemented for this lake that monitors the parameters of Chl-a, nitrogen and phosphorus nutrients and water transparency, however, every summer an algal bloom appears that extends over the largest surface of the lake and lasts for several months during the year (Rodríguez-López et al., 2023).
2.2 Water quality data sources
Limnological parameters, including water temperature (°C), Chlorophyll-a (µg/L), Phycocyanin (µg/L), turbidity (NTU), and dissolved oxygen (ppm), were recorded during monitoring campaigns conducted by the Dirección General de Aguas (DGA) of Chile between 1989 and 2024. The data, collected at seven monitoring stations as detailed by Rodríguez-López et al. (2023), initially covered the four stations from 1989 to 2009. However, from 2009 onwards, probably due to resource constraints, measurements were only made in summer and spring. The monitored parameters included surface temperature (measured using the standard thermometry method 2250 B of the NCh 2313 compendium), surface chlorophyll-a (Chl-a, using the fluorometric method), total phosphorus (determined by the standard method 4500 P B, 22nd edition, EAM), total nitrogen (measured using the standard method 4500-N C, 22nd edition, EAM), and water transparency (assessed by Secchi disk depth, SDD). At each station in the lake, water samples were collected from five different depths using a 5 L Niskin bottle. These samples were stored in a thermal container. These samples were stored in thermally insulated boxes, kept cold at about 5 °C on ice, before being transported to a collection center for analysis. Chemical analyses were performed at the DGA chemical laboratory, accredited according to Chilean standard NCh ISO 17025 of 2005 by the Instituto Nacional de Normalización.
2.3 Satellite data, pre-processing and spectral indicators calculation
From October 2014 and March 2024, satellite imagery from Landsat eight and Landsat 9 (L8, L9) was acquired across different seasons. A total of 70 images were downloaded, 50 from L8 and 20 from L9 corresponding to the dates of in situ sampling conducted during this period. Landsat imagery, developed jointly by NASA and the United States Geological Survey (USGS) (Chatenoux et al., 2021), was obtained through the Earth Explorer platform (https://earthexplorer.usgs.gov/, accessed on 14 October 2024). All images correspond to Collection 2 Level one and have a spatial resolution of 30 m. They were selected based on low cloudiness criteria, ensuring that sampling sites were cloud- and fog-free, and that the acquisition date was quite close to the monitoring date (±3 days) in a large part of the images. Quality assessment (QA) bands from each satellite were used to mask clouds, cirrus clouds, and shadows.
Subsequently, the images were processed using the ACOLITE software (version 20231023.0, https://github.com/acolite, and accessed on 21 October 2024), which applies various atmospheric correction algorithms to derive surface-level reflectance (Rrs). ACOLITE integrates the atmospheric correction methods and processing tools developed by the Royal Belgian Institute of Natural Sciences (RBINS) specifically for aquatic remote sensing applications (Vanhellemont, 2020; Vanhellemont and Ruddick, 2016). In this study, two correction approaches were used: the default Dark Spectrum Fitting (DSF) algorithm (Vanhellemont and Ruddick, 2018; Vanhellemont, 2019; Vanhellemont, 2020) and the earlier Exponential Extrapolation (EXP) method (Vanhellemont and Ruddick, 2014; Vanhellemont and Ruddick, 2015; Vanhellemont and Ruddick, 2016). Corrected Rrs bands for water and some spectral indices were derived from the ACOLITE output. These included individual bands, various band ratios, and additional spectral indices, which were subsequently used as input variables in the next steps for phycocyanin prediction. The bands used ranged from the blue to the shortwave infrared region (B, G, R, NIR, SWIR) and a total of 11 band ratios and 17 spectral indices were calculated. These variables were selected based on expert criteria and an extensive literature review focused on spectral indicators related to water quality, chlorophyll concentration, algal blooms, and nutrient levels in aquatic environments that could be related to phycocyanin (Viso-Vázquez et al., 2021; Wang et al., 2022; Rodríguez-López et al., 2023; Magrì et al., 2023; Lyu et al., 2023; Choi et al., 2023). The surface reflectance values (ρs) of each indicator were extracted in a 3 × 3 pixel matrix per sampling point (Rodríguez-López et al., 2023). The extraction sites were located entirely over open water, free from coastal influences, floating vegetation, and shadows. Although Figure 1 does not display the precise locations of the sampling points due to the map scale, they are situated well away from the coastline. Importantly, both the sampling points and the extraction pixels were free of clouds and fog. This extraction was carried out in QGIS 3.40 software (QGIS Development Team, 2024) and the area of interest (Roi) was downloaded from the Chilean Geospatial Data Infrastructure (IDE-Chile, https://www.ide.cl/) accessed on 04 September 2024. Table 1 show the spectral indices obtained and its specific algorithm.

Figure 1. (a) Chile in South America, (b) IX Region (Araucania), (c) Lake Villarrica, orange circle (sampling station).

Table 1. Spectral indices used.
2.4 Regression models
Building upon previous work (Rodríguez-López et al., 2023 PC), we developed linear regression models to estimate concentrations of the pigment phycocyanin (FCA). In this study, a broader set of explanatory variables was employed, derived from the processing of satellite imagery and incorporating both spectral bands and vegetation indices (see Section 2.3). Due to the limited volume of data available at individual stations (usually <90 data points), we aggregated all observations across stations to construct generalized models rather than site-specific ones.
To identify the variables most strongly associated with FCA, we first computed pairwise Pearson correlation coefficients between all candidate predictors and the dependent variable. Only those variables exhibiting statistically significant correlations (pv < 0.05) were retained for model development.
Regression models were then constructed using three variable selection techniques: stepwise selection (Efroymson, 1960), backward elimination (Kutner et al., 2005), and forward selection (James et al., 2023), to determine the most parsimonious and explanatory model configuration. These approaches iteratively assess combinations of predictors based on established statistical criteria, such as the Akaike Information Criterion (AIC) and Bayesian Information Criterion (BIC), to optimize the balance between model complexity and explanatory performance.
While linear regression was chosen for its high degree of interpretability a critical objective for understanding the environmental drivers of phycocyanin its suitability was formally evaluated. We conducted direct comparative analysis against a set of common non-linear machine learning models, including Random Forest, Gradient Boosting, Support Vector Regression, and a multi-layer perceptron Neural Network (Rodríguez-López et al., 2023). This analysis was designed to empirically determine whether the substantial loss in model interpretability associated with these more complex algorithms would be justified by a statistically significant improvement in predictive performance.
2.5 Models’ validation
To assess the generalization performance of the candidate phycocyanin (FCA) regression models and mitigate the risk of overfitting inherent (Cohen and Jensen, 1997) in using model-fit statistics alone (such as AIC or in-sample R2), we employed k-fold cross-validation (with k = 10) (Mahmood and Khan, 2009). This procedure provides a robust assessment of predictive capability on data unseen during model training, which is particularly critical given the aggregation of observations across sites (see Section 2.4).
To more rigorously test model stability and generalizability, several advanced procedures were implemented. First, we conducted Leave-One-Out Cross-Validation (LOOCV), the most stringent form of cross-validation for a dataset of this size. Second, bootstrap validation with 1,000 iterations was performed to generate 95% confidence intervals for performance metrics, providing a robust measure of model stability. Third, temporal validation was executed by training the model on earlier chronological data and testing it on more recent observations to explicitly assess its predictive power on future, unknown conditions. Finally, the selected ordinary least squares (OLS) model was benchmarked against regularized regression techniques (Ridge, Lasso), which penalize complexity to directly diagnose and prevent overfitting. The final model was selected based on the optimal trade-off between predictive accuracy (maximizing R2 and minimizing RMSE) (Preacher, 2006), model parsimony, and consistent, robust performance across this entire suite of validation protocols.
Finally, to ensure that the assumptions underpinning linear regression were met, diagnostic checks were performed on the selected model. Predictor collinearity was assessed by calculating the Variance Inflation Factor (VIF) for each variable. Subsequently, residuals were examined through visual inspection of plots against fitted values to confirm linearity and homoscedasticity (Tsai et al., 1998), while quantile-quantile plots (Augustin et al., 2012) were used to assess the normality of the residual distribution. This comprehensive validation and diagnostic process ensures high confidence in the final model’s predictive power and its applicability for estimating FCA.
3 Results
3.1 Behavior of limnological parameters
Figure 2 and Table 2 show seasonal variations in turbidity, temperature, dissolved oxygen (DO), chlorophyll-a (Chl-a), dissolved organic matter (DOM) and phycocyanin in Lake Villarrica during 1985–2024.

Figure 2. Temporal evolution of limnological parameters in Lake Villarica.

Table 2. Seasonal Behavior of limnological parameters in lake Villarrica.
Turbidity is lowest in spring (0.49 NTU) and highest in autumn (5.51 NTU), coinciding with a marked increase in DOM during autumn (5.27 QSU), probably indicative of organic matter inputs. Water temperature ranges from coldest in winter (10.31 °C) to warmest in summer (21.36 °C) following seasonality. DO peaks in autumn (11.33 ppm), while chlorophyll-a concentrations are highest in autumn (8.57 μg/L), suggesting high biological activity. Phycocyanin follows a similar trend, with higher values in autumn (6.21 μg/L) and lower in spring (0.16 μg/L). Variability is generally higher for DOM and phycocyanin across seasons, highlighting dynamic changes in water quality parameters.
3.2 Correlation matrix
The correlation analysis was performed to evaluate the linear associations between all potential predictor variables (derived as described in Section 2.4) and the target variable, phycocyanin (FCA). The complete matrix of Pearson correlation coefficients (r) and their corresponding significance levels (p-values) are presented (Figure 3; Supplementary Figure S1). Based on this analysis, and adhering to the methodology described (Sections 2.3, 2.4), only predictor variables exhibiting a statistically significant correlation with FCA (p < 0.05, confirmed in Supplementary Figure S1) were selected for inclusion in the subsequent regression modeling phase.

Figure 3. Correlation matrix of most relevant satellite-derived variables and phycocyanin (FCA). The heatmap displays Pearson correlation coefficients (r) for pairwise comparisons between the target variable, phycocyanin (FCA), and potential predictor variables derived from satellite imagery processing. Predictors include spectral bands, band ratios, and standard vegetation and water indices (defined in Methods). Color intensity and hue indicate the strength and direction of the correlation, respectively (scale bar shown right), with numerical coefficients overlaid.
The results highlighted several predictors with strong, significant linear relationships to FCA (Figure 3). Specifically, strong positive correlations were identified between FCA and SABI (r = 0.82), CCI (r = 0.81), the blue spectral band (B; r = 0.78), N/G (r = 0.70), and N/R (r = 0.66). In contrast, significant negative correlations were observed between FCA and GNDVI (r = −0.73), NDVI (r = −0.71), and EVI (r = −0.57).
3.3 Model selection
The variable selection techniques produced a range of high-performing models, as shown in Table 3. While several models yielded high initial R2 values, our comprehensive validation framework (detailed in Section 2.5) identified a more parsimonious six-variable model as providing the optimal balance of predictive power, stability, and robustness against overfitting. This model, identified through the Stepwise selection method, was selected as the final model for phycocyanin estimation:

Table 3. Comparison of top-performing models for Phycocyanin (FCA) estimation. Performance metrics (number of variables, R2, RMSE in μgL−1) for leading linear regression models identified via Stepwise, Backward, and Forward selection methods.
This model was chosen because it consistently performed well across stringent validation tests, including LOOCV and temporal validation, confirming its suitability for general application.
3.3.1 Model robustness and overfitting analysis
To validate the structural integrity of the selected six-predictor model, a suite of advanced diagnostics was performed to move beyond standard performance metrics and explicitly assess its robustness, stability, and risk of overfitting. The results provide strong empirical support for the model’s generalizability.
First, to quantify the stability of the model against variations in the training data, a bootstrap validation with 1,000 resamples was conducted. This analysis yielded a tight 95% confidence interval for the coefficient of determination (R2) of [0.821–0.927], demonstrating that the model’s high predictive power is not an artifact of a specific data partition but is consistently high across the resampling space.
A critical diagnostic for overfitting involved comparing the standard OLS model with a complexity-penalized Ridge regression model. The performance of the Ridge model (R2 = 0.835) was nearly identical to that of the unpenalized OLS model (R2 = 0.834). This lack of improvement from a penalized approach provides compelling evidence that the OLS model is not over-parameterized and that its performance is not inflated by spurious correlations from its predictors.
Furthermore, to ensure the reliability and interpretability of the individual predictor coefficients, multicollinearity was assessed using the Variance Inflation Factor (VIF). All six predictors in the final model exhibited VIF values below 6.5, a result well within the acceptable threshold, confirming the absence of debilitating collinearity.
Collectively, these diagnostic tests, visualized in Figure 4, confirm that the selected six-variable model is not only accurate but also statistically robust, stable, and well-specified, justifying its selection as a reliable estimator for phycocyanin concentrations in Lake Villarrica.

Figure 4. Validation and diagnostic analysis of the final phycocyanin (FCA) model. The panels illustrate key assessments including sample size adequacy (A) model selection using information criteria (B), overfitting diagnostics through learning curves and regularization paths (C,D) model stability via bootstrap validation (E) residual analysis for linearity and normality (F,H), temporal validation performance (G), predictor importance (I) cross-validation robustness (J) and summaries of model complexity versus performance (K,L).
3.3.2 Comparative analysis with non-linear models
To provide a comprehensive justification for the choice of a linear framework, the performance of the final selected model was benchmarked against a set of common non-linear machine learning algorithms. The results, visualized in Figure 5, confirm the suitability of the linear approach. While ensemble models such as Random Forest showed a marginally higher mean cross-validated R2 (Figure 5A), a Mann-Whitney U test confirmed that this performance difference was not statistically significant (p = 0.9937) (Figure 5H).

Figure 5. Comparative analysis justifying the selection of the linear model over non-linear alternatives for phycocyanin estimation. Panels illustrate key comparison metrics including cross-validated performance (A) learning curves (B) model complexity vs overfitting (C) feature importance (D) residual distributions (E) predictive accuracy (F) computational efficiency (G) statistical significance of the performance difference (H) and the trade-off between performance and interpretability (I).
Further diagnostics revealed broad similarities in model behavior. Both linear and non-linear models exhibited comparable learning curves and low overfitting risk (Figures 5B,C), produced similarly distributed residuals (Figure 5E), and showed visually alike predictive accuracy when plotted against actual values (Figure 5F). Critically, an analysis of feature importance demonstrated that both model types identified a similar set of influential spectral indices, with the Cyanobacteria Index (CCI) ranking as a key predictor across all approaches (Figure 5D).
Given these comparable performance and diagnostic characteristics, the decision was based on practical advantages. The linear model offers significantly greater computational efficiency, with training times orders of magnitude faster than the ensemble methods (Figure 5G). This efficiency, combined with the superior interpretability of its coefficients, positions the linear model as the optimal choice on the performance-interpretability trade-off spectrum (Figure 5I). Therefore, because no significant performance gain was observed to justify the substantial loss of interpretability and efficiency, the linear regression model was confirmed as the most appropriate choice for the scientific objectives of this study.
3.4 Estimation models
The selected model (Section 3.3) was used to estimate FCA concentrations across the full time series. Due to data limitations at individual stations, model evaluation was conducted at the weekly scale for the entire lake (Figure 6), rather than per site. The linear model successfully captured the seasonal dynamics, interannual variability, and several extreme values observed in the measured data. Overall model performance was high, with an R2 of 0.91 and RMSE of 0.050.

Figure 6. Observed vs predicted phycocyanin (FCA) concentrations over time. Weekly time series from 2014 to 2021 showing measured (blue) and modelled (red) FCA value.
To further assess the model’s utility for operational and year-round monitoring, its performance was disaggregated and evaluated by season. The analysis revealed consistently high performance across distinct seasonal conditions. The model achieved an R2 of 0.93 (RMSE = 0.057 μg/L) in Autumn, an R2 of 0.88 (RMSE = 0.089 μg/L) in Summer, and an R2 of 0.80 (RMSE = 0.085 μg/L) in Spring. This remarkable consistency is quantified by the coefficient of variation (CV) for the R2 metric across seasons, which was an exceptionally low 0.063 (6.3%). This result provides strong empirical evidence that the model’s predictive power is stable and reliable throughout the year, making it a suitable tool for continuous monitoring applications.
Given the use of linear regression and implementation of cross-validation during model selection, an additional train-test split was not required. The model’s parsimony and interpretability further support its application for long-term phycocyanin estimation.
3.4.1 Mapping model
In Figure 7 we show the mapping model in a Landsat eight satellite image of 03-14-2020.
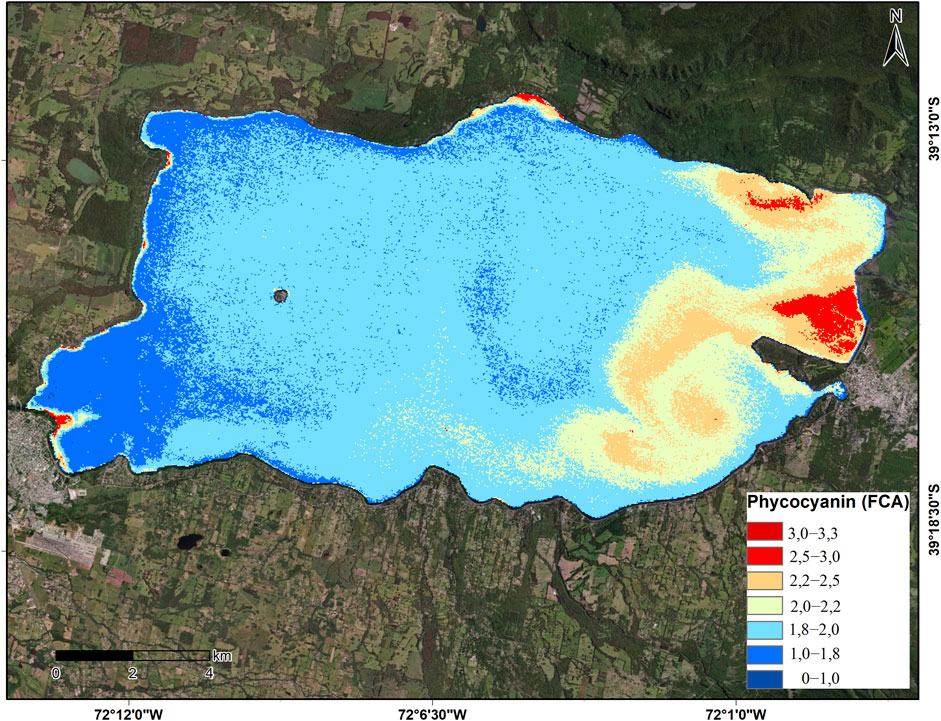
Figure 7. Mapping of the best estimation model selected.
3.5 Algal community variability
In Figure 8 we can observe bar diagrams comparing the seasonal abundance of eight phytoplankton groups at seven stations (VR1 to VR7) during summer and spring. Bacillariophyceae (brown bars) dominate in both seasons, with higher total abundance observed in summer, especially in VR5, VR6 and VR7. In particular, Cyanophyceae (green bars) show a significant presence in VR7 during summer, indicating possible cyanobacterial blooms, while their contribution is minimal in spring. Other groups, such as Chlorophyceae (yellow) and Cryptophyceae (blue), are present but less abundant in both seasons.

Figure 8. Abundance of algal groups in the seven-water station in Villarrica Lake.
Seasonal differences reveal that total phytoplankton abundance is systematically higher in summer, suggesting favorable environmental conditions, such as warmer temperatures or greater nutrient availability. In spring, abundance is lower at all stations, with Bacillariophyceae still dominant but other groups contributing more visibly. Station VR7 stands out for its great variability, with Cyanophyceae thriving in summer but almost absent in spring. These patterns highlight changes in community composition influenced by seasonal and spatial factors.
In Figure 9 the bar plots depict the abundance of various cyanobacteria species across seven stations (VR1 to VR7) during summer (left) and spring (right) in Villarrica lake. In summer, total cyanobacteria abundance is significantly higher, particularly at VR4, VR5, and VR7, with dominant species such as Microcystis spp., Dolichospermum lemmermannii, and Anabaena spp. VR5 shows the highest abundance, while VR6 and VR7 display relatively lower totals but with notable contributions from Anabaena spiroides and Aphanocapsa sp. In spring, cyanobacteria abundance is drastically reduced at all stations, with fewer dominant species, including A. spp., A. spiroides, and Microcystis elachista. The seasonal variation highlights a pronounced bloom in summer, likely driven by favorable conditions, while spring displays a more subdued cyanobacteria presence.

Figure 9. Seasonal abundance of Cyanophyceae in the seven-sampling station in the lake.
4 Discussion
Lake Villarrica, located in the south-central of Chile, is one of only two lakes in the country alongside Lake Llanquihue that benefit from the application of a secondary environmental quality standards for the protection of the surface continental waters as well as the Exempt Resolution SMA N◦671/2016 which proposes and justifies the modification of the water quality monitoring performed by the DGA in Lake Villarrica due to multiple anthropogenic impacts, the lakes condition has changed from oligotrophic to mesotrophic, which has led to the implementation of Decree N◦19/2013 of the Ministry of Environment (Rodríguez-López et al., 2023). These standards are crucial for protecting aquatic ecosystems and public health, particularly in regions under increasing anthropogenic pressure. The lake holds significant ecological, economic, and social value, positioning it as a major tourist destination in southern Chile. Its strategic location also includes two urban centers on its shores: the cities of Villarrica and Pucón, according to the last census conducted in 2017 the population is 55,478 habitants and 3,260 habitants respectively (INE, 2017), both of which contribute to, and are impacted by, the dynamics of the lake’s water quality.
Over the past decade, Lake Villarrica has experienced recurrent episodes of algal blooms, primarily during the austral summer months, which coincide with the peak tourist season. These events have raised concerns due to their potential ecological consequences, aesthetic impacts, and implications for recreational water use. More recently, there has been a noticeable increase in both the frequency and duration of these blooms, which now extend from late spring through to early autumn. This shift in phenology is likely linked to climate driven changes, particularly the warming of surface water temperatures, which create more favorable conditions for bloom development (Rodríguez-López et al., 2023).
In our previous research (Rodríguez-López et al., 2023), we focused on the remote detection of algal blooms in Lake Villarrica using satellite-based observations and field validation techniques. These studies enabled us to characterize the spatial and temporal patterns of bloom occurrences, as well as to identify the dominant algal taxa responsible for bloom formation. Notably, we found that the blooms were frequently dominated by Dolichospermum circinale (formerly Anabaena circinalis), a filamentous cyanobacterium belonging to the class Cyanophyceae. This species is known for its ability to produce harmful cyanotoxins, raising additional concerns for human and ecosystem health.
In Rodríguez-López et al. (2023), we extended this line of research by assessing the potential of remotely sensed phycocyanin concentrations as an indicator of bloom toxicity. Phycocyanin is a water-soluble pigment specific to cyanobacteria and serves as a reliable proxy for their presence and abundance. By estimating phycocyanin levels using hyperspectral and multispectral satellite data calibrated with in situ measurements, we aimed to distinguish potentially toxic cyanobacterial blooms from non-toxic algal proliferations. This approach contributes to the development of early warning systems and management tools for monitoring harmful algal blooms (HABs) in freshwater ecosystems.
Unlike earlier approaches that primarily emphasized presence-absence classification, our objective was to develop predictive models capable of estimating continuous phycocyanin values using satellite-derived data.
We employed surface reflectance data obtained from the Landsat satellite series, specifically leveraging information from the blue, green, red, and near-infrared (NIR) spectral bands. In addition to individual bands, we computed a suite of spectral indices known to be relevant for aquatic environments and vegetation dynamics, including the Normalized Difference Vegetation Index (NDVI), Green NDVI (GNDVI), Enhanced Vegetation Index (EVI), Surface Algal Bloom Index (SABI), Cyanobacteria Index (CCI), and various band ratio combinations such as NIR/Green (N/G).
To explore the predictive capacity of these variables, we constructed 255 multiple linear regression models using different combinations of spectral bands and indices as independent variables, with phycocyanin concentration as the dependent variable. Model performance was assessed using a set of validation metrics, including the coefficient of determination (R2) and root mean square error (RMSE), and we retained the ten highest-performing models for further analysis.
The most effective model, selected through a stepwise regression procedure, incorporated seven statistically significant predictors (p < 0.05) and took the following form:
This model achieved a strong fit to the validation data, with an R2 of 0.852 and an RMSE of 0.102 μg/L, indicating high explanatory power and relatively low error in phycocyanin estimation. When applied to the complete weekly time series of satellite observations, the model successfully captured both seasonal dynamics and interannual variability in phycocyanin concentrations (R2 = 0.91; RMSE = 0.050 μg/L). These results demonstrate the robustness and practical utility for long-term monitoring of harmful algal blooms in Lake Villarrica.
The inclusion of multiple vegetation and algal indices allowed for improved sensitivity to variations in water optical properties associated with cyanobacterial abundance. Notably, the combination of traditional vegetation indices (e.g., NDVI, EVI) with indices specifically tailored to cyanobacterial detection (e.g., SABI, CCI) enhanced the model’s capacity to discriminate bloom conditions under a range of environmental scenarios.
Our findings support the integration of satellite-based regression modeling as a cost-effective and scalable tool for monitoring toxic cyanobacterial blooms in freshwater ecosystems. The approach not only enables frequent and spatially extensive assessments but also provides a solid foundation for the development of early warning systems to protect public health and aquatic biodiversity. We expect future research to incorporate in situ spectral measurements and explore the integration of higher resolution sensors, such as Sentinel-2A/B, to improve model calibration and support more robust water quality assessments.
5 Conclusion
This study highlights the potential of satellite remote sensing specifically the use of Landsat imagery for supporting the continuous monitoring of harmful algal blooms (HABs) in ecologically and socially valuable lakes such as Villarrica in southern Chile. A multivariate regression model, integrating both general (NDVI, EVI) and cyanobacteria-targeted indices (SABI, CCI), demonstrated promising accuracy in estimating phycocyanin concentrations (R2 = 0.852; RMSE = 0.102 μg/L), a key proxy for toxic cyanobacterial presence. While these results are encouraging, it is important to acknowledge the limitations associated with the moderate spatial and spectral resolution of Landsat data, which may reduce the model’s sensitivity to optically complex water conditions influenced by CDOM, suspended sediments, or bottom effects.
From an applied perspective, these findings offer a useful foundation for developing early warning systems to support lake management strategies, especially in regions facing increasing pressure from climate change and eutrophication. Future efforts should incorporate in situ spectral measurements and leverage higher-resolution satellite sensors (e.g., Sentinel-2 or hyperspectral missions) to improve detection capability and enable more responsive, cost-effective monitoring programs tailored to the needs of local water authorities.
Data availability statement
Publicly available datasets were analyzed in this study. This data can be found here: https://www.dga.cl/.
Author contributions
LR-L: Conceptualization, Data curation, Formal Analysis, Funding acquisition, Investigation, Methodology, Project administration, Resources, Software, Supervision, Validation, Writing – original draft. DU: Data curation, Formal Analysis, Methodology, Software, Visualization, Writing – review and editing. ID-L: Data curation, Methodology, Software, Writing – review and editing. LA: Data curation, Software, Validation, Visualization, Writing – review and editing. LB: Formal Analysis, Project administration, Supervision, Writing – review and editing. FF: Conceptualization, Data curation, Formal Analysis, Funding acquisition, Methodology, Resources, Supervision, Validation, Writing – review and editing. RU: Conceptualization, Formal Analysis, Funding acquisition, Investigation, Methodology, Project administration, Resources, Writing – review and editing.
Funding
The author(s) declare that financial support was received for the research and/or publication of this article. LR-L thank to Fondecyt Iniciación 2025 Project ANID/11250177. LR-L and RU are grateful to the Centro de Recursos Hídricos para la Agricultura y la Minería (CRHIAM) (Project ANID/FONDAP/15130015 and ANID/FONDAP/1523A0001).
Conflict of interest
The authors declare that the research was conducted in the absence of any commercial or financial relationships that could be construed as a potential conflict of interest.
The author(s) declared that they were an editorial board member of Frontiers, at the time of submission. This had no impact on the peer review process and the final decision.
The reviewer SY declared a shared affiliation with the authors DFBU, LBA and RU to the handling editor at the time of review.
Correction note
A correction has been made to this article. Details can be found at: 10.3389/frsen.2025.1714525.
Generative AI statement
The author(s) declare that no Generative AI was used in the creation of this manuscript.
Any alternative text (alt text) provided alongside figures in this article has been generated by Frontiers with the support of artificial intelligence and reasonable efforts have been made to ensure accuracy, including review by the authors wherever possible. If you identify any issues, please contact us.
Publisher’s note
All claims expressed in this article are solely those of the authors and do not necessarily represent those of their affiliated organizations, or those of the publisher, the editors and the reviewers. Any product that may be evaluated in this article, or claim that may be made by its manufacturer, is not guaranteed or endorsed by the publisher.
Supplementary material
The Supplementary Material for this article can be found online at: https://www.frontiersin.org/articles/10.3389/frsen.2025.1633522/full#supplementary-material
References
Adjovu, G. E., Stephen, H., James, D., and Ahmad, S. (2023). Overview of the application of remote sensing in effective monitoring of water quality parameters. Remote Sens. 15 (7), 1938. doi:10.3390/rs15071938
Ahmed, S. F., Kumar, P. S., Kabir, M., Zuhara, F. T., Mehjabin, A., Tasannum, N., et al. (2022). Threats, challenges and sustainable conservation strategies for freshwater biodiversity. Environ. Res. 214, 113808. doi:10.1016/j.envres.2022.113808
Alawadi, F. (2010). “Detection of surface algal blooms using the newly developed algorithm surface algal bloom index (SABI),” in Proc. SPIE 7825, Remote Sensing of the Ocean, Sea Ice, and Large Water Regions 2010, 782506 (18 October 2010). doi:10.1117/12.862096
Almuhtaram, H., Kibuye, F. A., Ajjampur, S., Glover, C. M., Hofmann, R., Gaget, V., et al. (2021). State of knowledge on early warning tools for Cyanobacteria detection. Ecol. Indic. 133, 108442. doi:10.1016/j.ecolind.2021.108442
Augustin, N. H., Sauleau, E. A., and Wood, S. N. (2012). On quantile quantile plots for generalized linear models. Comput. Statistics and Data Analysis 56 (8), 2404–2409. doi:10.1016/j.csda.2012.01.026
Batina, A., and Krtalić, A. (2024). Integrating remote sensing methods for monitoring Lake water quality: a comprehensive review. Hydrology 11 (7), 92. doi:10.3390/hydrology11070092
Binding, C. E., Pizzolato, L., and Zeng, C. (2021). EOLakeWatch; delivering a comprehensive suite of remote sensing algal bloom indices for enhanced monitoring of Canadian eutrophic lakes. Ecol. Indic. 121, 106999. doi:10.1016/j.ecolind.2020.106999
Carmona, F., Rivas, R., and Fonnegra, D. C. (2015). Vegetation Index to estimate chlorophyll content from multispectral remote sensing data. Eur. J. Remote Sens. 48 (1), 319–326. doi:10.5721/EuJRS20154818
Chatenoux, B., Richard, J. P., Small, D., Roeoesli, C., Wingate, V., Poussin, C., et al. (2021). The Swiss data cube, analysis ready data archive using Earth observations of Switzerland. Sci. Data 8, 295. doi:10.1038/s41597-021-01076-6
Cheng, C., Wei, Y., Lv, G., and Yuan, Z. (2013). Remote estimation of chlorophyll-a concentration in turbid water using a spectral index: a case study in Taihu Lake, China. J. Appl. Remote Sens. 7 (1), 073465-073465.
Choi, B., Lee, J., Park, B., and Sungjong, L. (2023). A study of cyanobacterial bloom monitoring using unmanned aerial vehicles, spectral indices, and image processing techniques. Heliyon 9 (5), e16343. doi:10.1016/j.heliyon.2023.e16343
Chorus, I., and Welker, M. (2021). Toxic Cyanobacteria in water: a guide to their public health consequences, monitoring and management. Oxfordshire, England: Taylor and Francis, 858. doi:10.1201/9781003081449
Cohen, P. R., and Jensen, D. (1997). “Overfitting explained,” in Sixth international workshop on artificial intelligence and statistics (Amherst, MA: PMLR), 115–122.
Devlin, M., and Brodie, J. (2023). “Nutrients and eutrophication,” in Marine pollution–monitoring, management and mitigation (Cham: Springer Nature Switzerland), 75–100. doi:10.1007/978-3-031-10127-4_4
Feng, L., Wang, Y., Hou, X., Qin, B., Kuster, T., Qu, F., et al. (2024). Harmful algal blooms in inland waters. Nat. Rev. Earth and Environ. 5, 631–644. doi:10.1038/s43017-024-00578-2
Gad, M., Saleh, A. H., Hussein, H., Elsayed, S., and Farouk, M. (2023). Water quality evaluation and prediction using irrigation indices, artificial neural networks, and partial least square regression models for the Nile River, Egypt. Water 15 (12), 2244. doi:10.3390/w15122244
Gitelson, A. A., Kaufman, Y. J., and Merzlyak, M. N. (1996). Use of a green channel in remote sensing of global vegetation from EOS-MODIS. Remote Sens. Environ. 58 (3), 289–298. doi:10.1016/S0034-4257(96)00072-7
Gitelson, A. A., Kaufman, Y. J., Stark, R., and Rundquist, D. (2002). Novel algorithms for remote estimation of vegetation fraction. Remote Sens. Environ. 80, 76–87. doi:10.1016/S0034-4257(01)00289-9
Gitelson, A. A., Viña, A., Ciganda, V., Rundquist, D. C., and Arkebauer, T. J. (2005). Remote estimation of canopy chlorophyll content in crops. Geophys. Res. Lett. 32, L08403. doi:10.1029/2005GL022688
Hu, C. (2009). A novel Ocean color index to detect floating algae in the global Oceans. Remote Sens. Environ. 113, 2118–2129. doi:10.1016/j.rse.2009.05.012
Huete, A., Didan, K., Miura, T., Rodriguez, E. P., Gao, X., and Ferreira, L. G. (2002). Overview of the radiometric and biophysical performance of the MODIS vegetation indices. Remote Sens. Environ. 83, 195–213. doi:10.1016/S0034-4257(02)00096-2
Igwaran, A., Kayode, A. J., Moloantoa, K. M., Khetsha, Z. P., and Unuofin, J. O. (2024). Cyanobacteria harmful algae blooms: causes, impacts, and risk management. Water, Air, and Soil Pollut. 235 (1), 71. doi:10.1007/s11270-023-06782-y
INE (2017). Instituto Nacional de Estadísticas. Available online at: https://www.ine.gob.cl/.
James, G., Witten, D., Hastie, T., Tibshirani, R., and Taylor, J. (2023). “Statistical learning,” in An introduction to statistical learning: with applications in Python (Cham: Springer International Publishing), 15–67. doi:10.1007/978-3-031-38747-0_2
Jenny, J. P., Anneville, O., Arnaud, F., Baulaz, Y., Bouffard, D., Domaizon, I., et al. (2020). Scientists’ warning to humanity: rapid degradation of the world’s large lakes. J. Gt. Lakes. Res. 46 (4), 686–702. doi:10.1016/j.jglr.2020.05.006
Kaufman, Y. J., and Tanre, D. (1992). Atmospherically resistant vegetation index (ARVI) for EOS-MODIS. IEEE transactions on Geoscience and Remote Sensing, 30 (2), 261–270.
Kazmi, S. S. U. H., Yapa, N., Karunarathna, S. C., and Suwannarach, N. (2022). Perceived intensification in harmful algal blooms is a wave of cumulative threat to the aquatic ecosystems. Biology 11 (6), 852. doi:10.3390/biology11060852
Konik, M., Bradtke, K., Stoń-Egiert, J., Soja-Woźniak, M., Śliwińska-Wilczewska, S., and Darecki, M. (2023). Cyanobacteria index as a tool for the satellite detection of Cyanobacteria blooms in the Baltic sea. Remote Sens. 15 (6), 1601. doi:10.3390/rs15061601
Kutner, M. H., Nachtsheim, C. J., Neter, J., and Li, W. (2005). Applied linear statistical models. Hanoi, Vietnam: McGraw-Hill.
Lukhabi, D. K., Mensah, P. K., Asare, N. K., Pulumuka-Kamanga, T., and Ouma, K. O. (2023). Adapted water quality indices: limitations and potential for water quality monitoring in Africa. Water 15 (9), 1736. doi:10.3390/w15091736
Luo, J., Ni, G., Zhang, Y., Wang, K., Shen, M., Cao, Z., et al. (2023). A new technique for quantifying algal bloom, floating/emergent and submerged vegetation in eutrophic shallow Lakes using landsat imagery. Remote Sens. Environ. 287, 113480. doi:10.1016/j.rse.2023.113480
Lyu, L., Song, K., Wen, Z., Liu, G., Fang, C., Shang, Y., et al. (2023). Remote estimation of phycocyanin concentration in inland waters based on optical classification. Sci. Total Environ. 899, 166363. doi:10.1016/j.scitotenv.2023.166363
Ma, J., Jin, S., Li, J., He, Y., and Shang, W. (2021). Spatio-temporal variations and driving forces of harmful algal blooms in Chaohu Lake: a multi-source remote sensing approach. Remote Sens. 13 (3), 427.
Magrì, S., Ottaviani, E., Prampolini, E., Federici, B., Besio, G., and Fabiano, B. (2023). Application of machine learning techniques to derive sea water turbidity from Sentinel-2 imagery. Remote Sens. Appl. 30, 100951. doi:10.1016/j.rsase.2023.100951
Mahmood, Z., and Khan, S. (2009). On the use of k-fold cross-validation to choose cutoff values and assess the performance of predictive models in stepwise regression. Int. J. Biostat. 5 (1). doi:10.2202/1557-4679.1105
Markogianni, V., Kalvas, D., Petropoulos, G. P., and Dimitriou, E. (2018). An appraisal of the potential of landsat 8 in estimating Chlorophyll-a, ammonium concentrations and other water quality indicators. Remote Sens. 10, 1018. doi:10.3390/rs10071018
Mejia Ávila, D., Lobo Cabeza, S., and Soto Barrera, V. C. (2023). Method for assessing spectral indices efficiency for mapping tropical wetlands—Sia_mw. Appl. Geomatics 15 (4), 829–851. doi:10.1007/s12518-023-00526-7
Melese, H., and Debella, H. J. (2023). Comparative study on seasonal variations in physico-chemical characteristics of four soda Lakes of Ethiopia (arenguade, beseka, chitu and shala). Heliyon 9 (5), e16308. doi:10.1016/j.heliyon.2023.e16308
Mishra, R. K. (2023). Fresh water availability and its global challenge. Br. J. Multidiscip. Adv. Stud. 4 (3), 1–78. doi:10.37745/bjmas.2022.0208
Mishra, S., and Mishra, D. R. (2012). Normalized difference chlorophyll index: a novel model for remote estimation of chlorophyll-a concentration in turbid productive waters. Remote Sens. Environ. 117, 394–406. doi:10.1016/j.rse.2011.10.016
Mishra, D. R., Schaeffer, B. A., and Keith, D. (2014). Performance evaluation of normalized difference chlorophyll index in northern Gulf of Mexico estuaries using the hyperspectral imager for the coastal ocean. GIScience and Remote Sens. 51 (2), 175–198. doi:10.1080/15481603.2014.895581
Mokarram, M., Hojjati, M., Roshan, G., and Negahban, S. (2015). Modeling the behavior of vegetation indices in the salt dome of korsia in north-east of darab, Fars, Iran. Model. Earth Syst. Environ. 1, 27–29. doi:10.1007/s40808-015-0029-y
Moreira, C., Vasconcelos, V., and Antunes, A. (2022). Cyanobacterial blooms: current knowledge and new perspectives. Earth 3 (1), 127–135. doi:10.3390/earth3010010
Mukonza, S. S., and Chiang, J. L. (2023). Meta-analysis of satellite observations for united nations sustainable development goals: exploring the potential of machine learning for water quality monitoring. Environments 10 (10), 170. doi:10.3390/environments10100170
Preacher, K. J. (2006). Quantifying parsimony in structural equation modeling. Multivar. Behav. Res. 41 (3), 227–259. doi:10.1207/s15327906mbr4103_1
Qing, S., Runa, A., Shun, B., Zhao, W., Bao, Y., and Hao, Y. (2020). Distinguishing and mapping of aquatic vegetations and yellow algae bloom with landsat satellite data in a complex shallow Lake, China during 1986–2018. Ecol. Indic. 112, 106073. doi:10.1016/j.ecolind.2020.106073
Rodríguez-López, L., Duran-Llacer, I., González-Rodríguez, L., Abarca-del-Rio, R., Cárdenas, R., Parra, O., et al. (2020). Spectral analysis using LANDSAT images to monitor the chlorophyll-a concentration in Lake laja in Chile. Ecol. Inf. 60, 101183. doi:10.1016/j.ecoinf.2020.101183
Rodríguez-López, L., Usta, D. B., Duran-Llacer, I., Alvarez, L. B., Yépez, S., Bourrel, L., et al. (2023). Estimation of water quality parameters through a combination of deep learning and remote sensing techniques in a Lake in southern Chile. Remote Sens. 15 (17), 4157. doi:10.3390/rs15174157
Rouse, J., Haas, R., Scheel, J., and Eering, D. W. (1976). Monitoring vegetation systems in the great plains with ERTS, 1. Washington, DC, USA, 48–62.
Sivarajah, B. (2020). Examining the long-term ecological consequences of gold mining operations, urbanization, and climatic changes on sub-arctic Lakes near yellowknife Northwest Territories, Canada using diatoms as paleoenvironmental indicators doctoral dissertation. Canada: Queen's University.
Sripada, R. P., Heiniger, R. W., White, J. G., and Meijer, A. D. (2006). Aerial color infrared photography for determining early in-season nitrogen requirements in corn. Agron. J. 98 (4), 968–977. doi:10.2134/agronj2005.0200
Svirčev, Z., Chen, L., Sántha, K., Drobac Backović, D., Šušak, S., Vulin, A., et al. (2022). A review and assessment of cyanobacterial toxins as cardiovascular health hazards. Archives Toxicol. 96 (11), 2829–2863. doi:10.1007/s00204-022-03354-7
Uddin, M. G., Nash, S., Rahman, A., Dabrowski, T., and Olbert, A. I. (2024). Data-driven modelling for assessing trophic status in marine ecosystems using machine learning approaches. Environ. Res. 242, 117755. doi:10.1016/j.envres.2023.117755
Vadeboncoeur, Y., Moore, M. V., Stewart, S. D., Chandra, S., Atkins, K. S., Baron, J. S., et al. (2021). Blue waters, green bottoms: benthic filamentous algal blooms are an emerging threat to clear Lakes worldwide. BioScience 71 (10), 1011–1027. doi:10.1093/biosci/biab049
Vanhellemont, Q. (2019). Adaptation of the dark spectrum fitting atmospheric correction for aquatic applications of the landsat and Sentinel-2 archives. Remote Sens. Environ. 225, 175–192. doi:10.1016/j.rse.2019.03.010
Vanhellemont, Q. (2020). Sensitivity analysis of the dark spectrum fitting atmospheric correction for Metre- and decametre-scale satellite imagery using autonomous hyperspectral radiometry. Opt. Express 28, 29948. doi:10.1364/OE.397456
Vanhellemont, Q., and Ruddick, K. (2014). Turbid wakes associated with offshore wind turbines observed with landsat 8. Remote Sens. Environ. 145, 105–115. doi:10.1016/j.rse.2014.01.009
Vanhellemont, Q., and Ruddick, K. (2015). Advantages of high quality SWIR bands for ocean colour processing: examples from Landsat-8. Remote Sens. Environ. 161, 89–106. doi:10.1016/j.rse.2015.02.007
Vanhellemont, Q., and Ruddick, K. (2016). “Acolite for Sentinel-2: aquatic applications of MSI imagery,” in Proceedings of the 2016 ESA living Planet Symposium (Prague, Czech Republic), 9–13.
Vanhellemont, Q., and Ruddick, K. (2018). Atmospheric correction of metre-scale optical satellite data for inland and coastal water applications. Remote Sens. Environ. 216, 586–597. doi:10.1016/j.rse.2018.07.015
Venancio, L. P., Mantovani, E. C., do Amaral, C. H., Neale, C. M. U., Gonçalves, I. Z., Filgueiras, R., et al. (2020). Potential of using spectral vegetation indices for corn green biomass estimation based on their relationship with the photosynthetic vegetation sub-pixel fraction. Agric. Water Manag. 236, 106155. doi:10.1016/j.agwat.2020.106155
Vescovo, L., Wohlfahrt, G., Balzarolo, M., Pilloni, S., Sottocornola, M., Rodeghiero, M., et al. (2012). New spectral vegetation indices based on the near-infrared shoulder wavelengths for remote detection of grassland phytomass. Int. J. remote Sens. 33 (7), 2178–2195. doi:10.1080/01431161.2011.607195
Viso-Vázquez, M., Acuña-Alonso, C., Rodríguez, J. L., and Álvarez, X. (2021). Remote detection of cyanobacterial blooms and chlorophyll-a analysis in a eutrophic reservoir using Sentinel-2. Sustainability 13 (15), 8570. doi:10.3390/su13158570
Wang, J., Wang, Z., Cui, Y., and Yan, S. (2022). Dynamic monitoring of phycocyanin concentration in Chaohu Lake of China using Sentinel-3 images and its indication of cyanobacterial blooms. Ecol. Indic. 143, 109340. doi:10.1016/j.ecolind.2022.109340
Wu, H., Cheng, F., Chen, J., Li, H., Xu, J., He, P., et al. (2024). Species-Specific responses of bloom-forming algae to the Ocean warming and acidification. Plants 13 (17), 2433. doi:10.3390/plants13172433
Xu, H. (2006). Modification of Normalised Difference Water Index (NDWI) to enhance open water features in remotely sensed imagery. Int. J. Remote Sens. 27, 3025–3033. doi:10.1080/01431160600589179
Yépez, S., Velásquez, G., Torres, D., Saavedra-Passache, R., Pincheira, M., Cid, H., et al. (2024). Spatiotemporal variations in biophysical water quality parameters: an integrated in situ and remote sensing analysis of an Urban Lake in Chile. Remote Sens. 16 (2), 427. doi:10.3390/rs16020427
Zahir, M., Su, Y., Shahzad, M. I., Ayub, G., Rehman, S. U., and Ijaz, J. (2024). A review on monitoring, forecasting, and early warning of harmful algal bloom. Aquaculture 593, 741351. doi:10.1016/j.aquaculture.2024.741351
Zepernick, B. N., Wilhelm, S. W., Bullerjahn, G. S., and Paerl, H. W. (2023). Climate change and the aquatic continuum: a cyanobacterial comeback story. Environ. Microbiol. Rep. 15 (1), 3–12. doi:10.1111/1758-2229.13122
Zhou, B., Shang, M., Wang, G., Zhang, S., Feng, L., Liu, X., et al. (2018). Distinguishing two phenotypes of blooms using the normalised difference peak-valley index (NDPI) and Cyano-Chlorophyta index (CCI). Sci. Total Environ. 628, 848–857. doi:10.1016/j.scitotenv.2018.02.097
Keywords: remote sensing, phycocyanin, algal blooms, lake, Chile
Citation: Rodríguez-López L, Usta DFB, Duran-Llacer I, Alvarez LB, Bourrel L, Frappart F and Urrutia R (2025) Advanced phycocyanin detection in a south American lake using landsat imagery and remote sensing. Front. Remote Sens. 6:1633522. doi: 10.3389/frsen.2025.1633522
Received: 22 May 2025; Accepted: 28 August 2025;
Published: 11 September 2025; Corrected: 16 December 2025.
Edited by:
Hyunglok Kim, Gwangju Institute of Science and Technology, Republic of KoreaReviewed by:
Srinivas Kolluru, Florida Atlantic University, United StatesMengjia Wang, Zhengzhou University, China
Santiago Yepez, University of Concepcion, Chile
Hoang Hai Nguyen, Gwangju Institute of Science and Technology, Republic of Korea
Copyright © 2025 Rodríguez-López, Usta, Duran-Llacer, Alvarez, Bourrel, Frappart and Urrutia. This is an open-access article distributed under the terms of the Creative Commons Attribution License (CC BY). The use, distribution or reproduction in other forums is permitted, provided the original author(s) and the copyright owner(s) are credited and that the original publication in this journal is cited, in accordance with accepted academic practice. No use, distribution or reproduction is permitted which does not comply with these terms.
*Correspondence: Lien Rodríguez-López, bGllbi5yb2RyaWd1ZXpAdXNzLmNs