 Phi Le
 Xingyue Gong2
 Hai Yang
 Bridget P. Keenan
 Li Zhang
 Tao He
- 1Division of Hematology/Oncology, Department of Medicine, University of California, San Francisco, San Francisco, CA, United States
- 2Department of Physiological Nursing, School of Nursing, University of California, San Francisco, San Francisco, CA, United States
- 3Helen Diller Family Comprehensive Cancer Center, University of California, San Francisco, San Francisco, CA, United States
- 4Department of Epidemiology and Biostatistics, University of California, San Francisco, San Francisco, CA, United States
- 5Department of Mathematics, San Francisco State University, San Francisco, CA, United States
Exploring features associated with the clinical outcome of interest is a rapidly advancing area of research. However, with contemporary sequencing technologies capable of identifying over thousands of genes per sample, there is a challenge in constructing efficient prediction models that balance accuracy and resource utilization. To address this challenge, researchers have developed feature selection methods to enhance performance, reduce overfitting, and ensure resource efficiency. However, applying feature selection models to survival analysis, particularly in clinical datasets characterized by substantial censoring and limited sample sizes, introduces unique challenges. We propose a robust ensemble feature selection approach integrated with group Lasso to identify compelling features and evaluate its performance in predicting survival outcomes. Our approach consistently outperforms established models across various criteria through extensive simulations, demonstrating low false discovery rates, high sensitivity, and high stability. Furthermore, we applied the approach to a colorectal cancer dataset from The Cancer Genome Atlas, showcasing its effectiveness by generating a composite score based on the selected genes to correctly distinguish different subtypes of the patients. In summary, our proposed approach excels in selecting impactful features from high-dimensional data, yielding better outcomes compared to contemporary state-of-the-art models.
Introduction
Next-generation sequencing (NGS) techniques (Hu et al., 2021) can provide us with information on the expression of more than 30,000 genes, which helps researchers understand gene regulations and interactions to find treatments for diseases. However, the number of genes associated with a particular disease is small (Yang et al., 2005). Therefore, we need to develop powerful tools to select genes that work as a group and are associated with clinical outcomes. Feature selection approaches were developed to choose the most relevant and informative features for research questions from the original raw set of features; therefore, they can help avoid overfitting, reduce training time, handle the challenge of dimensionality, and simplify data representations.
Survival analysis (Klein et al., 1992) is a statistical model studying time-to-event data in which the event may not be observed (censored) during the study because of loss to follow-up or early end of the study. Due to the presence of censoring, which is a unique characteristic in survival analysis, there is a need to develop novel techniques to work with feature selections for survival data, especially for high-throughput gene expression data in which most of the potential predictors are unimportant, with nearly no effect on the outcome (Friedman et al., 2010). The Cox proportional hazards model is the most commonly used technique for analyzing survival data. However, it was not designed for high-dimensional datasets with a large number of predictors. Lasso (Least Absolute Shrinkage and Selection Operator) introduces a penalty term to the Cox model’s likelihood function, which penalizes the absolute values of the regression coefficients. By forcing some coefficients to be exactly zero, Lasso effectively performing variable selection. In addition, there are models tailored to effectively handle situations where the number of features outweighs the number of observations (Li et al., 2018). Machine learning techniques that inherently handle high-dimensional data have been adapted to handle censored data, offering more flexible alternatives for analyzing high-dimensional, right-censored, heterogeneous data. However, unlike statistical models based on a mathematical framework, machine learning approaches do not impose a specified relationship on the predictors and outcomes and rely mainly on–data-driven algorithms, which makes it hard to interpret results. Furthermore, a lot of feature selection methods for survival analysis use a scoring model (Neums et al., 2019) to measure variations of features to select important features. Since the scoring algorithm was developed specifically to take care of the data censors and tie events of survival data, the results are biased (Munson et al., 2009) which may lead to selecting nonimportant features and provide a less accurate prediction.
We introduce a robust and effective “Pseudo-variables Assisted Group Lasso” method built on the ensemble idea, i.e., “more heads are better than one”, where features obtained from different selectors are aggregated to enhance the final selection. Moreover, we incorporated pseudo-variables which we know are irrelevant to the outcome and the permutation technique to assist the selection. The ensemble and pseudo-variables are nicely embedded into the Group Lasso model to yield the final output. Among aggregated features, only the features that consistently show stronger signals than the pseudo-variables (known noises) across permutations will be selected. We used colorectal cancer data from The Cancer Genome Atlas (TCGA) for illustration of our proposed approach. In addition, we performed simulation studies based on two different settings, where the first one mimicked the colorectal cancer data, and the second considered more complicated situations under various scenarios. For each simulation, we first simulated gene expression data for hundreds of genes and then generated survival outcomes based on some causal genes. The proposed feature selection ensemble method was applied to “uncover” the causal genes and compared to the existing methods.
Materials and methods
Colorectal cancer data set from TCGA database
Raw gene expression counts were downloaded from colon cancer (The Cancer Genome Atlas Network, 2012) datasets using The Cancer Genomics Cloud (Lau et al., 2017); additional clinical metadata was downloaded from cBioportal (Cerami et al., 2012). The mRNA-Seq data from TCGA was produced using the Illumina HiSeq 2000 platform and processed by the RNAseqV2 pipeline, which used MapSplice for alignment and RSEM for quantification.
A robust feature selection ensemble
The proposed pseudo-variable-assisted feature ensemble procedure has two major steps: 1) aggregating the feature selection results from multiple feature selectors (Figure 1A) and 2) fitting a group Lasso model on the identified feature set with a new permutation-assisted tuning strategy (Figure 1B). In the second step, the group is defined based on the correlation structure, ensuring that features are highly correlated within each group.

Figure 1. Proposed pipeline. (A, B) Ensemble feature selection. (A) Feature selection based on different methods and aggregation of selected features. (B) Pseudo-variables assisted group lasso. (C) Prediction for real data and simulation datasets.
Aggregating the results from different feature selection approaches is a critical step in ensemble learning. The outputs of the different approaches can be various, either the subsets of selected features, the rankings of all features, or both. We applied the same scheme as in (He et al., 2022) to obtain the ranked feature set depending on the types of outputs (Figure 1A), where the final rank is an aggregation from each ranking. We assume that the observations are
Next we consider a Group Lasso model (Utazirubanda et al., 2021) on the ranked feature set (Figure 1B) for survival outcomes. For commonly seen right censored survival data,
where
Based on the partial likelihood function,
Recall that
The objective of this study is more about selecting the important features than improving the prediction accuracy. Therefore, we propose to use the pseudo-variables assisted tuning strategy (He et al., 2022) to facilitate the group-lasso tuning parameter selection. This strategy is built on the idea of combining the original and permutated input features (e.g., expressed genes), where the permutations work as a control to determine the significance of each group. Hence, we can select significantly important genes (not by chance).
It is known that the
Feature selection and machine learning algorithms
In our study, we evaluated nine different feature selection methods, including seven existing feature selection methods and two robust ensemble feature selectors we constructed. The nine selectors can be divided into four major groups: (I) feature selection algorithms based on mutual information optimization: mutual information maximization (MIM) (Torkkola, 2003), minimum redundancy maximum relevance (MRMR) (Radovic et al., 2017); and (II) random forest-based approaches: a random forest minimal depth (RF Min Depth) (Ishwaran et al., 2008; Ishwaran et al., 2011), a random forest variable importance (RF Var Imp) (Archer and Kimes, 2008), a random forest variable hunting (RF Var Hunt) (Chen and Ishwaran, 2013); and (III) Cox-based approaches: Cox hazard proportional (Cox) (Deo et al., 2021) and
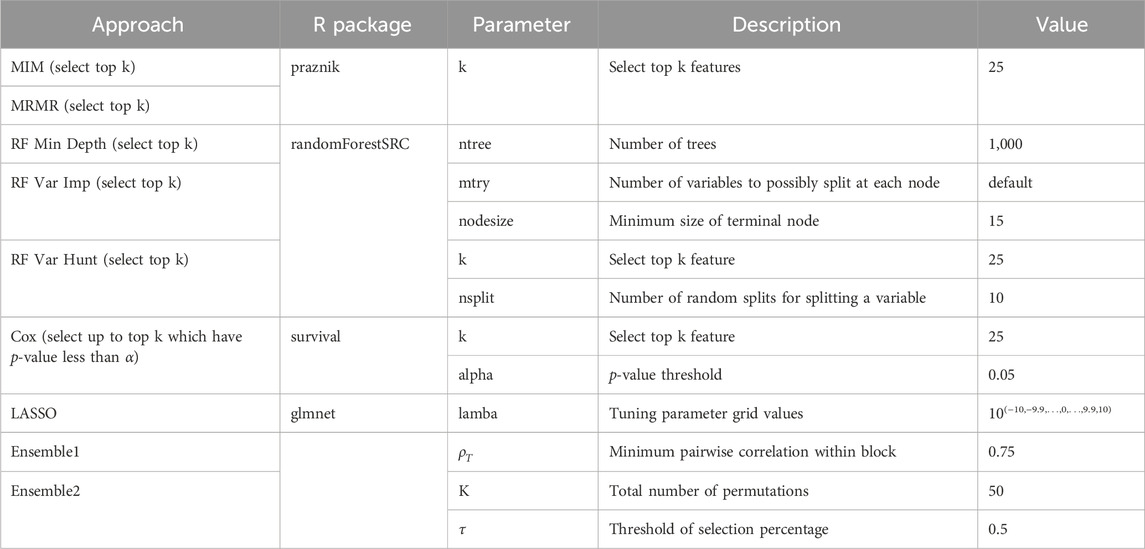
Table 1. Parameters used for feature selection methods.
To compare the results of our feature selection ensemble method with others, we tested the selected features on five well-known prediction models using machine learning and non-parametric techniques: (I) the Cox model with
Simulation
To mimic the correlation structure in real data, we conducted a simulation based on the colorectal cancer data. Considering in the real world, we usually do not often observe the causal variables directly, but rather the variables that are highly correlated with the causal variables, if any. Here we use a modified version of the simulation strategy as in (Degenhardt et al., 2019; He et al., 2022) to mimic this real-world situation. We first picked six correlated gene expression blocks from the colorectal cancer data, where each block included 6,7,8,7,8 and 9 highly correlated genes (correlation coefficient greater than 0.5) respectively (Supplementary Table S1). For each of the first three blocks, we randomly selected one of the genes as the unobserved causal variables (
In addition, we generated
To further evaluate the performance of the proposed method under more diverse scenarios, we performed additional simulations (referred as Simulation B below). Similar to Simulation A, we first generate unobserved causal variables (
where
The correlation between the base variable
We consider twelve different simulation scenarios (Table 2) including 1) different event rates (
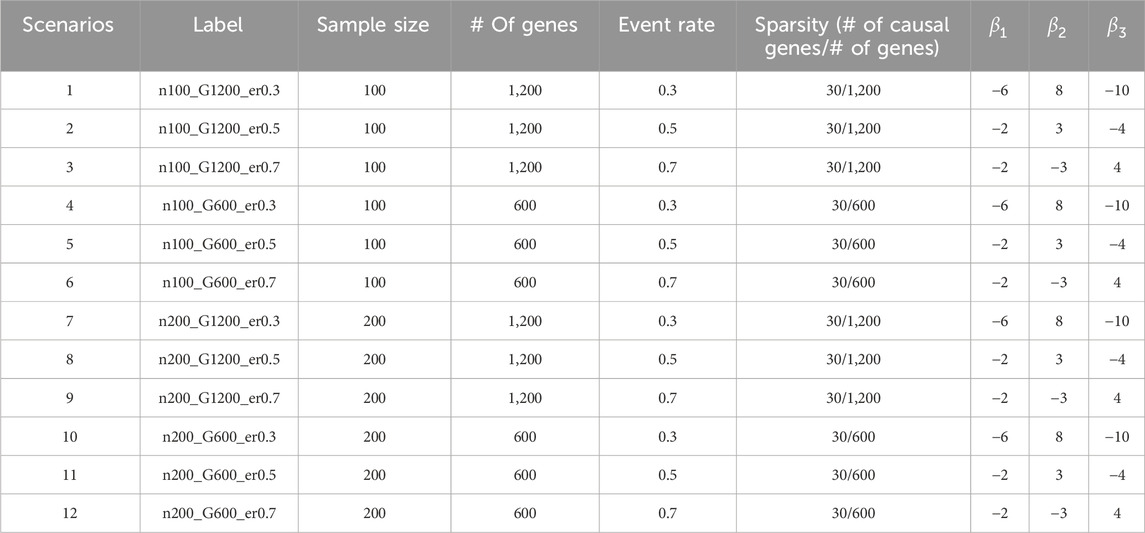
Table 2. Simulation scenario.
Model evaluation
In the real data studies, the causal variables are unknown. Moreover, due to different algorithm, we may have different lists of selected features across all methods. Therefore, to determine the important rank of features, we proposed using a weighted relative frequency (WRF) to measure the relative frequency that a feature is selected across five different folds as in (He et al., 2022). The weight of each selection is reciprocal to the number of features selected, i.e., larger set of selection adds less weight to each selected feature. A higher WRF indicates this feature is more consistently and sparsely selected across different folds.
Since the causal variables are known in simulation studies, we can evaluate the feature selection performance by comparing the selection to the truth (the known causal variables). Specifically, we used the following four commonly used metrics: false discovery rate (FDR), sensitivity, stability, F-1 score and empirical powers. FDR is the proportion of false-positive features in the selected feature set. Sensitivity is calculated as the proportion of selected causal variables among all the causal variables. Stability is calculated using Jaccard’s index: the ratio of the length of the intersection and the length of the union of two sets, where the two sets are the selections from the paired replicates. F-1 score is calculated as
Furthermore, to check the effectiveness on the predictions of our selected features compared to other well-known models, we used the Integrated Brier score (Ishwaran et al., 2008; Moradian et al., 2017) to assess the accuracy of predicted survival probabilities over a specified time period of events. Lower values of the Integrated Brier Score indicate better predictive accuracy, with 0 being the optimal score (perfect prediction) and 1 representing a model with no predictive ability. Harrell’s C-statistic, also known as the concordance index (C-index), was used to evaluate discrimination with a higher value indicating better discrimination, meaning the model is better at distinguishing between different outcomes. A C-index of 0.5 suggests that the model’s predictions are no better than random chance, while a C-index of 1.0 indicates perfect discrimination.
Results
Key features selected by the ensemble feature selection approach on a colorectal cancer (CRC) dataset
In the cohort of
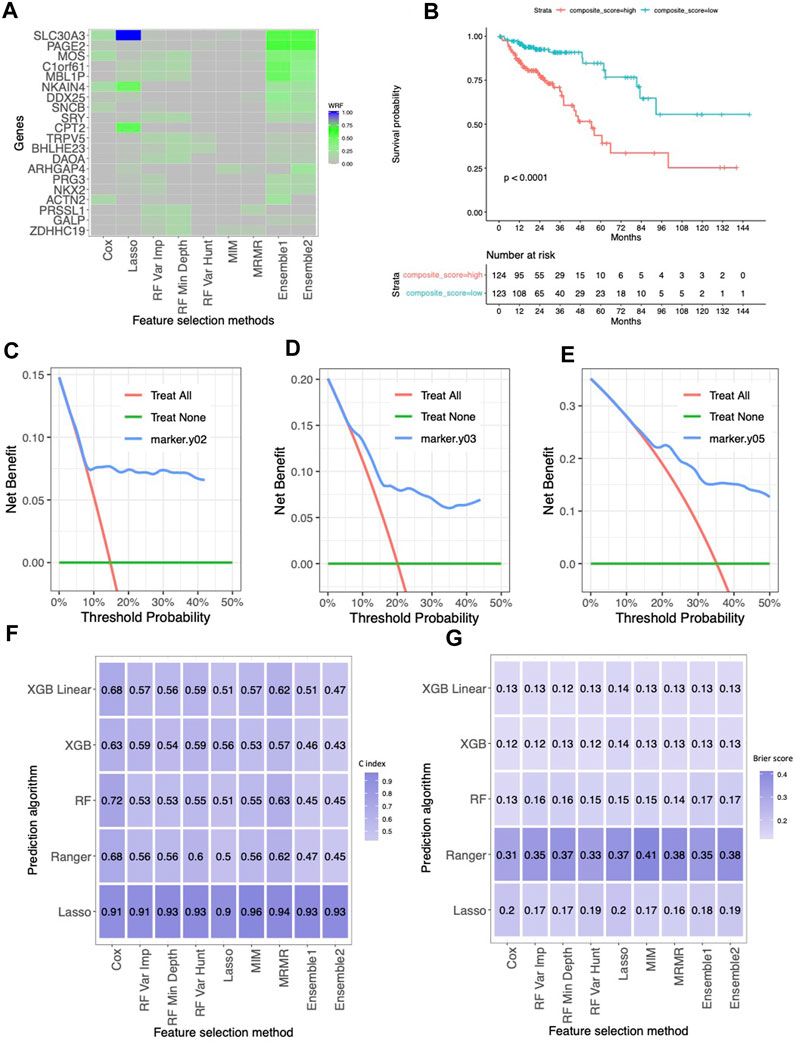
Figure 2. The results for the TCGA colorectal cancer dataset. (A) Normalized selection frequency of the top 20 selected genes by each feature selection approach. Each row represents an individual single gene, and each column represents the feature selection approaches. (B) Kaplan-Meier survival curves. The low-risk group and high-risk group were defined by median of the composite score. The composite score was calculated as the linear combination of those genes selected by ensemble approach and their coefficients in the cox proportional hazard model. (C–E) DCA of 2 year, 3 year and 5 year. (F) Heatmap of concordance index (C-index). The heatmap shows the mean value of the C-Index across 5 repeats of 5-fold cross-validation for each combination of machine learning algorithms (rows) and feature selection methods (columns). (G) Heatmap of Brier Score. The heatmap shows the mean value of the Brier Score across 5 repeats of 5-fold cross-validation for each combination of machine learning algorithms (rows) and feature selection methods (columns).
Improved performance by the ensemble feature selection approach based on simulation studies
Our ensemble approaches consistently demonstrated superior feature selection performance compared to other methods (Supplementary Figure S1A; Figure 3) with Ensemble 1 and Ensemble 2 exhibiting similar performance based on both Simulation A and Simulation B. Although the Lasso method also had low FDRs, it had the lowest sensitivity, reduced F-1 and lower stability. The random forest approaches overall showed poor performance. As expected, in general, a larger sample size (200 vs. 100) resulted in improved performance for all feature selection approaches. However, the impact of the gene sparsity of (2.5% vs. 5%) and event rates (0.3, 0.5, 0.7) on prediction performance was minimal, with slightly better performance observed at lower sparsity. In Supplementary Figure S1B; Figure 4, the empirical power of our ensemble approaches is consistently higher than or at least equivalent to that of other feature selectors across all thirteen scenarios (1 scenario for simulation A, and 12 for simulation B) for all 30 causal variables.
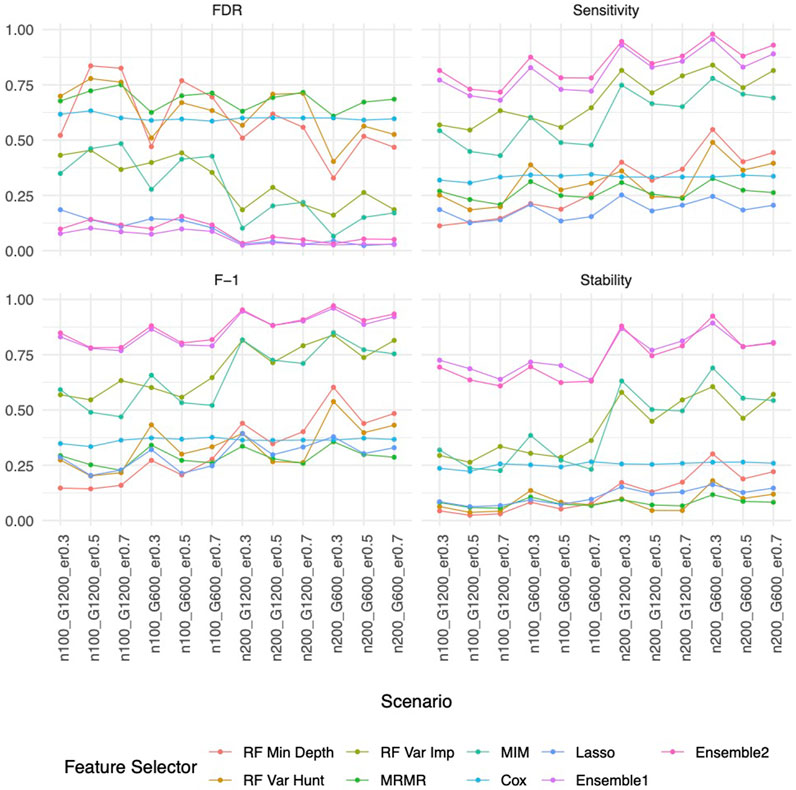
Figure 3. Feature selection performance based on Simulation B. In each panel, x-axis stands for different simulation listed in Table 1, y-axis stands for different evaluation metrics including FDR, Sensitivity, F-1 and Stability. For example, n100_G1200_eta0.3 stands for sample size is 100 with 1,200 candidate genes and the event rate is 0.5. Each colored curve stands for different feature selection approaches.
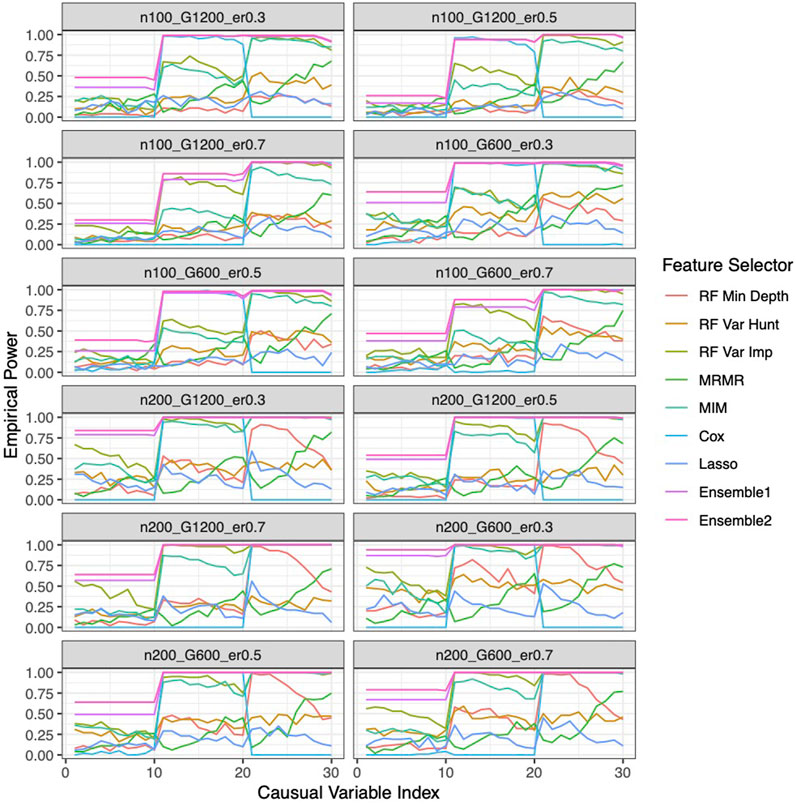
Figure 4. Empirical power of the feature selection approaches based on Simulation B. Each panel represents different simulation scenario listed in Table 1. For example, n100_G1200_eta0.3 stands for sample size is 100 with 1,200 candidate genes and the event rate is 0.5. In each panel, x-axis stands for the causal variable index.
Similar to the real data analysis, the overall impact on prediction performance is predominantly driven by the choice of prediction approaches rather than the feature selectors due to models’ bias. This observation is expected, as feature selection does not guarantee an improvement in prediction performance. Nevertheless, feature selection proves valuable by reducing the dimensionality and complexity of predictive models, leading to quicker model training times and improved convergence. Predictably, across all prediction approaches, feature selection based on the univariate Cox proportional hazards model consistently exhibited the least favorable performance, while the various selector approaches appeared quite similar. Notably, a higher event rate corresponded to larger Brier scores (Figure 5) and smaller C-index (Figure 6), indicating poorer prediction performance. A larger sample size contributed to slightly improved prediction performance in terms of Brier score and C-index. Interestingly, gene sparsity did not exert a notable impact on prediction performance. While our feature selection models may not have surpassed others in terms of accuracy measurements, we observed that they provided a stable and consistent accuracy across all measurements (as shown in Figure 5, 6; Supplementary Figures S1C, S1D). This suggests that the features we selected are significant and exhibit less bias, contributing to the reliability of our selected features. We also performed Simulation C with smaller effect sizes (Supplementary Table S2) with the same setting as Simulation B. The results (Supplementary Figures S2–S4) were consistent with all the observations mentioned above.
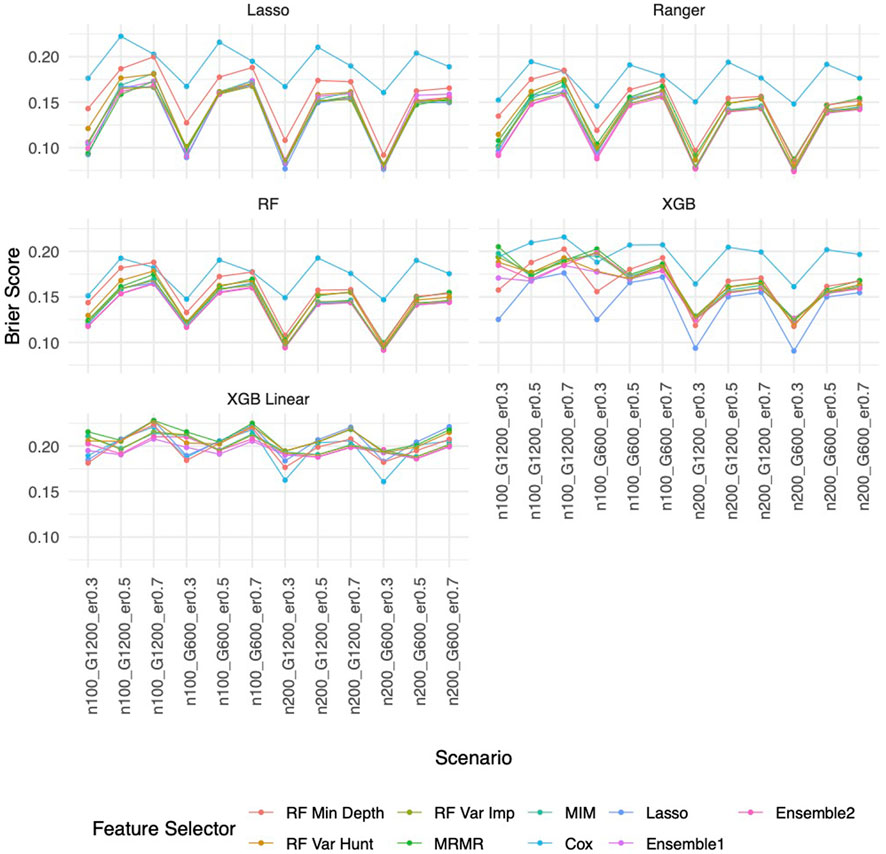
Figure 5. Brier score based on Simulation B. Panels present the Brier score for the corresponding prediction approach as indicated. In each panel, x-axis stands for different simulation scenario listed in Table 1. For example, n100_G1200_eta0.3 stands for sample size is 100 with 1,200 candidate genes and the event rate is 0.5. Each colored curve stands for different feature selection approaches.
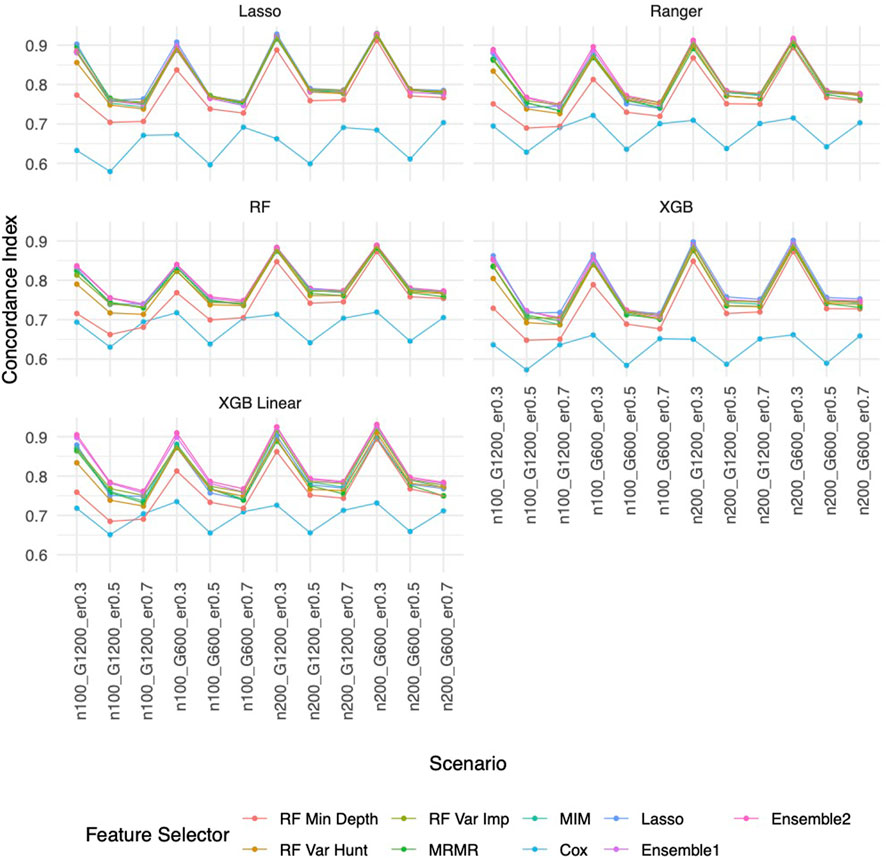
Figure 6. C-index based on Simulation B. Panels present the C-index for the corresponding prediction approach as indicated. In each panel, x-axis stands for different simulation scenario listed in Table 1. For example, n100_G1200_eta0.3 stands for sample size is 100 with 1,200 candidate genes and the event rate is 0.5. Each colored curve stands for different feature selection approaches.
Conclusion and discussion
This paper proposes a robust ensemble feature selection approach tailored explicitly for survival analysis. The ensemble feature selection approach is built on enhancing the feature selection process by combining different feature selection algorithms, ultimately improving the quality of feature selection and providing stabilized results. This is accomplished through a novel ranking algorithm integrated with a group lasso model, which is particularly advantageous when dealing with feature groups. Therefore, our proposed model is well-suited for applications in genetic data studies, where it is imperative to analyze genes as cohesive groups rather than individual entities. The proposed approach demonstrates a unique ability to select the most compelling features from top-tier models.
The key benefits of ensemble feature selections are 1) Robustness: by aggregating the results from diverse feature selection methods, the final ensemble is less likely to be influenced by the biases or limitations of a single feature selector; 2) Improved Generalization: the ensemble of multiple feature selectors, each built on a different algorithm, can lead to improved generalization and better performance on unseen data; 3) Model Agnosticism: feature selection ensembles are usually model-agnostic, meaning it is not tied to or dependent on a specific machine learning model. Instead, they can be applied across various feature selection models without favoring one over the other, making them widely applicable.
Though we only applied the proposed method to gene expression data, our method can be applied to a wide variety of data having very large number of features in genetics/genomics studies and medical research in general, such as genomic data, transcriptomic data, epigenomic data, proteomic data, clinical and phenotypical data and so on. Besides, the proposed method can smoothly take care of the correlated structure, and even utilize the natural set from certain biological knowledge such as pathway. Moreover, ensemble feature selection can be applied to different response variable, including quantitative, qualitative and time-to-event responses. Although the prediction gain is incremental, the benefits of feature selection are still significant. Firstly, it can enhance the interpretability particularly in the biomedical field and aims the discovery of meaning biological insights. Secondly, it can greatly improve the computational efficiency of downstream analysis, making it more feasible to handle large-scale data sets. Thirdly, it can help filter out irrelevant noise variable, avoid overfitting and enhance the reliability of the analyses.
Data availability statement
Publicly available datasets were analyzed in this study. This data can be found here: https://portal.gdc.cancer.gov/projects/TCGA-COAD.
Ethics statement
The studies involving humans were approved by the Institutional Review Boards or Ethics Committees of the participating centers. The studies were conducted in accordance with the local legislation and institutional requirements. The participants provided their written informed consent to participate in this study.
Author contributions
PL: Formal Analysis, Investigation, Software, Visualization, Writing–original draft, Writing–review and editing. XG: Formal Analysis, Investigation, Software, Visualization, Writing–review and editing. LU: Formal Analysis, Investigation, Software, Visualization, Writing–review and editing. HY: Data curation, Investigation, Writing–review and editing. BK: Data curation, Investigation, Writing–review and editing. LZ: Conceptualization, Data curation, Formal Analysis, Funding acquisition, Investigation, Methodology, Project administration, Resources, Software, Supervision, Visualization, Writing–original draft, Writing–review and editing. TH: Conceptualization, Formal Analysis, Funding acquisition, Investigation, Methodology, Project administration, Resources, Software, Supervision, Validation, Visualization, Writing–original draft, Writing–review and editing.
Funding
The author(s) declare that financial support was received for the research, authorship, and/or publication of this article. PL, XG, LU, YH, BK, LZ, and TH are partially supported by National Cancer Institute, National Institutes of Health, through grant number R21CA264381. PL, LU, YH, BK, LZ, and TH are partially supported by the National Library of Medicine, National Institutes of Health, through grant number R01LM013763-01A1. TH and LU are partially supported by National Science Foundation through grant number DMS-2137983. BK is supported by Helen Diller Family Comprehensive Cancer Center Cancer Physician Scholar Program in Clinical Oncology (PSPCO) Career Development Award (1K12CA260225-01).
Conflict of interest
The authors declare that the research was conducted in the absence of any commercial or financial relationships that could be construed as a potential conflict of interest.
The author(s) declared that they were an editorial board member of Frontiers, at the time of submission. This had no impact on the peer review process and the final decision.
Publisher’s note
All claims expressed in this article are solely those of the authors and do not necessarily represent those of their affiliated organizations, or those of the publisher, the editors and the reviewers. Any product that may be evaluated in this article, or claim that may be made by its manufacturer, is not guaranteed or endorsed by the publisher.
Supplementary material
The Supplementary Material for this article can be found online at: https://www.frontiersin.org/articles/10.3389/fsysb.2024.1355595/full#supplementary-material
References
Archer, K. J., and Kimes, R. V. (2008). Empirical characterization of random forest variable importance measures. Comput. Statistics Data Analysis 52 (4), 2249–2260. doi:10.1016/j.csda.2007.08.015
Binder, H. (2015). R package “CoxBoost”. Available from: https://github.com/binderh/CoxBoost.
Cerami, E., Gao, J., Dogrusoz, U., Gross, B. E., Sumer, S. O., Aksoy, B. A., et al. (2012). The cBio cancer genomics portal: an open platform for exploring multidimensional cancer genomics data. Cancer Discov. 2 (5), 401–404. doi:10.1158/2159-8290.CD-12-0095
Chen, T., and Guestrin, C. (2016). “XGBoost: a scalable tree boosting system,” in Proceedings of the 22nd ACM SIGKDD International Conference on Knowledge Discovery and Data Mining, San Francisco, CA, USA, August 13-17, 2016 (San Francisco California USA: ACM), 785–794. doi:10.1145/2939672.2939785
Chen, X., and Ishwaran, H. (2013). Pathway hunting by random survival forests. Bioinformatics 29 (1), 99–105. doi:10.1093/bioinformatics/bts643
Cui, J., Guo, F., Yu, Y., Ma, Z., Hong, Y., Su, J., et al. (2022). Development and validation of a prognostic 9-gene signature for colorectal cancer. Front. Oncol. 12, 1009698. doi:10.3389/fonc.2022.1009698
Degenhardt, F., Seifert, S., and Szymczak, S. (2019). Evaluation of variable selection methods for random forests and omics data sets. Briefings Bioinforma. 20 (2), 492–503. doi:10.1093/bib/bbx124
Deo, S. V., Deo, V., and Sundaram, V. (2021). Survival analysis—part 2: cox proportional hazards model. Indian J. Thorac. Cardiovasc Surg. 37 (2), 229–233. doi:10.1007/s12055-020-01108-7
Friedman, J., Hastie, T., and Tibshirani, R. (2010). Regularization paths for generalized linear models via coordinate descent. J. Stat. Softw. 33 (1), 1–22. doi:10.18637/jss.v033.i01
Fu, H., Han, S., and Yan, J. (2022). Reda R package. Available from: https://github.com/wenjie2wang/reda.
Goeman, J. J. (2010). L1 penalized estimation in the cox proportional hazards model. Biom. J. 52 (1), 70–84. doi:10.1002/bimj.200900028
He, T., Baik, J. M., Kato, C., Yang, H., Fan, Z., Cham, J., et al. (2022). Novel ensemble feature selection approach and application in repertoire sequencing data. Front. Genet. 13, 821832. 821832. doi:10.3389/fgene.2022.821832
Hu, T., Chitnis, N., Monos, D., and Dinh, A. (2021). Next-generation sequencing technologies: an overview. Hum. Immunol. 82 (11), 801–811. doi:10.1016/j.humimm.2021.02.012
Ishwaran, H., Kogalur, U. B., Blackstone, E. H., and Lauer, M. S. (2008). Random survival forests. Ann. Appl. Stat. 2 (3). doi:10.1214/08-aoas169
Ishwaran, H., Kogalur, U. B., Chen, X., and Minn, A. J. (2011). Random survival forests for high-dimensional data. Stat. Anal. 4 (1), 115–132. doi:10.1002/sam.10103
Klein, J. P., and Goel, P. K. (1992). “Survival analysis: state of the art,” in NATO ASI series. Series E, Applied sciences Editors J. P. Klein, and P. K. Goel (Dordrecht ; Boston: Kluwer Academic Publishers), 451.
Lau, J. W., Lehnert, E., Sethi, A., Malhotra, R., Kaushik, G., Onder, Z., et al. (2017). The cancer genomics Cloud: collaborative, reproducible, and democratized—a new paradigm in large-scale computational research. Cancer Res. 77 (21), e3–e6. doi:10.1158/0008-5472.CAN-17-0387
Li, J., Cheng, K., Wang, S., Morstatter, F., Trevino, R. P., Tang, J., et al. (2018). Feature selection: a data perspective. ACM Comput. Surv. 50 (6), 1–45. doi:10.1145/3136625
Lin, H. M., Chatterjee, A., Lin, Y. H., Anjomshoaa, A., Fukuzawa, R., McCall, J., et al. (2007). Genome wide expression profiling identifies genes associated with colorectal liver metastasis. Oncol. Rep. 17, 1541–1549. doi:10.3892/or.17.6.1541
Moradian, H., Larocque, D., and Bellavance, F. (2017). L₁ splitting rules in survival forests. Lifetime Data Anal. 23 (4), 671–691. doi:10.1007/s10985-016-9372-1
Munson, M. A., and Caruana, R. (2009). “On feature selection, bias-variance, and bagging,” in Machine learning and knowledge discovery in databases Editors W. Buntine, M. Grobelnik, D. Mladenić, and J. Shawe-Taylor (Berlin, Heidelberg: Springer Berlin Heidelberg), 144–159. (Lecture Notes in Computer Science; vol. 5782). Available from: http://link.springer.com/10.1007/978-3-642-04174-7_10.
Neums, L., Meier, R., Koestler, D. C., and Thompson, J. A. (2019). “Improving survival prediction using a novel feature selection and feature reduction framework based on the integration of clinical and molecular data,” in Biocomputing 2020 (Kohala Coast, Hawaii, USA: World Scientific), 415–426. doi:10.1142/9789811215636_0037
Peng, J., Peng, J., Wang, R., Liu, C., and Wang, Z. (2021). Expression of MOS gene and its correlations with clinicopathological features and prognosis of patients with colorectal cancer. Chin. General Pract. 24 (24), 3077. doi:10.12114/j.issn.1007-9572.2021.00.434
Radovic, M., Ghalwash, M., Filipovic, N., and Obradovic, Z. (2017). Minimum redundancy maximum relevance feature selection approach for temporal gene expression data. BMC Bioinforma. 18 (1), 9. doi:10.1186/s12859-016-1423-9
Segal, M. (2004). Machine learning benchmarks and random forest regression. UCSF: Center for Bioinformatics and Molecular Biostatistics. Available at: https://escholarship.org/uc/item/35x3v9t4
The Cancer Genome Atlas Network (2012). Comprehensive molecular characterization of human colon and rectal cancer. Nature 487 (7407), 330–337. doi:10.1038/nature11252
Torkkola, K. (2003). Feature extraction by non-parametric mutual information maximization. J. Mach. Learn. Res. 3, 1415–1438. Mar.
Utazirubanda, J. C., León T, M., and Ngom, P. (2021). Variable selection with group LASSO approach: application to Cox regression with frailty model. Commun. Statistics - Simul. Comput. 50 (3), 881–901. doi:10.1080/03610918.2019.1571605
Wright, M. N., and ranger, Z. A. (2017). A fast implementation of random forests for high dimensional data in C++ and R. J. Stat. Soft 77 (1). doi:10.18637/jss.v077.i01
Yang, Q., Khoury, M. J., Friedman, J., Little, J., and Flanders, W. D. (2005). How many genes underlie the occurrence of common complex diseases in the population? Int. J. Epidemiol. 34 (5), 1129–1137. doi:10.1093/ije/dyi130
Yilmaz-Ozcan, S., Sade, A., Kucukkaraduman, B., Kaygusuz, Y., Senses, K. M., Banerjee, S., et al. (2014). Epigenetic mechanisms underlying the dynamic expression of cancer-testis genes, PAGE2, -2B and SPANX-B, during mesenchymal-to-epithelial transition. PLoS ONE 9(9), e107905. doi:10.1371/journal.pone.0107905
Yin, Z., Yan, X., Wang, Q., Deng, Z., Tang, K., Cao, Z., et al. (2020). Detecting prognosis risk biomarkers for colon cancer through multi-omics-based prognostic analysis and target regulation simulation modeling. Front. Genet. 11, 524. doi:10.3389/fgene.2020.00524
Zheng, Y., Zhou, J., and Tong, Y. (2015). Gene signatures of drug resistance predict patient survival in colorectal cancer. Pharmacogenomics J. 15 (2), 135–143. doi:10.1038/tpj.2014.45
Keywords: colorectal cancer, ensemble feature selection, high-dimensional data, time-to-event outcome, pseudo variables, group lasso
Citation: Le P, Gong X, Ung L, Yang H, Keenan BP, Zhang L and He T (2024) A robust ensemble feature selection approach to prioritize genes associated with survival outcome in high-dimensional gene expression data. Front. Syst. Biol. 4:1355595. doi: 10.3389/fsysb.2024.1355595
Received: 14 December 2023; Accepted: 05 March 2024;
Published: 21 March 2024.
Edited by:
Rongling Wu, The Pennsylvania State University (PSU), United StatesReviewed by:
Xiaoxi Shen, Texas State University, United StatesLuis Diambra, National University of La Plata, Argentina
Copyright © 2024 Le, Gong, Ung, Yang, Keenan, Zhang and He. This is an open-access article distributed under the terms of the Creative Commons Attribution License (CC BY). The use, distribution or reproduction in other forums is permitted, provided the original author(s) and the copyright owner(s) are credited and that the original publication in this journal is cited, in accordance with accepted academic practice. No use, distribution or reproduction is permitted which does not comply with these terms.
*Correspondence: Li Zhang, bGkuemhhbmdAdWNzZi5lZHU=; Tao He, aGV0YW9Ac2ZzdS5lZHU=
†These authors share senior authorship