Abstract
Losartan is a selective angiotensin II AT1-receptor antagonist for the treatment of arterial hypertension and heart failure. It is converted to a pharmacologically active metabolite carboxylosartan (E-3174) in the liver mainly by CYP2C9 enzyme, a member of the cytochrome P450 superfamily. The gene encoding this protein is highly polymorphic: numerous single nucleotide polymorphisms that alter the enzyme function have been described in the literature. The most widespread CYP2C9 alleles are CYP2C9*1 (wild-type), CYP2C9*2, and CYP2C9*3. Here we performed mathematical modeling of the metabolism of orally administered losartan to E-3174 taking into account combinations of the most common CYP2C9 alleles. Next, using the previously created model of the human cardiovascular and renal systems, we demonstrated that the blood pressure response to losartan therapy in a cohort of virtual hypertensive patients depended on CYP2C9 allelic variants. Individuals with the CYP2C9*1/CYP2C9*1 genotype responded better to treatment than patients carrying CYP2C9*2 or CYP2C9*3 alleles. The results of the modeling can potentially be used for personalization of drug therapy for arterial hypertension.
1 Introduction
Cytochrome P450 (CYP) is a superfamily of enzymes that catalyze oxidative biotransformation of many drugs and other lipophilic compounds (Nelson, 2006). Most of the genes of this superfamily in humans are grouped into 18 families and 44 subfamilies and perform specific endogenous functions, including the biosynthesis of steroid hormones, prostaglandins, bile acids and other compounds (Nebert and Russell, 2002). However, only some of these genes (from the CYP1, 2, and 3 families) are involved in an oxidative drug metabolism. CYP2C is a subfamily of the CYP2 family that contains four genes: CYP2C8, CYP2C9, CYP2C18, and CYP2C19 (Takahashi and Echizen, 2001). Among them, CYP2C9 is a major gene, which accounts for about 20% of total liver microsomal proteins and metabolizes approximately 13%–17% of all clinical drugs, including S-warfarin, phenytoin, tolbutamide, glipizide, glyburide, torsemide, losartan, etc. (Miners and Birkett, 1998; Zanger et al., 2008; Zanger and Schwab, 2013).
The CYP2C9 gene, located on chromosome 10q24 (Gray et al., 1995, p. 2), spans about 55 kb with 9 exons (GenBank accession numbers: L16877 to L16883) and encodes a protein of 490 amino acid residues, weighing 55.5 KDa1. Many single nucleotide polymorphisms (SNPs) were identified in CYP2C9, making it highly polymorphic (Lee et al., 2002). To date, 85 allelic variants of CYP2C9 with different catalityc activity have been annotated2.
The wild-type CYP2C9 allele is designated as CYP2C9*1. A cytosine to thymine transversion at nucleotide 430 encodes for an arginine to cysteine replacement at amino acid residue 144 (Arg144Cys), producing the CYP2C9*2 variant allele (Ged et al., 1988; Stubbins et al., 1996). CYP2C9*3 denotes a gene with an adenine to cytosine transversion in the seventh exon at 1,075 nucleotide (A1075C), encoding an isoleucine to leucine replacement at amino acid residue 359 (Ile359Leu) (Sullivan-Klose et al., 1996) (Table 1). These two alleles are the most common variants with a reduced activity and their frequency greatly varies among ethnic groups (Figure 1) (Table 2). Along with these two alleles, there are other alleles found in different populations. For example, about 2% of the Chinese population are carriers of the CYP2C9*13 allele (Si et al., 2004) while some rare CYP2C9 alleles, such as CYP2C9*5, CYP2C9*6, CYP2C9*8, CYP2C9*9, and CYP2C9*11, are presented only in Africans (Zhou et al., 2017).
TABLE 1
| Allele name | rsID | Nucleotide substitution | Position of the substitution | Amino acid substitution |
|---|---|---|---|---|
| CYP2C9*2 | rs1799853 | C430T | 3 exon | Arg144Cys |
| CYP2C9*3 | rs1057910 | A1075C | 7 exon | Ile359Leu |
Characteristics of CYP2C9*2 and CYP2C9*3 alleles.
rsID (reference SNP, cluster ID), unique number of the single nucleotide polymorphism.
FIGURE 1
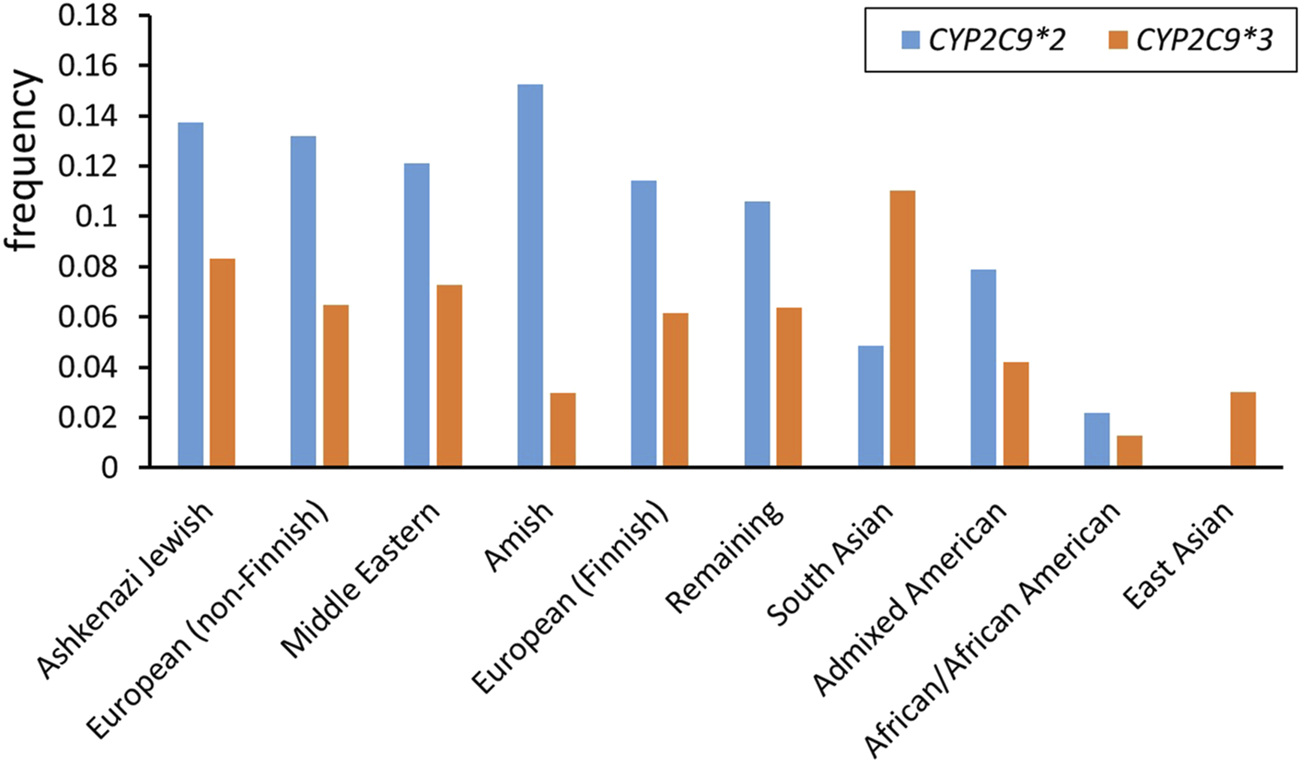
CYP2C9*2 and CYP2C9*3 allele frequencies among different ethnicities (data from gnomAD v4.1.0)3.
TABLE 2
| Ethnicity | CYP2C9*2 | CYP2C9*3 |
|---|---|---|
| Ashkenazi Jewish | 0.1375 | 0.0832 |
| European (non-Finnish) | 0.1319 | 0.0649 |
| Middle Eastern | 0.1212 | 0.0728 |
| Amish | 0.1524 | 0.0296 |
| European (Finnish) | 0.1142 | 0.0616 |
| Remaining | 0.1061 | 0.0639 |
| South Asian | 0.0485 | 0.1101 |
| Admixed American | 0.0787 | 0.0420 |
| African/African American | 0.0217 | 0.0126 |
| East Asian | 0.0002 | 0.0302 |
CYP2C9*2 and CYP2C9*3 allele frequencies in different ethnicities.
Data from gnomAD v4.1.0.
As mentioned above, losartan is one of the drugs that is metabolized by CYP2C9. However, in vitro data demonstrate that not only CYP2C9 but also CYP3A4 is involved in the biotransformation of this compound (McCrea et al., 1999; Stearns et al., 1995). Numerous clinical trials have been conducted to determine the contribution of both enzymes to losartan metabolism. CYP3A4 inhibitors such as itraconazole (Kaukonen et al., 1998), erythromycin (Williamson et al., 1998) and cimetidine (Goldberg et al., 1995) have been shown to have no significant effect on the pharmacokinetics of losartan in vivo. At the same time, bucolome (Kobayashi et al., 2008) and amodiaquine (Wennerholm et al., 2006), which have been reported to inhibit CYP2C9-mediated reactions, significantly affect the metabolism of losartan. Thus, the CYP2C9 is the major enzyme responsible for the oxidation of this drug.
Losartan is a selective angiotensin II type 1 (AT1) receptor antagonist used in the treatment of arterial hypertension (Timmermans et al., 1993). Losartan is converted to carboxylosartan (E-3174) via a carbonyl intermediate (E-3179) (Stearns et al., 1995; U et al., 2001; Yun et al., 1995). E-3174 is thought to be responsible for the main pharmacological effect, as it has 10–40 times greater AT1-receptor blocking activity than losartan and also has a longer half-life (Lo et al., 1995). Expression of CYP2C9*2 and CYP2C9*3 alleles has been shown to significantly alter the pharmacokinetics of losartan and E-3174 in vitro and in vivo (U et al., 2001; Yasar et al., 2002).
Previously, Eleni Karatza and Vangelis Karalis developed a four-compartment pharmacokinetic model that describes the disposition of losartan and E-3174 (Karatza and Karalis, 2020). The main objective of their work was to create a model describing the secondary maxima observed in the plasma concentration-time profiles of losartan and E-3174. Their model incorporates a sinusoidal equation which illustrates open-close cycles of gastric pyloric valve. However, the model does not include genetic factors, such as different CYP2C9 activity. Therefore, the primary aim of the present study was to modify this model not only to predict plasma concentration of losartan and its metabolite but also to consider the CYP2C9 genotype of individual patients (Babaev et al., 2024).
The secondary aim of the study was to use the previously created mechanistic cardiorenal model (Kutumova et al., 2022; Kutumova et al., 2021) to examine the blood pressure response to losartan therapy depending on the CYP2C9 genotype. Apart from physiological processes such as blood circulation and the cardiac cycle, neurohumoral regulation, blood-tissue oxygen exchange, the renin-angiotensin-aldosterone system (RAAS), renal microcirculation and sodium transport across the nephron, renal sympathetic nerve activity, and regulation of water-sodium balance, this model also incorporates the therapeutic effects of various antihypertensive agents, including the direct renin inhibitor aliskiren, the ACE inhibitor enalapril, the angiotensin II receptor blocker losartan, the β-blocker bisoprolol, the calcium channel blocker amlodipine, and the thiazide diuretic hydrochlorothiazide. The model has previously been used to study the association between ACE I/D genotypes and the blood pressure response to treatment with RAAS inhibitors, primarily enalapril (Kutumova et al., 2024). Here we applied this model to conduct in silico studies in a population of virtual hypertensive patients with different allelic variants of CYP2C9. Accumulating the results on modeling the influence of various genetic factors on the arterial pressure regulation may further allow us to study their cross-influence on the development and treatment of arterial hypertension.
2 Material and methods
2.1 Mathematical model of losartan metabolism
The original model (Karatza and Karalis, 2020) was reproduced in the BioUML4 software (Kolpakov et al., 2022; Kolpakov et al., 2019) using SBML format for technical representation (Keating et al., 2020) and SBGN format for visualization (Gambardella et al., 2009) (Figure 2).
FIGURE 2
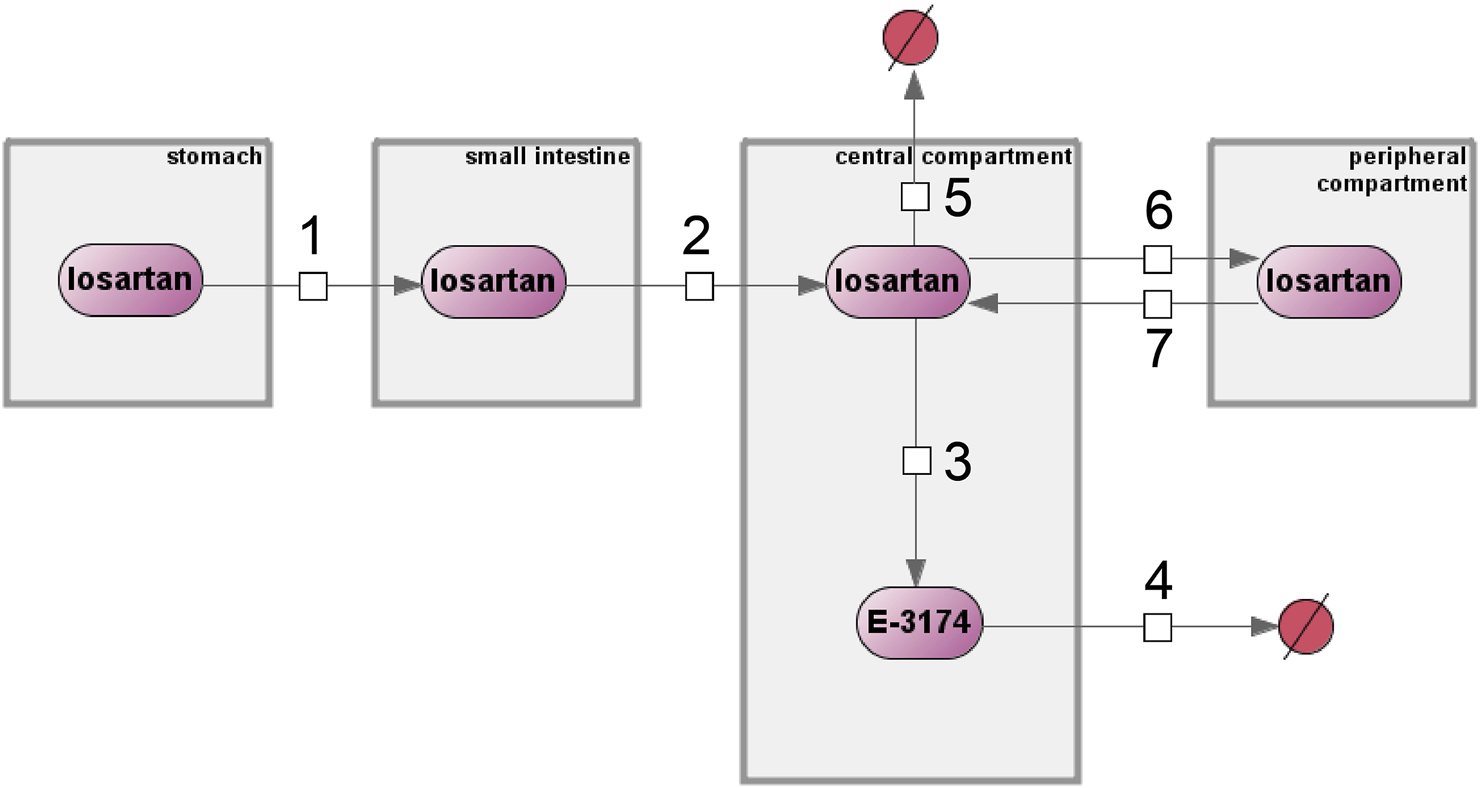
Original computational model of losartan metabolism by Eleni Karatza and Vangelis Karalis implemented in the BioUML software. Numbers 1 through 7 denote reactions, compartments are shown as gray rectangles, purple ovals represent chemical compounds, and excreted substances are shown as crossed-out red circles.
The model includes four compartments: stomach, small intestine, central, and peripheral compartments. These compartments contain two substances, losartan and E-3174, which are interconnected through first-order reaction equations (numbers 1 through 7 in Figure 2). A detailed description of all equations and variables is given in Supplementary Tables S1, S2, respectively.
The model also includes discrete events, initial assignments, and algebraic and differential equations used to solve the model. The list of mathematical tools and variables can be found in Supplementary Tables S3, S4, respectively.
The pharmacokinetics of losartan were assessed by calculating the following parameters: area under the concentration-time curve (AUC) for losartan (AUClosartan) and its metabolite (AUCE-3174), AUClosartan to AUCE-3174 ratio (AUCratio), maximum plasma concentration (Cmax), time to reach Cmax (tmax), and terminal elimination half-life (t1/2) (Table 3).
TABLE 3
| Pharmacokinetic parameter | Description |
|---|---|
| AUC | The area under the concentration-time curve (nmol∗h/L) |
| AUCratio | AUClosartan to AUCE-3174 ratio (unitless) |
| Cmax | The maximum plasma concentration (nM) |
| t1/2 | The terminal elimination half-life (h) |
| tmax | The time at which Cmax occurred (h) |
Pharmacokinetic parameters of the model and their description.
Cmax and tmax were derived from the model simulation results. AUClosartan and AUCE-3174 were calculated using the differential equations:where Cp and Cm denote concentrations of losartan and E-3174, respectively.
Since the model was implemented using delay differential equations in the conversion of losartan to E-3174, the concentration of E-3174 in the first numerical steps of the simulation is zero. Consequently, the AUCE-3174 value is also zero. Therefore, a piecewise function was used to calculate AUCratio:
The t1/2 value was calculated by linear regression analysis from the terminal linear part of the plasma concentration versus time semilogarithmic plot according to the following equation:where C1 and C2 are the concentrations of the corresponding substance at times t1 and t2, respectively, according to the linear regression line (Toutain and Bousquet-Mélou, 2004).
2.2 Mathematical model of the human cardiovascular and renal systems
To test the losartan metabolism model in a population of virtual patients with different CYP2C9 genotypes, we used the computational model of the human cardiovascular and renal systems that, in particular, simulates the pharmacological effects of losartan on cardiovascular and renal parameters (Kutumova et al., 2022; Kutumova et al., 2021). The model is discrete-continuous and consists of a system of ordinary differential equations with several discrete events corresponding to instantaneous changes in the modeled dynamics (e.g., the transition from systole to diastole). This model is available in the BioModels database (Malik-Sheriff et al., 2020) with ID MODEL22021600015.
A virtual patient is a single equilibrium parameterization of the model within physiological limits. In the current work, we used 100 virtual hypertensive patients from our previous study on antihypertensive therapy modeling (Kutumova et al., 2022).
2.3 Modeling the impact of CYP2C9 genetic variants on losartan treatment response
To simulate treatment of virtual patients with losartan, we used the following equation from the cardiorenal model (Kutumova et al., 2022), which reduces the rate of angiotensin II binding to AT1-receptors:where ARB (angiotensin receptor blocking effect) is the AT1-receptor blocking activity of the drug, Losartantreatment is a discrete parameter that can take values of 0 (no treatment) or 1 (treatment course), and kblock is the total AT1-receptor blocking activity of losartan across CYP2C9 genotypes.
The value of the parameter kblock is fed into the cardiorenal model from the losartan metabolism model and depends on the CYP2C9 allelic variant. Parameter values for the different CYP2C9 genotypes were estimated using the following considerations. Losartan 25 mg orally once daily has not been shown to produce clinically significant reductions in blood pressure compared with placebo (Gradman et al., 1995). A similar effect in the cardiorenal model is given by kblock = 0.1. In addition, for daily doses of 50 and 100 mg losartan, kblock values were estimated to be 0.886 and 0.954 (Kutumova et al., 2022). Using these doses in the pharmacokinetic model with parameters fitted to the CYP2C9∗1/CYP2C9∗1 genotype (wild-type), we calculated the corresponding AUCE-3174 values. Thus, we received three relationship points between kblock values and corresponding AUCE-3174 values (Supplementary Table S5).
To describe this dependence, we used the following E-max model (Kirby et al., 2011):
The coefficients of the fitted E-max model are presented in Supplementary Table S6. Finally, using this equation, we extended the relationship between kblock and AUCE-3174 values to any values of AUCE-3174, i.e., for any CYP2C9 allelic variant (Table 4) (Supplementary Figure S1).
TABLE 4
| Genotype | AUCE-3174 (nmol*h/L) | k block (unitless) |
|---|---|---|
| CYP2C9*1/CYP2C9*1 | 3996.6 | 0.886 |
| CYP2C9*2/CYP2C9*2 | 3640.5 | 0.833 |
| CYP2C9*3/CYP2C9*3 | 247.9 | 0.000 |
| CYP2C9*1/CYP2C9*2 | 3833.3 | 0.866 |
| CYP2C9*1/CYP2C9*3 | 3003.0 | 0.620 |
| CYP2C9*2/CYP2C9*3 | 2628.8 | 0.410 |
Correspondence between AUCE-3174 and kblock values for CYP2C9 genotypes.
2.4 Numerical solution of the models
To simulate the models, we used a version of the CVODE solver (Hindmarsh et al., 2004) ported to Java and adapted to the BioUML software interface.
CVODE solves initial-value problems for systems of ordinary differential equations in real N-space. It is used to solve both stiff and non-stiff systems by variable-order and variable-step multistep methods. CVODE contains two groups of multistep formulas that are suitable for different systems. For non-stiff problems, CVODE includes the Adams-Moulton formulas, and for stiff problems, the backward differentiation formulas. The coefficients for these methods are determined based on the method type, its order, the recent history of step sizes, and the normalization αn,0 = −1.
2.5 Parameter estimation
To solve the inverse problem of identifying model parameters based on experimentally measured variables, nonlinear optimization methods were used.
This problem was solved by finding the minimum of the objective function, which was calculated by summing the squares of the distances from the experimental points to the points predicted by the model. If the problem required additional constraints imposed on some variables of the model, a penalty function was used to assess their feasibility.
BioUML contains the following optimization methods:
1. Stochastic Ranking Evolutionary Strategy (SRES) (Runarsson et al., 2000),
2. DIRECT algorithm (Jones, 2009),
3. Quadratic Hill-climbing (Goldfeld et al., 1966),
4. Multi-objective particle swarm optimization (MOPSO) (Sierra and Coello, 2005),
5. Multi-objective cellular genetic algorithm (MOCell) (Nebro et al., 2009),
6. Adaptive simulated annealing (ASA) (Ingber, 1996).
Three of these methods (SRES, MOPSO and MOCell) were most suitable for our task. We compared the optimization results of these methods for our problem and found that they differed by no more than 5%. Therefore, we arbitrarily selected one of them (SRES) for further calculations.
2.6 Parameter identifiability
After estimating the model parameters based on experimental data, it is important to understand how accurately these parameters have been estimated in terms of the quantity and quality of the data. This understanding is necessary for further investigation of model predictions and can be provided by analyzing the parameters for identifiability (Raue et al., 2010; Raue et al., 2009). To study the sensitivity of the objective function to changes in a fitting parameter, we exclude it from the optimization process with a fixed value that gradually increases and then decreases compared to the optimal solution. In this way, we determine the influence of this parameter on the value of the objective function (i.e., the quality of the experimental data approximation). If the shift of the parameter in any direction along the numerical axis leads to a significant increase in the objective function, then it is identifiable. If a significant increase in the objective function occurs when moving in only one direction, then the parameter is partially identifiable. Otherwise, it is impossible to determine the parameter based on the available experimental data, that is, it is unidentifiable.
2.7 Digitizing of plots
To train the losartan metabolism model, we needed experimental plasma concentrations of the drug and its active metabolite in individuals with homozygous CYP2C9 genotypes (CYP2C9*1/CYP2C9*1, CYP2C9*2/CYP2C9*2, and CYP2C9*3/CYP2C9*3). We were able to find only one article with the time courses of these concentrations after a single oral dose of 50 mg losartan potassium for all the above genotypes (Yasar et al., 2002).
To digitize this data from the figures in the original study, we used Plotdigitizer6 software. In analyzing the data, we decided not to use the first losartan point of the concentration-time curve from the CYP2C9*2/CYP2C9*2 plot because immediately after drug administration (time = 0), the concentration of losartan was 860 nM, which means that the absorption of the drug occurred instantly and is unlikely since it takes some time to get from the stomach to the small intestine and then into the blood. In addition, the maximum concentration values of losartan and E-3174 in the figures were replaced with the tabulated values of Cmax for the corresponding genotypes from the same study to obtain more plausible results. The results of data digitizing are presented in Supplementary Table S7.
2.8 Software
To develop and analyze the model, we used the BioUML software (version 2023.3), a Java-based integrated environment for the modeling of different biological systems (Kolpakov et al., 2022; Kolpakov et al., 2019).
3 Results
3.1 Estimation of CYP2C9 activity for homozygous CYP2C9 genotypes
The original model of losartan pharmacokinetics was validated using experimental data on the time-dependent plasma concentrations of losartan and its metabolite after a single oral dose of 100 mg losartan potassium (Figure 2) (Karatza and Karalis, 2020). At the same time, in the clinical study of individuals with different genotypes of CYP2C9, which plays a major role in the metabolism of the drug, a dosage of 50 mg was used (Yasar et al., 2002). Directly changing the drug dosage from 100 to 50 mg in the model showed a significant discrepancy between the experimental data and the model predictions (Supplementary Figure S2). Furthermore, the original model did not take into account the different CYP2C9 activities. Thus, to refine the model to incorporate CYP2C9 genetic factors, it was necessary to recalibrate its parameters.
By analyzing the list of these parameters (Supplementary Table S2), we came to the conclusion that the value of the parameter b in the sinusoidal equation (number 1 in Figure 2), which describes the periodic opening and closing of the pyloric valve of the stomach (Supplementary Table S1), has a physiological justification. It consists in the fact that the cycle of the migrating motor complex (a regular pattern of gastric motility during fasting) (Deloose et al., 2012) varies on average from 85 to 115 min (Feher, 2017), and at b = 3.95 (the value in the original model), the resulting period falls within this time interval.
In addition, the parameter km from reaction 3 in Figure 2 is a first-order kinetic constant characterizing the rate of conversion of losartan to E-3174, i.e., the activity of CYP2C9. Therefore, we estimated the unique value of this parameter for each of the three homozygous genotypes.
The final km values for each genotype are presented below:
The optimized values of all other parameters are listed in Supplementary Table S8.
The time-dependent concentrations of losartan and E-3174 after a single oral dose of 50 mg losartan potassium for three CYP2C9 homozygotes predicted by the model after parameter redefinition, as well as experimentally obtained data for individuals with the same genotypes (Yasar et al., 2002), are shown in Figure 3. Because the concentration of losartan was significantly higher than the concentration of its metabolite for CYP2C9*3/CYP2C9*3 genotype, we plotted profiles of both substances separately (Figure 4). The predicted curves accurately describe the clinical data.
FIGURE 3
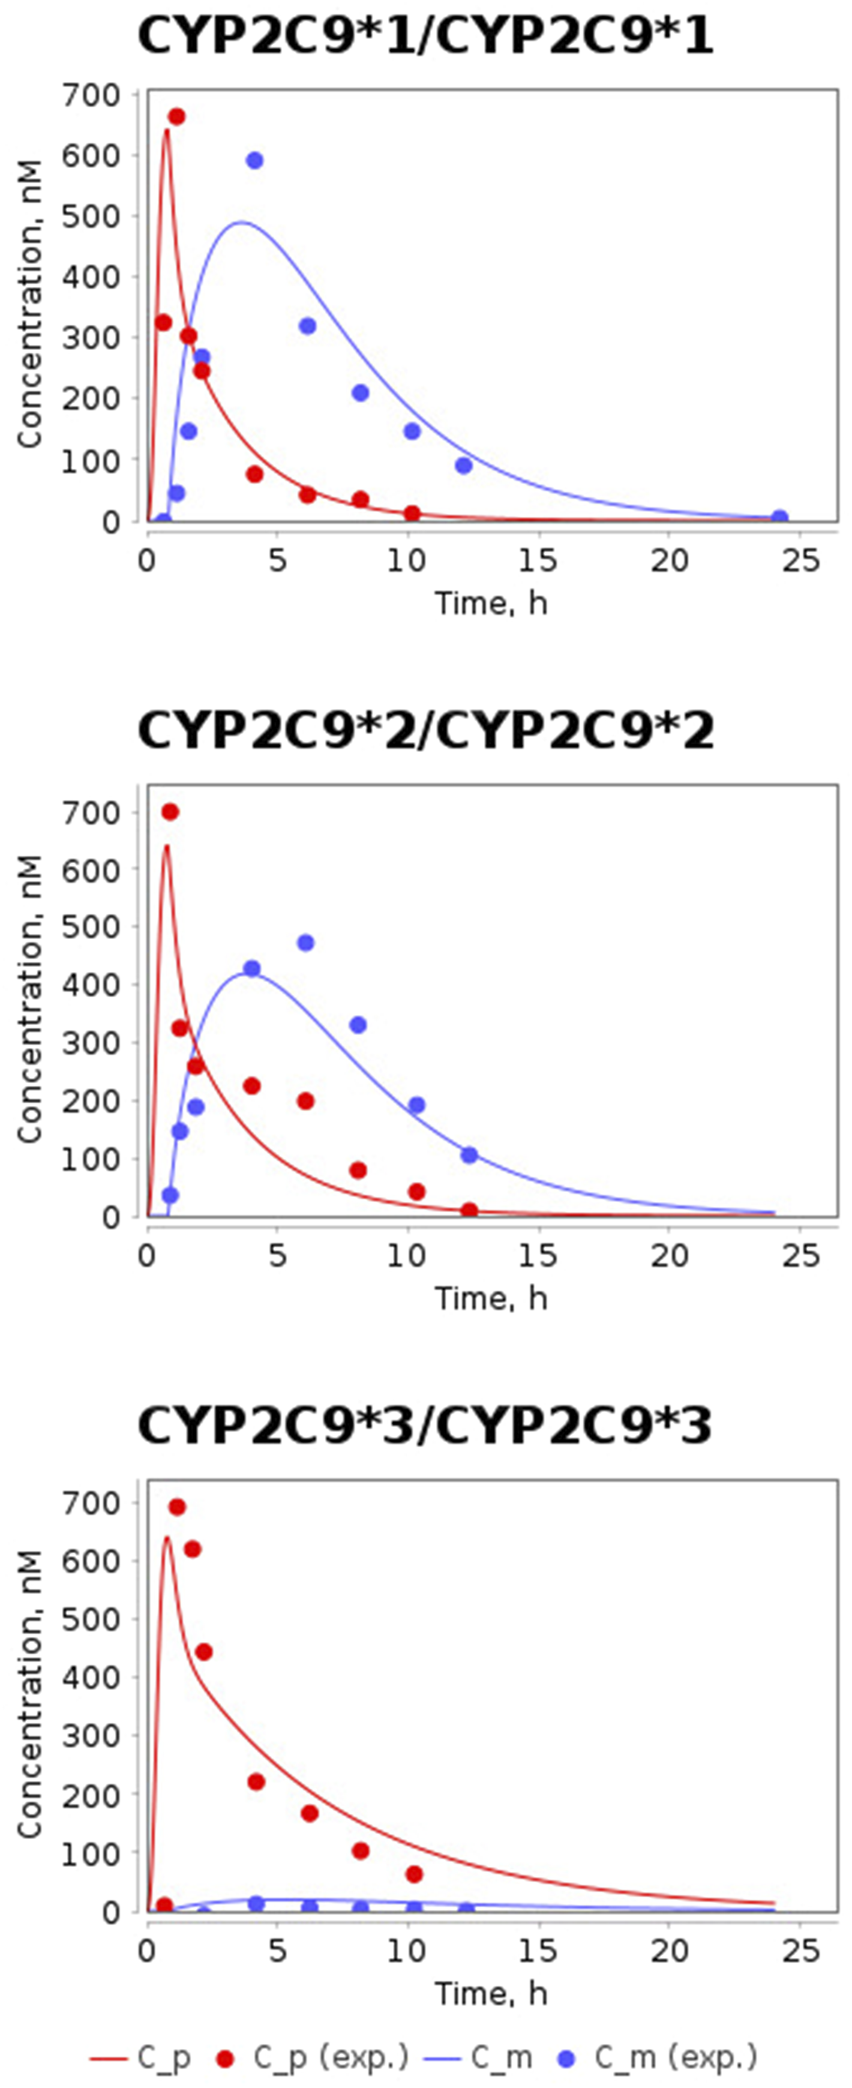
Model prediction of losartan and E-3174 plasma concentrations for three CYP2C9 homozygous genotypes after a single 50 mg oral dose of losartan potassium. C_p, predicted profile of losartan; C_m, predicted profile of E-3174; C_p (exp.), experimental time-course of losartan; C_m (exp.), experimental time-course of E-3174. In experimental work (Yasar et al., 2002) 6 patients were included in CYP2C9*1/CYP2C9*1 group, 3 patients - in CYP2C9*2/CYP2C9*2 group, and only one patient - in CYP2C9*3/CYP2C9*3 group.
FIGURE 4
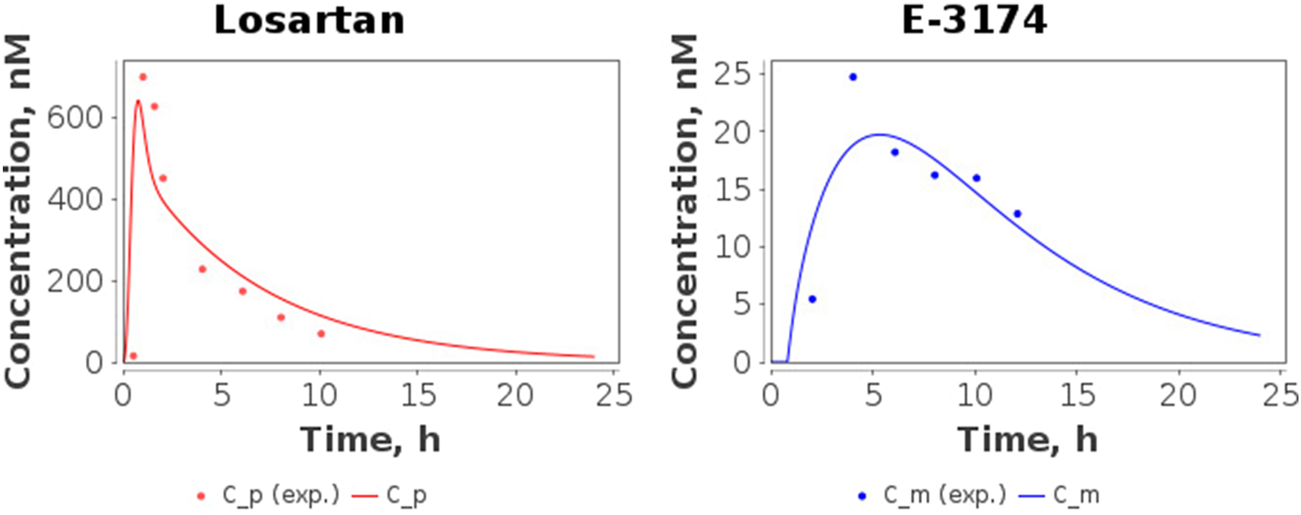
Model predictions of plasma concentrations of losartan and E-3174 for the CYP2C9*3/CYP2C9*3 genotype after a single 50 mg oral dose of losartan potassium. C_p, predicted losartan profile; C_m, predicted E-3174 profile; C_p (exp.), experimental time-course of losartan; C_m (exp.), experimental time-course of E-3174. In the experimental study (Yasar et al., 2002), only one patient was included in this group.
After validation of the model, we calculated the values of the pharmacokinetic parameters (AUC, AUCratio, Cmax, t1/2, and tmax) (Table 3) for the simulated profiles of losartan and E-3174 in homozygous genotypes and compared them with the corresponding values calculated from the experimental data (Table 5).
TABLE 5
| Genotype | Pharmacokinetic parameter | Clinical data: mean ± SD, range | Model prediction |
|---|---|---|---|
| CYP2C9*1/CYP2C9*1 | Cmax, losartan (nM) | 675 ± 417, 328–1,404 | 641.5 |
| tmax, losartan (h) | 0.9 ± 0.4 | 0.8 | |
| t1/2, losartan (h) | 1.9 ± 0.6, 1.2–2.9 | 1.8 | |
| AUClosartan (nmol*h/L) | 1,697 ± 1,061, 522–3,373 | 1393.9 | |
| Cmax, E-3174 (nM) | 603 ± 443, 282–1,451 | 488.8 | |
| tmax, E-3174 (h) | 3.9 ± 1.9 | 3.6 | |
| t1/2, E-3174 (h) | 4.0 ± 1.1, 2.7–5.9 | 2.7a | |
| AUCE-3174 (nmol*h/L) | 4,346 ± 2,584, 2,162–9,183 | 3996.6 | |
| AUCratio (unitless) | 0.3 ± 0.1, 0.2–0.5 | 0.3 | |
| CYP2C9*2/CYP2C9*2 | Cmax, losartan (nM) | 713 ± 423, 448–1,201 | 641.5 |
| tmax, losartan (h) | 0.6 ± 0.3 | 0.8 | |
| t1/2, losartan (h) | 2.0 ± 0.6, 1.3–2.5 | 2.1 | |
| AUClosartan (nmol*h/L) | 1912 ± 438, 1,419–2254 | 1584.0 | |
| Cmax, E-3174 (nM) | 486 ± 210, 256–669 | 419.5 | |
| tmax, E-3174 (h) | 5.8 ± 2.9 | 3.8 | |
| t1/2, E-3174 (h) | 3.8 ± 1.2, 2.9–5.2 | 2.8 | |
| AUCE-3174 (nmol*h/L) | 4,104 ± 2,097, 1,931–6,116 | 3640.5 | |
| AUCratio (unitless) | 0.6 ± 0.5, 0.33–1.2 | 0.4 | |
| CYP2C9*3/CYP2C9*3 | Cmax, losartan (nM) | 706 ± 353 | 641.5 |
| tmax, losartan (h) | 0.9 ± 0.4 | 0.8 | |
| t1/2, losartan (h) | 3.6 ± 1.8 | 4.5 | |
| AUClosartan (nmol*h/L) | 2,769 ± 1,385 | 3338.5 | |
| Cmax, E-3174 (nM) | 25 ± 12 | 19.7 | |
| tmax, E-3174 (h) | 3.9 ± 1.9 | 5.4 | |
| t1/2, E-3174 (h) | 6.8 ± 3.4 | 5.1 | |
| AUCE-3174 (nmol*h/L) | 312 ± 156 | 247.9 | |
| AUCratio (unitless) | 8.9 ± 4.5 | 13.5b |
Comparison of key pharmacokinetic parameters for CYP2C9 homozygous genotypes.
Cmax, losartan, the maximum plasma concentration of losartan; Cmax, E-3174, the maximum plasma concentration of E-3174; tmax, losartan, the time to reach Cmax, losartan; tmax, E-3174, the time to reach Cmax, E-3174; t1/2, losartan, the apparent terminal elimination half-life of losartan; t1/2, E-3174, the apparent terminal elimination half-life of E-3174; AUClosartan, the area under the concentration-time curve of losartan; AUCE-3174, the area under the concentration-time curve of E-3174; AUCratio, AUClosartan to AUCE-3174 ratio.
In experimental work (Yasar et al., 2002) 6 patients were included in CYP2C9*1/CYP2C9*1 group, 3 patients - in CYP2C9*2/CYP2C9*2 group, and only 1 patient - in CYP2C9*3/CYP2C9*3 group.
The predicted value of the parameter does not fall within the mean ± SD experimental range, but falls within min - max experimental range.
The predicted value of the parameter does not fall within the min - max experimental range.
The values of all simulated pharmacokinetic parameters fell within the corresponding experimental range (Table 5). However, the t1/2, E-3174 value for the CYP2C9*1/CYP2C9*1 case was at the lower bound of the range. tmax values for losartan and E-3174 for different genotypes were not provided in the clinical study (Yasar et al., 2002). Therefore, we derived these values directly from the losartan and E-3174 concentration-time profiles reported in the article for homozygous CYP2C9 genotypes. Note that we were only able to derive mean values for tmax from these data, while the variation among patients was unknown because blood samples for analysis were taken at fixed times (0, 0.5, 1, 1.5, 2, 4, 6, 8, 10, 12, 24 h). In addition, the group of patients with the CYP2C9*3/CYP2C9*3 genotype included only one individual (Yasar et al., 2002) and direct calculation of SD for all pharmacokinetic parameters in this case was also not possible. For the comparative analysis of experimental and simulated values, we assumed that the unknown SD values mentioned above could be the same as for other parameters in the CYP2C9*1/CYP2C9*1 group (SD varies from 28% to 73% for different parameters, i.e., is 50% on average). Considering SD = 50% for all parameters in CYP2C9*3/CYP2C9*3 and for tmax parameters in all groups, we found that all model-predicted values, except AUCratio for the CYP2C9*3/CYP2C9*3 case, fell within the mean ± SD range, while the simulated value AUCratio = 13.5 deviated from the experimental value of 8.9 by 51%.
3.2 Identifiability of the model parameters
After optimizing the model parameters, we checked them for identifiability to ensure that the resulting solution is unique. As can be seen from Figure 5, all model parameters are identifiable.
FIGURE 5
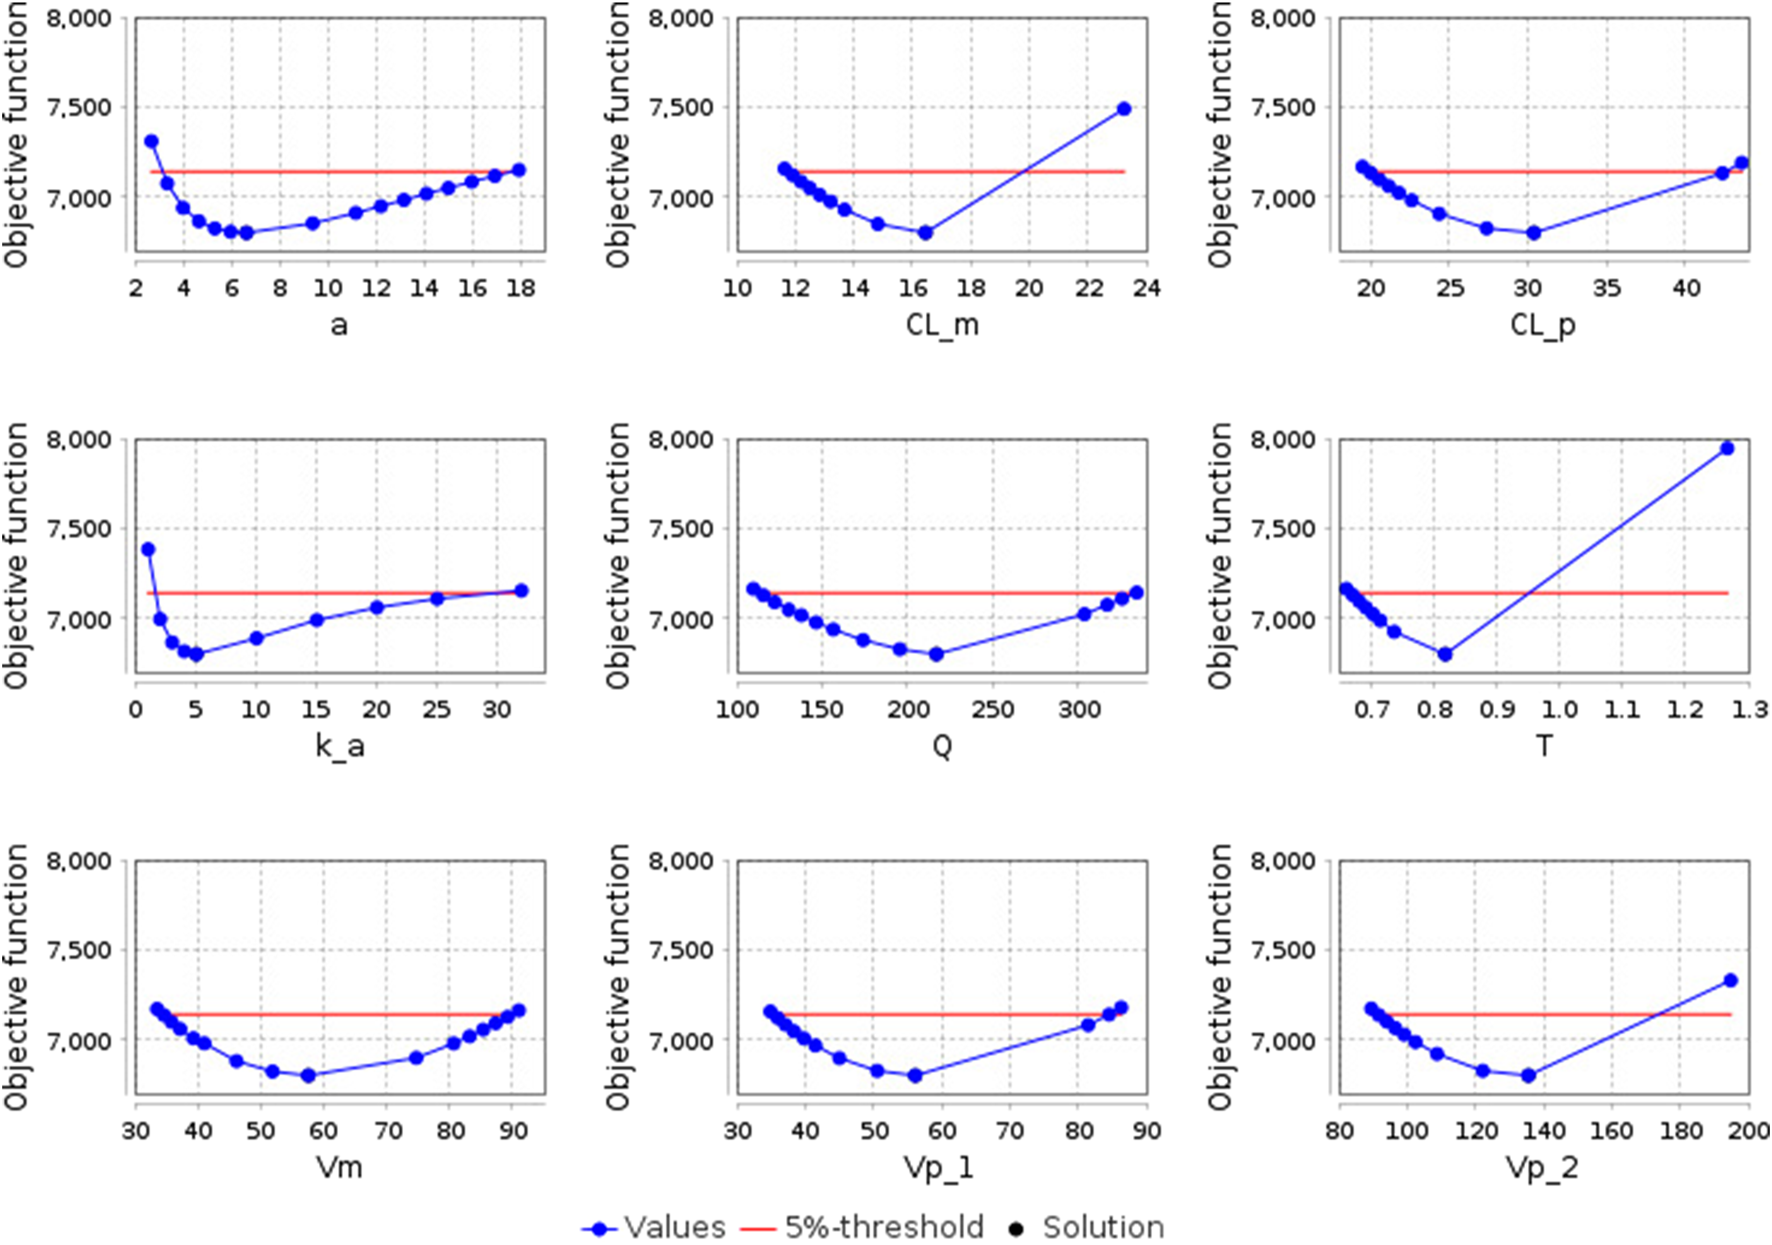
Identifiability plots of the model parameters: a - the amplitude of the sinusoidal equation, which describes open-close cycles of the gastric pyloric valve (h-1); CL_m - apparent clearance of E-3174 (L/h); CL_p - apparent clearance of losartan (L/h); k_a - rate constant of losartan absorption from the small intestine into the blood (h-1); Q - apparent inter-compartmental (central-peripheral) clearance of losartan (L/h); T - time delay in the conversion of losartan to E-3174 (h); Vm - apparent volume of distribution of E-3174 in the central compartment (L); Vp_1 - apparent volume of distribution of losartan in the central compartment (L); Vp_2 - apparent volume of distribution of losartan in the peripheral compartment (L). The blue dots represent the objective function values, the black dot indicates the optimal solution (coincides with the solution at the zero step of optimization), and the red line denotes the boundary value of the objective function (5% of the initial objective function value).
3.3 Verification of the model
The model was tested using the data from the same experimental study (Yasar et al., 2002), but obtained for patients with heterozygous CYP2C9 genotypes (CYP2C9*1/CYP2C9*2, CYP2C9*1/CYP2C9*3, and CYP2C9*2/CYP2C9*3).
Since the rate of conversion of losartan to E-3174 in the model was described using a first-order reaction equation, the arithmetic mean of the km values for the two homozygotes whose alleles were included in the heterozygote was used as km for this heterozygote:
In the study by Yasar et al. (2002), there were no concentration-time curves for patients with heterozygous CYP2C9 genotypes, so it was impossible to check how well the concentration-time curves of losartan and E-3174 simulated by the model matched the experimental ones (Supplementary Figure S3). Therefore, to verify the model, we compared pharmacokinetic parameter values from the clinical study Yasar et al., (2002) and those predicted by the model (Table 6).
TABLE 6
| Genotype | Pharmacokinetic parameter | Clinical data: mean ± SD, range | Model prediction |
|---|---|---|---|
| CYP2C9*1/CYP2C9*2 | Cmax, losartan (nM) | 731 ± 489, 208–1,178 | 641.5 |
| tmax, losartan (h) | 0.9 ± 0.4 | 0.8 | |
| t1/2, losartan (h) | 2.1 ± 0.4, 1.6–2.5 | 1.9 | |
| AUClosartan (nmol*h/L) | 1,521 ± 850, 750–2432 | 1,481.2 | |
| Cmax, E-3174 (nM) | 763 ± 565, 384–1,412 | 455.8 | |
| tmax, E-3174 (h) | 3.9 ± 1.9 | 3.7 | |
| t1/2, E-3174 (h) | 4.3 ± 0.2, 4.1–4.3 | 2.7b | |
| AUCE-3174 (nmol*h/L) | 5,564 ± 3,505, 3,355–9,605 | 3833.3 | |
| AUCratio (unitless) | 0.3 ± 0.1, 0.2–0.4 | 0.4 | |
| CYP2C9*1/CYP2C9*3 | Cmax, losartan (nM) | 353 ± 160, 148–596 | 641.5b |
| tmax, losartan (h) | 0.9 ± 0.4 | 0.8 | |
| t1/2, losartan (h) | 2.4 ± 0.5, 1.9–3.2 | 2.5 | |
| AUClosartan (nmol*h/L) | 1,249 ± 248, 925–1,572 | 1921.7b | |
| Cmax, E-3174 (nM) | 241 ± 102, 108–369 | 315.3 | |
| tmax, E-3174 (h) | 3.9 ± 1.9 | 4.2 | |
| t1/2, E-3174 (h) | 5.6 ± 1.0, 4.5–7.0 | 3.1b | |
| AUCE-3174 (nmol*h/L) | 2753 ± 898, 1,446–3740 | 3003.0 | |
| AUCratio (unitless) | 0.5 ± 0.2, 0.3–0.8 | 0.6 | |
| CYP2C9*2/CYP2C9*3 | Cmax, losartan (nM) | 635 ± 388, 213–1,062 | 641.5 |
| tmax, losartan (h) | 0.9 ± 0.4 | 0.8 | |
| t1/2, losartan (h) | 3.0 ± 0.6, 2.2–3.5 | 2.8 | |
| AUClosartan (nmol*h/L) | 2006 ± 632, 1,269–2639 | 2118.1 | |
| Cmax, E-3174 (nM) | 179 ± 39, 144–217 | 263.0b | |
| tmax, E-3174 (h) | 3.9 ± 1.9 | 4.4 | |
| t1/2, E-3174 (h) | 6.1 ± 1.6, 4.4–7.6 | 3.4b | |
| AUCE-3174 (nmol*h/L) | 2134 ± 491, 1,749–2,849 | 2628.8a | |
| AUCratio (unitless) | 0.9 ± 0.4, 0.5–1.3 | 0.8 |
Comparison of key pharmacokinetic parameters for CYP2C9 heterozygous genotypes.
Cmax, losartan, the maximum plasma concentration of losartan; Cmax, E-3174, the maximum plasma concentration of E-3174; tmax, losartan, the time to reach Cmax, losartan; tmax, E-3174, the time to reach Cmax, E-3174; t1/2, losartan, the apparent terminal elimination half-life of losartan; t1/2, E-3174, the apparent terminal elimination half-life of E-3174; AUClosartan, the area under the concentration-time curve of losartan; AUCE-3174, the area under the concentration-time curve of E-3174; AUCratio, AUClosartan to AUCE-3174 ratio.
In experimental work (Yasar et al., 2002) 3 patients were included in CYP2C9*1/CYP2C9*2 group, 5 patients - in CYP2C9*1/CYP2C9*3 group, and 4 patients - in CYP2C9*2/CYP2C9*3 group.
The predicted value of the parameter does not fall within the mean ± SD experimental range, but falls within min - max experimental range.
The predicted value of the parameter does not fall within the min - max experimental range.
Because concentration-time profiles of losartan and E-3174 were not available for heterozygous CYP2C9 genotypes, we were unable to estimate tmax, losartan and tmax, E-3174 values and instead used the corresponding values obtained for the CYP2C9*1/CYP2C9*1 case.
Table 6 demonstrates that the model predictions for heterozygous CYP2C9 genotypes fit the experimental data worse than for homozygous genotypes. The simulated values of the following pharmacokinetic parameters are outside the experimental range: t1/2, E-3174 for the CYP2C9*1/CYP2C9*2 group, Cmax, losartan, AUClosartan and t1/2, E-3174 for CYP2C9*1/CYP2C9*3, Cmax, E-3174 and t1/2, E-3174 for CYP2C9*2/CYP2C9*3. At the same time, the simulated AUCE-3174 value for the CYP2C9*2/CYP2C9*3 genotype is at the upper bound of the mean ± SD experimental range.
3.4 Simulation of losartan antihypertensive therapy
To assess the antihypertensive effect of losartan therapy in individuals with different CYP2C9 genotypes, we used a previously developed cardiorenal model (Kutumova et al., 2022; Kutumova et al., 2021), which, in particular, reproduces the pharmacological action of losartan, and examined 100 virtual patients with arterial hypertension generated for it earlier (Kutumova et al., 2022). The distribution of their physiological characteristics is presented in Supplementary Figure S4. To test how virtual patients with different allelic variants of CYP2C9 would respond to losartan treatment, we estimated the values of the kblock parameter, representing the AT1-receptor blocking activity of the drug, for different CYP2C9 genotypes as described in Materials and Methods (Table 4). Each of the 100 virtual patients was simulated with each of the six values of kblock, i.e., the difference between the groups for each genotype consisted only in CYP2C9 activity.
After simulating the treatment of virtual patients with the found values of kblock, we compared our results with clinical study by Sinitsina et al. (2023), where authors had investigated the antihypertensive effect of losartan monotherapy in hypertensive patients with different CYP2C9 genotypes. In this study, patients were divided into two groups: 55 patients with the CYP2C9*1/CYP2C9*1 genotype and 26 patients carrying CYP2C9*2 or CYP2C9*3 variant alleles (13 patients with the CYP2C9*1/CYP2C9*2 genotype, 9 patients with the CYP2C9*1/CYP2C9*3 genotype, 2 patients with the CYP2C9*2/CYP2C9*2 genotype, and 2 patients with the CYP2C9*2/CYP2C9*3 genotype). Patients with the CYP2C9*3/CYP2C9*3 genotypes were not included in the study due to the rarity of this genotype.
Similar to the clinical study, we divided our virtual patients into the same two groups. For the CYP2C9*1/CYP2C9*1 group, we used all 100 patients with the corresponding kblock value (0.886), while for the second group, we used the same patients but with kblock values of other genotypes. Сomparison of the simulation and experimental results is presented in Table 7 and Figure 6. Unfortunately, we were unable to statistically evaluate the difference between our simulations and the clinical trial results because the experimental study (Sinitsina et al., 2023) only presented data as median and interquartile range. Overall, the agreement between modeled and experimental blood pressure responses to losartan treatment was better in patients with CYP2C9*2 or CYP2C9*3 alleles than in CYP2C9*1/CYP2C9*1 patients.
TABLE 7
| Group of patients | Blood pressure | Experimental data, mmHg (median (Q1; Q3)) | Model simulation, mmHg (median (Q1; Q3)) |
|---|---|---|---|
| CYP2C9*1/CYP2C9*1 | Systolic | −13 (−8; −18) | −8.602 (−7.692; −9.734) |
| Diastolic | −9 (−8; −13) | −8.537 (−7.855; −9.085) | |
| CYP2C9*2 or CYP2C9*3 carriers | Systolic | −6 (−3; −10) | −3.238 (−1.286; −6.856) |
| Diastolic | −4 (−2; −7) | −4.275 (−2.249; −7.347) |
Comparison of blood pressure response to losartan treatment between the clinical trial by Sinitsina et al. (2023) and the model simulation.
Q1, first quartile; Q3, third quartile.
In experimental study (Sinitsina et al., 2023), 55 patients were included in the CYP2C9*1/CYP2C9*1 group and 26 patients in the group of carriers of CYP2C9*2 or CYP2C9*3 (13 patients with the CYP2C9*1/CYP2C9*2 genotype, 9 patients with the CYP2C9*1/CYP2C9*3 genotype, 2 patients with the CYP2C9*2/CYP2C9*2 genotype, and 2 patients with the CYP2C9*2/CYP2C9*3 genotype).
FIGURE 6
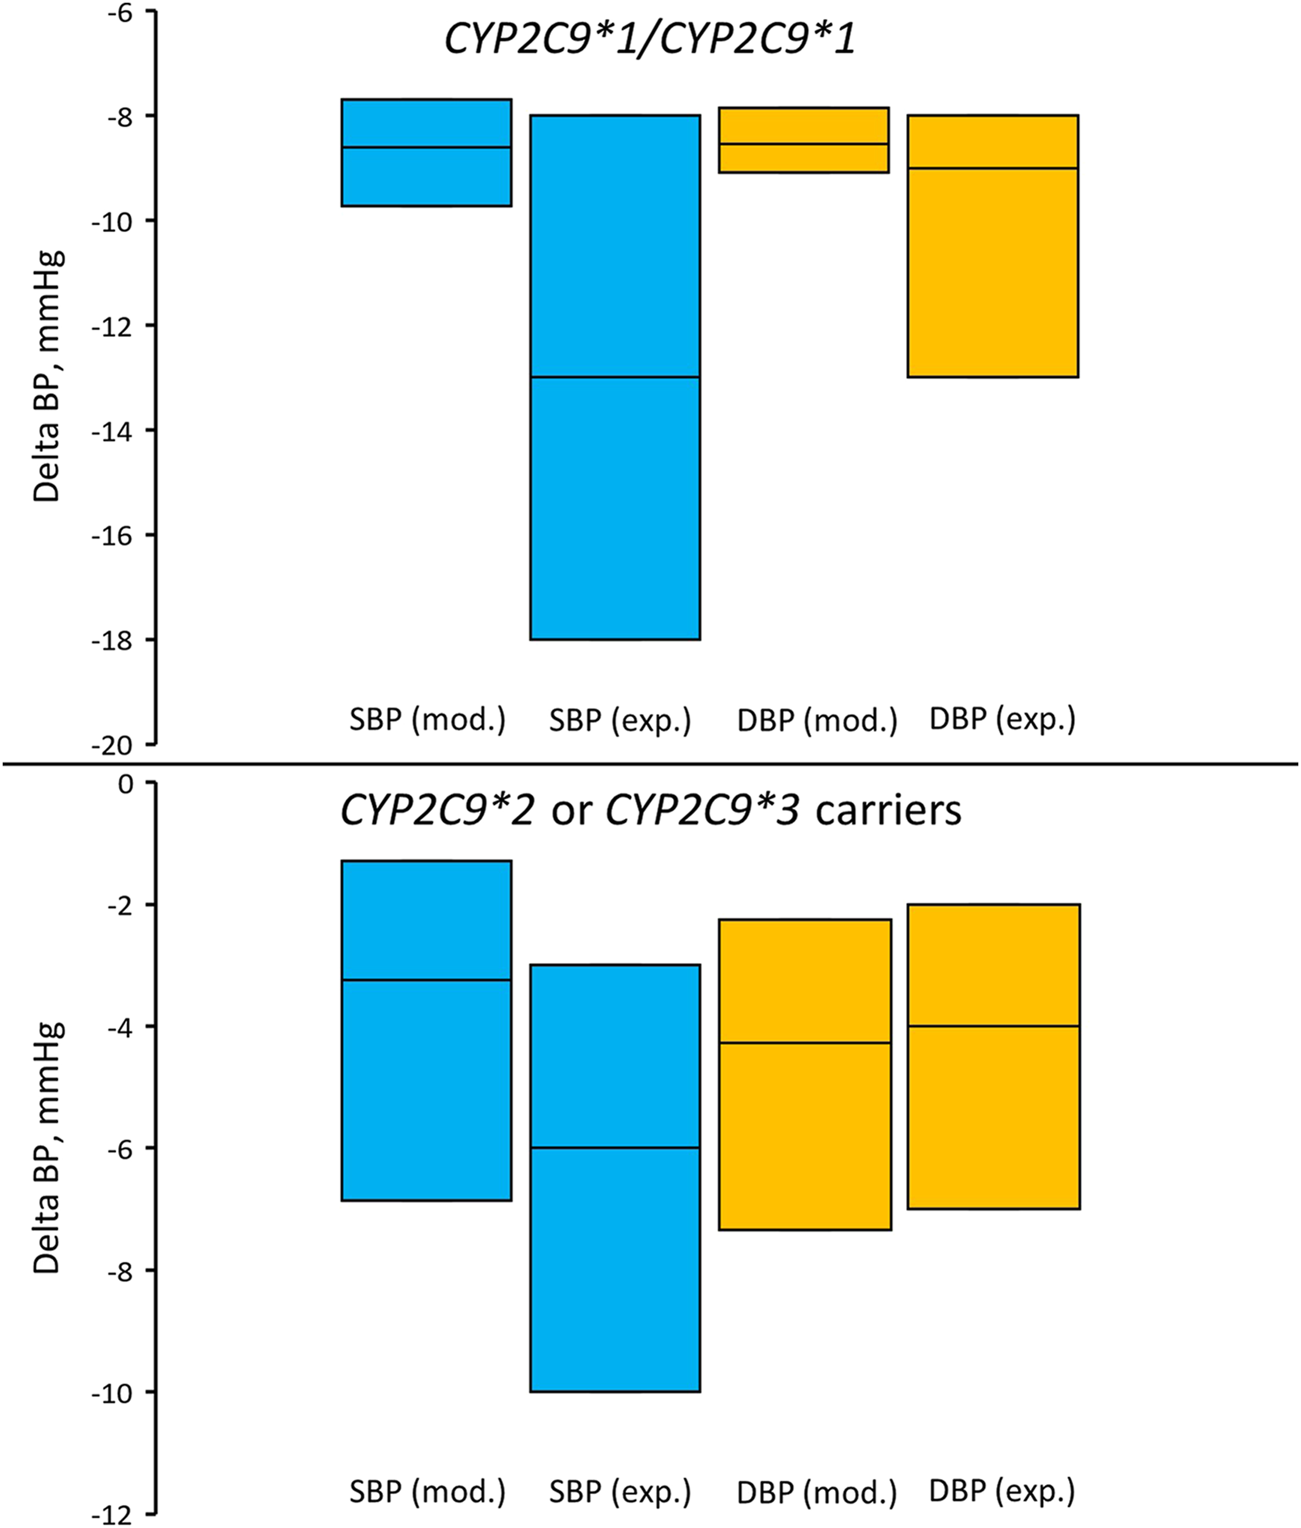
Comparison of simulated and experimentally obtained (Sinitsina et al., 2023) systolic and diastolic blood pressure responses to losartan treatment in patients with the CYP2C9*1/CYP2C9*1 genotype (top) and in patients who are carriers of CYP2C9*2 or CYP2C9*3 (bottom). Box plots show median and interquartile ranges. Delta BP, blood pressure response; SBP (mod.), simulated systolic blood pressure; DBP (mod.), simulated diastolic blood pressure; SBP (exp.), experimentally obtained systolic blood pressure; DBP (exp.), experimentally obtained diastolic blood pressure. In the experimental study, 55 patients were included in the CYP2C9*1/CYP2C9*1 group and 26 patients in the group of carriers of CYP2C9*2 or CYP2C9*3 (13 patients with the CYP2C9*1/CYP2C9*2 genotype, 9 patients with the CYP2C9*1/CYP2C9*3 genotype, 2 patients with the CYP2C9*2/CYP2C9*2 genotype, and 2 patients with the CYP2C9*2/CYP2C9*3 genotype).
In addition, we compared the simulated systolic and diastolic blood pressure responses to losartan therapy between patients with the CYP2C9*1/CYP2C9*1 genotype and CYP2C9*2 or CYP2C9*3 carriers (Figure 7). As a result, we can conclude that virtual patients with the CYP2C9*1/CYP2C9*1 genotype had a greater reduction in both systolic and diastolic blood pressure after treatment with losartan, than patients with CYP2C9*2 or CYP2C9*3 alleles (p-value < 0.0001).
FIGURE 7
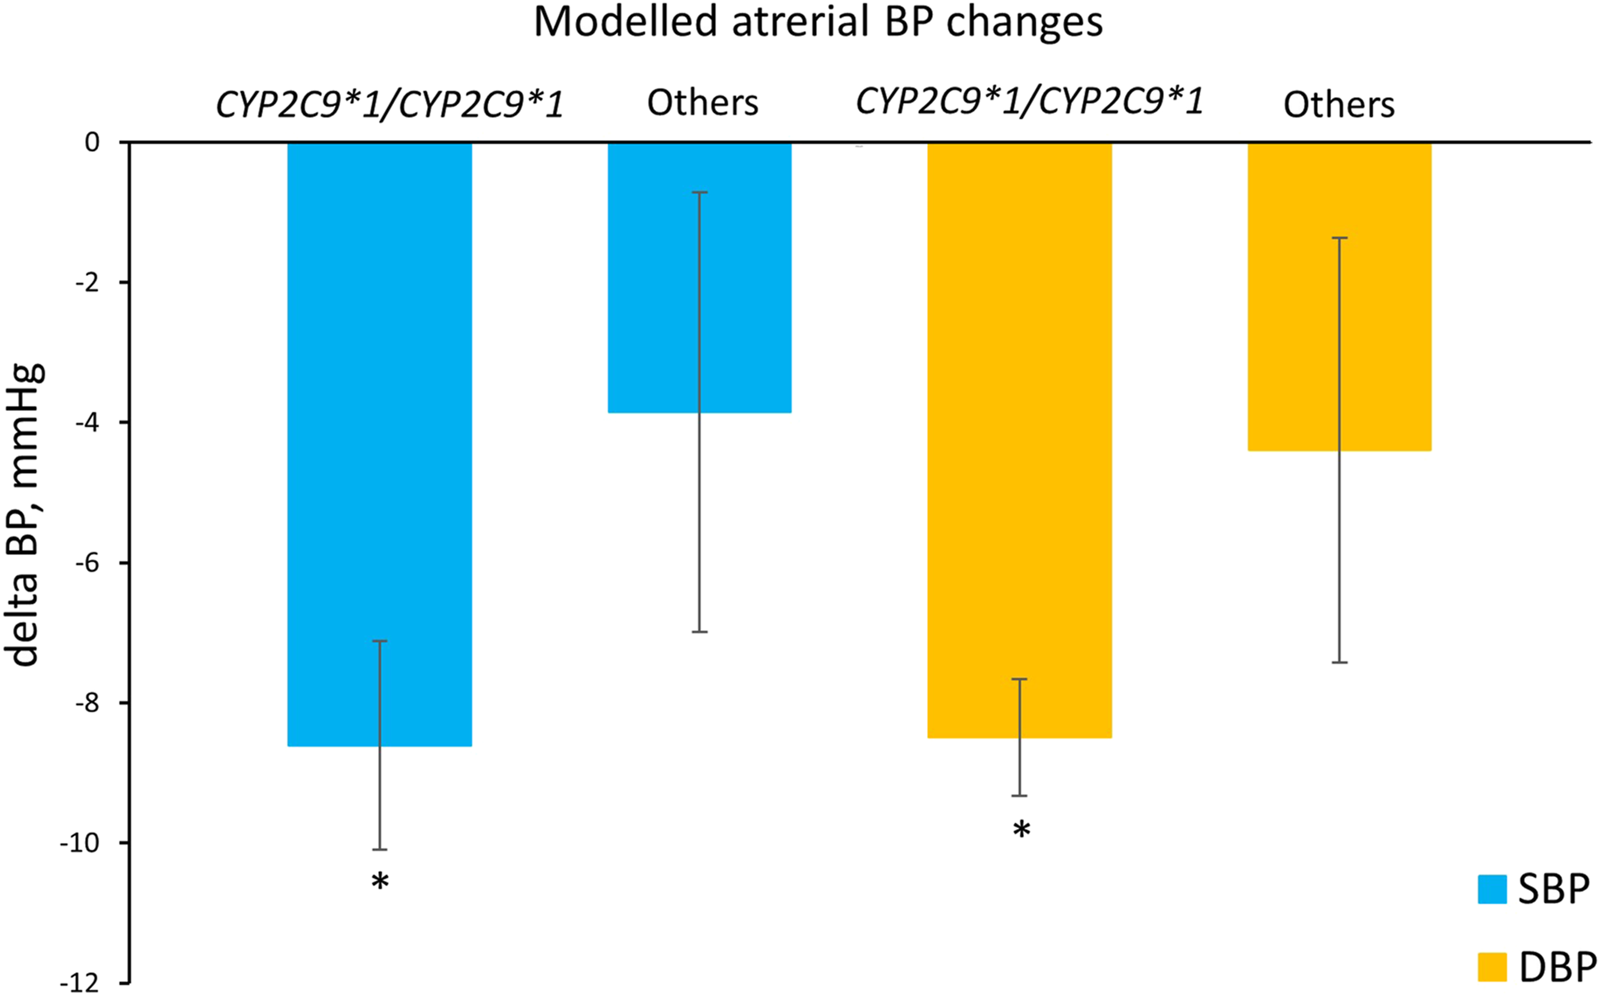
Comparison of simulated systolic and diastolic blood pressure responses to losartan monotherapy in patients with the CYP2C9*1/CYP2C9*1 genotype and in patients who are carriers of CYP2C9*2 or CYP2C9*3 (others). Values are given as mean ± SD. Delta BP, blood pressure response; SBP, systolic blood pressure; DBP, diastolic blood pressure. *P-value < 0.0001 vs. others. Comparisons were performed by unpaired Student’s t-test.
We then examined the antihypertensive effect of losartan across all CYP2C9 genotypes (Figure 8; Table 8). As can be seen, patients carrying the CYP2C9*2 allele had a similar reduction in blood pressure as patients with the CYP2C9*1/CYP2C9*1 genotype. At the same time, patients with the CYP2C9*3 allele had a significantly lower blood pressure response to losartan than patients with the wild-type genotype, while patients with CYP2C9*3/CYP2C9*3 did not experience any effect from losartan treatment.
FIGURE 8
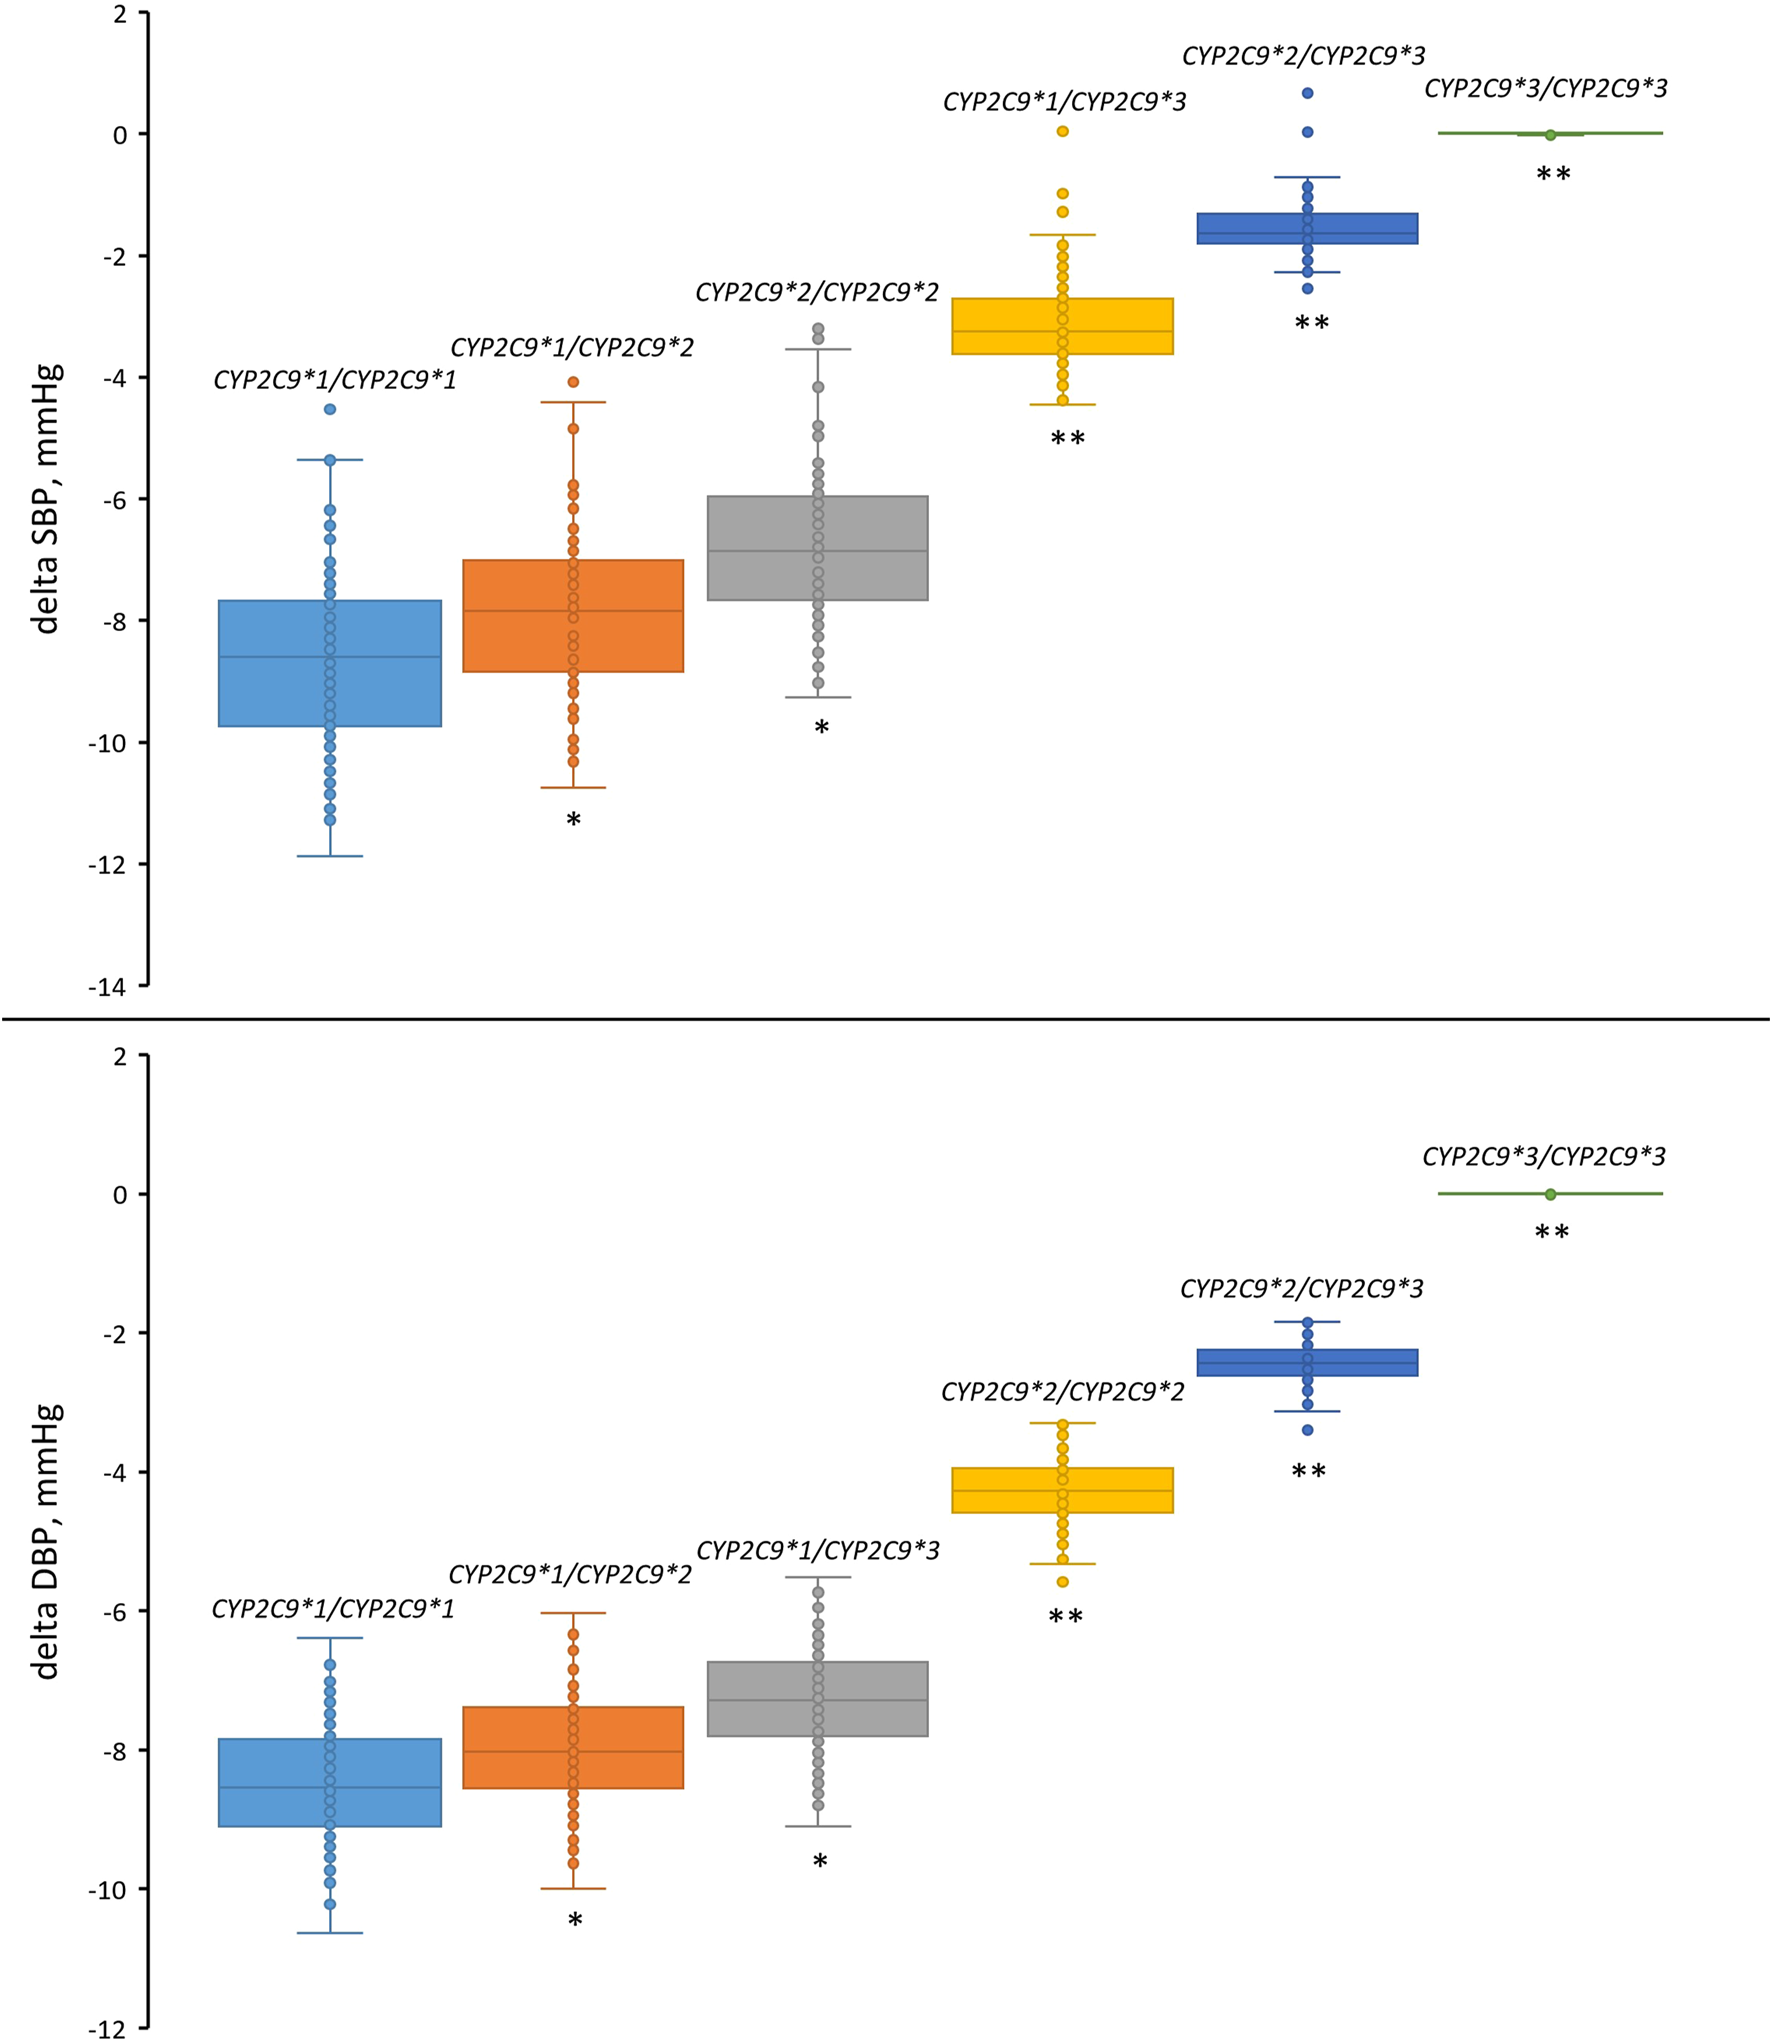
Comparison of simulated systolic and diastolic blood pressure responses to losartan monotherapy in patients with different CYP2C9 genotypes. Box plots show medians, interquartile ranges, maximum, and minimum. Delta SBP, systolic blood pressure response; Delta DBP, diastolic blood pressure response. *P-value < 1E-03 vs. CYP2C9*1/CYP2C9*1. **P-value < 1E-10 vs. CYP2C9*1/CYP2C9*1. Comparisons were performed by unpaired Student’s t-test using the Bonferroni cutoff for significance (P-value < 0.0083, i.e., 0.05/number of CYP2C9 genotypes).
TABLE 8
| Genotype | Systolic blood pressure | Diastolic blood pressure | ||
|---|---|---|---|---|
| Response (mean ± SD) | P-value | Response (mean ± SD) | P-value | |
| CYP2C9*1/CYP2C9*1 | −8.610 ± 1.488 | - | −8.498 ± 0.834 | - |
| CYP2C9*1/CYP2C9*2 | −7.820 ± 1.379 | 1.34E−04* | −7.991 ± 0.793 | 3.31E−04* |
| CYP2C9*2/CYP2C9*2 | −6.763 ± 1.240 | 1.34E−04* | −7.274 ± 0.736 | 3.31E−04* |
| CYP2C9*1/CYP2C9*3 | −3.142 ± 0.758 | 1.86E−69** | −4.277 ± 0.480 | 7.70E−54** |
| CYP2C9*2/CYP2C9*3 | −1.543 ± 0.463 | 1.57E−76** | −2.442 ± 0.301 | 6.55E−67** |
| CYP2C9*3/CYP2C9*3 | 0.007 ± 0.009 | 3.53E−78** | 0.002 ± 0.003 | 3.73E−78** |
Simulated blood pressure response to losartan across CYP2C9 genotypes.
* P-value < 1E-03 vs. CYP2C9*1/CYP2C9*1.
** P-value < 1E-10 vs. CYP2C9*1/CYP2C9*1.
Comparisons were performed by unpaired Student’s t-test using the Bonferroni cutoff for significance (P-value < 0.0083, i.e., 0.05/number of CYP2C9 genotypes).
4 Discussion
The genetic factors are known to be able to contribute to an increase in blood pressure by 30%–50% (Dominiczak et al., 2000; Menni et al., 2013), and the highly polymorphic CYP2C9 gene plays a critical role in the metabolism of the antihypertensive drug losartan (Sullivan-Klose et al., 1996). Therefore, we integrated the most frequent CYP2C9 genotypes into the model to accurately predict the plasma profiles of losartan and E-3174 in patients with the corresponding genotypes.
The aim of this study was to modify an existing mathematical model that describes the distribution of losartan and its metabolite E-3174 (Karatza and Karalis, 2020). The final model was expected to predict plasma concentration-time curves of both compounds for patients with the most common alleles of the CYP2C9 gene: CYP2C9*1, CYP2C9*2, and CYP2C9*3.
Firstly, we reproduced the original model in the BioUML software and then redefined the model parameter values using the stochastic ranking evolutionary strategy optimization method. Secondly, we performed the identifiability analysis of the model parameters with the redefined values. In addition, we calculated the pharmacokinetic parameters (Cmax, tmax, t1/2, AUC and AUCratio) for the curves predicted by the model and then compared these values with clinical data to verify the model. Finally, we assessed the effect of losartan treatment in virtual hypertensive patients with different CYP2C9 genotypes using the cardiorenal model (Kutumova et al., 2022; Kutumova et al., 2021).
The model showed good agreement with clinical data. However, some discrepancies were observed between simulated and clinical data for some pharmacokinetic characteristics across CYP2C9 genotypes. For example, a discrepancy between predicted and experimental values was observed for t1/2, E-3174 (terminal elimination half-life of E-3174). A possible explanation for this fact is that the experimental study did not indicate which time points of the linear part of the semilogarithmic plasma concentration-time curve were used to calculate the terminal elimination half-life (t1/2) (Yasar et al., 2002). For losartan this is probably not as important, since it reaches peak concentrations quickly (within an hour) and then declines steadily (Supplementary Figure S5, top). Consequently, the semilogarithmic concentration-time curve of losartan rapidly becomes linear after drug administration (Supplementary Figure S6, top). On the other hand, for E-3174 we can observe a different form of concentration-time profile: E-3174 reaches its maximum concentration later than losartan, approximately 3–4 h after drug administration (Supplementary Figure S5, bottom). Therefore, on a semilogarithmic plot, the profile of E-3174 is flatter (Supplementary Figure S6, bottom) than that of losartan. For this reason, we think that the choice of time points used to calculate t1/2 is more crucial for E-3174 than for losartan.
There may also be other reasons for the observed discrepancies: 1) insufficient number of patients with certain genotypes in the clinical trial (Yasar et al., 2002) due to low allele frequencies of CYP2C9*2 and CYP2C9*3, 2) small number of experimental concentration-time points used for model training, and 3) high inter-subject variability in the plasma concentration-time curves of losartan and E-3174. It is known that losartan belongs to the first class of drugs according to the BCS (Biopharmaceutics Classification System), possessing high solubility and permeability (Chavda et al., 2010). Emptying of gastric contents into the duodenum through the pyloric valve is the rate-limiting process for absorption of these drugs (Sugihara et al., 2015; Tsume and Amidon, 2010). Thus, the high inter-patient variability in losartan and E-3174 plasma profiles may be due to physiological differences in gastric emptying processes. In addition, individuals may experience different phases of the migrating motor complex cycle (the regular pattern of gastric motility during fasting) while taking medications (Amidon et al., 1991; Higaki et al., 2008; Langguth et al., 1994; Oberle and Amidon, 1987; Takamatsu et al., 2002). Besides, discrepancies may arise because not only various CYP2C9 alleles have different impact on the pharmacokinetics of losartan, but polymorphisms in other genes can also affect the absorption, distribution, metabolism, or excretion of this drug. For example, different alleles of the ABCB1 (ATP-binding cassette, subfamily B, number 1) gene are associated with different rates of early-phase oral absorption of losartan (Shin et al., 2020).
Modeling the antihypertensive effect of losartan therapy in a group of virtual patients with different CYP2C9 genotypes yielded the expected result. Individuals with the CYP2C9*1/CYP2C9*1 (wild-type) genotype responded better to losartan therapy than patients with CYP2C9*2 or CYP2C9*3 alleles. However, the simulated blood pressure responses were slightly different from those obtained in the clinical study (Sinitsina et al., 2023) (Table 7; Figure 6). This is probably due to the fact that we used the kblock value (0.886) from the study by Kutumova et al. (2022), where it was estimated based on data from another clinical study (Porthan et al., 2009). A second possible reason for this discrepancy is that in the study by Sinitsina et al. (2023), the losartan dose for patients was altered during the study period, while we used kblock = 0.886, adjusted for a constant oral dose of losartan 50 mg.
4.1 Limitations of the study
The main limitation of this study is related to the small number of patients with different CYP2C9 genotypes whose clinical data were used for model validation and verification. This is because the frequencies of the variant alleles CYP2C9*2 and CYP2C9*3 are also very low.
4.2 Future prospects
Accumulating the results on modeling the influence of various genetic factors on the regulation of arterial pressure may further enable studying their cross-influence on the development and treatment of arterial hypertension. In particular, other genes that could influence the absorption, distribution, metabolism, and excretion of losartan can be considered, which will allow for more accurate prediction of the pharmacokinetics and pharmacodynamics of losartan.
Statements
Data availability statement
The implementation of the model is available in the web version of the BioUML (https://sirius-web.org/bioumlweb/#de=data/Collaboration%20(git)/CYP2C9_losartan_metabolism/Data/Diagrams/Babaev2024%20-%20CYP2C9%20variants) platform and in the BioModels database (Malik-Sheriff et al., 2020) with ID MODEL2412180002 (https://www.ebi.ac.uk/biomodels/MODEL2412180002). Also, the description of the study, the models in SBML format, and instructions on how to reproduce the results are stored in the GitHub (https://github.com/DBgentech2023sirius/CYP2C9) and GitLab (https://gitlab.sirius-web.org/virtual-patient/CYP2C9_losartan_metabolism) repositories. Initial model (Karatza and Karalis, 2020) is also available in the BioModels database with ID MODEL2412180001 (https://www.ebi.ac.uk/biomodels/MODEL2412180001).
Author contributions
DB: Data curation, Formal Analysis, Investigation, Methodology, Software, Validation, Visualization, Writing – original draft. EK: Formal Analysis, Resources, Software, Supervision, Visualization, Writing – original draft, Writing – review & editing. FK: Conceptualization, Funding acquisition, Methodology, Project administration, Resources, Software, Supervision, Writing – review & editing.
Funding
The author(s) declare that financial support was received for the research and/or publication of this article. This study was funded by the Ministry of Science and Higher Education of the Russian Federation, (Agreement 075-10-2025-017 from 27.02.2025).
Conflict of interest
The authors declare that the research was conducted in the absence of any commercial or financial relationships that could be construed as a potential conflict of interest.
Generative AI statement
The authors declare that no Generative AI was used in the creation of this manuscript.
Publisher’s note
All claims expressed in this article are solely those of the authors and do not necessarily represent those of their affiliated organizations, or those of the publisher, the editors and the reviewers. Any product that may be evaluated in this article, or claim that may be made by its manufacturer, is not guaranteed or endorsed by the publisher.
Supplementary material
The Supplementary Material for this article can be found online at: https://www.frontiersin.org/articles/10.3389/fsysb.2025.1504077/full#supplementary-material
Footnotes
1.^ https://www.ncbi.nlm.nih.gov/protein/NP_000762.2
2.^ https://www.pharmvar.org/gene/CYP2C9
3.^ https://gnomad.broadinstitute.org
5.^ https://www.ebi.ac.uk/biomodels/MODEL2202160001
6.^ https://plotdigitizer.com/app
References
1
Amidon G. L. DeBrincat G. A. Najib N. (1991). Effects of gravity on gastric emptying, intestinal transit, and drug absorption. J. Clin. Pharmacol.31, 968–973. 10.1002/j.1552-4604.1991.tb03658.x
2
Babaev D. S. Kutumova E. O. Kolpakov F. A. (2024). Modeling the differential effect of CYP2C9 gene alleles on losartan metabolism. Math. Biol. Bioinform19, 533–564. 10.17537/2024.19.533
3
Chavda H. Patel C. Anand I. S. (2010). Biopharmaceutics classification system. Syst. Rev. Pharm.1c
4
Deloose E. Janssen P. Depoortere I. Tack J. (2012). The migrating motor complex: control mechanisms and its role in health and disease. Nat. Rev. Gastroenterol. Hepatol.9, 271–285. 10.1038/nrgastro.2012.57
5
Dominiczak A. F. Negrin D. C. Clark J. S. Brosnan M. J. McBride M. W. Alexander M. Y. (2000). Genes and hypertension: from gene mapping in experimental models to vascular gene transfer strategies. Hypertens. Dallas Tex35, 164–172. 10.1161/01.hyp.35.1.164
6
Feher J. (2017). Intestinal and colonic chemoreception and motility. in Quantitative Human Physiology. 96–809. 10.1016/B978-0-12-800883-6.00079-3
7
Gambardella N. Hucka M. Mi H. Moodie S. Schreiber F. Sorokin A. et al (2009). The systems biology graphical notation. Nat. Biotechnol.27, 735–741. 10.1038/nbt.1558
8
Ged C. Umbenhauer D. R. Bellew T. M. Bork R. W. Srivastava P. K. Shinriki N. et al (1988). Characterization of cDNAs, mRNAs, and proteins related to human liver microsomal cytochrome P-450 (S)-mephenytoin 4’-hydroxylase. Biochemistry27, 6929–6940. 10.1021/bi00418a039
9
Goldberg M. R. Lo M. W. Bradstreet T. E. Ritter M. A. Höglund P. (1995). Effects of cimetidine on pharmacokinetics and pharmacodynamics of losartan, an AT1-selective non-peptide angiotensin II receptor antagonist. Eur. J. Clin. Pharmacol.49, 115–119. 10.1007/BF00192369
10
Goldfeld S. M. Quandt R. E. Trotter H. F. (1966). Maximization by quadratic hill-climbing. Econometrica34, 541–551. 10.2307/1909768
11
Gradman A. H. Arcuri K. E. Goldberg A. I. Ikeda L. S. Nelson E. B. Snavely D. B. et al (1995). A randomized, placebo-controlled, double-blind, parallel study of various doses of losartan potassium compared with enalapril maleate in patients with essential hypertension. Hypertens. Dallas Tex25, 1345–1350. 10.1161/01.hyp.25.6.1345
12
Gray I. C. Nobile C. Muresu R. Ford S. Spurr N. K. (1995). A 2.4-megabase physical map spanning the CYP2C gene cluster on chromosome 10q24. Genomics28, 328–332. 10.1006/geno.1995.1149
13
Higaki K. Choe S. Y. Löbenberg R. Welage L. S. Amidon G. L. (2008). Mechanistic understanding of time-dependent oral absorption based on gastric motor activity in humans. Eur. J. Pharm. Biopharm. Off. J. Arbeitsgemeinschaft Pharm. Verfahrenstechnik EV70, 313–325. 10.1016/j.ejpb.2008.02.022
14
Hindmarsh A. Brown P. Grant K. E. Lee S. Serban R. Shumaker D. et al (2004). SUNDIALS: Suite of nonlinear and differential/algebraic equation solvers. ACM Trans. Math. Softw. TOMS31, 363–396. 10.1145/1089014.1089020
15
Ingber L. (1996). Adaptive simulated annealing (ASA): lessons learned. Control Cybern.25, 33–54. 10.48550/arXiv.cs/0001018
16
Jones D. R. (2009). Direct Global Optimization Algorithm. Berlin: Springer
17
Karatza E. Karalis V. (2020). Modelling gastric emptying: A pharmacokinetic model simultaneously describing distribution of losartan and its active metabolite EXP-3174. Basic Clin. Pharmacol. Toxicol.126, 193–202. 10.1111/bcpt.13321
18
Kaukonen K. M. Olkkola K. T. Neuvonen P. J. (1998). Fluconazole but not itraconazole decreases the metabolism of losartan to E-3174. Eur. J. Clin. Pharmacol.53, 445–449. 10.1007/s002280050405
19
Keating S. M. Waltemath D. König M. Zhang F. Dräger A. Chaouiya C. et al (2020). SBML Level 3: an extensible format for the exchange and reuse of biological models. Mol. Syst. Biol.16, e9110. 10.15252/msb.20199110
20
Kirby S. Brain P. Jones B. (2011). Fitting E(max) models to clinical trial dose-response data. Pharm. Stat.10, 143–149. 10.1002/pst.432
21
Kobayashi M. Takagi M. Fukumoto K. Kato R. Tanaka K. Ueno K. (2008). The effect of bucolome, a CYP2C9 inhibitor, on the pharmacokinetics of losartan. Drug Metab. Pharmacokinet.23, 115–119. 10.2133/dmpk.23.115
22
Kolpakov F. Akberdin I. Kashapov T. Kiselev L. Kolmykov S. Kondrakhin Y. et al (2019). BioUML: an integrated environment for systems biology and collaborative analysis of biomedical data. Nucleic Acids Res.47, W225–W233. 10.1093/nar/gkz440
23
Kolpakov F. Akberdin I. Kiselev I. Kolmykov S. Kondrakhin Y. Kulyashov M. et al (2022). BioUML-towards a universal research platform. Nucleic Acids Res.50, W124–W131. 10.1093/nar/gkac286
24
Kutumova E. Kiselev I. Sharipov R. Lifshits G. Kolpakov F. (2021). Thoroughly calibrated modular agent-based model of the human cardiovascular and renal systems for blood pressure regulation in health and disease. Front. Physiol.12, 746300. 10.3389/fphys.2021.746300
25
Kutumova E. Kiselev I. Sharipov R. Lifshits G. Kolpakov F. (2022). Mathematical modeling of antihypertensive therapy. Front. Physiol.13, 1070115. 10.3389/fphys.2022.1070115
26
Kutumova E. Kovaleva A. Sharipov R. Lifshits G. Kolpakov F. (2024). Mathematical modelling of the influence of ACE I/D polymorphism on blood pressure and antihypertensive therapy. Heliyon10, e29988. 10.1016/j.heliyon.2024.e29988
27
Langguth P. Lee K. M. Spahn-Langguth H. Amidon G. L. (1994). Variable gastric emptying and discontinuities in drug absorption profiles: dependence of rates and extent of cimetidine absorption on motility phase and pH. pH. Biopharm. Drug Dispos.15, 719–746. 10.1002/bdd.2510150902
28
Lee C. R. Goldstein J. A. Pieper J. A. (2002). Cytochrome P450 2C9 polymorphisms: a comprehensive review of the in-vitro and human data. Pharmacogenetics12, 251–263. 10.1097/00008571-200204000-00010
29
Lo M. W. Goldberg M. R. McCrea J. B. Lu H. Furtek C. I. Bjornsson T. D. (1995). Pharmacokinetics of losartan, an angiotensin II receptor antagonist, and its active metabolite EXP3174 in humans. Clin. Pharmacol. Ther.58, 641–649. 10.1016/0009-9236(95)90020-9
30
Malik-Sheriff R. S. Glont M. Nguyen T. V. N. Tiwari K. Roberts M. G. Xavier A. et al (2020). BioModels-15 years of sharing computational models in life science. Nucleic Acids Res.48, D407–D415. 10.1093/nar/gkz1055
31
McCrea J. B. Cribb A. Rushmore T. Osborne B. Gillen L. Lo M. W. et al (1999). Phenotypic and genotypic investigations of a healthy volunteer deficient in the conversion of losartan to its active metabolite E-3174. Clin. Pharmacol. Ther.65, 348–352. 10.1016/S0009-9236(99)70114-1
32
Menni C. Mangino M. Zhang F. Clement G. Snieder H. Padmanabhan S. et al (2013). Heritability analyses show visit-to-visit blood pressure variability reflects different pathological phenotypes in younger and older adults: evidence from UK twins. J. Hypertens.31, 2356–2361. 10.1097/HJH.0b013e32836523c1
33
Miners J. O. Birkett D. J. (1998). Cytochrome P4502C9: an enzyme of major importance in human drug metabolism. Br. J. Clin. Pharmacol.45, 525–538. 10.1046/j.1365-2125.1998.00721.x
34
Nebert D. W. Russell D. W. (2002). Clinical importance of the cytochromes P450. Lancet lond. Engl.360, 1155–1162. 10.1016/S0140-6736(02)11203-7
35
Nebro A. J. Durillo J. J. Luna F. Dorronsoro B. Alba E. (2009). MOCell: a cellular genetic algorithm for multiobjective optimization. Int. J. Intell. Syst.24, 726–746. 10.1002/int.20358
36
Nelson D. R. (2006). Cytochrome P450 nomenclature, 2004. Methods Mol. Biol. Clifton N. J320, 1–10. 10.1385/1-59259-998-2:1
37
Oberle R. L. Amidon G. L. (1987). The influence of variable gastric emptying and intestinal transit rates on the plasma level curve of cimetidine; an explanation for the double peak phenomenon. J. Pharmacokinet. Biopharm.15, 529–544. 10.1007/BF01061761
38
Porthan K. Viitasalo M. Hiltunen T. P. Vaananen H. Dabek J. Suonsyrja T. et al (2009). Short-term electrophysiological effects of losartan, bisoprolol, amlodipine, and hydrochlorothiazide in hypertensive men. Ann. Med.41, 29–37. 10.1080/07853890802195211
39
Raue A. Becker V. Klingmüller U. Timmer J. (2010). Identifiability and observability analysis for experimental design in nonlinear dynamical models. Chaos Woodbury N.20, 045105. 10.1063/1.3528102
40
Raue A. Kreutz C. Maiwald T. Bachmann J. Schilling M. Klingmüller U. et al (2009). Structural and practical identifiability analysis of partially observed dynamical models by exploiting the profile likelihood. Bioinforma. Oxf. Engl.25, 1923–1929. 10.1093/bioinformatics/btp358
41
Runarsson T. Yao X. (2000). Stochastic ranking for constrained evolutionary optimization. IEEE Trans. Evol. Comput.4, 284–294. 10.1109/4235.873238
42
Shin H.-B. Jung E. H. Kang P. Lim C. W. Oh K.-Y. Cho C.-K. et al (2020). ABCB1 c.2677G>T/c.3435C>T diplotype increases the early-phase oral absorption of losartan. Arch. Pharm. Res.43, 1187–1196. 10.1007/s12272-020-01294-3
43
Si D. Guo Y. Zhang Y. Yang L. Zhou H. Zhong D. (2004). Identification of a novel variant CYP2C9 allele in Chinese. Pharmacogenetics14, 465–469. 10.1097/01.fpc.0000114749.08559.e4
44
Sierra M. R. Coello C. A. C. (2005). Improving PSO-based multi-objective optimization using crowding, mutation and epsilon-dominance, in International conference on evolutionary multi-criterion optimization.
45
Sinitsina I. I. Boyarko A. V. Temirbulatov I. I. Sychev D. A. Akmalova K. A. Sozaeva Z. A. et al (2023). CYP2C9 gene polymorphisms influence on antihypertensive effectiveness and hypouricemic effect of losartan among patients with arterial hypertension: an observational study. Drug Metab. Pers. Ther.38, 163–168. 10.1515/dmpt-2022-0115
46
Stearns R. A. Chakravarty P. K. Chen R. Chiu S. H. (1995). Biotransformation of losartan to its active carboxylic acid metabolite in human liver microsomes. Role of cytochrome P4502C and 3A subfamily members. Drug Metab. Dispos. Biol. Fate Chem.23, 207–215. 10.1016/s0090-9556(25)06520-1
47
Stubbins M. J. Harries L. W. Smith G. Tarbit M. H. Wolf C. R. (1996). Genetic analysis of the human cytochrome P450 CYP2C9 locus. Pharmacogenetics6, 429–439. 10.1097/00008571-199610000-00007
48
Sugihara M. Takeuchi S. Sugita M. Higaki K. Kataoka M. Yamashita S. (2015). Analysis of intra- and intersubject variability in oral drug absorption in human bioequivalence studies of 113 generic products. Mol. Pharm.12, 4405–4413. 10.1021/acs.molpharmaceut.5b00602
49
Sullivan-Klose T. H. Ghanayem B. I. Bell D. A. Zhang Z. Y. Kaminsky L. S. Shenfield G. M. et al (1996). The role of the CYP2C9-Leu359 allelic variant in the tolbutamide polymorphism. Pharmacogenetics6, 341–349. 10.1097/00008571-199608000-00007
50
Takahashi H. Echizen H. (2001). Pharmacogenetics of warfarin elimination and its clinical implications. Clin. Pharmacokinet.40, 587–603. 10.2165/00003088-200140080-00003
51
Takamatsu N. Welage L. S. Hayashi Y. Yamamoto R. Barnett J. L. Shah V. P. et al (2002). Variability in cimetidine absorption and plasma double peaks following oral administration in the fasted state in humans: correlation with antral gastric motility. Eur. J. Pharm. Biopharm.53, 37–47. 10.1016/s0939-6411(01)00207-7
52
Timmermans P. B. Wong P. C. Chiu A. T. Herblin W. F. Benfield P. Carini D. J. et al (1993). Angiotensin II receptors and angiotensin II receptor antagonists. Pharmacol. Rev.45, 205–251. 10.1016/s0031-6997(25)00446-6
53
Toutain P. L. Bousquet-Mélou A. (2004). Plasma terminal half-life. J. Vet. Pharmacol. Ther.27, 427–439. 10.1111/j.1365-2885.2004.00600.x
54
Tsume Y. Amidon G. L. (2010). The biowaiver extension for BCS class III drugs: the effect of dissolution rate on the bioequivalence of BCS class III immediate-release drugs predicted by computer simulation. Mol. Pharm.7, 1235–1243. 10.1021/mp100053q
55
U Y. Tybring G. Hidestrand M. Oscarson M. Ingelman-Sundberg M. Dahl M. L. et al (2001). Role of CYP2C9 polymorphism in losartan oxidation. Drug Metab. Dispos. Biol. Fate Chem.29, 1051–1056.
56
Wennerholm A. Nordmark A. Pihlsgård M. Mahindi M. Bertilsson L. Gustafsson L. L. (2006). Amodiaquine, its desethylated metabolite, or both, inhibit the metabolism of debrisoquine (CYP2D6) and losartan (CYP2C9) in vivo. Eur. J. Clin. Pharmacol.62, 539–546. 10.1007/s00228-006-0121-3
57
Williamson K. M. Patterson J. H. McQueen R. H. Adams K. F. J. Pieper J. A. (1998). Effects of erythromycin or rifampin on losartan pharmacokinetics in healthy volunteers. Clin. Pharmacol. Ther.63, 316–323. 10.1016/S0009-9236(98)90163-1
58
Yasar U. Forslund-Bergengren C. Tybring G. Dorado P. Llerena A. Sjöqvist F. et al (2002). Pharmacokinetics of losartan and its metabolite E-3174 in relation to the CYP2C9 genotype. Clin. Pharmacol. Ther.71, 89–98. 10.1067/mcp.2002.121216
59
Yun C. H. Lee H. S. Lee H. Rho J. K. Jeong H. G. Guengerich F. P. (1995). Oxidation of the angiotensin II receptor antagonist losartan (DuP 753) in human liver microsomes. Role of cytochrome P4503A(4) in formation of the active metabolite EXP3174. Drug Metab. Dispos. Biol. Fate Chem.23, 285–289. 10.1016/s0090-9556(25)06533-x
60
Zanger U. M. Schwab M. (2013). Cytochrome P450 enzymes in drug metabolism: regulation of gene expression, enzyme activities, and impact of genetic variation. Pharmacol. Ther.138, 103–141. 10.1016/j.pharmthera.2012.12.007
61
Zanger U. M. Turpeinen M. Klein K. Schwab M. (2008). Functional pharmacogenetics/genomics of human cytochromes P450 involved in drug biotransformation. Anal. Bioanal. Chem.392, 1093–1108. 10.1007/s00216-008-2291-6
62
Zhou Y. Ingelman-Sundberg M. Lauschke V. M. (2017). Worldwide distribution of cytochrome P450 alleles: a meta-analysis of population-scale sequencing projects. Clin. Pharmacol. Ther.102, 688–700. 10.1002/cpt.690
Summary
Keywords
arterial hypertension, losartan, pharmacokinetics, pharmacodynamics, CYP2C9, mathematical modeling, BioUML, personalized medicine
Citation
Babaev D, Kutumova E and Kolpakov F (2025) Mathematical modeling of pharmacokinetics and pharmacodynamics of losartan in relation to CYP2C9 allele variants. Front. Syst. Biol. 5:1504077. doi: 10.3389/fsysb.2025.1504077
Received
30 September 2024
Accepted
11 April 2025
Published
21 May 2025
Volume
5 - 2025
Edited by
Shayn Peirce-Cottler, University of Virginia, United States
Reviewed by
Ion Moraru, University of Connecticut Health Center, United States
Takeshi Hase, Tokyo Medical and Dental University, Japan
Updates
Copyright
© 2025 Babaev, Kutumova and Kolpakov.
This is an open-access article distributed under the terms of the Creative Commons Attribution License (CC BY). The use, distribution or reproduction in other forums is permitted, provided the original author(s) and the copyright owner(s) are credited and that the original publication in this journal is cited, in accordance with accepted academic practice. No use, distribution or reproduction is permitted which does not comply with these terms.
*Correspondence: Dmitry Babaev, babaevds02042001@yandex.ru
Disclaimer
All claims expressed in this article are solely those of the authors and do not necessarily represent those of their affiliated organizations, or those of the publisher, the editors and the reviewers. Any product that may be evaluated in this article or claim that may be made by its manufacturer is not guaranteed or endorsed by the publisher.