 Jean-Sébastien Moquet1,2*
 Julien Bouchez1
 Jean-Jacques Braun3,4,5
 Sakaros Bogning6
 Auguste Paulin Mbonda7Sébastien Carretier3
 Vincent Regard3Jean-Pierre Bricquet8Marie-Claire Paiz9
 Emmanuel Mambela9
 Jérôme Gaillardet1
- 1Université de Paris, Institut de physique du globe de Paris, CNRS, Paris, France
- 2UMR7327 Institut des Sciences de la Terre d'Orléans (ISTO), Université d'Orléans-CNRS/INSU-BRGM, Orléans, France
- 3UMR5563 Géosciences Environnement Toulouse (GET), Université de Toulouse/CNRS/IRD, Toulouse, France
- 4Institut de Recherches Géologiques et Minières/Centre de Recherches Hydrologiques, BP 4110, Yaoundé, Cameroon
- 5International Joint Laboratory DYCOFAC, IRGM-UY1-IRD, BP 1857, Yaoundé, Cameroon
- 6Departement of Earth Sciences, Faculty of Sciences, University of Douala, Douala, Cameroon
- 7National Center for Scientific and Technical Research (CENAREST), Libreville, Gabon
- 8Hydrosciences Montpellier, Montpellier, France
- 9The Nature Conservancy, Libreville, Gabon
Despite the absence of tectonic activity, cratonic environments are characterized by strongly variable, and in places significant, rock weathering rates. This is shown here through an exploration of the weathering rates in two inter-tropical river basins from the Atlantic Central Africa: the Ogooué and Mbei River basins, Gabon. We analyzed the elemental and strontium isotope composition of 24 water samples collected throughout these basins. Based on the determination of the major element sources we estimate that the Ogooué and Mbei rivers total dissolved solids (TDS) mainly derive from silicate chemical weathering. The chemical composition of the dissolved load and the area-normalized solute fluxes at the outlet of the Ogooué are similar to those of other West African rivers (e.g., Niger, Nyong, or Congo). However, chemical weathering rates ( rate expressed as the release rate of the sum of cations by silicate chemical weathering) span the entire range of chemical weathering intensities hitherto recorded in worldwide cratonic environments. In the Ogooué-Mbei systems, three regions can be distinguished: (i) the Eastern sub-basins draining the Plateaux Batéké underlain by quartz-rich sandstones exhibit the lowest rates, (ii) the Northern sub-basins and the Mbei sub-basins, which drain the southern edge of the tectonically quiescent South Cameroon Plateau, show intermediate rates and (iii) the Southern sub-basins characterized by steeper slopes record the highest rates. In region (ii), higher DOC concentrations are associated with enrichment of elements expected to form insoluble hydrolysates in natural waters (e.g., Fe, Al, Th, REEs) suggesting enhanced transport of these elements in the colloidal phase. In region (iii), we suggest that a combination of mantle-induced dynamic uplift and lithospheric destabilization affecting the rim of the Congo Cuvette induces slow base level lowering thereby enhancing soil erosion, exhumation of fresh primary minerals, and thus weathering rates. The study points out that erosion of lateritic covers in cratonic areas can significantly enhance chemical weathering rates by bringing fresh minerals in contact with meteoric water. The heterogeneity of weathering rates amongst cratonic regions thus need to be considered for reconstructing the global, long-term carbon cycle and its control on Earth climate.
Introduction
Over geological time scales, chemical weathering acts as a major player of the global biogeochemical cycles of elements in the Earth's Critical Zone. In particular, silicate weathering is known to consume CO2 through mineral hydrolysis and neutralization of base cations hosted by silicate minerals, and therefore can contribute to regulating the global climate (Berner et al., 1983). Tectonic activity is thought to be a primary driver of chemical weathering (Raymo and Ruddiman, 1992; Herman et al., 2013). Orogenic uplift associated with collision between tectonic plates forms the major world mountain chains, favoring mechanical erosion, and the exposure of fresh primary mineral surfaces to meteoric water and subsequent chemical weathering. This phenomenon has long been suggested to be responsible for the gradual cooling of the Earth over the Cenozoic under the effect of global mountain uplift (Herman et al., 2013; Becker et al., 2018), although this hypothesis is strongly debated (e.g., Godderis, 2010; Willenbring and Von Blanckenburg, 2010; Von Blanckenburg et al., 2015; Norton and Schlunegger, 2017; Caves Rugenstein et al., 2019; Hilton and West, 2020; Penman et al., 2020). By contrast, tectonically quiescent cratonic areas, which represent almost 70% of the continents surface (Artyushkov et al., 2018), have long been considered to be relatively inefficient in terms of chemical weathering compared to erosive, mountainous regions (e.g., Carson and Kirkby, 1972; Stallard, 1985). Indeed, especially in the humid tropics, these low-relief settings favor the formation of deep regolith covers, chemically depleted in base cations and limiting water-bedrock interactions due to slow water percolation from the surface to the bedrock (e.g., Stallard and Edmond, 1987; Braun et al., 2005, 2012; West, 2012; Riebe et al., 2017). While these hot and humid cratonic areas commonly exhibit low silicate weathering rates by comparison with orogenic areas (e.g., Gaillardet et al., 1999b; Moon et al., 2014) they dominate the intertropical regions surface area and, therefore, represent a significant proportion of the global delivery of dissolved matter to the oceans (Milliman and Farnsworth, 2011; Von Blanckenburg et al., 2015). In particular, according to modeling results (Goddéris et al., 2008) the net weathering budget of the intertropical cratonic areas and their role on the long term CO2 budget may have been underestimated and need to be investigated in more detail to characterize their potential role in the Cenozoic global climate evolution.
River hydrochemical analyses are essential tools for estimating catchment-scale silicate weathering fluxes, through the quantification of the export of silicate-derived dissolved cations (Gaillardet et al., 1999b). River basins draining cratonic areas exhibit contrasted weathering rates (expressed as the drainage-area normalized flux of the sum of cations released by silicate chemical weathering, rate) from those recorded under boreal conditions ( rate < 1 t km−2 yr−1; Millot et al., 2002; Zakharova et al., 2005, 2007; Pokrovsky et al., 2015) to those measured in India in the Kavery (Pattanaik et al., 2013) and Nethravati (Gurumurthy et al., 2012) basins ( rate > 15 t km−2 yr−1). Various drivers can be invoked to explain this spatial variability. For example, the Nsimi experimental watershed is located in a tectonically quiescent area of the Nyong river basin (South Cameroon Plateau) where swamp environments are widespread. There, organic-rich waters increase the mobilization and transfer of some elements generally considered as immobile (e.g., Al, Fe, Th, Zr) through colloidal transport (Oliva et al., 1999; Viers et al., 2000; Braun et al., 2005, 2012). Such enhancement of weathering in the presence of organic matter has also been reported for boreal Siberian rivers rich in dissolved organic matter and poor in suspended matter (Zakharova et al., 2005, 2007; Pokrovsky et al., 2015, 2016). Indeed, in this type of environment such environments, organo-metal complexes form, leading to the solubilization of Al, Fe, Th, and Zr and thus to the breakdown of silicate minerals (e.g., Oliva et al., 1999; Tamrat et al., 2019). The Kaveri and Nethravati basins drain the Indian craton and exhibit low annual runoff (<220 mm yr−1) by comparison with other tropical cratonic areas. In this region, intense monsoons can enhance weathering through strong erosional processes, exposing of felsic granulites and gneissic rocks (Pattanaik et al., 2013; Meunier et al., 2015). In this case, climate and erosion act as dominant drivers of weathering rates. Finally, in the small monolithologic basins of the Mule Hole-India tropical watershed, the presence of minor/accessory minerals (Ca-bearing minerals like epidote and apatite), the dissolution of smectite and calcite, as well as the drainage characteristics of weathering profiles have all been shown to play a key role on weathering budget (Braun et al., 2009; Violette et al., 2010). However, most of the aforementioned work has focused on a local scale (i.e., soil profiles or small watersheds) or, when dealing with weathering fluxes measured at a larger scale, the variability of weathering rates amongst cratonic environments was not considered to be part of the scope of the study.
The existence of sustained uplift due to mantle dynamics or lithospheric destabilization (Cottrell et al., 2004; Jaupart et al., 2007; Hu et al., 2018) in cratonic areas has not been considered yet as a potential driver of Earth denudation. Although much slower and occurring over larger spatial scales than mountain uplift mediated by faulting in collisional tectonic settings (Lamb and Watts, 2010; Flament et al., 2013), mantle-induced dynamic uplift or lithospheric destabilization can lead to lowering of the geomorphological base level that in turn can trigger physical erosion processes (Kusky et al., 2014) as observed for the Southern African Craton (Braun et al., 2014), North China Craton (Zhu et al., 2017) or Brazilian Shield (Rodríguez Tribaldos et al., 2017). Such slow, large-scale mantle and lithospheric dynamics, in conjunction to eustatic changes, have also been shown to control relief as well as erosion and sedimentary processes (Conrad and Husson, 2009; Guillocheau et al., 2015). Presumably, physical erosion processes sustained by mantle induced dynamic uplift or lithospheric destabilization in cratonic settings could lead to significant rock weathering through soil erosion and subsequent increased exposure of “fresh” mineral surfaces—a phenomenon we set out to address in the present study.
The Ogooué River Basin, western Central Africa, is located between the western border of the Congo cuvette and the south of the Cameroun Plateau. This intra-cratonic basin experiences a homogeneous tropical humid climate (Bogning et al., 2018, 2020) and has undergone successive and contrasted uplift phases over the Cenozoic (Guillocheau et al., 2015). The present study provides the opportunity to explore the variability in weathering fluxes and rates in the large Ogooué River Basin (drainage area of ~ 215,000 km2) as well in the neighboring, smaller Mbei River Basin (drainage area of ~ 1,800 km2) with respect to geomorphology, tectonics, and lithology. Based on discrete hydrochemical analyses of the main Ogooué River tributaries, we assess, for the first time, the Ogooué weathering fluxes and their variability throughout the basin. These new constraints allow us to explore the main potential drivers controlling the variability in weathering rates in cratonic areas and to discuss the implications for the long-term evolution of the Earth's climate.
Study Area
The equatorial Ogooué River basin covers ~215,000 km2 (location: between 3°9'S and 2°4'N and between 8°5'E and 14°3E; Figure 1). Around 85% of the basin lies within Gabon, 12% in the Republic of Congo and the remaining area in Cameroon and Equatorial Guinea. With an annual discharge of 4,750 m3 s−1 (Bogning et al., 2018), the Ogooué is the third largest river in terms of annual discharge along the African West Coast after the Congo (~41,000 m3 s−1; Laraque et al., 2009) and the Niger (~6,000 m3 s−1) rivers (Dai and Trenberth, 2002). In addition to the Ogooué Basin, this study reports on the hydrochemistry of the smaller Mbei River (location: between 0°1'N and 1°1'N and between 10°7'E and 10°4E; Figure 1), which is a northern tributary of the Komo River discharging to the Atlantic Ocean around 150 km north of the Ogooué River outlet. The Mbei River is characterized by an annual discharge of ~60 m3 s−1 (ORSTOM, 1964; Njutapvoui Fokouop, 2017; data only available for the period 1964–1973) and a drainage area of ~ 1,800 km2. According to the Köppen-Geiger classification, the Ogooué and Mbei basins experience a tropical savanna climate. The Ogooué Basin receives around 2,000 mm yr−1 in annual precipitation, which leads to a runoff of around 700 mm yr−1 (Mahe et al., 2013; Bogning et al., 2018; Kittel et al., 2018). The basin exhibits a bi-modal precipitation regime with wet periods from March to May and from October to December with a maximal monthly rainfall of ~200 and ~300 mm month−1, respectively. The dry period extends from June to August with a minimum monthly rainfall <15 mm month−1 in July. The mean annual temperature is around 24°C and is relatively invariant across the year. In the present work, the study area corresponds to the Ogooué Basin upstream from the Lambaréné station (Figure 2F) and covers 206,000 km2, representing 96% of the entire Ogooué Basin (Figure 1), combined to four Mbei tributaries each covering basin areas <500 km2. At the Lambaréné station, the Ogooué River discharge variation follows the rainfall regime of the basin (Mahe et al., 1990). Overall, the seasonal variability in discharge (SV as quantified by the ratio between maximum and minimum monthly discharge; SV = 3.7; Figure 3) is relatively low by comparison with other intertropical rivers experiencing a monsoonal regime (e.g., Pacific Peruvian rivers: SV = 6–21; Moquet et al., 2018; Nethravati River: SV = 600–1,100; Gurumurthy et al., 2012). The elevation of the Ogooué basin, as considered in the present study, extends from 914 m.a.s.l (Lolo River sub-basin upstream) to 20 m.a.s.l. (Lambaréné station).
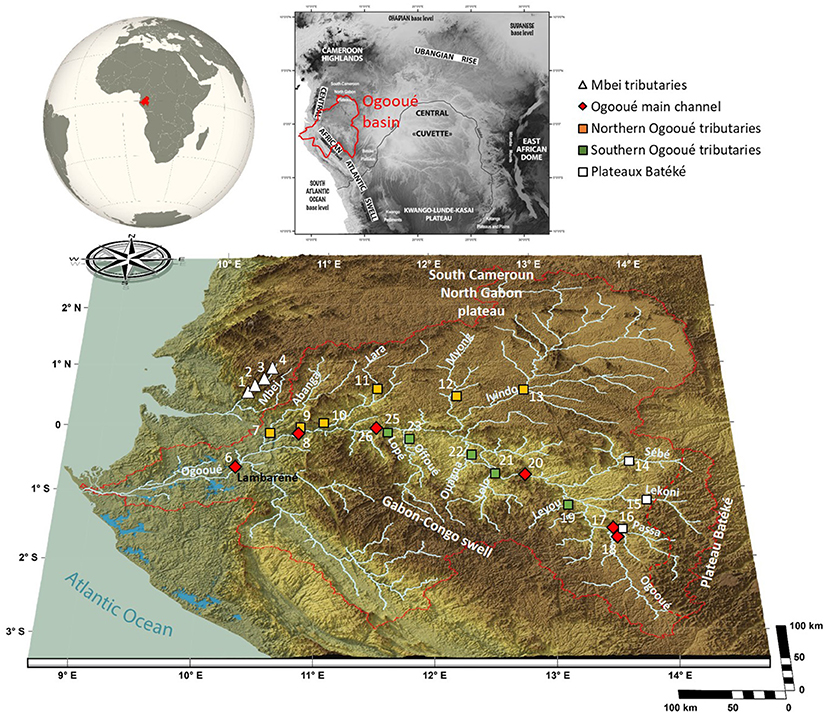
Figure 1. Study area and sampling locations. The regional map of the study area is modified from Guillocheau et al. (2015).
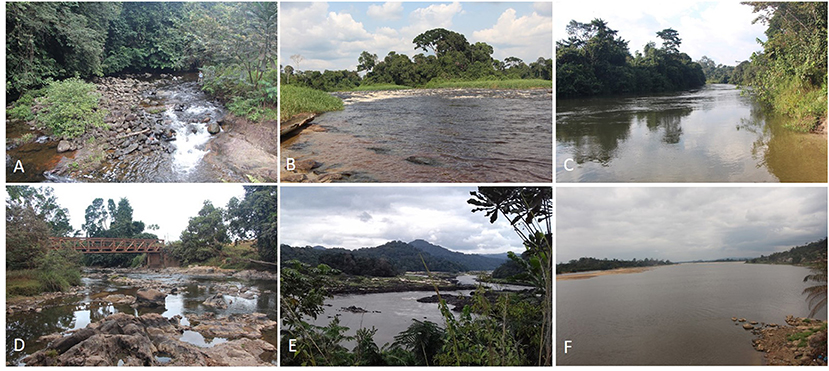
Figure 2. Photos of (A) Mbei river tributary 1, (B) Ivindo river at Loaloa (a Northern basin), (C) Lékoni river at Lakeni (Plateaux Batéké basin), (D) Lopé river at Lopé (a Southern basin), (E) Ogooué River at Ndjolé, and (F) Ogooué River at Lambaréné.
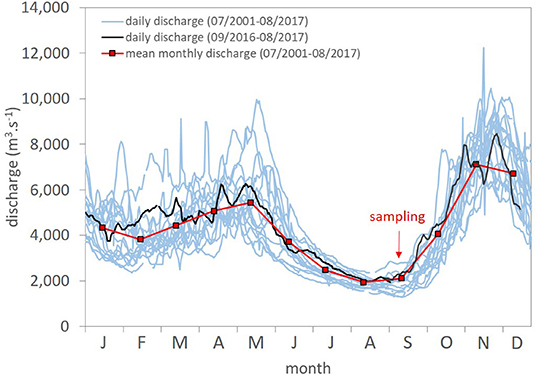
Figure 3. Daily discharge (07/2001 to 08/2017) and mean monthly discharge of the Ogooué River at the Lambaréné station (Bogning et al., 2018). See photo of the Ogooué River at Lambaréné City (Figure 2F).
The Ogooué Basin can be separated into three geomorphological domains (Figure 1; Table 1). The Plateaux Batéké region (Eastern sub-basins) located close to the Congo border is composed of Cenozoic sandstone (pure quartz; Seranne et al., 2008) and is active in terms of dynamic uplift (Guillocheau et al., 2015; Weber et al., 2016). The rest of the basin is underlain by the Archean basement of the Congo craton and by remnants of Proterozoic orogenic belts. The rivers of the Northern sub-basins exclusively drain granitic rocks of the Archean craton whereas the Southern sub-basins are to a significant extent underlain by Paleoproterozoic sedimentary rocks in addition to the typical Archean cratonic rocks (gneiss and undifferencied orthogneiss; Thiéblemont et al., 2009). Some sub-basins in the Northern part (Missanga basin) and in the Southern part (Leyou basin) partly drain Paleoproterozoic volcanic and volcanic sedimentary rocks (Thiéblemont et al., 2009). The southernmost area is characterized by the presence of the Ogoulou-Offoué and Ikoy-Ikobé Faults which produce steeper relief, particularly in the Lopé sub-basin (Weber et al., 2016). The central Ogooué channel flows over Quaternary fluvial sediments laying on the Paleoproterozoic Francevilian metasediments (1,800–1,600 Ma—Seranne et al., 2008; Weber et al., 2016). The Mbei basin is essentially underlain by the Archean craton. Based on Nd radiogenic isotopes measurements, Thiéblemont et al. (2014) show that the whole Ogooué Basin is covered by a homogenous 1–3 meter-thick sandy to clayey lateritic surface cover (dated at around 3,000–2,000 years BP) named “Cover Horizon” inherited from silt- to clay-sized aeolian deposits transported from the Northern part of the Namibia desert.
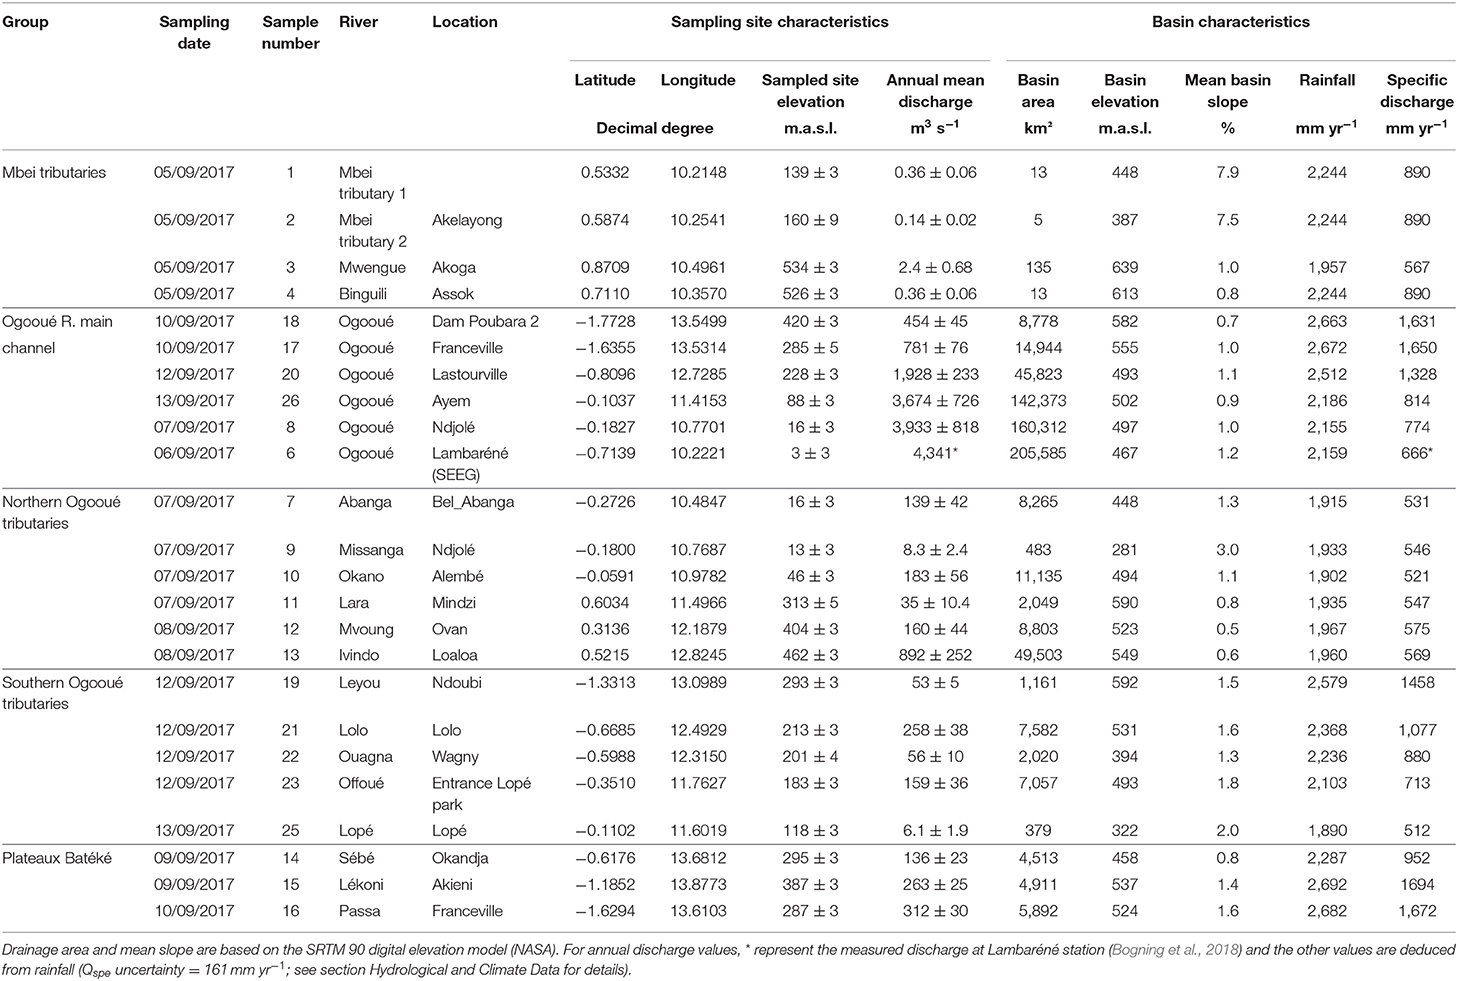
Table 1. Main characteristics of the Mbei and Ogooué rivers and their tributaries.
The study area is essentially covered by rainforest with patchy savanna grassland and is home to a high biodiversity (e.g., Koffi et al., 2011), but has shifted following climate changes over the last 26,000 years (Kim et al., 2010; Oslisly et al., 2013). Approximately 650,000 people live in the Ogooué Basin resulting in a low population density of <3 inhabitants km−2, mostly concentrated along the river courses (UNEP, 2010). Uranium and manganese mining activity is reported in the Southern Upper Ogooué area and future dam development may potentially affect river connectivity (Cutler et al., 2020). However, overall the contemporary anthropogenic influence on the Ogooué River system can be assumed as insignificant in terms of chemistry, water flow, and sediment fluxes.
Materials and Methods
Sampling and in-situ Analyses
Surface water samples were collected at 24 locations in the Ogooué main channel (six samples), Ogooué's tributaries (14 samples), and in the Mbei River tributaries (four samples) in September 2017 (Figures 1, 2; Table 1).
Electrical conductivity (normalized to a temperature of 25°C), pH and water temperature were measured in situ. We followed the protocol of Bouchez et al. (2012) for water sampling and filtration. Briefly, 10 L of surface water were sampled with a “plastic bag” at the middle of the river course, when possible, or from the bank in a zone of significant water velocity. The plastic bags were filled with a graduated, 5 L bucket and a funnel, both previously rinsed with water from the river being sampled. The bags were rinsed three times with riverine water prior to sampling. The 10 L water samples were transported in a cool box to limit their warming and were filtered 2–10 h later through PES (Millipore) 0.22–μm porosity, pre-weighted filter membranes (142 mm diameter). The filtration unit was filled three times with ~1 L of water sample, each of which was discarded after filtration to pre-condition the filter unit and the membrane. Gloves were used to avoid contamination during the filtration process. The remaining filtered water was splitted into three aliquots: one unacidified aliquot of 30 mL for major anion analyses, one acidified (using three drops of mono-distilled nitric acid to reach a pH ~ 2) aliquot of 1L for cation, trace element, and 87Sr/86Sr analyses, and one acidified (using HCl) aliquot of 60 mL stored in an amber glass tube for dissolved organic carbon (DOC) analysis. Alkalinity was determined on the field using the Gran method (Gran, 1950). Note that the filtered water samples (<0.22 μm) are considered to reflect primarily a “truly dissolved” fraction, but are likely to include organic and inorganic colloids, depending on the element considered. This is further discussed in section Dynamics of Organic Matter and Colloids.
Analytical Methods
All laboratory procedures and measurements were performed at the PARI (Plateau d'Analyse Haute Résolution) analytical platform of the IPGP (Institut Physique du Globe de Paris). Major cations (Ca2+, Na+, Mg2+, K+) and major anions (Cl−, , and ) concentration were determined using ion chromatography (CS16 cationic colomn and AS9HC anionic column—IC5000+DIONEX THERMO). Trace elements were analyzed by Quadrupole-ICP-MS (ICP-QMS 7900 Agilent). For major element concentration, the analytical uncertainty is around 5% (95% confidence interval), and for most trace elements, the analytical uncertainty is <5%. Accuracy was checked using repeated measurements of the river water reference material SLRS-6 (St-Lawrence River water, National Research Council of Canada), with concentration measurements being mostly <10% away from the certified concentrations. DOC concentrations was quantified using a Shimadzu TOC-V CSH with a relative analytical uncertainty <5%. Major element and DOC concentrations are reported in Table 2 and trace element concentration are reported in Table 3.
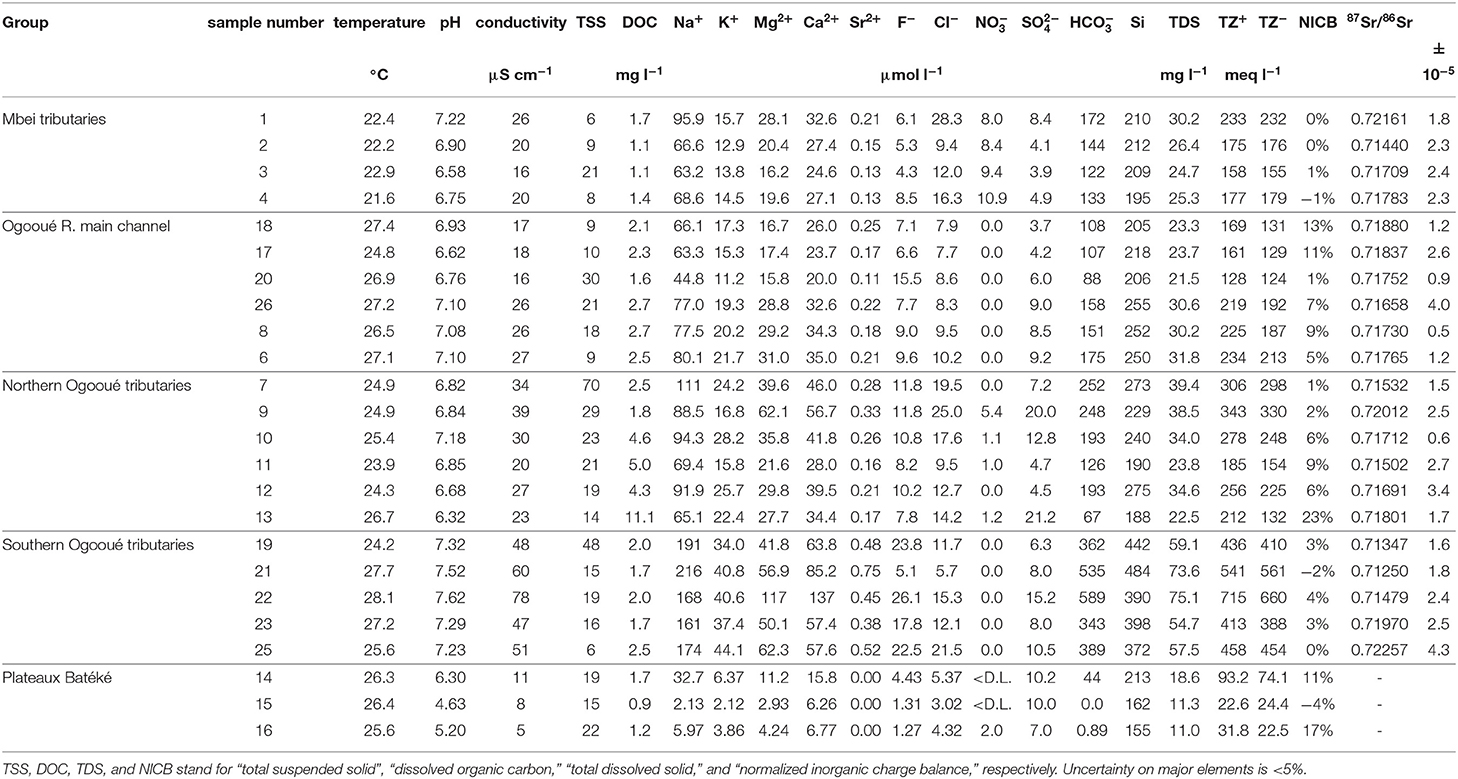
Table 2. Physico-chemical parameters, major elements concentrations, DOC concentrations, and strontium isotopic ratios (87Sr/86Sr) measured in the river dissolved phase (i.e., <0.22 μm) of the Ogooué and Mbei and basins.
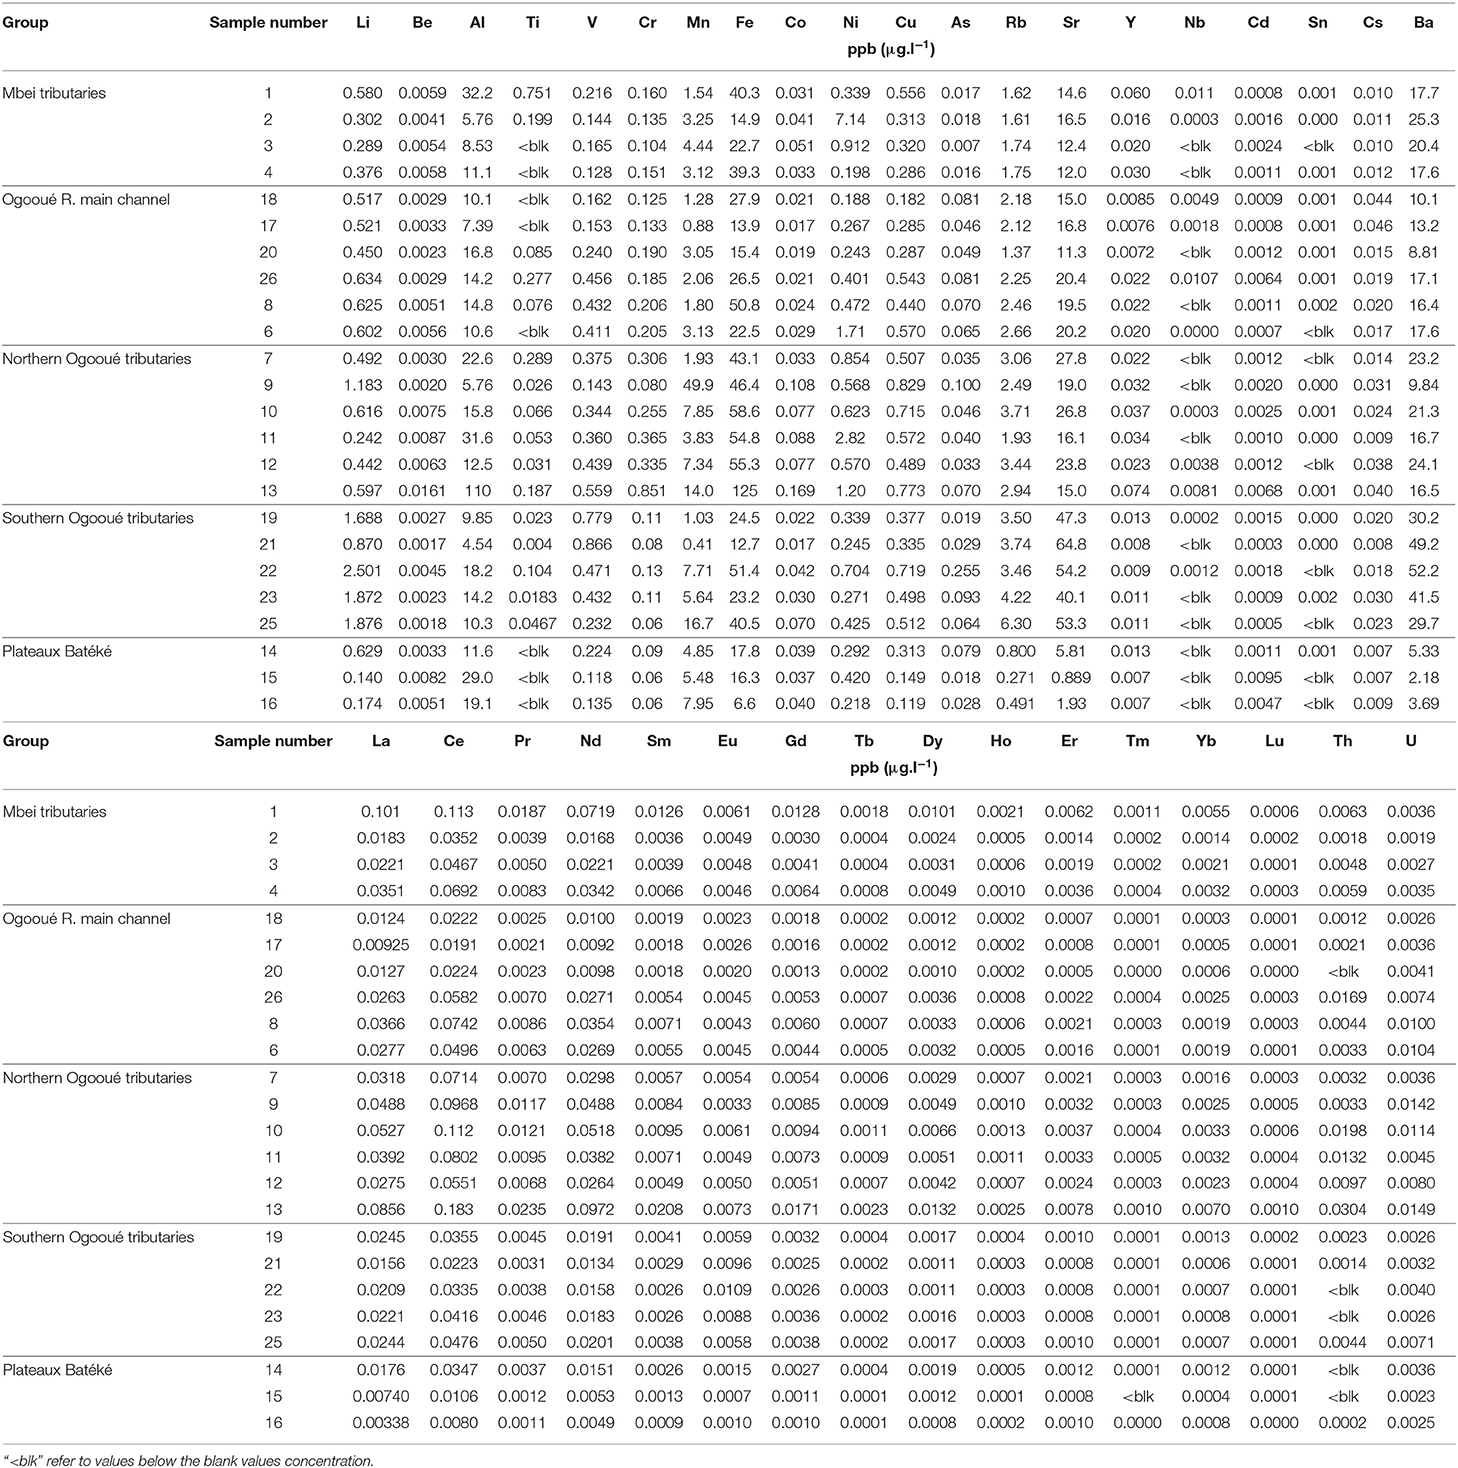
Table 3. Concentration (in ppb or μg.l−1) of trace elements in the dissolved phase (i.e., <0.22 μm) of the Ogooué and Mbei basins.
The TDS (Total Dissolved Solids) concentration corresponds to the sum of the cations (Ca2+, Mg2+, Na+, and K+), the anions (, , and Cl−) and SiO2 concentrations, all expressed in mg l−1 (Table 2).
Isotopic Measurements
The chemical purification of Sr (~200 ng) was performed using extraction chromatography (Sr-SPEC resin; Eichrom) before isotope analysis according to Hajj et al. (2017) with a total blank of <0.5 ng along the Sr separation and MC-ICP-MS measurements procedures. The Sr isotopic composition was measured on a 50 ppb Sr solution within a 0.5 N HNO3 matrix by MC-ICP-MS (Neptune, ThermoFisher Scientific). Each sample was analyzed three times. The instrumental mass fractionation was corrected for using a 86Sr/88Sr ratio of 0.1194. An average internal precision of ± 10 ppm (2σ) was obtained and the quality of the 87Sr/86Sr ratio measurements was verified by repeated analysis of the NIST SRM987 standard (n = 21; measured value: 87Sr/86Sr = 0.710320 ± 0.000015; certified range: 87Sr/86Sr = 0.71034 ± 0.00026; accepted NIST SRM987 value: 87Sr/86Sr = 0.71026 ± 0.00002; Stein et al., 1997; Swoboda et al., 2008). Uncertainty on the 87Sr/86Sr measurements are lower than 0.000043 (95% confidence interval on the three replicates; Table 2).
Discrimination of Solute Sources
To discriminate between the different river solutes sources we use a “forward method” (Garrels and MacKenzie, 1972; Moquet et al., 2011), consisting in the application of two calculation steps: atmospheric correction and quantification of the relative roles of silicate and carbonate weathering.
Atmospheric Inputs
In the studied basins, the primary source of Cl− is precipitation as evaporite rocks are virtually absent from the Ogooué and Mbei basins (Thiéblemont et al., 2009) and because anthropogenic inputs can be considered as negligible (see section Study Area). Therefore, for all water samples, we can apply the following formula to estimate the atmospheric contribution of each solute (X) concentration ([Xrain] in μmoles l−1):
with X= , Na+, Ca2+, Mg2+, K+, and Sr2+, [] the total Cl− concentration in the river, and the X/Cl− molar ratio of seawater, considered here as the sole source of ions to the rain (Berner and Berner, 1987). Then the concentration of the element X corrected from the atmospheric inputs (annotated [X*]) is calculated as:
Thereafter, the “*” symbol stands for concentrations corrected from atmospheric inputs.
Contribution of Silicate and Carbonate Weathering
After correction from rainfall inputs, the dissolved load of the rivers is considered to be the result of weathering of silicate and carbonate minerals. The quantitative estimation of the sum of the cations concentrations delivered by silicate weathering ([] in mg l−1) is:
with [Xsil] the concentration of the cation X (with X = Na+, Ca2+, Mg2+ and K+) derived from silicate weathering (here in μmoles l−1) and MC the molar mass of the corresponding cation C (in g mol−1).
We consider that all the K+ and the Na+ remaining after correction from atmospheric inputs is derived from silicate weathering only:
The concentrations of Ca2+ and Mg2+ derived from silicate weathering can then be calculated as:
As the Ogooué Basin drains silicate rocks similar to those of the Congo basin (cratonic plutonic and metamorphic lithology) to estimate [Casil] and [Mgsil] and thus [] we used the value of (Ca/Na)sil = 0.35 ± 0.15 and (Mg/Na)sil = 0.24 ± 0.12 (mol/mol) determined by Négrel et al. (1993) and used for the global scale by (Gaillardet et al., 1999b). Note that these values were previously determined based on water geochemistry of rivers draining only the corresponding rock types, and not the rocks themselves, such that this method does not rely on any particular assumption regarding the congruent or incongruent character of weathering reactions.
Without alternative proton sources such as pyrite oxidation (e.g., Calmels et al., 2007; Yu et al., 2020), the main proton sources for mineral hydrolysis is atmospheric / soil CO2 dissolution in water. Therefore, the estimation of the CO2 consumption associated with silicate weathering (CO2 sil in μmoles l−1) can be calculated following the equation:
After estimating the contribution of silicate weathering to the river dissolved load, the remaining dissolved Ca2+ and Mg2+ is attributed to carbonate weathering, the result in terms of total concentration ([] in mg l−1) being therefore:
From the metrics mentioned above, we can finally calculate the three components of TDS concentration (mg l−1; Figure 5):
Where [SiO2] is the SiO2 concentration express in mg l−1, MHCO3− is the molar mass and
Note that [] is entirely derived from CO2 consumption during silicate weathering while half of the [] derives from CO2 consumption and the other half from the carbonate mineral itself. Also, note that here all SiO2 is assumed to derive from silicate weathering in these calculations. This set of [TDSi] and [] (equations 11-13) parameters indicates the concentration of TDS and TZ+ apportioned to each specific source process i (atmospheric inputs, silicate weathering, and carbonate weathering).
The fluxes (F) and area-normalized fluxes (Fspe) were calculated by multiplying the concentrations of TDS, , and CO2 sil by the discharge (Q) and the drainage area-normalized discharge (Qspe also named specific discharge), respectively (see the section Hydrological and Climate Data about the calculation of Q and Qspe). For silicate weathering we also calculated the chemical denudation (Dchem sil) expressed in m Ma−1 using the concentration of solutes (Casil, Mgsil, Ksil, Nasil, and SiO2 in mg l−1), expressed as equivalent oxides (CaO, MgO, K2O, Na2O, SiO2 in mg l−1) and using a rock density (d) of 2.7 g cm−3 (West et al., 2005; Bouchez and Gaillardet, 2014):
with MO the molar mass of O. This Dchem sil parameter expresses the rate at which silicate weathering processes result in a lowering of the Earth surface.
Hydrological and Climate Data
Drainage areas and mean slopes upstream of the sampling points were extracted from the digital elevation model SRTM 90 (Shuttle Radar Topography Mission; NASA) using ArgGis 10.3 (Esri) and QGis 2.18. The lithological composition for each sub-basin was also extracted from the lithological map of Gabon using ArcGis 10.3 (Esri) (Thiéblemont et al., 2009; see Supplementary Table 1).
The daily water discharge of the Ogooué River is available only for the Lambaréné station from Bogning et al. (2018) for the period from July 2001 to August 2017 (Figure 3), meaning that the sampling campaign was performed just after the end of the precipitation record used here. Note that according to the discharge record, which does includes the period where water sampling was carried out (September 2017), the discharge pattern of the hydrological year October 2016–September 2017 is very close to the mean pattern observed for the previous 16 years. Therefore, hydrological and precipitation conditions of the year of water sampling can be considered as representative of the longer period used to constrain hydrological fluxes. We calculated an annual discharge over this period to assess an annual solute flux based on the discrete sampling performed in this study.
To calculate the annual discharge of other sampled sites we apply a statistical approach based on a regional polynomial relationship between specific discharge (Qspe) and rainfall (P) as performed by Scherler et al. (2017) to estimate Qspe in ungauged Himalayan rivers. We first calculated the annual mean rainfall received by each studied sub-basin from the TRMM dataset (extracted for the Ogooué Basin over the period 1998–2015 according to the TRMM data–https://gpm.nasa.gov/). The calculated rainfall for these basins ranges from 1,890 to 2,692 mm.yr−1. At the Lambaréné station, P = 2,159 mm yr−1 and Qspe is calculated according to:
with Q the discharge (136 109 m3 yr−1) and S the basin area (205.9 103 km2). At Lambaréné, Qspe is therefore equal to 666 mm yr−1 (Table 1).
Second, we compiled a new database (Supplementary Figure 2; Supplementary Table 3) for both specific discharge (Qspe) and rainfall (P) for rivers of western Central Africa (Congo: Becker et al., 2018; Laraque et al., 2020; Cameroun rivers: BVET observatory database/https://mtropics.obs-mip.fr/catalog-m-tropics and Sighomnou, 2004); Atlantic African rivers: (Lienou et al., 2008; Conway et al., 2009). We then fitted a second-order polynomial relationship to the P–Qspe data from rivers submitted to P between 1,500 mm.yr−1 and 3,000 mm yr−1 (n = 32), corresponding to the conditions measured in the Ogooué and Mbei rivers. The equation of the best fit second-order polynomial is:
We then applied this relationship to the P-values estimated for each sub-basin of the Ogooué and Mbei basins. We used the RMSE of the fit (161 mm yr−1) as a measure of the uncertainty on these Qspe estimates (see Supplementary Figure 2), and propagated this uncertainty in the solute flux calculations (see section Solute Flux Calculation). Note that for the Ogooué River at Lambaréné station, for a rainfall of 2,159 mm yr−1, the simulated Qspe is 780 mm yr−1 while the measured Qspe was 666 mm yr−1. The difference between simulated and measured value is therefore 113 mm yr−1 (12%) and is lower than the Qspe uncertainty considered (161 mm yr−1).
Solute Flux Calculation
The area-normalized fluxes (hereafter called Fspe and “rates” when referring to weathering variables) of each solute was estimated by multiplying the concentration of each solute parameters values by the Qspe value estimated at each sampling sites. To compute the area-normalized fluxes for each sub-region of the study area, we substracted the upstream fluxes (F) where necessary (i.e., samples number 17, 20, 26, 8, 6 along the Ogooué River and sample number 10 on the Okano River).
Our river hydrochemistry dataset features only one sampling date. Therefore, the computed solute fluxes might be affected by significant uncertainty if solute concentrations were to vary along the year. We first note that in other West African rivers like the Nyong (Viers et al., 2000), the Niger (Picouet et al., 2002) and the Congo (Laraque et al., 2009) rivers, the TDS concentration varies only slightly with discharge throughout the year. This chemostatic behavior is observed in numerous rivers in the world from small to large catchments (e.g., Godsey et al., 2009), enabling first-order estimations of annual river dissolved fluxes based on a limited sampling time resolution. Indeed, under such conditions, solute fluxes are mainly controlled by discharge variability rather than by concentration variability, thereby providing confidence to our flux estimates based on only one sampling campaign. However, a systematic bias might exist in our flux estimates since our sole sampling campaign was performed during the dry season, when the highest river solute concentrations are usually measured. Existing hydrochemical time series on the neighboring Congo River helps assessing this bias. Using only the hydrochemical data corresponding to the lowest monthly discharge (August) for the Congo River at Brazzaville (HYBAM database, http://so-hybam.org/), TDS and cations fluxes are +10% and +20%, respectively, higher than flux estimates based on monthly data covering the whole hydrological cycle. However, while informative for assessing the reliability of our flux estimates for the Ogooué and Mbei rivers, we did not consider that our data can be corrected for this bias using constraints from the Congo River, as the specifics of solute concentration-discharge relationships in rivers can be influenced by a variety of processes (Chorover et al., 2017). In particular these relationships can depend on reactive transport processes (e.g., Ameli et al., 2017; Kim et al., 2017), biological effects (e.g., Moatar et al., 2017) or, like in large rivers in hydrological conditions similar to the Ogooué river, on specific patterns of mixing between tributaries (Moquet et al., 2016; Bouchez et al., 2017). Therefore, we took the estimated bias from the Congo River as a measure of uncertainty on the Ogooué and Mbei river solute fluxes associated with the sampling strategy, i.e., ±20% and ±10% for cation and TDS fluxes, respectively.
We calculated the fluxes (F, in 103 t y−1 or 106 mol y−1) for the total dissolved solids (TDS), the total dissolved solids corrected from atmospheric inputs (TDS*), dissolved silica (express as SiO2), the cations derived from silicate weathering () and for CO2 consumption associated to silicate weathering (CO2 sil). The corresponding fluxes are called F TDS, F TDS*, F SiO2, F, and F CO2 sil, respectively. The corresponding area-normalized fluxes (also called “specific fluxes” or “rates,” equation 16, in t km−2 y−1 or 103 mol km−2 y−1) are called Fspe TDS, Fspe TDS*, Fspe SiO2, Fspe , and Fspe CO2 sil, respectively (Table 4).
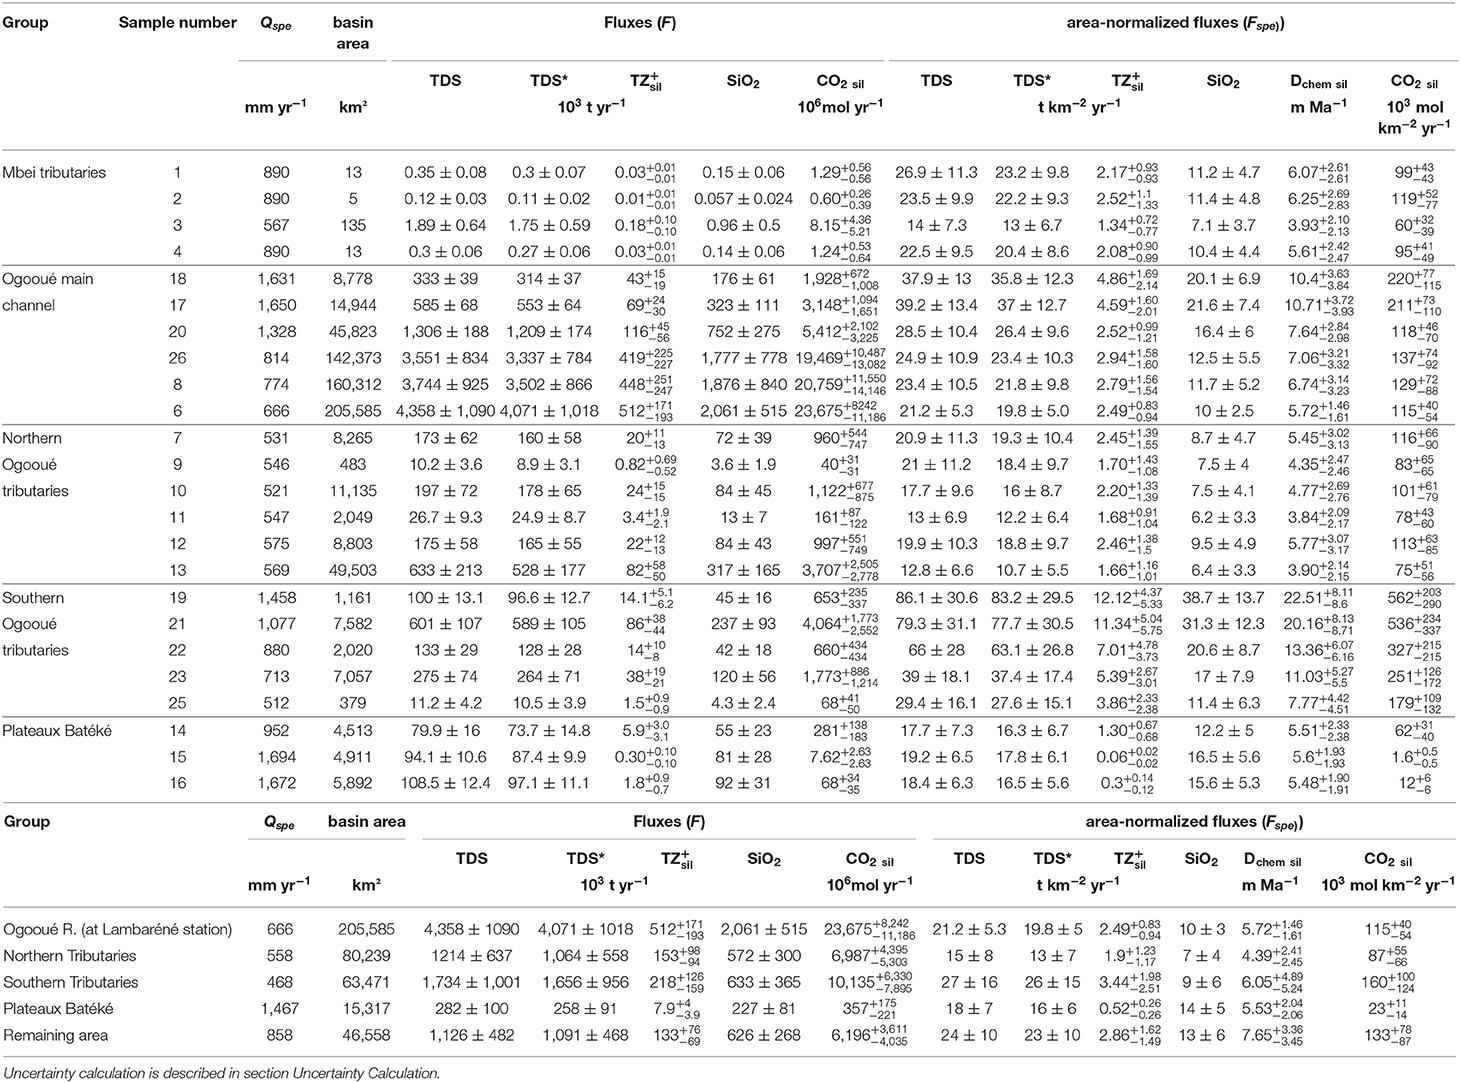
Table 4. River fluxes and area-normalized fluxes of TDS (Total dissolved solids), TDS*(Total dissolved solids corrected from atmospheric inputs), (cations derived from silicate weathering), SiO2, and CO2 sil (CO2 consumption associated to silicate weathering) in the Ogooué and Mbei Basin, and for the main domains of the Ogooué Basin.
Uncertainty Calculation
The uncertainties associated to the calculated flux values (Tables 1, 4 and related figures) take into account the propagation of the uncertainty on the major element concentration measurements (5%), a sensitivity test performed on the Ca/Nasil and Mg/Nasil ratios used in the Equations 6 and 7, the uncertainty on the discharge estimate at each sampling location (RMSE = 161 mm yr−1), and the uncertainty associated to our relatively loose sampling time resolution (20%). Note that the propagation of the uncertainty of Ca/Nasil and Mg/Nasil produces asymmetric values and only affects F TDSsil, F F CO2 sil, and Dchem sil. In the text (sections Results and Discussion) and in the Table 4, we thus report these fluxes values as “” where F is the central estimate, and F+x and F−y the upper and lower bound of the range of estimates, respectively. According to this method, the relative uncertainties on F TDS, F TDS*, F TDSsil, F , F CO2 sil, and Dchem sil range between 11 and 84% (Table 4).
Results
In order to ease the presentation of results and the discussion thereof, we divided the samples into five groups which correspond to individual basins, as well as geomorphological and lithological units (Table 1; Figures 1, 2): The Mbei tributaries, the Northern Ogooué tributaries, the Plateaux Batéké Ogooué tributaries, the Southern Ogooué tributaries and the Ogooué River main channel. Note that the Ogooué River main channel exhibit intermediate values for all parameters (pH, conductivity, solutes concentration) indicating that its composition simply results from the mixing between the composition of the upstream tributaries inputs.
Physico-Chemical Parameters
The pH of the river water samples range between 4.63 and 7.62 and the conductivity range between 5 and 78 μS cm−1 (Table 2). Intermediate values of pH (6.62–7.10) and conductivity (16–27 μS cm−1) were recorded in the Ogooué mainstream. The two lowest values of pH (<5.5) and conductivity (<10 μS cm−1) were recorded in two tributaries draining the Plateaux Batéké (Lékoni and Passa rivers). The highest values (pH > 7.2 and conductivity > 45 μS cm−1) were recorded in the Southern Ogooué tributaries. The other rivers exhibit intermediate values (6.30 < pH < 7.18; 11 < conductivity < 34 μS cm−1). Water temperature range between 21.6 and 28.1°C. The lowest temperature values were recorded in the Mbei tributaries (21.6–22.9°C) whereas the Ogooué Basin samples exhibit a narrow temperature range (23.9–28.1°C). No direct relationship between temperature and elevation is observed. The instantaneous SPM (Suspended Particulate Matter) concentration range between 6 and 70 mg l−1 (Table 2) and its distribution does not display any clear spatial distribution.
Major Elements and Dissolved Organic Carbon
The TDS concentration (and conductivity) are variable throughout the basin and range between 11 and 75 mg l−1 (Table 2). The highest values (55–75 mg l−1) were recorded in the Southern basins, the lowest values (11–23 mg l−1) are observed in the rivers draining the sandstone region of the Plateaux Batéké, while the other groups (Northern basins, Mbei tributaries, and Ogooué main channel) exhibit intermediate values (21–39 mg l−1).
The total cationic charge (TZ+, in meq l−1) is generally dominated by Ca2+, Mg2+, and Na+ in almost equivalent proportion, while the contribution of K+ to TZ+ is systematically lower (7 to 12% of TZ+). The anionic charge (TZ−, in meq l−1) is generally dominated by (> 80% of TZ−). Concentrations of Ca2+, Mg2+, Na+, K+, , and SiO2 are significantly correlated to the conductivity and to TDS concentration and thus followed the same spatial distribution (Table 2). The SiO2 contribution to TDS concentration range from 86% (Plateaux Batéké) to 31% (Southern basins) and decrease in importance as the TDS concentration increases. Interestingly, dissolved Si concentration is correlated to concentration (R = 0.91; n = 24; p < 0.01; Figure 4B), showing that the alkalinity and, therefore, CO2 consumption associated with water-rock interactions were likely due to silicate weathering in the Ogooué and Mbei basins. The concentrations of Cl− and do not follow the same spatial distribution. We did not identify any parameter controlling the concentration distribution; however, range from 3.7 to 21 μmoles l−1 which is small by comparison with the global riverine discharge-weighted average ( 108 μmoles l−1; Burke et al., 2018). The Mbei tributaries, which are located relatively close to the coast (~150 km), exhibited variable Cl− concentrations (9–28 μmole l−1). In the Ogooué Basin, the Cl− concentrations range between 3 and 25 μmole l−1 and depend on the basin distance from the sea, as observed in the Congo Basin (Négrel et al., 1993; Figure 4A). This observation confirms that Cl− concentration was mainly controlled by the atmospheric inputs (Figure 4A). The highest concentrations (5.4–10.9 μmole l−1) were recorded in all the Mbei tributaries and in one river draining a Northern basin (Missanga at Ndjolé), all corresponding to basins draining the southern Cameroon plateau over catchment areas smaller than 500 km2. The other rivers exhibited low concentration (<2 μmole l−1).
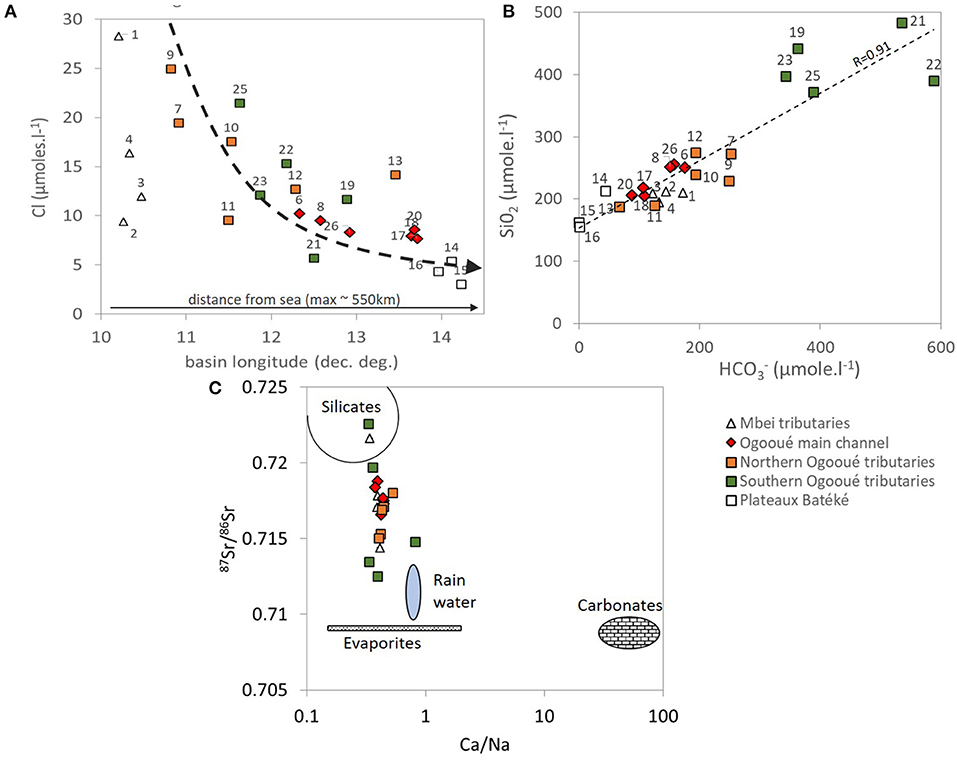
Figure 4. Main characteristics of the dissolved load of the tributaries of the Ogooué and Mbei basins (A) Cl− concentration as function of the centroid basin location. The dotted line represents the decreasing Cl− concentration from the coast (B) SiO2 vs. . (C) 87Sr/86Sr ratio vs. Ca/Na (rock weathering end members defined by Négrel et al., 1993).
The normalized inorganic charge balance (; note that charges borne by organic matter are not taken into account in this definition of NICB) is smaller than ±10% for most samples. For 5 samples the NICB was within 11% to 23%, which reflected an excess of cationic charge relatively to the anions (Table 2). As suggested by the weak but statistically significant correlation between DOC (see below) and NICB (R= 0.63; N = 24; p < 0.01), as previously reported for Guyana rivers (Sondag et al., 2010), and by the fact that the NICB decreased to 0% when the concentration of “inorganic” solutes increases, the on-average positive NICB is most likely due to the presence of negatively charged dissolved organic matter. Assuming a negative charge of 6 ± 0.5 μeq mg−1 of DOC (Dupré et al., 1999), the “corrected” NICB values of less than ±10% for 23 samples and less than ±15% for all samples confirm that the deficit of negative charge relatively to cationic charge is most likely due to the presence of negatively-charged dissolved organic matter.
Dissolved organic carbon concentration ranged between 0.9 and 11 mg l−1. The highest values were recorded in the Northern basins with values ranging from 4.3 to 11 mg l−1, while the other samples exhibited values ranging between 0.9 and 2.7 mg l−1.
Strontium Isotope Ratios
Dissolved 87Sr/86Sr ratios range between 0.7125 and 0.7226 over the studied basins (Table 2). According to the 87Sr/86Sr vs. Ca/Na relationship (Figure 4C) and the end members determined by Négrel et al. (1993) for crystalline rock types in the Congo Basin, these signatures are distributed between the silicate weathering, evaporite weathering, and rain end members. As no evaporite outcrops are known in the studied area (Thiéblemont et al., 2009), the 87Sr/86Sr ratios indicate that in the region major river solutes derive mainly from silicate weathering and atmospheric inputs. The 87Sr/86Sr ratios does not display any specific pattern in terms of spatial distribution.
Discrimination of Solute Sources
According to the results of the source discrimination method explained in section Discrimination of Solute Sources, atmospheric inputs to river chemistry in the Ogooué and Mbei basins are low and contribute to <15% of the TDS for most of the rivers (Figure 5). Interestingly, according to this method, the entirety of river derive from atmospheric inputs. Again, this is consistent with the absence of known evaporite outcrops in the region. The atmospheric contribution to the river budget of other dissolved species is generally lower than 40% with a decreasing impact in the order: Mg2+ (40 ± 21%) > K+ (29 ± 16%) > Ca2+ (27 ± 12%) > Na+ (19 ± 21%) > Sr2+ (5 ± 3%). Given the low relative input of rain to the dissolved Sr budget, no attempt was made to correct dissolved 87Sr/86Sr ratios from the rain contribution.
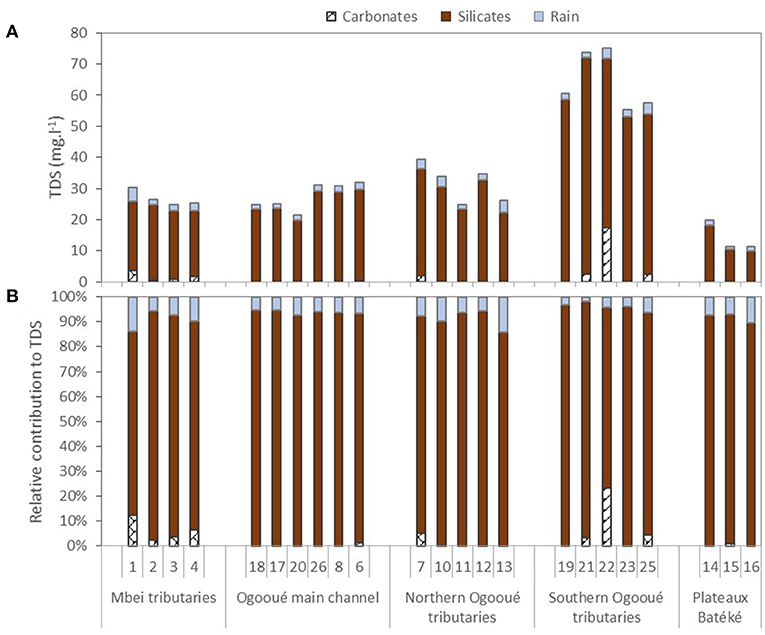
Figure 5. Absolute (A) and relative (B) contributions of rainfall, carbonate weathering, and silicate weathering to the river TDS for each sampling site of the Ogooué and Mbei basins.
The Mg/Na*, Ca/Na*, and HCO3/Na* molar ratios of the sampled waters are consistent with the silicate end member previously defined for the Congo Basin (Négrel et al., 1993) and used at global scale by Gaillardet et al. (1999b) (Figure 6). Together with the strong relationship between and SiO2 (Figure 4B) and the overall relatively high 87Sr/86Sr ratios (Figure 4C), this observation confirms that the major solutes in the Ogooué-Mbei basins are mainly sourced from silicate weathering. More quantitatively, source discrimination calculations show that silicate weathering largely dominate the TDS export (by up to 70%; Figure 5). Carbonate weathering significantly contribute to TDS only in one Mbei tributary and one Ogooué R. tributary (Ouagna at Wagny). Such low contribution of carbonate weathering to the solute load of the study area is consistent with the lithological map, which displays only sparse carbonate outcrops in the Ogooué and Mbei basins.
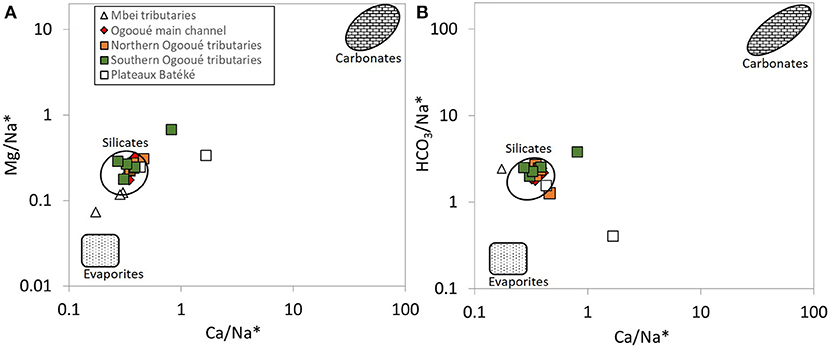
Figure 6. Mixing diagrams indicating the source of solutes to the rivers of the Ogooué and Mbei basins (A) Mg/Na* vs. Ca/Na* and (B) HCO3/Na* vs. Ca/Na*. The “*” symbol stands for concentrations corrected from atmospheric inputs (Equation 2). The silicate, carbonate and evaporite end members defined by Gaillardet et al., 1999b are shown for reference.
Trace Elements
The concentrations of trace elements in the Ogooué and Mbei basins (Table 3; Figure 7), are generally lower than the global average (Gaillardet et al., 2014). The concentrations of trace alkali and alkaline earth metals (Rb, Cs, Sr, and Ba) in the Ogooué Southern basins are higher than in the Ogooué main channel, and are the lowest in the Plateaux Batéké region. The Northern Ogooué basins and the Mbei tributaries exhibit concentrations similar to those of the Ogooué mainstream. Conversely, transition metals and REE concentrations are generally higher in the Northern basins and in the Mbei tributaries than in Southern and Plateaux Batéké tributaries. For most trace elements, Plateaux Batéké tributaries exhibit the lowest concentrations (exceptions: Al and Cd).
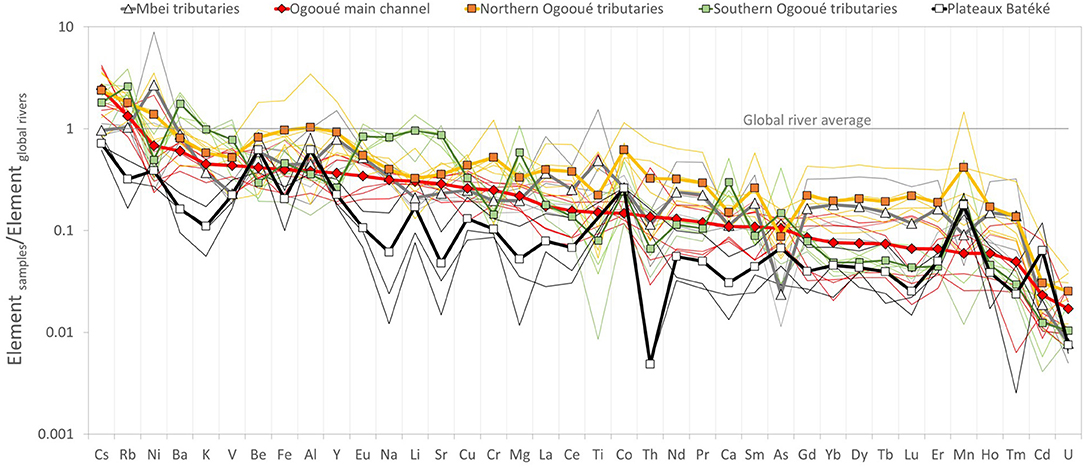
Figure 7. Global average-normalized patterns for the river dissolved load of the Ogooué and Mbei rivers. Plain lines correspond to individual samples, whereas lines with a symbol correspond to average values for each domain defined in Table 1. Global river averages are from Gaillardet et al. (2014) for trace elements and from Meybeck (2003) for Na+, K+, Mg2+, and Ca2+. Elements are ordered along the y-axis from the highest to lowest values recorded in the Ogooué main channel.
Based on correlation analysis with other parameters (physico-chemical parameters and concentration of DOC and of major elements) across the sample set, two groups of trace elements can be distinguished. First, elements such as Be, Al, Cr, Fe, Co, Y, most REEs, Zr, Th, and U correlate positively with DOC concentration (R > 0.5; p < 0.01; Supplementary Figure 4; see for example the Fe-DOC relationship in Figure 8). In particular, the higher DOC concentration measured in the Northern Ogooué basins corresponds to higher concentration for these elements. Second, other elements such as Li, V, Cu, As, Rb, Sr, Ba, and Eu correlate positively (R > 0.5; p < 0.01) with conductivity and the concentration of most major elements, and are therefore reflective of release by rock weathering. These elements thus exhibit high concentration in the Southern basins, low concentration in the Plateaux Batéké and intermediate concentration in the other basins. We note that B concentration is strongly correlated to Cl− concentration (which might point toward a dominantly atmospheric origin of B in the Ogooué–MBei rivers), and that other elements (Ti, Mn, Ni, Nb, Cd, Cs) do not show any significant correlation with the parameters cited above. Interestingly, the elements commonly considered as weakly soluble during weathering (e.g., Al, Fe, REEs+Y) or strongly insoluble (Th, Zr) are correlated to DOC concentration in the Ogooué and Mbei basins, where they exhibit low concentration both in comparison with global rivers (Gaillardet et al., 2014; Figure 7) and with other African rivers like the Nyong (Viers et al., 2000), Niger (Picouet et al., 2002), and Congo (Gaillardet et al., 1995) rivers.
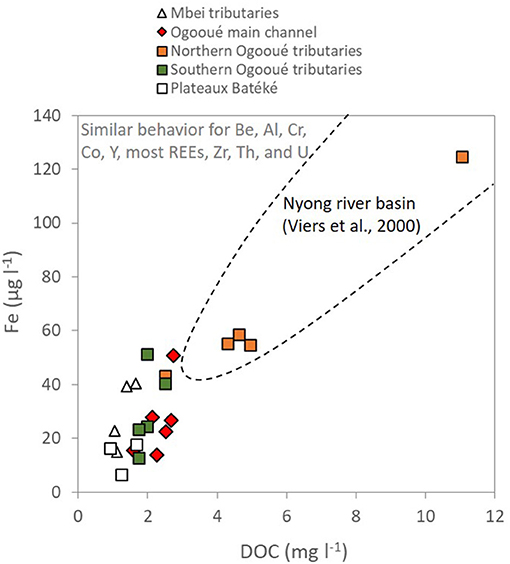
Figure 8. Fe vs. DOC relationship in the Ogooué and Mbei basins. The domain corresponding to the Nyong values (monthly sampling from October 1994 to January 1997; Viers et al., 2000) is added for reference.
Silicate Weathering Fluxes and Associated CO2 Consumption
Using estimates of Qspe values (specific discharge; see section Hydrological and Climate Data), the TDS and silicate weathering fluxes (F TDS and F ) of the Ogooué and Mbei rivers and their tributaries were calculated. As carbonate weathering is a small contributor to the river dissolved load over the studied area, no attempt was made to estimate the corresponding river dissolved fluxes. At the Lambaréné station, the sampling location closest to the Ogooué outlet, the Ogooué river export a F TDS of 4.4 ± 1.1 Mt yr−1 including 2.1 ± 0.5 Mt yr−1 of F SiO2 and Mt yr−1 of . The corresponding Fspe are 21 ± 5.3, 10 ± 2.5 and t km−2 yr−1, respectively, and the Dchem sil was m Ma−1 (Table 4). Values of the Fspe TDS, Fspe , and Dchem sil parameters are particularly variable throughout the basin (Figure 9A). The highest values (Fspe TDS = 29 ± 16 to 86 ± 31 t km−2 yr−1; Fspe = to t km−2 yr−1; Dchem sil = to m Ma−1) are recorded in the Southern basins, the lowest ones are observed in the Plateaux Batéké tributaries (Fspe TDS = 18 ± 7 to 19 ± 7 t km−2 yr−1; Fspe = to t km−2 yr−1; Dchem sil = to m Ma−1), while the other basins exhibit intermediate values (Fspe TDS = 13 ± 7 to 39 ± 13 t km−2 yr−1; Fspe = – t km−2 yr−1; Dchem sil = – m Ma−1) (Table 4; Figure 9A). The CO2 consumption flux associated with silicate weathering (CO2 sil) is 109 mol yr−1 for the Ogooué Basin, range between 103 mol km−2 yr−1 and 103 mol km−2 yr−1, scaling with Fspe (Table 4). Spatially, the Northern basins, the Southern basins and the Plateaux Batéké tributaries contribute to around 28, 40, and 6% of the TDS export from the Ogooué at Lambaréné, respectively (for drainage areas representing 39, 31, and 7% of the total drainage area, respectively). The remaining part of the basin (the Ogooué mainstream and unsampled tributaries; 23% of the Ogooué area) contributes to 26% of the TDS flux (Figure 9B).
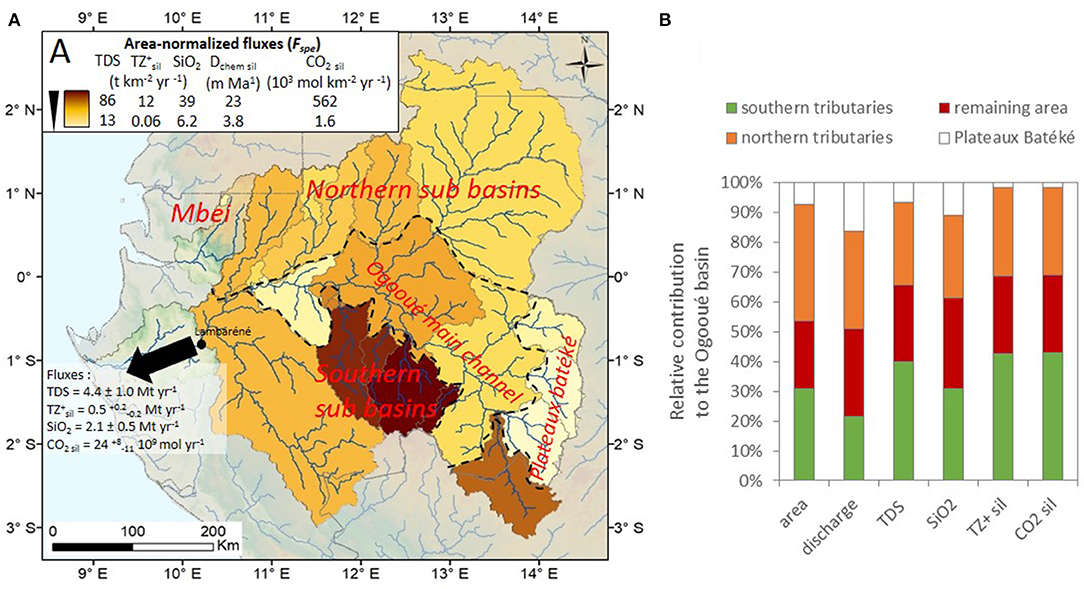
Figure 9. Spatial distribution of weathering fluxes in the Ogooué Basin: (A) Color map showing the spatial distribution of specific fluxes (Fspe) of TDS, , SiO2, and associated CO2 sil consumption Fspe distribution throughout the Ogooué Basin (the darkness of the color is proportional to these rates; the extreme values are reported in the caption). Note that at this scale the basins of the Mbei tributaries are too small to be visible. (B) Relative contribution of each region in term of drainage area, discharge and fluxes of TDS, , SiO2, and CO2 sil consumption. The uncertainties are reported in Table 4.
Discussion
Silicate Weathering Rates in the Ogooué and Mbei Basins, and Comparison With Regional and Global Rates
This study presents the first TDS flux estimates for the Ogooué River. With a TDS flux F TDS = 4.4 ± 1.1 106 t yr−1, the Ogooué River contributes to around 4% of the TDS flux for around 7% of the discharge of Western Africa (according to Western Africa TDS flux and discharge estimates of Milliman and Farnsworth, 2011). The Ogooué River area-normalized TDS flux (Fspe TDS = 21 ± 5 t km−2 yr−1) is lower than the global average (30–50 t km2 yr1; Meybeck, 1976, 2003; Milliman and Farnsworth, 2011), partly due to the fact that at the global scale, a large fraction of the river TDS flux is provided by the weathering of carbonate and evaporite rocks, which are not present in the studied area. However, the area-normalized specific fluxes of silicate-derived cationic charge and CO2 consumption for the whole Ogooué (Fspe = t km−2 yr−1; Fspe CO2 sil = 103 moles km−2 yr−1) are close to the global average (Fspe = 2.3 t km−2 yr−1 and Fspe CO2 sil = 96–117 mol km−2 yr−1; Gaillardet et al., 1999b; Moon et al., 2014). These numbers challenges the paradigm of cratonic areas being rather inactive in terms of silicate weathering (e.g., Gaillardet et al., 1999b; West, 2012; Moon et al., 2014).
These flux values estimated at the Ogooué outlet result from the mixing of waters derived from regions characterized by a variety of heterogeneous weathering rates. Indeed, the river TDS, , SiO2, associated CO2 consumption Fspe and the chemical silicate denudation (Dchem sil) estimated throughout the Ogooué Basin are heterogenous. These estimates cover the whole range of values yet measured in cratonic environments under all latitudes (Figure 10). As throughout the Ogooué Basin the area-normalized fluxes of TDS, , SiO2 (and associated CO2 consumption) as well as the Dchem sil are strongly correlated to one another (R > 0.87; p < 0.01), here we discuss only controls on the values of Fspe . At the global scale, cratonic environments exhibit a large variability in silicate weathering rates (Figure 10), ranging from 0.25 t km−2 yr−1 (Slave River, Canada; West et al., 2002) to 16 t km−2 yr−1 (Kaveri River, India; Pattanaik et al., 2013). In the Ogooué Basin the lowest values obtained for the Plateaux Batéké (Fspe TZ+ sil < t km−2 yr−1) are amongst the lowest silicate weathering rates measured on Earth, lower than or similar to weathering rates recorded in the Siberian craton (Zakharova et al., 2005, 2007; Pokrovsky et al., 2015) and in the Canadian shields (Millot et al., 2002). The highest values obtained for the Southern Ogooué basins (Fspe = to t km−2 yr−1) are on the order of those measured in the Kaveri Basin (India), a region particularly active in terms of silicate weathering (Gurumurthy et al., 2012; Pattanaik et al., 2013). Interestingly, by comparison with the silicate weathering rates measured in orogenic areas, these values are in the lower range of those recorded in the Andes (Fspe = 9–104 t km−2 yr−1; Moquet et al., 2011, 2018), in the New Zealand Alps (Fspe = 2–187 t km−2 yr−1; Moore et al., 2013) but are commensurate to, or higher than those recorded in the Himalayas (mean Fspe = 5.78 t km−2 yr−1, West et al., 2002), in the European Alps (Fspe = 0.03–11 t km−2 yr−1, Donnini et al., 2016) and in the Rocky Mountains of Canada (Fspe = 0.13 to 4.3 t km−2 yr−1, Millot et al., 2002). The other basins (Northern basins, Mbei tributaries basins) exhibit Fspe values similar to those measured in large tropical rivers like the Amazon tributaries and French Guyana rivers (Fspe = 0.8–3.0 t km−2 yr−1; Sondag et al., 2010; Moquet et al., 2016; note that these values were updated for the period 2003–2019 from the HYBAM observatory database. These rates correspond to the cation fluxes corrected from the atmospheric inputs, according to the method performed in the present study. The remaining cation amounts considered to be only derived from silicate weathering because no carbonate and evaporite are present in the considered basins), the Congo (Fspe = 0.54–2.3 t km−2 yr−1; Négrel et al., 1993; Gaillardet et al., 1995), the Nyong (Fspe = 0.49 t km−2 yr−1; Viers et al., 2000; Regard et al., 2016) or the Niger (Fspe = 0.58 to 2.2 t km−2 yr−1; Picouet et al., 2002) rivers.
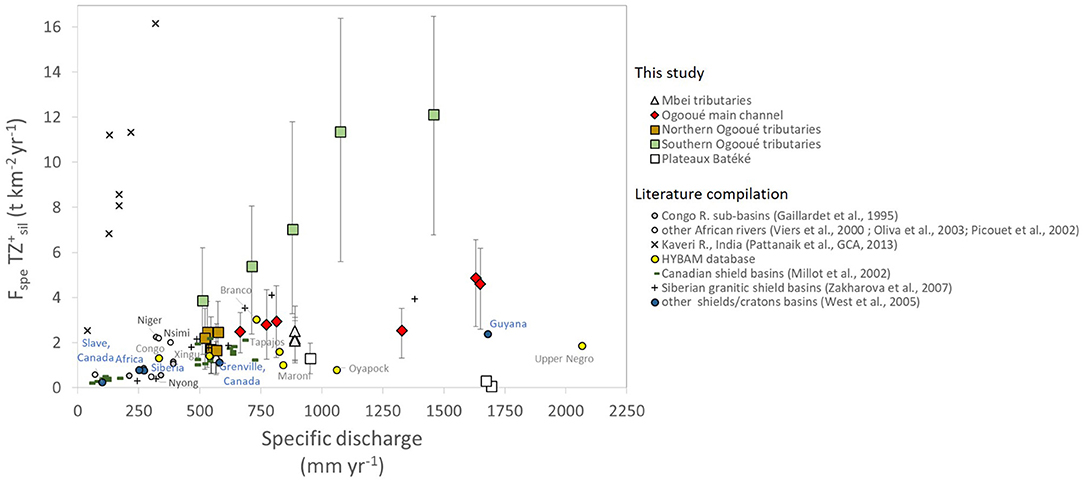
Figure 10. Silicate weathering rate (Fspe in t km−2 yr−1) vs. specific discharge (Qspe) for rivers of the Ogooué and Mbei basins, and of other rivers draining cratons at the global scale. The HYBAM database provides major elements fluxes for the Upper Negro, Branco, Xingu, and Tapajos (Moquet et al., 2016), Oyapock and Maroni (Sondag et al., 2010) and Congo (Laraque et al., 2009) for the period 2003–2019. Values of Fspe for the HYBAM stations here correspond to the cation fluxes corrected from the atmospheric inputs, according to the method used in the present study. The remaining cations rate were considered to be only derived from silicate weathering. Error bars reflect uncertainties, the calculation of which is detailed in section Uncertainty Calculation.
Among cratonic environments, no direct relationship between specific discharge and silicate weathering intensity is observed, neither at the global scale nor at the scale of the Ogooué Basin (Figure 10). The present study shows that the silicate weathering flux calculated at the outlet of the Ogooué Basin does not reflect an intrinsic property of weathering in cratonic areas (i.e., low physical erosion rates associated to low weathering rates; e.g., West, 2012), but results from the mixing of solute fluxes derived from contrasted environments in terms of weathering. In addition, our observations highlight that cratonic areas can be particularly active in terms of weathering, as in the Southern Ogooué Basin, and that the absence of tectonic activity does not necessarily imply slow weathering.
Controlling Factors of Silicate Weathering in the Ogooué Basin and Implications for the Long-Term Carbon Cycle
At the global scale, silicate weathering is controlled by a range of variables like climate, lithology, geomorphology or the presence of organic matter (e.g., Goudie and Viles, 2012) which together influence the rate of exposure of mineral surfaces to water and air, the type of water-mineral interactions, and water flowpaths.
Climate
With all things considered equal, climate is a key driver in differential weathering reaction rates, which can alter reaction temperature (e.g., Oliva et al., 2003) and water availability and potential for weathering (White and Blum, 1995; Maher and Chamberlain, 2014). Due to its equatorial position, the Ogooué Basin is characterized by a relatively constant temperature throughout the year with an average of ~24°C and is relatively homogenous throughout the basin. Annual rainfall estimates in the basin exhibit a significant spatial variability (from 1,890 to 2,692 mm yr−1) with an estimated specific discharge ranging from 512 to 1,694 ( ± 161) mm yr−1. Interestingly, amongst the Southern Ogooué tributaries the values of Fspe calculated significantly (p < 0.01) increase with specific discharge suggesting that within this domain rainfall distribution partly controls the Fspe variability (Figure 11A). This is consistent with the observation made at global scale for numerous river basins (e.g., Gaillardet et al., 1999b; West, 2012) that weathering rates increase with precipitation, and thus specific discharge. In this case, weathering rates are controlled by the amount of water available for weathering reactions. Indeed, increased water flow through regolith and rock increases the surface of contact between minerals and water (White and Blum, 1995), and the export flux of solutes when reactions occur near thermodynamic equilibrium (Maher, 2010). However, for a given Qspe value, Fspe is highly variable throughout the basin (Figure 11A). Therefore, at the scale of the whole studied area, climatic parameters (temperature, rainfall or runoff) alone cannot explain the significant variability in silicate weathering rates observed throughout the basin.
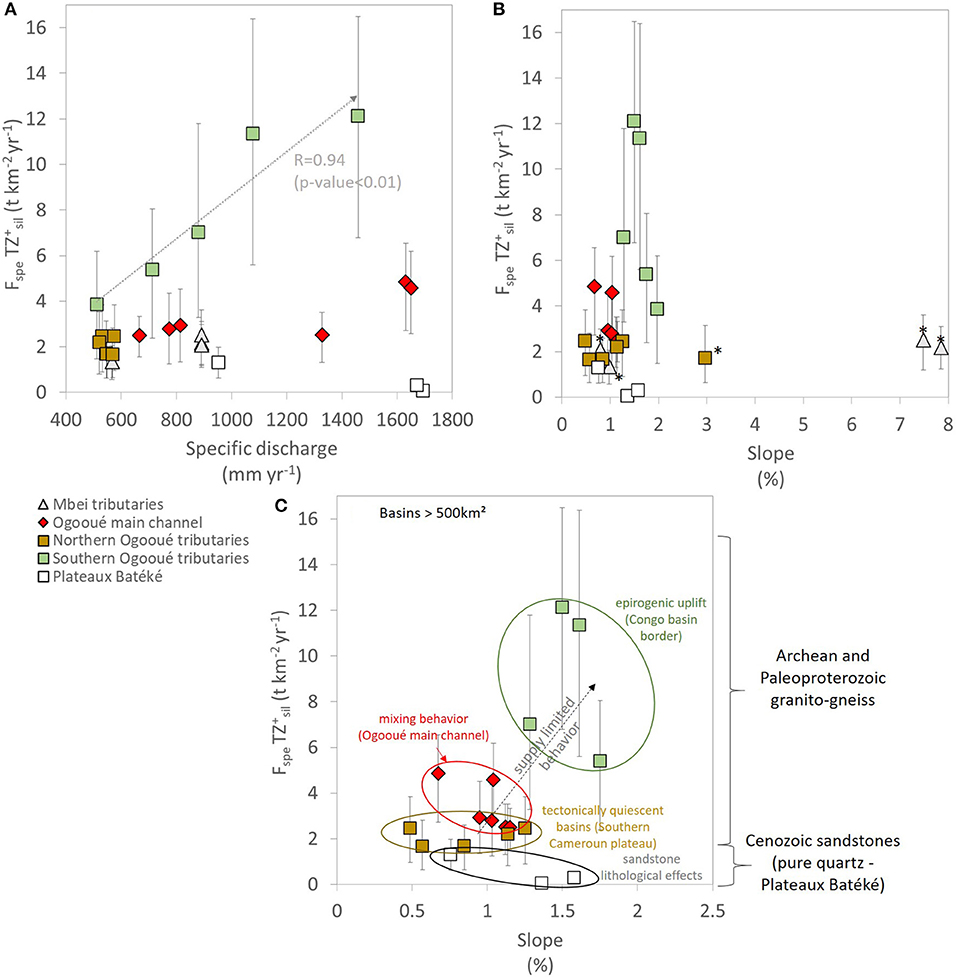
Figure 11. Relationship between silicate weathering rate (Fspe in t km−2 yr−1) and (A) specific discharge and (B) mean basin slope in the Ogooué and Mbei basins. * correspond to the basins which exhibit concentration >5 μmoles l−1. (C) Zoom on B only for basins with drainage area >500 km2. In panel A, the regression line is reported for Southern Ogooué tributaries for reference (R = 0.94; significant for p < 0.05). Error bars reflect uncertainties, the calculation of which is detailed in section Uncertainty Calculation.
Lithology
Lithology is another major factor controlling the Earth surface chemical denudation (e.g., White and Blum, 1995; Hartmann et al., 2014). In the Ogooué Basin, a strong lithological contrast exists between the Plateaux Batéké in the East and the rest of the basin. Plateaux Batéké are composed of Cenozoic sandstone formations, whose mineralogy is dominated by quartz, and which are very poor in soluble elements (e.g., Thiéblemont et al., 2009), whereas the remaining part of the basin is mainly made of plutonic and metamorphic rocks. As already observed in the Congo Basin (Négrel et al., 1993; Gaillardet et al., 1995), this contrast explains the very low major cation content measured in the Ogooué tributaries draining the Plateaux Batéké.
The remaining part of the basin drains the Congo craton mainly composed of Archean and Paleoproterozoic granitic and gneissic rocks. Non-calcareous sedimentary formations (Eburnéen foreland—Francevilien D Group composed of greenish pelite with sandstone and tuffaceous intercalations; Thiéblemont et al., 2009) constitute a more important component of the underlying rocks in the Southern basins than in the Northern basins (see Supplementary Table 1). The dissolved Mg/Na* vs. Ca/Na* and HCO3/Na* vs. Ca/Na* ratios of the studied basins are relatively homogenous (Figure 6) and lie within the field of the granitic weathering end member previously defined for the Congo Basin (Négrel et al., 1993). This observation indicates that the river the dissolved major element composition of the Ogooué Basin derives from a relatively homogenous silicate domain. Therefore, other drivers of chemical weathering need to be invoked to explain the latitudinal gradient in chemical weathering rates observed in the Ogooué Basin (Figure 9).
Dynamics of Organic Matter and Colloids
The Northern tributaries of the Ogooué Basin drain the southern part of the Cameroon plateau and exhibits characteristics similar to those of the neighboring Nyong Basin: tectonic quiescence, low slopes, and subsequent water stagnation in swamp systems (Viers et al., 1997; Oliva et al., 1999; Braun et al., 2012). In such environments, chemical weathering contributes to around 60-70% of total (physical plus chemical) denudation (Regard et al., 2016), rapid turnover of carbon on hillside soils promote DOC exportation (Nkoue Ndondo et al., 2020), and organic-rich surface waters enhance the mobilization and transfer of insoluble elements such as Al and Fe–and even of highly-charged transition metals such as Th, Ti, and Zr (Braun et al., 2005, 2012). The Northern tributaries exhibit weathering rates similar to those of rivers draining the Cameroon plateau (Nsimi brook, Nyong river, and tributaries; Figure 10) and display similar relationships between DOC and concentrations of High Field Strength Elements (Al, Fe, Th, Zr, and REEs) as those observed in these rivers (Olivié-Lauquet et al., 1999; Viers et al., 2000; Braun et al., 2012; Figure 8). In such environments, these elements are mainly transported in the stream in the colloidal phase [which is typically composed of a mixture of organic matter and Al and Fe oxy(hydroxides)], operationally included in the dissolved phase in the present study, because of the filter porosity. Such behavior has been shown to be a primary mechanism for these elements to mobilize in many surface and groundwater environments (for example, Pokrovsky et al., 2006; Pourret et al., 2007; Trostle et al., 2016; Vázquez-Ortega et al., 2016). In the Ogooué and Mbei basins, this phenomenon is exemplified by the correlation between the concentrations of these trace elements and DOC concentration (Figure 8; Supplementary Figure 4). However, these correlations can reveal either that dissolved organo-metal complexes are forming that solubilize Al, Fe, Th, and Zr (e.g., Oliva et al., 1999; Tamrat et al., 2019) and/or that these systems promote the export of colloids composed of organic matter, nanoclays, and Al and Fe oxyhydroxides (e.g., Rose et al., 1998; Olivié-Lauquet et al., 1999; Allard et al., 2004; Guinoiseau et al., 2016). In any case, we emphasize that in the neighboring small river basin of Nsimi, major dissolved cations (Ca2+, Mg2+, K+, and Na+) and SiO2 are typically transported in the “truly” dissolved phase, i.e., with a size <5 kD (Viers et al., 1997). The river fluxes of these elements in the Ogooué and Mbei basins thus reflect actually dissolved weathering products, and the intermediate weathering rates calculated in this region are at least partly controlled by the content in dissolved organic matter and associated inorganic colloidal fraction.
The Mbei tributaries and the Missanga River (a small Northern Ogooué tributary) exhibit the highest concentration (from 5.4 to 11 μmoles l−1) of the dataset (Table 2; Figure 11B). Some of these basins also feature the highest mean slopes of the study area (from 3.0 to 7.9%) and all drain an area <500 km2. The other Northern basins exhibit low (<1.2 μmoles l−1) concentrations and low slopes <1.3%. The concentration values recorded in the Mbei and Missanga rivers are within the range recorded in the hillslope piezometers of the experimental Nsimi watershed in the neighboring Nyong Basin (Braun et al., 2005). There, concentrations decrease from 0.75 μmol−1 on hillslopes to values <0.12 μmole in downslope swampy areas and in the downstream Nyong River (Viers et al., 1997; Boeglin et al., 2003; Braun et al., 2005). This trend was attributed to the fact that mineralization of organic-rich soil horizons on hillslope favors nitrification, while denitrification occurs in the open water, swampy area (Braun et al., 2005). We suggest that similar processes explain the high concentrations observed in some of the Northern Ogooué basins. Indeed in these small (<500 km2), overall steep basins, hillslope soil processes favoring nitrification would dominate the catchment-scale N cycle, and thus result in high river concentration, while larger and flatter basins would integrate swampy systems where denitrification is active, decreasing concentration and export fluxes at the outlet. The Missanga stream flows through the suburbs of Ndjolé city, such that its higher concentration can also be attributed to human activities. These observations show that in relatively small basins solute loads do not reflect the same processes as those of larger basins. We thus focus our following discussion of the roles of relief and erosion (section Relief and Erosion) on catchments with drainage areas > 500 km2, and accordingly exclude from this discussion the data from the Mbei and Missanga rivers.
Altogether, these observations suggest that the presence or absence of flat, swampy areas exert a significant control on the export fluxes of trace elements and nitrate in the Ogooué Basin.
Relief and Erosion
The Southern tributaries of the Ogooué, which exhibit the highest weathering rates of the whole basin, contain DOC concentrations similar to those of rivers draining the Plateaux Batéké, and drain rocks similar to those of the Northern basins. The main characteristic of this region amongst the sub-basins of the Ogooué Basin is the relatively steeper slopes than the Northern sub-basins and the main Ogooué channel (mean slopes = 1.5–2% for the Southern sub-basins; Table 1). It is widely acknowledged that in tectonically active areas mountain uplift triggers mechanical erosion, which in turns favors the exposure of “fresh” mineral surfaces to water and reactive gases, providing a potential explanation for the high weathering rates recorded in orogenic regions (Larsen et al., 2014) such as the Himalayas (Raymo and Ruddiman, 1992; France-Lanord et al., 2003), the Andes (Stallard, 1985; Moquet et al., 2011, 2014, 2018; Carretier et al., 2018), or the Australian Alps (Hagedorn and Cartwright, 2009). The Ogooué Basin drains a tectonically inactive area, such that mountain uplift cannot be invoked as a control on weathering rates via increased erosion. However, Guillocheau et al. (2015) point out that the Congo Basin borders, which correspond to the Southern and Eastern parts of the Ogooué Basin, have been subjected to active uplift for the past 45 Ma. The origin of this uplift, potentially related to mantle-induced dynamic uplift or lithospheric processes (Guillocheau et al., 2015, 2018), has in particular promoted higher relief in the Atlantic side of the Congo Basin for the past 11.5 Ma. Conversely, the Northern Ogooué tributaries and the Mbei Basin, located in the Southern part of the South Cameroon Plateau, do not undergo such uplift (Weber et al., 2016; Guillocheau et al., 2018). Although little is known about the effects of long-term mantle or lithosphere dynamics on erosion and weathering, and excluding the lithological effect explaining the low weathering rates of the Plateaux Batéké, the North-South gradient in specific weathering fluxes over the Ogooué Basin can be attributed to a southward increase in the intensity of mantle-induced dynamic uplift, or potential to lithospheric destabilization (Cottrell et al., 2004; Jaupart et al., 2007).
As for mountain uplift in tectonically active areas, the most likely process for a positive influence of mantle- or lithosphere-induced dynamic on weathering in tectonically quiescent areas is the enhancement of erosion rates. However, whereas in mountains a tight coupling between erosion and weathering is required to maintain a finite regolith thickness over significant timescales (>103-104 yrs), in tropical cratonic environments mantle uplift would rather sustain regolith rejuvenation (i.e., exposure of deep regolith horizons hosting relatively unweathered primary minerals to water flowpaths in the critical zone) through long-term thinning of the lateritic cover. Regardless of the exact dynamics at play, in both cases erosion remains the main driver for “fresh” material exposure to the Earth surface. Estimates of erosion rates are not available yet for the Ogooué Basin to test this hypothesis, but the steeper slopes of the Southern basins lends support to the following scenario (Figure 11C). In the Southern Ogooué basins, higher erosion rates driven by mantle-induced dynamics or by uplift due to lithospheric instability would enhance weathering rates through accrued erosion and thinning of lateritic soils, allowing for an increase in the exposure of “fresh” mineral surfaces to reactive fluids, while in the Northern basins, the absence of uplift inhibits soil erosion and leads to the formation and the preservation of deep lateritic soils. Such scenario would imply that weathering in the Ogooué Basin operates with the “supply-limited” regime (Figure 11C), meaning that chemical weathering rates are limited by physical erosion rates (e.g., Riebe et al., 2017).
To our knowledge, this is the first time that an influence of mantle or lithosphere dynamic (also sometimes referred to as “epeirogenic” uplift by geologists) on weathering rates is proposed for cratonic areas. This hypothesis implies that erosion could affect weathering, the global long-term carbon cycle, and climate not only through the formation of the main orogenic belts in collisional contexts (Raymo and Ruddiman, 1992) but also through the slow, large-scale dynamics of the mantle and lithosphere in cratonic areas. Cratonic environments can therefore have a significant role on the continental weathering budgets, and need to be considered carefully when evaluating the global carbon cycle (Goddéris et al., 2008; Carretier et al., 2014). As basin slope alone is an imperfect index for physical erosion, this hypothesis needs to be tested through the comparison of chemical weathering rates with erosion rates. As no sediment gauging program exists in the studied area, alternative approaches such as cosmogenic nuclides (e.g., 10Be, Regard et al., 2016) or/and steady state calculations based on the geochemical composition of river sediments (Gaillardet et al., 1999a; Picouet et al., 2002; Louvat et al., 2008) need to be performed to better characterize the interplay between weathering and erosion in cratonic areas.
Conclusion
Cratonic areas located in humid tropical regions have been reported to exhibit low chemical weathering rates due to a “shielding” effect of deep, mature regolith covers. Nevertheless, thanks to their wide aerial extent on intertropical surfaces, cratonic areas represent at the global scale a significant proportion of the dissolved matter delivery to the oceans. Despite this crucial significance, assessment of chemical weathering fluxes and rates in these environments is seldom conducted, and the variability in the intra-cratonic weathering rates–especially in terms of the diversity of geomorphological setting—has generally not been considered to date.
The present study allows us to quantify the chemical weathering budget of the intertropical cratonic basins of the Mbei and the Ogooué basins, Gabon, and to explore the main drivers of weathering in this context. The chemical composition (major and trace element concentration and 87Sr/86Sr ratios) of 24 river water samples taken in September 2017 was measured. Solute source discrimination shows that atmospheric inputs account for <15% of the TDS, while silicate weathering is the main TDS source. Interestingly, the hydrochemical composition of the Ogooué River at the outlet and the whole-basin silicate weathering rate are similar to those of the world average, and similar to (if not higher than) other basins of Western Africa. The significant weathering flux of the Ogooué results from contrasted weathering regimes across the basin, which cover the range of values yet recorded in cratonic basins at the global scale.
In the Ogooué and Mbei basins, three domains, submitted to similar climate, have been identified:
(i) Low weathering rates were recorded in the Plateaux Batéké (Eastern Ogooué tributaries). These low weathering rates, corresponding to the lowest values recorded in cratonic environments at the global scale, are due to a lithological effect associated with the low abundance of chemically-mobile elements in the minerals (i.e., mostly quartz) which compose the underlying Cenozoic sandstones.
(ii) Intermediate weathering rates, comparable to the Ogooué mainstream values, were recorded in the Mbei tributaries and the Northern Ogooué sub-basins. The higher DOC concentrations recorded in the Northern Ogooué sub-basins are associated with elevated concentrations of classically insoluble elements (e.g., Fe, Al, Th, Zr, REEs) suggesting a prominent control of colloidal transport in these basins. In these rivers, our data also show that active nitrification occurs on hillslopes while denitrification is promoted in swamp areas in the valleys.
(iii) The highest weathering rates were recorded in the Southern Ogooué tributaries basins. The rim of the Congo Cuvette drained by these tributaries is submitted to active mantle uplift, which enhances soil erosion, and leads to the dismantlement of soils and to increased availability of fresh mineral surfaces to reactive fluids, thereby promoting higher weathering rates.
In addition to the lithological effect observed in the Plateaux Batéké and to the role of organic matter in Northern basins, the novelty of the present study is to hypothesize that mantle-induced dynamic uplift or lithospheric destabilization in cratonic areas can significantly enhance chemical weathering rates by leading to soil erosion and bringing fresh rocks in contact with meteoric water. As a corollary, the cratonic zones may also host hot-spots of weathering. These Earth surface movements of long spatial (100–1,000 km) and temporal (tens of millions years) wavelengths should be considered, along with the establishment of major orogenic belts linked to plate collision, in models of the global long-term carbon cycle and climate. The drivers of weathering in shield environments thus need deeper investigation to estimate continental weathering budgets and to constrain global-scale, long-term biogeochemical cycles.
Data Availability Statement
The original contributions presented in the study are included in the article/Supplementary Materials, further inquiries can be directed to the corresponding author/s.
Author Contributions
J-JB, JG, and JB designed the project. J-SM, J-JB, SB, and AM measured in-situ data and collected the samples. J-SM and JB performed and coordinated the chemical analyses. SB contributed to the hydroclimate data calculation. SB and J-PB contributed to the hydrological data production. EM contributed to the GIS data compilation. J-SM and JB interpreted the results with the help of J-JB and JG. J-SM wrote the manuscript with the help of JB and J-JB. JG, SC, and VR contributed to the data interpretation and revised the manuscript. M-CP contributed to the study implementation. All authors contributed to the article and approved the submitted version.
Funding
This study was supported by the project RALTERAC EC2CO INSU, by the International Joint Laboratory DYCOFAC (Dynamics of the forested ecosystems of Central Africa in a context of global change) and by the Programme Emergences of the City of Paris Chemical weathering of sediments in large tropical floodplains (agreement205DDEEES165). Parts of this work were supported by IPGP multidisciplinary programme PARI and by Paris-IdF region SESAME Grant No. 12015903 and by a grant overseen by the French National Research Agency (ANR) as part of the Investments d'Avenir Programme LabEx VOLTAIRE, 10-LABX-0100.
Conflict of Interest
The authors declare that the research was conducted in the absence of any commercial or financial relationships that could be construed as a potential conflict of interest.
Acknowledgments
We especially thank Dr. Aurélie Flore Koumba Pambo for the research authorizations in Gabon, Jean-Grégoire Kayoum driver and photograph during the sampling field, Pr. Marc Benedetti (IPGP) for Dissolved Organic Carbon analyses, Caroline Gorge (IPGP) for the major element analyses, Dr. Pierre Burckel (IPGP) for trace element analyses, D. Thiéblemont (BRGM) for constructive discussions about the Ogooué river Basin geology, G. Mahé (Hydroscience Montpellier) for providing discharge and precipitation data of west African rivers, F. Guillocheau (Géosciences Rennes) for providing the regional topographic map and C. Farnetani (IPGP) for constructive discussions about mantle and lithosphere dynamics in cratons. We also thank ANPN and CIRMF for their support during the field campaign. We thank Alissa M. White, Bryan G. Moravec and Richard Wanty for their constructive recommendations along the review process.
Supplementary Material
The Supplementary Material for this article can be found online at: https://www.frontiersin.org/articles/10.3389/frwa.2020.589070/full#supplementary-material
References
Allard, T., Menguy, N., Salomon, J., Calligaro, T., Weber, T., Calas, G., et al. (2004). Revealing forms of iron in river-borne material from major tropical rivers of the Amazon Basin (Brazil)1 1Associate editor: G. Sposito. Geochim. Cosmochim. Acta 68, 3079–3094. doi: 10.1016/j.gca.2004.01.014
Ameli, A. A., Beven, K., Erlandsson, M., Creed, I. F., McDonnell, J. J., and Bishop, K. (2017). Primary weathering rates, water transit times, and concentration-discharge relations: a theoretical analysis for the critical zone. Water Resour. Res. 53, 942–960. doi: 10.1002/2016WR019448
Artyushkov, E. V., Korikovsky, S. P., Massonne, H.-J., and Chekhovich, P. A. (2018). Recent crustal uplift of precambrian cratons: key patterns and possible mechanisms. Russ. Geol. Geophys. 59, 1389–1409. doi: 10.1016/j.rgg.2018.10.001
Becker, M., Papa, F., Frappart, F., Alsdorf, D., Calmant, S., da Silva, J. S., et al. (2018). Satellite-based estimates of surface water dynamics in the congo river basin. Int. J. Appl. Earth Obs. Geoinformation 66, 196–209. doi: 10.1016/j.jag.2017.11.015
Berner, E. K., and Berner, R. A. (1987). The Global Water Cycle: Geochemistry and Environment:. ed. I. Prentice-Hall Englewood Cliffs. New Jersey, NJ: Prentice-Hall.
Berner, R. A., Lasaga, A. C., and Garrels, R. M. (1983). The carbonate silicate geochemical cycle and its effect on atmospheric carbon dioxide over the past 100 millions years. Am. J. Sci. 283, 641–683. doi: 10.2475/ajs.283.7.641
Boeglin, J.-L., Ndam, J.-R., and Braun, J.-J. (2003). Composition of the different reservoir waters in a tropical humid area: example of the Nsimi catchment (Southern Cameroon). J. Afr. Earth Sci. 37, 103–110. doi: 10.1016/S0899-5362(03)00041-1
Bogning, S., Frappart, F., Blarel, F., Niño, F., Mahé, G., Bricquet, J.-P., et al. (2018). Monitoring water levels and discharges using radar altimetry in an ungauged river basin: the case of the ogooué. Remote Sens. 10:350. doi: 10.3390/rs10020350
Bogning, S., Frappart, F., Paris, A., Blarel, F., Niño, F., Saux Picart, S., et al. (2020). Hydro-climatology study of the Ogooué River basin using hydrological modeling and satellite altimetry. Adv. Space Res. doi: 10.1016/j.asr.2020.03.045
Bouchez, J., and Gaillardet, J. (2014). How accurate are rivers as gauges of chemical denudation of the Earth surface? Geology 42, 171–174. doi: 10.1130/G34934.1
Bouchez, J., Gaillardet, J., Lupker, M., Louvat, P., France-Lanord, C., Maurice, L., et al. (2012). Floodplains of large rivers: weathering reactors or simple silos? Chem. Geol. 332–333, 166–184. doi: 10.1016/j.chemgeo.2012.09.032
Bouchez, J., Moquet, J.-S., Espinoza, J. C., Martinez, J.-M., Guyot, J.-L., Lagane, C., et al. (2017). River mixing in the Amazon as a driver of concentration-discharge relationships. Water Resour. Res. 53, 8660–8685. doi: 10.1002/2017WR02059
Braun, J., Guillocheau, F., Robin, C., Baby, G., and Jelsma, H. (2014). Rapid erosion of the Southern African Plateau as it climbs over a mantle superswell. J. Geophys. Res. Solid Earth 119, 6093–6112. doi: 10.1002/2014JB010998
Braun, J.-J., Descloitres, M., Riotte, J., Fleury, S., Barbiéro, L., Boeglin, J.-L., et al. (2009). Regolith mass balance inferred from combined mineralogical, geochemical and geophysical studies: mule hole gneissic watershed, South India. Geochimica et Cosmochimica Acta 73, 935–961. doi: 10.1016/j.gca.2008.11.013.
Braun, J.-J., Marechal, J.-C., Riotte, J., Boeglin, J.-L., Bedimo Bedimo, J.-P., Ndam Ngoupayou, J. R., et al. (2012). Elemental weathering fluxes and saprolite production rate in a Central African lateritic terrain (Nsimi, South Cameroon). Geochim. Cosmochim. Acta 99, 243–270. doi: 10.1016/j.gca.2012.09.024
Braun, J. J., Ngoupayou, J. R. N., Viers, J., Dupre, B., Bedimo, J. P. B., Boeglin, J. L., et al. (2005). Present weathering rates in a humid tropical watershed : Nsimi, South Cameroon. Geochim. Cosmochim. Acta 69, 357–387. doi: 10.1016/j.gca.2004.06.022
Burke, A., Present, T. M., Paris, G., Rae, E. C. M., Sandilands, B. H., Gaillardet, J., et al. (2018). Sulfur isotopes in rivers: insights into global weathering budgets, pyrite oxidation, and the modern sulfur cycle. Earth Planet. Sci. Lett. 496, 168–177. doi: 10.1016/j.epsl.2018.05.022
Calmels, D., Gaillardet, J., Brenot, A., and France-Lanord, C. (2007). Sustained sulfi de oxidation by physical erosion processes in the Mackenzie River basin: climatic perspectives. Geology 35, 1003–1006. doi: 10.1130/G24132A.1
Carretier, S., Godderis, Y., Delannoy, T., and Rouby, D. (2014). Mean bedrock-to-saprolite conversion and erosion rates during mountain growth and decline. Geomorphology 209, 39–52. doi: 10.1016/j.geomorph.2013.11.025
Carretier, S., Goddéris, Y., Martinez, J., Reich, M., and Martinod, P. (2018). Colluvial deposits as a possible weathering reservoir in uplifting mountains. Earth Surf. Dynam. 6, 217–237. doi: 10.5194/esurf-6-217-2018
Carson, M. A., and Kirkby, M. J. (1972). Hillslope Form and Process. New York, NY: Cambridge University Press.
Caves Rugenstein, J. K., Ibarra, D. E., and von Blanckenburg, F. (2019). Neogene cooling driven by land surface reactivity rather than increased weathering fluxes. Nature 571, 99–102. doi: 10.1038/s41586-019-1332-y
Chorover, J., Derry, L. A., and McDowell, W. H. (2017). Concentration-discharge relations in the critical zone: implications for resolving critical zone structure, function, and evolution. Water Resour. Res. 53, 8654–8659. doi: 10.1002/2017WR021111
Conrad, C. P., and Husson, L. (2009). Influence of dynamic topography on sea level and its rate of change. Lithosphere 1, 110–120. doi: 10.1130/L32.1
Conway, D., Persechino, A., Ardoin-Bardin, S., Hamandawana, H., Dieulin, C., and Mah,é, G. (2009). Rainfall and water resources variability in sub-saharan africa during the twentieth century. J. Hydrometeorol. 10, 41–59. doi: 10.1175/2008JHM1004.1
Cottrell, E., Jaupart, C., and Molnar, P. (2004). Marginal stability of thick continental lithosphere. Geophys. Res. Lett. 31, L18612. doi: 10.1029/2004GL020332
Cutler, J. S., Olivos, J. A., Sidlauskas, B., and Arismendi, I. (2020). Habitat loss due to dam development may affect the distribution of marine-associated fishes in Gabon, Africa. Ecosphere 11:e03024. doi: 10.1002/ecs2.3024
Dai, A., and Trenberth, K. E. (2002). Estimates of freshwater discharge from continents: latitudinal and seasonal variations. J. Hydrometeorol. 3, 660–687. doi: 10.1175/1525-7541(2002)003<0660:EOFDFC>2.0.CO;2
Donnini, M., Frondini, F., Probst, J.-L., Probst, A., Cardellini, C., Marchesini, I., et al. (2016). Chemical weathering and consumption of atmospheric carbon dioxide in the Alpine region. Glob. Planet. Change 136, 65–81. doi: 10.1016/j.gloplacha.2015.10.017
Dupré, B., Viers, J., Dandurand, J.-L., Polvé, M., Bénézeth, P., Vervier, P., et al. (1999). Major and trace elements associated with colloids in organic-rich river waters: Ultrafiltration of natural and spiked solutions. Chem. Geol. 160, 63–80.
Flament, N., Gurnis, M., and Müller, R. D. (2013). A review of observations and models of dynamic topography. Lithosphere 5, 189–210. doi: 10.1130/L245.1
France-Lanord, C., Evans, M., Hurtrez, J.-E., and Riotte, J. (2003). Annual dissolved fluxes from Central Nepal rivers: budget of chemical erosion in the Himalayas. Comptes. Rendus. Geosci. 335, 1131–1140. doi: 10.1016/j.crte.2003.09.014
Gaillardet, J., Dupré, B., and Allègre, C. J. (1995). A global geochemical mass budget applied to the Congo basin rivers: erosion rates and continental crust composition. Geochim. Cosmochim. Acta 59, 3469–3485. doi: 10.1016/0016-7037(95)00230-W
Gaillardet, J., Dupre, B., and Allègre, C. J. (1999a). Geochemistry of large river suspended sediments: silicate weathering or recycling tracer? Geochim. Cosmochim. Acta 63, 4037–4051. doi: 10.1016/S0016-7037(99)00307-5
Gaillardet, J., Dupré, B., Louvat, P., and Allègre, C. J. (1999b). Global silicate weathering and CO2 consumption rates deduced from the chemistry of large rivers. Chem. Geol. 159, 3–30. doi: 10.1016/S0009-2541(99)00031-5
Gaillardet, J., Viers, J., and Dupré, B. (2014). “7.7 - trace elements in river waters,” in Treatise on Geochemistry 2nd Edn, eds. H. D. Holland and K. K. Turekian (Oxford: Elsevier), 195–235. Available online at: http://www.sciencedirect.com/science/article/pii/B9780080959757005076.
Garrels, R. M., and MacKenzie, F. T. (1972). A quantitative model for the sedimentary rock cycle. Mar. Chem. 1, 27–41. doi: 10.1016/0304-4203(72)90004-7
Goddéris, Y., Donnadieu, Y., Tombozafy, M., and Dessert, C. (2008). Shield effect on continental weathering: implication for climatic evolution of the Earth at the geological timescale. Model. Pedogenesis 145, 439–448. doi: 10.1016/j.geoderma.2008.01.020
Godsey, S. E., Kirchner, J. W., and Clow, D. W. (2009). Concentration-discharge relationships reflect chemostatic characteristics of US catchments. Hydrol. Process. 23, 1844–1864. doi: 10.1002/hyp.7315
Goudie, A. S., and Viles, H. A. (2012). Weathering and the global carbon cycle: geomorphological perspectives. Earth-Sci. Rev. 113, 59–71. doi: 10.1016/j.earscirev.2012.03.005
Gran, G. (1950). Determination of the equivalent point in potentiometric titrations. Acta Chem. Scand. 4, 559–577. doi: 10.3891/acta.chem.scand.04-0559
Guillocheau, F., Chelalou, R., Linol, B., Dauteuil, O., Robin, C., Mvondo, F., et al. (2015). “Cenozoic landscape evolution in and around the congo basin: constraints from sediments and planation surfaces,” in Geology and Resource Potential of the Congo Basin, eds. M. J. de Wit, F. Guillocheau, and M. C. J. de Wit (Berlin; Heidelberg: Springer Berlin Heidelberg), 271–313. doi: 10.1007/978-3-642-29482-2_14
Guillocheau, F., Simon, B., Baby, G., Bessin, P., Robin, C., and Dauteuil, O. (2018). Planation surfaces as a record of mantle dynamics: the case example of Africa. Rift. Passive Margins 53, 82–98. doi: 10.1016/j.gr.2017.05.015
Guinoiseau, D., Bouchez, J., Gélabert, A., Louvat, P., Filizola, N., and Benedetti, M. F. (2016). The geochemical filter of large river confluences. Chem. Geol. 441, 191–203. doi: 10.1016/j.chemgeo.2016.08.009
Gurumurthy, G. P., Balakrishna, K., Riotte, J., Braun, J.-J., Audry, S., Shankar, H. N. U., et al. (2012). Controls on intense silicate weathering in a tropical river, southwestern India. Chem. Geol. 300–301, 61–69. doi: 10.1016/j.chemgeo.2012.01.016
Hagedorn, B., and Cartwright, I. (2009). Climatic and lithologic controls on the temporal and spatial variability of CO2 consumption via chemical weathering: an example from the Australian Victorian Alps. Chem. Geol. 260, 234–253. doi: 10.1016/j.chemgeo.2008.12.019
Hajj, F., Poszwa, A., Bouchez, J., and Guérold, F. (2017). Radiogenic and “stable” strontium isotopes in provenance studies: a review and first results on archaeological wood from shipwrecks. J. Archaeol. Sci. 86, 24–49. doi: 10.1016/j.jas.2017.09.005
Hartmann, J., Moosdorf, N., Lauerwald, R., Hinderer, M., and West, A. J. (2014). Global chemical weathering and associated P-release - the role of lithology, temperature and soil properties. Chem. Geol. 363, 145–163. doi: 10.1016/j.chemgeo.2013.10.025
Herman, F., Seward, D., Valla, P. G., Carter, A., Kohn, B., Willett, S. D., et al. (2013). Worldwide acceleration of mountain erosion under a cooling climate. Nature 504, 423–426. doi: 10.1038/nature12877
Hilton, R. G., and West, A. J. (2020). Mountains, erosion and the carbon cycle. Nat. Rev. Earth Environ. 1, 284–299. doi: 10.1038/s43017-020-0058-6
Hu, J., Liu, L., Faccenda, M., Zhou, Q., Fischer, K. M., Marshak, S., et al. (2018). Modification of the western gondwana craton by plume-lithosphere interaction. Nat. Geosci. 11, 203–210. doi: 10.1038/s41561-018-0064-1
Jaupart, C., Molnar, P., and Cottrell, E. (2007). Instability of a chemically dense layer heated from below and overlain by a deep less viscous fluid. J. Fluid Mech. 572, 433–469. doi: 10.1017/S0022112006003521
Kim, H., Dietrich, W. E., Thurnhoffer, B. M., Bishop, J. K. B., and Fung, I. Y. (2017). Controls on solute concentration-discharge relationships revealed by simultaneous hydrochemistry observations of hillslope runoff and stream flow: the importance of critical zone structure. Water Resour. Res. 53, 1424–1443. doi: 10.1002/2016WR019722
Kim, S.-Y., Scourse, J., Marret, F., and Lim, D.-I. (2010). A 26,000-year integrated record of marine and terrestrial environmental change off Gabon, west equatorial Africa. Palaeogeogr. Palaeoclimatol. Palaeoecol. 297, 428–438. doi: 10.1016/j.palaeo.2010.08.026
Kittel, C. M. M., Nielsen, K., Tøttrup, C., and Bauer-Gottwein, P. (2018). Informing a hydrological model of the Ogooué with multi-mission remote sensing data. Hydrol. Earth Syst. Sci. 22, 1453–1472. doi: 10.5194/hess-22-1453-2018
Koffi, K. G., Hardy, O. J., Doumenge, C., Cruaud, C., and Heuertz, M. (2011). Diversity gradients and phylogeographic patterns in Santiria trimera (Burseraceae), a widespread African tree typical of mature rainforests. Am. J. Bot. 98, 254–264. doi: 10.3732/ajb.1000220
Kusky, T. M., Windley, B. F., Wang, L., Wang, Z., Li, X., and Zhu, P. (2014). Flat slab subduction, trench suction, and craton destruction: comparison of the North China, wyoming, and Brazilian cratons. Tectonophysics 630, 208–221. doi: 10.1016/j.tecto.2014.05.028
Lamb, S., and Watts, A. (2010). The origin of mountains - implications for the behaviour of Earth's lithosphere. Curr. Sci. 99, 1699–1718. Available online at: https://www.jstor.org/stable/24073494
Laraque, A., Bricquet, J.-P., Pandi, A., and Olivry, J.-C. (2009). A review of material transport by the Congo River and its tributaries. Hydrol. Process. 23, 3216–3224. doi: 10.1002/hyp.7395
Laraque, A., Moukandi N'kaya, G. D., Orange, D., Tshimanga, R., Tshitenge, J. M., Mahé, G., et al. (2020). Recent budget of hydroclimatology and hydrosedimentology of the congo river in Central Africa. Water 12:2613. doi: 10.3390/w12092613
Larsen, I. J., Montgomery, D. R., and Greenberg, H. M. (2014). The contribution of mountains to global denudation. Geology 42, 527–530. doi: 10.1130/G35136.1
Lienou, G., Mah,é, G., Paturel, J.-E., Servat, E., Sighomnou, D., Ekodeck, G. E., et al. (2008). Evolution of hydrological regimes in the equatorial area of Cameroon: an impact of climate variability in equatorial Africa? Hydrol. Sci. J. 53, 789–801. doi: 10.1623/hysj.53.4.789
Louvat, P., Gislason, S. R., and Allègre, C. J. (2008). Chemical and mechanical erosion rates in Iceland as deduced from river dissolved and solid material. Am. J. Sci. 308, 679–726. doi: 10.2475/05.2008.02
Mahe, G., Lerique, J., and Olivry, J.-C. (1990). The ogooue river gabon. discharge reconstruction and evidence of equatorial climatic variations [Le fleuve Ogooue au Gabon. Reconstitution des debits manquants et mise en evidence de variations climatiques a l'equateur]. Hydrol. Cont. 5, 105–124
Mahe, G., Lienou, G., Descroix, L., Bamba, F., Paturel, J. E., Laraque, A., et al. (2013). The rivers of Africa: witness of climate change and human impact on the environment. Hydrol. Process. 27, 2105–2114. doi: 10.1002/hyp.9813
Maher, K. (2010). The dependence of chemical weathering rates on fluid residence time. Earth Planet. Sci. Lett. 294, 101–110. doi: 10.1016/j.epsl.2010.03.010
Maher, K., and Chamberlain, C. P. (2014). Hydrologic regulation of chemical weathering and the geologic carbon cycle. Science 343, 1502–1504. doi: 10.1126/science.1250770
Meunier, J. D., Riotte, J., Braun, J. J., Sekhar, M., Chali,é, F., Barboni, D., et al. (2015). Controls of DSi in streams and reservoirs along the Kaveri River, South India. Sci. Total Environ. 502, 103–113. doi: 10.1016/j.scitotenv.2014.07.107
Meybeck, M. (1976). Total mineral dissolved transport by world major rivers / Transport en sels dissous des plus grands fleuves mondiaux. Hydrol. Sci. Bull. 21, 265–284. doi: 10.1080/02626667609491631
Meybeck, M. (2003). “5.08 – Global occurrence of major elements in rivers,” in Treatise on Geochemistry, eds H. D. Holland and K. K. Turekian (Oxford: Pergamon), 207–223. Available online at: http://www.sciencedirect.com/science/article/pii/B0080437516051641
Milliman, J. D., and Farnsworth, K. L. (2011). River Discharge to the Coastal Ocean - A Global Synthesis. Cambridge: Cambridge University Press
Millot, R., Gaillardet, J., Dupré, B., and Allègre, C. J. (2002). The global control of silicate weathering rates and the coupling with physical erosion: new insights from rivers of the Canadian Shield. Earth Planet. Sci. Lett. 196, 83–98. doi: 10.1016/S0012-821X(01)00599-4
Moatar, F., Abbott, B. W., Minaudo, C., Curie, F., and Pinay, G. (2017). Elemental properties, hydrology, and biology interact to shape concentration-discharge curves for carbon, nutrients, sediment, and major ions. Water Resour. Res. 53, 1270–1287. doi: 10.1002/2016WR019635
Moon, S., Chamberlain, C. P., and Hilley, G. E. (2014). New estimates of silicate weathering rates and their uncertainties in global rivers. Geochim. Cosmochim. Acta 134, 257–274. doi: 10.1016/j.gca.2014.02.033
Moore, J., Jacobson, A. D., Holmden, C., and Craw, D. (2013). Tracking the relationship between mountain uplift, silicate weathering, and long-term CO2 consumption with Ca isotopes: Southern Alps, New Zealand. Chem. Geol. 341, 110–127. doi: 10.1016/j.chemgeo.2013.01.005
Moquet, J.-S., Crave, A., Viers, J., Seyler, P., Armijos, E., Bourrel, L., et al. (2011). Chemical weathering and atmospheric/soil CO2 uptake in the Andean and Foreland Amazon basins. Chem. Geol. 287, 1–26. doi: 10.1016/j.chemgeo.2011.01.005
Moquet, J.-S., Guyot, J.-L., Morera, S., Crave, A., Rau, P., Vauchel, P., et al. (2018). Temporal variability and annual budget of inorganic dissolved matter in Andean Pacific Rivers located along a climate gradient from northern Ecuador to southern Peru. Comptes Rendus Geosci. 350, 76–87. doi: 10.1016/j.crte.2017.11.002
Moquet, J. S., Guyot, J. L., Viers, J., Crave, A., Filizola, N., Sanchez, L. S. H., et al. (2016). Dissolved Amazon River dissolved load: temporal dynamic and annual budget from the Andes to the ocean. Environ. Sci. Pollut. Res. 23, 11405–11429. doi: 10.1007/s11356-015-5503-6
Moquet, J. S., Viers, J., Crave, A., Armijos, E., Lagane, C., Lavado, W., et al. (2014). Comparison between silicate weathering and physical erosion rates in Andean basins of Amazon river. Procedia Earth Planet. Sci. 10, 275–279. doi: 10.1016/j.proeps.2014.08.061
Négrel, P., Allègre, C. J., Dupré, B., and Lewin, E. (1993). Erosion sources determined by inversion of major and trace element ratios and strontium isotopic ratios in river water: The Congo Basin case. Earth Planet. Sci. Lett. 120, 59–76. doi: 10.1016/0012-821X(93)90023-3
Njutapvoui Fokouop, N. (2017). Régimes des précipitations et relations pluies-niveaux d'eau-débits dans le bassin versant du Komo (Gabon). Abomey-Calavi: IRD - Université d'Abomey-Calavi (UAC), BENIN
Nkoue Ndondo, G. R., Probst, J.-L., Ndjama, J., Ndam Ngoupayou, J. R., Boeglin, J.-L., Takem, G. E., et al. (2020). Stable carbon isotopes δ13C as a proxy for characterizing carbon sources and processes in a small tropical headwater catchment: Nsimi, Cameroon. Aquat. Geochem. doi: 10.1007/s10498-020-09386-8
Norton, K. P., and Schlunegger, F. (2017). Lack of a weathering signal with increased Cenozoic erosion? Terra Nova 29, 265–272. doi: 10.1111/ter.12278
Oliva, P., Viers, J., and Dupré, B. (2003). Chemical weathering in granitic environments. Chem. Geol. 202, 225–256. doi: 10.1016/j.chemgeo.2002.08.001
Oliva, P., Viers, J., Dupré, B., Fortuné, J. P., Martin, F., Braun, J. J., et al. (1999). The effect of organic matter on chemical weathering: study of a small tropical watershed: nsimi-zoétélé site, cameroon. Geochim. Cosmochim. Acta 63, 4013–4035. doi: 10.1016/S0016-7037(99)00306-3
Olivié-Lauquet, G., Allard, T., Benedetti, M., and Muller, J.-P. (1999). Chemical distribution of trivalent iron in riverine material from a tropical ecosystem: a quantitative EPR study. Water Res. 33, 2726–2734. doi: 10.1016/S0043-1354(98)00479-5
ORSTOM (1964). Régime Hydrologique de la M'Bei Conditions Hydrologiques. Paris: Service hydrologique.
Oslisly, R., White, L., Bentaleb, I., Favier, C., Fontugne, M., Gillet, J.-F., et al. (2013). Climatic and cultural changes in the west congo basin forests over the past 5000 years. Philos. Trans. R. Soc. B Biol. Sci. 368:20120304. doi: 10.1098/rstb.2012.0304
Pattanaik, J. K., Balakrishnan, S., Bhutani, R., and Singh, P. (2013). Estimation of weathering rates and CO2 drawdown based on solute load: Significance of granulites and gneisses dominated weathering in the Kaveri River basin, Southern India. Geochim. Cosmochim. Acta 121, 611–636. doi: 10.1016/j.gca.2013.08.002
Penman, D. E., Caves Rugenstein, J. K., Ibarra, D. E., and Winnick, M. J. (2020). Silicate weathering as a feedback and forcing in Earth's climate and carbon cycle. Earth-Sci. Rev. 209:103298. doi: 10.1016/j.earscirev.2020.103298
Picouet, C., Dupr,é, B., Orange, D., and Valladon, M. (2002). Major and trace element geochemistry in the upper Niger river (Mali): physical and chemical weathering rates and CO2 consumption. Chem. Geol. 185, 93–124. doi: 10.1016/S0009-2541(01)00398-9
Pokrovsky, O. S., Manasypov, R. M., Loiko, S., Shirokova, L. S., Krickov, I. A., Pokrovsky, B. G., et al. (2015). Permafrost coverage, watershed area and season control of dissolved carbon and major elements in western Siberian rivers. Biogeosciences 12, 6301–6320. doi: 10.5194/bg-12-6301-2015
Pokrovsky, O. S., Manasypov, R. M., Loiko, S. V., Krickov, I. A., Kopysov, S. G., Kolesnichenko, L. G., et al. (2016). Trace element transport in western Siberian rivers across a permafrost gradient. Biogeosciences 13, 1877–1900. doi: 10.5194/bg-13-1877-2016
Pokrovsky, O. S., Schott, J., and Dupré, B. (2006). Basalt weathering and trace elements migration in the boreal Arctic zone. Ext. Abstr. Present. 7th Symp Geochem. Earths Surf. GES-7 88, 304–307. doi: 10.1016/j.gexplo.2005.08.062
Pourret, O., Dia, A., Davranche, M., Gruau, G., Hénin, O., and Angée, M. (2007). Organo-colloidal control on major- and trace-element partitioning in shallow groundwaters: confronting ultrafiltration and modelling. Met. Interact. Nat. Org. Matter Watershed-Scale Geochem. 22, 1568–1582. doi: 10.1016/j.apgeochem.2007.03.022
Raymo, M. E., and Ruddiman, W. F. (1992). Tectonic forcing of late cenozoic mountain building on ocean geochemical cycles. Geology 359, 117–122. doi: 10.1038/359117a0
Regard, V., Carretier, S., Boeglin, J.-L., Ndam Ngoupayou, J.-R., Dzana, J.-G., Bedimo Bedimo, J.-P., et al. (2016). Denudation rates on cratonic landscapes: comparison between suspended and dissolved fluxes, and 10Be analysis in the Nyong and Sanaga River basins, south Cameroon. Earth Surf. Process. Landf. 41, 1671–1683. doi: 10.1002/esp.3939
Riebe, C. S., Hahm, W. J., and Brantley, S. L. (2017). Controls on deep critical zone architecture: a historical review and four testable hypotheses. Earth Surf. Process. Landf. 42, 128–156. doi: 10.1002/esp.4052
Rodríguez Tribaldos, V., White, N. J., Roberts, G. G., and Hoggard, M. J. (2017). Spatial and temporal uplift history of South America from calibrated drainage analysis. Geochem. Geophys. Geosystems 18, 2321–2353. doi: 10.1002/2017GC006909
Rose, J., Vilge, A., Olivie-Lauquet, G., Masion, A., Frechou, C., and Bottero, J.-Y. (1998). Iron speciation in natural organic matter colloids. Colloids Surf. Physicochem. Eng. Asp. 136, 11–19. doi: 10.1016/S0927-7757(97)00150-7
Scherler, D., DiBiase, R. A., Fisher, G. B., and Avouac, J.-P. (2017). Testing monsoonal controls on bedrock river incision in the Himalaya and Eastern Tibet with a stochastic-threshold stream power model. J. Geophys. Res. Earth Surf. 122, 1389–1429. doi: 10.1002/2016JF004011
Seranne, M., Bruguier, O., and Moussavou, M. (2008). U-Pb single zircon grain dating of Present fluvial and Cenozoic aeolian sediments from Gabon: consequences on sediment provenance, reworking, and erosion processes on the equatorial West African margin. Bull. Société Géologique Fr. 179, 29–40. doi: 10.2113/gssgfbull.179.1.29
Sighomnou, D. (2004). Analyse et redéfinition des régimes climatiques et hydrologiques du Cameroun : perspectives d'évolution des ressources en eau, Tesis Univ. Yaoudé
Sondag, F., Guyot, J. L., Moquet, J. S., Laraque, A., Adele, G., Cochonneau, G., et al. (2010). Suspended sediment and dissolved load budgets of two Amazonian rivers from French Guiana : Maroni and Oyapock rivers. Hydrol. Process. 24, 1433–1445. doi: 10.1002/hyp.7603
Stallard, R. F. (1985). “River chemistry, geology, geomorphology, and soils in the amazon and orinoco basins. in The Chemistry of Weathering. Nato ASI Series (C: Mathematical and Physical Sciences), Vol. 149. ed J. I. Drever (Dordrecht: Springer)
Stallard, R. F., and Edmond, J. M. (1987). Geochemistry of the Amazon. 3. weathering chemistry and limits to dissolved inputs. J. Geophys. Res. 92, 8293–8302. doi: 10.1029/JC092iC08p08293
Stein, M., Starinsky, A., Katz, A., Goldstein, S. L., Machlus, M., and Schramm, A. (1997). Strontium isotopic, chemical, and sedimentological evidence for the evolution of lake lisan and the dead sea. Geochim. Cosmochim. Acta 61, 3975–3992. doi: 10.1016/S0016-7037(97)00191-9
Swoboda, S., Brunner, M., Boulyga, S. F., Galler, P., Horacek, M., and Prohaska, T. (2008). Identification of Marchfeld asparagus using Sr isotope ratio measurements by MC-ICP-MS. Anal. Bioanal. Chem. 390, 487–494. doi: 10.1007/s00216-007-1582-7
Tamrat, W. Z., Rose, J., Grauby, O., Doelsch, E., Levard, C., Chaurand, P., et al. (2019). Soil organo-mineral associations formed by co-precipitation of Fe, Si and Al in presence of organic ligands. Geochim. Cosmochim. Acta 260, 15–28. doi: 10.1016/j.gca.2019.05.043
Thiéblemont, D., Castaing, C., Bouton, P., Billa, M., Brian, J. P., Goujou, J. C., et al. (2009). Carte géologique et des Ressources minérales de la République Gabonaise à 1/1 000 000
Thiéblemont, D., Guerrot, C., Négrel, P., Braucher, R., Bourlès, D. L., and Thiéblemont, R. (2014). Nd-isotope evidence for the distal provenance of the historical (c. <3000BP) lateritic surface cover underlying the Equatorial forest in Gabon (Western Africa). Aeolian Res. 15, 177–192. doi: 10.1016/j.aeolia.2014.06.002
Trostle, K. D., Ray Runyon, J., Pohlmann, M. A., Redfield, S. E., Pelletier, J., McIntosh, J., et al. (2016). Colloids and organic matter complexation control trace metal concentration-discharge relationships in Marshall Gulch stream waters. Water Resour. Res. 52, 7931–7944. doi: 10.1002/2016WR019072
UNEP (2010). Africa Water Atlas. Nairobi, Kenya: Division of Early Warning and Assessment (DEWA). United Nations Environment Programme (UNEP)
Vázquez-Ortega, A., Huckle, D., Perdrial, J., Amistadi, M. K., Durcik, M., Rasmussen, C., et al. (2016). Solid-phase redistribution of rare earth elements in hillslope pedons subjected to different hydrologic fluxes. Chem. Geol. 426, 1–18. doi: 10.1016/j.chemgeo.2016.01.001
Viers, J., Dupré, B., Braun, J.-J., Deberdt, S., Angeletti, B., Ngoupayou, J. N., et al. (2000). Major and trace element abundances, and strontium isotopes in the Nyong basin rivers (Cameroon): constraints on chemical weathering processes and elements transport mechanisms in humid tropical environments. Chem. Geol. 169, 211–241. doi: 10.1016/S0009-2541(00)00298-9
Viers, J., Dupré, B., Polvé, M., Schott, J., Dandurand, J.-L., and Braun, J.-J. (1997). Chemical weathering in the drainage basin of a tropical watershed (Nsimi-Zoetele site, Cameroon) : comparison between organic-poor and organic-rich waters. Chem. Geol. 140, 181–206. doi: 10.1016/S0009-2541(97)00048-X
Violette, A., Goddéris, Y., Maréchal, J.-C., Riotte, J., Oliva, P., Mohan Kumar, M. S., et al. (2010). Modelling the chemical weatheringnext term fluxes at the watershed scale in the Tropics (Mule Hole, South India): Relative contribution of the smectite/kaolinite assemblage versus primary minerals. Chem. Geol. 2010, 42–60. doi: 10.1016/j.chemgeo.2010.07.009
Von Blanckenburg, F., Bouchez, J., Ibarra, D. E., and Maher, K. (2015). Stable runoff and weathering fluxes into the oceans over quaternary climate cycles. Nat. Geosci. 8, 538–542. doi: 10.1038/ngeo2452
Weber, F., Gauthier-Lafaye, F., Whitechurch, H., Ulrich, M., and El Albani, A. (2016). The 2-Ga eburnean orogeny in gabon and the opening of the francevillian intracratonic basins: a review. Comptes Rendus Geosci. 348, 572–586. doi: 10.1016/j.crte.2016.07.003
West, A. J. (2012). Thickness of the chemical weathering zone and implications for erosional and climatic drivers of weathering and for carbon-cycle feedbacks. Geology 40, 811–814. doi: 10.1130/G33041.1
West, A. J., Bickle, M. J., Collins, R., and Brasington, J. (2002). Small-catchment perspective on Himalayan weathering fluxes. Geology 30, 355–358. doi: 10.1130/0091-7613(2002)030<0355:SCPOHW>2.0.CO;2
West, A. J., Galy, A., and Bickle, M. (2005). Tectonic and climatic controls on silicate weathering. Earth Planet. Sci. Lett. 235, 211–228. doi: 10.1016/j.epsl.2005.03.020
White, A. F., and Blum, A. E. (1995). Effects of climate on chemical weathering in watersheds. Geochim. Cosmochim. Acta 59, 1729–1747. doi: 10.1016/0016-7037(95)00078-E
Willenbring, J. K., and Von Blanckenburg, F. (2010). Long-term stability of global erosion rates and weathering during late cenozoic cooling. Nature 465, 211–214. doi: 10.1038/nature09044
Yu, Z., Yan, N., Wu, G., Xu, T., and Li, F. (2020). Chemical weathering in the upstream and midstream reaches of the yarlung tsangpo basin, southern tibetan plateau. Chem. Geol. 559:119906. doi: 10.1016/j.chemgeo.2020.119906
Zakharova, E. A., Pokrovsky, O. S., Dupré, B., Gaillardet, J., and Efimova, L. E. (2007). Chemical weathering of silicate rocks in Karelia region and Kola peninsula, NW Russia: Assessing the effect of rock composition, wetlands and vegetation. Chem. Geol. 242, 255–277. doi: 10.1016/j.chemgeo.2007.03.018
Zakharova, E. A., Pokrovsky, O. S., Dupré, B., and Zaslavskaya, M. B. (2005). Chemical weathering of silicate rocks in aldan shield and baikal uplift: insights from long-term seasonal measurements of solute fluxes in rivers. Chem. Geol. 214, 223–248. doi: 10.1016/j.chemgeo.2004.10.003
Keywords: chemical weathering, river hydrochemistry, Congo craton, Western Central Africa, Ogooué River basin, regolith rejuvenation
Citation: Moquet J-S, Bouchez J, Braun J-J, Bogning S, Mbonda AP, Carretier S, Regard V, Bricquet J-P, Paiz M-C, Mambela E and Gaillardet J (2021) Contrasted Chemical Weathering Rates in Cratonic Basins: The Ogooué and Mbei Rivers, Western Central Africa. Front. Water 2:589070. doi: 10.3389/frwa.2020.589070
Received: 30 July 2020; Accepted: 10 December 2020;
Published: 03 February 2021.
Edited by:
Alexis Navarre-Sitchler, Colorado School of Mines, United StatesReviewed by:
Alissa M. White, University of Arizona, United StatesBryan G. Moravec, University of Arizona, United States
Richard Wanty, Colorado School of Mines, United States
Copyright © 2021 Moquet, Bouchez, Braun, Bogning, Mbonda, Carretier, Regard, Bricquet, Paiz, Mambela and Gaillardet. This is an open-access article distributed under the terms of the Creative Commons Attribution License (CC BY). The use, distribution or reproduction in other forums is permitted, provided the original author(s) and the copyright owner(s) are credited and that the original publication in this journal is cited, in accordance with accepted academic practice. No use, distribution or reproduction is permitted which does not comply with these terms.
*Correspondence: Jean-Sébastien Moquet, amVhbi1zZWJhc3RpZW4ubW9xdWV0QGNucnMtb3JsZWFucy5mcg==