 Robert E. Danczak1,2*
 Vanessa A. Garayburu-Caruso1,3
 Lupita Renteria1Sophia A. McKever1Opal C. Otenburg1Samantha R. Grieger1
 Kyongho Son1
 Matthew H. Kaufman1
 Stephanie G. Fulton1J. Alan Roebuck Jr.1
 Allison N. Myers-Pigg1
 James C. Stegen1,3*
- 1Pacific Northwest National Laboratory, Richland, WA, United States
- 2Hiram College, Hiram, OH, United States
- 3School of the Environment, Washington State University, Pullman, WA, United States
A large amount of dissolved organic matter (DOM) is transported to the ocean from terrestrial inputs each year (~0.95 Pg C per year) and undergoes a series of abiotic and biotic reactions, causing a significant release of CO2. Combined, these reactions result in variable DOM characteristics (e.g., nominal oxidation state of carbon, double-bond equivalents, chemodiversity) which have demonstrated impacts on biogeochemistry and ecosystem function. Despite this importance, however, comparatively few studies focus on the drivers for DOM chemodiversity along a riverine continuum. Here, we characterized DOM within samples collected from a stream network in the Yakima River Basin using ultrahigh-resolution mass spectrometry (i.e., FTICR-MS). To link DOM chemistry to potential function, we identified putative biochemical transformations within each sample. We also used various molecular characteristics (e.g., thermodynamic favorability, degradability) to calculate a series of functional diversity metrics. We observed that the diversity of biochemical transformations increased with increasing upstream catchment area and landcover. This increase was also connected to expanding functional diversity of the molecular formula. This pattern suggests that as molecular formulas become more diverse in thermodynamics or degradability, there is increased opportunity for biochemical transformations, potentially creating a self-reinforcing cycle where transformations in turn increase diversity and diversity increase transformations. We also observed that these patterns are, in part, connected to landcover whereby the occurrence of many landcover types (e.g., agriculture, urban, forest, shrub) could expand DOM functional diversity. For example, we observed that a novel functional diversity metric measuring similarity to common freshwater molecular formulas (i.e., carboxyl-rich alicyclic molecules) was significantly related to urban coverage. These results show that DOM diversity does not decrease along stream networks, as predicted by a common conceptual model known as the River Continuum Concept, but rather are influenced by the thermodynamic and degradation potential of molecular formula within the DOM, as well as landcover patterns.
1. Introduction
Dissolved organic matter (DOM) plays substantial role in biogeochemical cycling within riverine ecosystems as it travels and transforms along river corridors (Regnier et al., 2013; Ward et al., 2017; Drake et al., 2018; Tank et al., 2018). Specifically, a large amount of carbon is transported to ocean from terrestrial inputs (~0.95 Pg C per year) and undergoes abiotic and biotic transformations contributing to a significant release of CO2 (Cole et al., 2007; Battin et al., 2009; Wohl et al., 2017; Cory and Kling, 2018; Graham et al., 2018; Stegen et al., 2018; Tank et al., 2018; Zarnetske et al., 2018). Combined, these processes result in variable DOM properties (e.g., nominal oxidation state of carbon, double-bond equivalents) and chemodiversity (e.g., molecular formula richness which could be studied through space or time) (Garayburu-Caruso et al., 2020a; Danczak et al., 2021). This variability in DOM across systems and along reaches has demonstrated impacts on biogeochemistry and can result in divergent ecosystem function. For example, Garayburu-Caruso et al. showed that aerobic respiration rates of riverbed sediments increase with the thermodynamic favorability of organic matter (see also Garayburu-Caruso et al., 2020b; Sengupta et al., 2021). Despite this importance, however, comparatively few studies focus on the drivers for DOM chemodiversity along a riverine continuum.
Central to understanding chemodiversity within riverine systems is the river continuum concept (RCC), a conceptual model providing a basis to understand river ecosystem function through the lens of biological and chemical diversity (Vannote et al., 1980; Doretto et al., 2020). Briefly, the RCC posits that low order streams will have a higher diversity of DOM due to greater inputs of detritus. As stream orders increase, DOM diversity will decrease as a function of microbial consumption (Vannote et al., 1980; Little et al., 2022). Mosher et al. observed that the RCC was largely supported (i.e., 1st-order streams had the highest diversity) across three forested ecosystems (Mosher et al., 2015). Recent studies, however, have indicated that spatial and temporal factors (e.g., land cover, storms, etc.) may play a modulating or even more significant role in driving DOM diversity than increasing stream order (Casas-Ruiz et al., 2020; Roebuck et al., 2020; Coble et al., 2022). Regardless of its wide-reaching applicability, the RCC remains a suitable model against which comparisons can be drawn and under which data can be contextualized.
While the RCC provides fundamental understanding on riverine DOM diversity, the drivers of these processes are underexplored. Recent work in metacommunity assembly processes applied to DOM chemistry provide a tool to explore these drivers under a mechanistic framework. Specifically, Danczak et al. proposed the formalized integration of concepts and tools from metacommunity ecology with the field of environmental metabolomics (e.g., organic matter composition) (Danczak et al., 2020). Other studies have leveraged a similar approach to evaluate the diversity of DOM characteristics using a metric referred to as functional diversity (Mentges et al., 2017; Roebuck et al., 2020; Wang et al., 2022). As compared to typical alpha diversity metrics (e.g., counts of species or formulas), functional diversity allows scientists to evaluate the variety in the types of functions occurring within an ecosystem. Here, function does not necessarily indicate any specific metabolic capability, but rather highlights characteristics that may have a disproportionate ecological function in a given sample or ecosystem. For example, functional diversity calculated using the number of carbons or H/C ratio provides insight into the degradation state of carbon within a sample (Mentges et al., 2017). When compared across samples or calculated using various metrics, DOM composition and potential ecological roles can be studied broadly.
Functional diversity can help provide insight into the potential roles that DOM might play in an ecosystem and the variation in molecular properties through space or time. Mentges et al. (2017) demonstrated that marine DOM became more functionally homogenous as it was degraded by calculating functional diversity using the number of carbons and H/C ratios. Within a riverine ecosystem, Roebuck et al. (2020) showed that functional diversity calculated using number of nitrogen, double-bond equivalents, and m/z values were not significantly related to stream order. Functional diversity measurements generated using number of carbons and H/C ratios have also helped reveal degradation trajectories within Synechococcus-derived organic matter (Wang et al., 2022). These data indicate that functional diversity of DOM reveals information distinct from either typical DOM measurements (i.e., average characteristics) or molecular formula diversity.
While functional diversity provides ecological insight into the community, an analysis known as the transformation analysis can provide insight into potential biochemical reactions occurring through an ecosystem (Moritz et al., 2017; Graham et al., 2018; Kaling et al., 2018; Danczak et al., 2020). In brief, the transformation analysis allows researchers to identify potential reactions by first looking at the mass difference between all peaks within a sample, and then comparing these differences to a list of common and known reactions. Recent research has demonstrated that results from this analysis are significantly related to ecosystem biogeochemistry (Graham et al., 2018; Buser-Young et al., 2023) and provide insight into both biotic and abiotic processes (Fudyma et al., 2021; Stegen et al., 2022). Given that these transformations are inherently tied to DOM composition changes, we suspect that the number of transformations within a sample should be related to the functional diversity of that sample (e.g., functional diversity calculated using H/C measures degradation state while transformations also partially estimate degradation may be significantly related). In effect, the transformation analysis provides yet another analysis of diversity, but focused more on the potential biochemical reactions rather than ecological function or molecular formula count.
Here, we analyzed samples collected along a single catchment in the Yakima River basin using ultrahigh-resolution mass spectrometry (i.e., Fourier Transform Ion Cyclotron Resonance Mass Spectrometry/FTICR-MS). Using these data, we sought to investigate how functional diversity and potential biochemical reactions identified using a transformation analysis varied as a function of catchment area and landcover. Results for these analyses revealed significant relationships between functional DOM diversity, potential biochemical reactions, and catchment area which contradict the RCC. Moreover, these results provided information to develop a conceptual model connecting DOM functional diversity and potential biochemical transformations.
2. Methods
2.1. Sample collection
We sampled at 6 sites that span multiple biomes across the Yakima River Basin (YRB). The basin has a semi-arid climate, it drains an area of 15,941.4 square km, is considered fundamental in supporting agricultural activities in the Pacific Northwest and it is one of the most highly irrigated areas in the United States (Morace et al., 1999) (Figure 1A). It is a mountainous basin draining from snowpack that transitions across vegetation, climactic zones, and drains into an agricultural valley (Vano et al., 2010). The site selection was based on locations of existing USGS or Bureau of Reclamation gages that span throughout the YRB. Surface water from sampling locations were sampled weekly during the months of April and May 2021. Metadata collection during sampling events included latitude, longitude, sediment texture, hydromorphic setting, weather and photos from sediments and water at each site. These variables were not meant to be quantitative but rather visual assessments for site contextualization. Sampling protocols, metadata and site photos can be accessed through Environmental Systems Science Data Infrastructure for a Virtual Ecosystem (ESS-DIVE—https://data.ess-dive.lbl.gov/) (Otenburg et al., 2022).
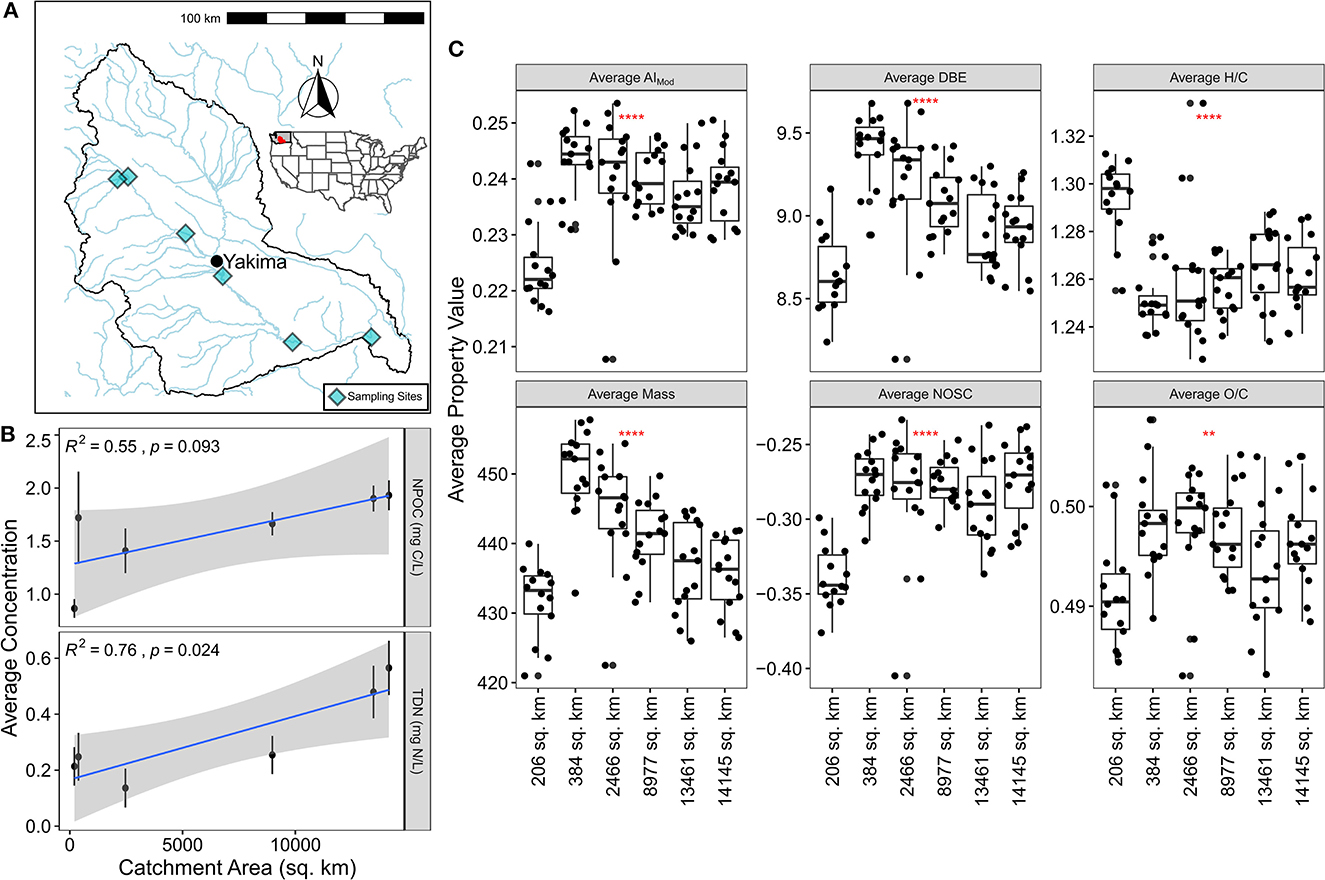
Figure 1. (A) Map of the Yakima River Basin with sampling sites indicated by light blue diamonds. (B) Average NPOC and TDN concentration plotted against catchment area. The blue line indicates line-of-best-fit while the statistics report the results of Pearson correlations. Error bars illustrate the standard error associated with the mean. (C) Average FTICR-MS derived molecular properties plotted grouped by catchment area. Significance via a Kruskal-Wallis test is indicated in each panel by the red stars.
Surface water samples were collected in triplicate at each site using a 60 mL syringe and filtered through a 0.22 μm sterivex filter (EMD Millipore). Samples were first filtered into two sets of 40 mL glass vials (I-Chem amber VOA glass vials; ThermoFisher). For the first set, 20-30 mL of sample were filtered into glass vials, the second set consisted of 20 mL of sample filtered into vials pre-acidified with 10 μL of 85% phosphoric acid. Samples were placed on blue ice upon collection. At the end of the day, samples were transported to Pacific Northwest National Laboratory where filtered samples in pre-acidified vials were placed in a −20°C freezer and filtered samples in non-acidified vials were stored at 4°C until analysis.
2.2. Geochemical analysis
Non-acidified samples were analyzed within 2 weeks of field collection and were run at Marine and Coastal Research Laboratory, a Pacific Northwest National Laboratory facility in Sequim, WA. We measured dissolved organic carbon (DOC) as Non-Purgeable Organic Carbon (NPOC), and total dissolved nitrogen (TDN) on a Shimadzu TOC-L Total Organic Carbon Analyzer connected to an ASI-L autosampler. The NPOC calibration curve spanned 0.25 mg/L – 100 mg/L as C and a TDN calibration curve expanded 0.1 mg/L – 3 mg/L as N. Blanks and check standards were added every 10 samples to ensure reading quality. 150 uL of sample was sparged into the TOC-L furnace at 680°C then the best 3 out of 5 injections were averaged to get a final concentration. Visual checks of the calibration curve, samples, blanks, and check standard peaks were performed before exporting data. Concentrations below the limit of detection of the instrument, or below the standard curve were flagged.
2.3. FTICR-MS analysis
DOM in each sample was characterized using Fourier transform ion cyclotron resonance mass spectrometry (FTICR-MS) following methods described elsewhere (Danczak et al., 2020, 2021; Garayburu-Caruso et al., 2020a). Briefly, aqueous samples with standardized carbon concentrations (NPOC 0.69 – 1.5 mg C/L) were acidified to pH 2 with 85% phosphoric acid and extracted with PPL cartridges. High-resolution mass spectra were collected using a 12 Tesla (12T) Bruker SolariX FTICR mass spectrometer (Bruker, SolariX, Billerica, MA) equipped with a standard electrospray ionization (ESI) source set to negative mode. BrukerDaltonik Data Analysis (version 5.0) was used to convert raw spectra to a list of m/z values by applying the FTMS peak picker module. Chemical formulae were assigned using Formularity (Tolić et al., 2017) according to the Compound Identification Algorithm (Kujawinski and Behn, 2006; Minor et al., 2012; Tfaily et al., 2017) with the following settings: a signal-to-noise ratio >7, mass measurement error < 0.5 ppm, and allowing for CHONSP [Formularity formula settings: O > 0 AND (N + S + P) < 6 AND S < 3 AND P < 2].
The R package ftmsRanalysis (Bramer and White, 2019; Bramer et al., 2020) was used to remove peaks that either were outside the desired m/z range (200–900 m/z) or were assigned as having an isotopic signature, calculate a number of derived metrics [double-bond equivalent (DBE), modified aromaticity index (AIMod), nominal oxidation state of carbon (NOSC)], and organize the data into a common data format (Hughey et al., 2001; Koch and Dittmar, 2006; LaRowe and Van Cappellen, 2011; Tfaily et al., 2015). Given that peak intensities cannot be used to infer concentration, all peak intensities were changed to binary presence/absence (Tfaily et al., 2017).
2.4. Meta-metabolome ecology
Following the protocols established in Danczak et al. (2020) we generated a molecular characteristics dendrogram (MCD) and transformation dendrogram (TD) (Danczak et al., 2020). The MCD was generated by first measuring the Euclidean distance between molecular formulas based on their derived metrics (e.g., elemental composition, double-bond equivalents, modified aromaticity index, and Kendrick's defect), and then performing a UPGMA (unweighted pair group method with arithmetic mean) hierarchical clustering analysis (Sokal and Michener, 1958). This results in a dendrogram with peaks as tips and the distance between them representing their approximate molecular similarity.
To generate the TD, we performed a transformation analysis as described in detail elsewhere (Moritz et al., 2017; Graham et al., 2018; Kaling et al., 2018; Danczak et al., 2021; Fudyma et al., 2021). In brief, this analysis compares the masses of detected peaks, matches the resulting mass differences to a database of known biochemical transformations, and then assigns transformations based on approximate masses. These transformations represent the putative biochemical transformations that may occur in a given sample (Graham et al., 2018; Danczak et al., 2021). Once the transformations for all potential peaks are identified, we measure the number of transformations required for one peak to become a different peak. These pairwise transformation distances are then standardized between 0 and 1 and used as input for a UPGMA hierarchical clustering analysis. In comparison to the MCD, the resulting dendrogram has peaks as tips but the distances now reflect the number of conversions required for one peak to become a different peak instead.
Faith's phylogenetic diversity (PD; pd function from the picante R package) was calculated using both the MCD and TD as inputs resulting in two separate metrics: Faith's PD (MCD) and Faith's PD (TD) (Faith, 1992; Kembel et al., 2010). Faith's PD (MCD) roughly captures the similarity of molecular characteristics within a sample, while Faith's PD (TD) represents the potential diversity of biochemical interactions in a sample (Danczak et al., 2020). In addition to these relational alpha diversity metrics, we also counted the number of peaks per sample (# of Peaks; e.g., molecular richness), counted the number of transformations per sample (Trans. Count), and normalized the number of transformations to the number of peaks within a sample [Trans. Count (Norm.)].
2.5. Functional diversity
Rao's functional diversity (Rao's FD) was calculated for each sample following the generalized formula reported by Botta-Dukát (2005) and Mentges et al. (2017):
Where, ci and cj are the chemical characteristics from the ith and jth molecular formulas, respectively, and N is the number of molecular formulas. Typically, when applied to chemical data, the resulting absolute difference in chemical characteristics (|ci – cj|) is weighted by sum-normalized signal intensities of the ith and jth molecular formulas (pi and pj). Given that our data is presence/absence, however, these weights become applied consistently across samples allowing us to focus on chemical differences. Rao's FD was calculated using four chemical characteristics: number of carbons (Rao's FDCarbon), hydrogen-to-carbon ratio (Rao's FDH/C), nominal oxidation state of carbon (Rao's FDNOSC), and the similarity to carboxyl-rich alicyclic-like molecules (Rao's FDCRAM). Additionally, a multivariate version (Rao's FDMulti) was calculated which was generated using a Euclidean distance matrix calculated from the number of carbons, H/C, and NOSC values.
Each of these metrics reveals different dynamics within the assemblage. Rao's FDCarbon and Rao's FDH/C indicate biodegradability while Rao's FDNOSC highlight variation in thermodynamic characteristics (Mentges et al., 2017). Rao's FDMulti can help uncover patterns associated with multiple traits that an individual trait may not capture (Laliberté and Legendre, 2010). Rao's FDCRAM is a metric developed specifically to target molecular formulas that are characteristic of rivers. Carboxyl-rich alicyclic molecules (CRAM) have been demonstrated to constitute a significant portion of DOM from diverse rivers (Mosher et al., 2015). As Mosher et al. (2015) described, CRAM is largely a component of lignin making the two molecule types difficult to disentangle without molecular structure. By developing a metric called Distance-to-CRAM, however, we can assess how similar a molecular formula from our dataset is a CRAM-like molecular formula; given the uncertainty associated with molecular characteristics and molecular structure, we use the affix “-like” to emphasize this unknowability. This metric is calculated following similar methodology to generating the MCD above. Specifically, this metric is generated by measuring the average Euclidean distance between the chemical characteristics of a given compound (elemental composition, AIMod, DBE, NOSC, H/C, and O/C) and the chemical characteristics of 613 known CRAM-like molecular formulas (Hertkorn et al., 2006). A smaller Distance-to-CRAM would reflect a molecular formula that is either CRAM-like or chemically similar to a CRAM-like molecular formula while a larger distance would indicate that a molecular formula shares little in common with CRAM-like molecular formulas. In turn, Rao's FDCRAM helps evaluate DOM as a function of common riverine molecular formulas.
2.6. Watershed analysis
To explain the spatial variability of DOM diversity, we used various watershed variables. Table 1 shows the list of the variables, and their references. Used variables represent climate, topography, landcover and hydrologic conditions at the sampling locations. The watershed variables are saved with the National Hydrography Dataset PLUS (NHDPLUS v2) (https://nhdplus.com/NHDPlus/). Thus, to extract the variables of interest at each sampling location, the sampling locations were aligned with the NHDPLUS streamlines and the nearest stream reach of each sampling location via st_nearest_feature function in the R's sf package was found. To explain the local and large-scale drivers on the DOM, we used catchment and basin-scale variables. Catchment scale accounts for the smallest NHDPLUS catchment drainage area for each stream reach, and basin scale account for the total upstream drainage area for each stream reach. The detailed descriptions for the NHDPLUS database are found in the paper of Wieczorek et al. (2018).
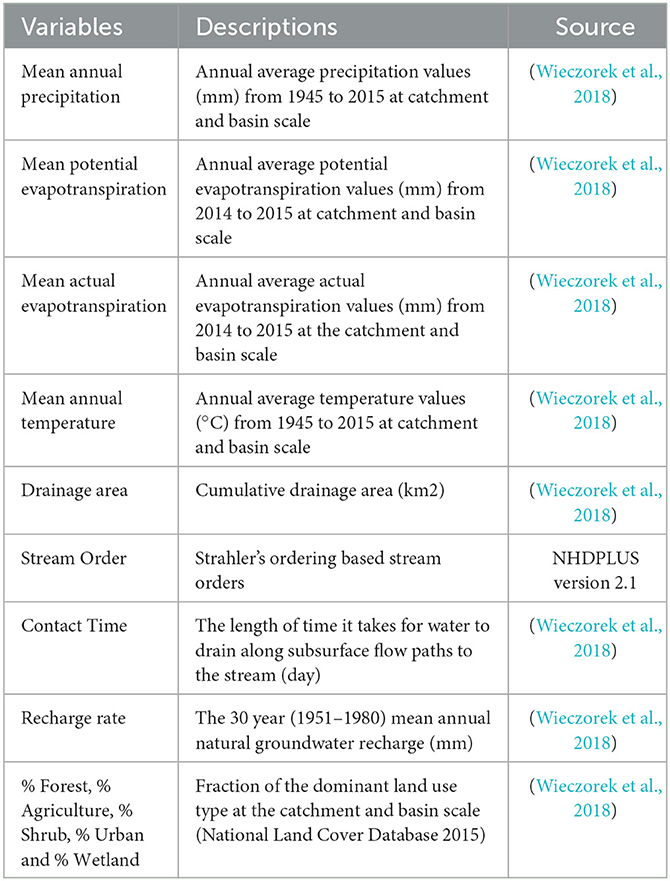
Table 1. The watershed variables used in analyzing the spatial variation of DOM diversity in the Yakima River Basin.
2.7. Statistical analysis and plot generation
All statistics were performed using the R Statistics Program (v4.1) and all plot generation leveraged the ggplot2 R package (v3.3.6) and other tidyverse R packages (v1.3.2) (Wickham et al., 2019; R Core Team, 2020). For each diversity metric within a basin area, an average was taken to represent that point along the catchment. As such, the standard error of the mean (SEM) was calculated in R where the standard deviation for each basin area was divided by the square root of the number of samples collected in that basin area. Pearson correlations between each diversity metric and either basin area or land coverage were performed using the stat_cor function in the ggpubr R package (v0.4) (Kassambara, 2020). Using the same function, Pearson correlations between each geospatial variable (e.g., land cover values, hydrological contact, etc.) and basin area were also performed to identify potential co-correlations. All scripts used to process the FTICR-MS data can be found on GitHub at https://github.com/danczakre/Yakima-River-Basin-Functional-Diversity.
3. Results and discussion
3.1. Geochemical variables covary with catchment area and landcover patterns
We observed that dissolved organic carbon (DOC), as measured by non-purgeable organic carbon (NPOC), trended upward (p-value < 0.1) and total dissolved nitrogen (TDN) significantly increased with larger catchment areas (p-value < 0.05) (Figure 1B). Shifting focus to landcover relationships, we see that only urban cover is significantly related to DOC concentration and agriculture cover is related to TDN (both p-value < 0.05) (Supplementary Figure 1). Given that many of the landcover variables are co-correlated with each other and with catchment area within the YRB, interpretation can be difficult, but these data indicate: (1) DOC and TDN concentrations increase with catchment size potentially due to increased inputs, and (2) these are driven in part by landcover (i.e., urbanization leading to increased DOC, and agriculture leading to increased TN). While these patterns differ from previous studies, they are at least partially in keeping with some general trends. Zarnetske et al. (2018) demonstrated that landcover is a key predictor in understanding the relationship between discharge and DOC flux. In turn, Casas-Ruiz et al. (2020) demonstrated that larger catchment areas lead to greater DOC concentrations, at least to a limited extent. Focusing on nitrogen dynamics, fewer studies have been conducted but landcover has been demonstrated to be a significantly related variable (Stanley and Maxted, 2008; Jacobs et al., 2017; Allafta and Opp, 2022). Regardless of the mechanistic drivers of DOC and TN, the patterns observed here indicate that spatial gradients in inputs and/or biogeochemical processes form across the YRB. This points to the potential for concomitant shifts in DOM compositional and functional properties.
To study DOM functional properties, we first examined metrics associated with molecular complexity, thermodynamics, and degradability (Figure 1C). We found that across the YRB, metrics associated with molecular complexity were more strongly linked to catchment area (and thus landcover) than metrics associated with thermodynamics or degradability. More specifically, discounting the smallest catchment area given that it is a substantial outlier, average mass, average double-bond equivalents, and average modified aromaticity index all decrease with increasing catchment area. While not directly addressed by the RCC, this pattern partially supports the notion that DOM becomes less structurally complex as it travels downstream (Vannote et al., 1980; Doretto et al., 2020; Little et al., 2022). In contrast, we observe no discernible relationships between catchment area and average H:C, average O:C, or average NOSC. These either are involved in degradation (i.e., H:C, O:C) or thermodynamics (i.e., NOSC) (Mentges et al., 2017). From these patterns we infer that DOM is changing at two different levels: while overall molecular complexity might be decreasing following predictions made by the RCC, the properties of molecular formula associated with either degradation or thermodynamics are maintained. Notably, including the smallest catchment does not help our data fit potential predictions made following the RCC. These patterns capture average properties, however, and do not examine the DOM diversity or its putative biogeochemical function. As shown below, shifting focus to more ecological and explicitly biochemical metrics provides deeper insights into the mechanisms influencing DOM at the basin-scale.
3.2. Diversity of potential biogeochemical functions increases with increasing catchment area
The number of potential biochemical transformations, whether normalized to the number of peaks within a sample or not, were linearly related to catchment area. Given that each transformation represents a potential biochemical reaction, this suggests that biogeochemical function, in terms of the diversity of biochemical reactions, may increase in larger streams within the YRB (Figure 2A) (Graham et al., 2018; Fudyma et al., 2021). Furthermore, given that alpha diversity [i.e., the number of peaks, Faith's PD (MCD), and Faith's PD (TD)] was not significantly related to catchment area, this pattern does not occur simply because there are more molecular formulas present. Instead, these data suggest that each individual formula is potentially undergoing more transformations in larger streams of the YRB than smaller streams. This is further supported by the strengthened relationship when standardizing the number of transformations by the number of peaks in the dataset (i.e., we are seeing more transformations per peak, moving downstream) (Figure 2A). When connecting these relationships to the RCC model, we see some disagreement. The RCC may suggest that alpha diversity (e.g., number of unique molecules) would increase in larger catchment areas or higher stream orders; instead, we observe an increase in potential biochemical reactions. Taken together with the lack of strong relationships of these transformation patterns with either DOC or TDN concentrations (Supplementary Figure 1), we suggest that something beyond the OM (e.g., the microbial community or landcover) is changing systematically through the YRB stream network.
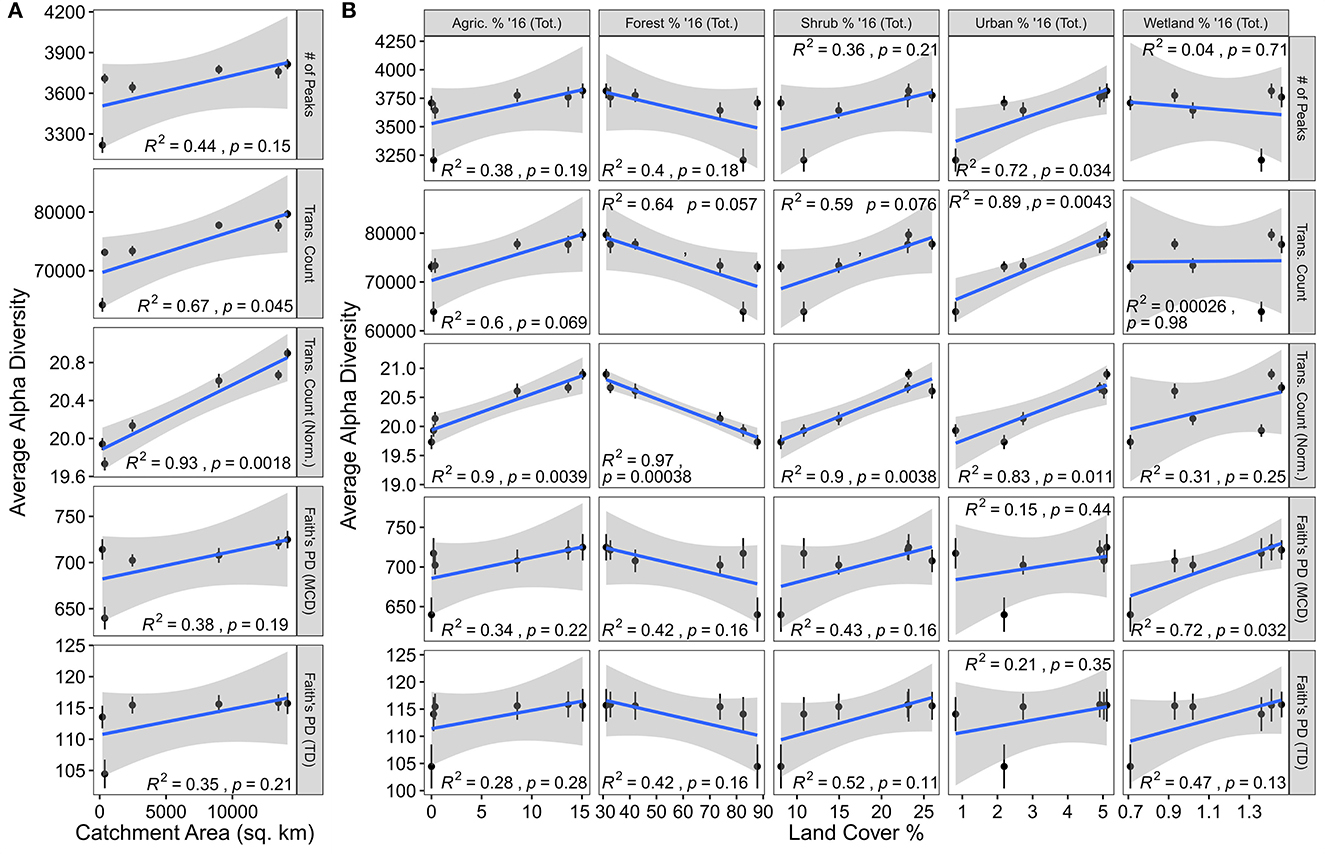
Figure 2. Alpha-diversity metrics plotted against catchment area and land coverage values. (A) Average alpha diversity metrics plotted by catchment area. (B) Average alpha diversity metrics plotted against land coverage values. In both panels, the blue line indicates the line-of-best-fit while Pearson correlation results are indicated in each panel. Error bars illustrate the standard error associated with the mean.
Relationships with landcover reveal potential drivers for the increase in biochemical diversity with larger catchment areas, but do not account for all observed patterns (Figure 2B). First, it is important to note that many of the landcover values (i.e., agriculture, forest, shrub, urban, and wetland cover) and geospatial variables are related to catchment area within the YRB (Supplementary Figure 2). While this complicates some interpretations due to co-correlations, it does not completely inhibit us from evaluating mechanisms potentially underpinning the link between transformation diversity and catchment area. Agriculture, forest, and shrub coverage each exhibit similar relationships with chemodiversity. While differentiating among potential mechanisms is challenging, it may be that shifts in dominant vegetation type leads to divergent OM transformations, or chemodiversity may be driven by more diverse landcover upstream of a given location (Graham et al., 2017; Roebuck et al., 2020). In contrast to other landcover types, urban and wetland coverage exhibit separate patterns. While still being related to catchment area, we observed that increases in urban coverage were related to more peaks in a sample potentially indicating a human influence on DOM composition. Previous research of DOM derived from urban sources revealed divergent characteristics (Zhao et al., 2015; Fork et al., 2020; Romero González-Quijano et al., 2022). Wetland coverage shows no connection to catchment area but is still significantly related to Faith's PD (MCD). Given that the MCD can be viewed as a proxy for many molecular characteristics (Danczak et al., 2020), this suggests that wetlands could introduce DOM with divergent properties to streams. This pattern is in keeping with previous observations where wetlands were major contributors to stream chemistry at lower stream due to different DOM types, divergent residence times, different vegetation, or many other variables (Ågren et al., 2008; Fellman et al., 2008; Laudon et al., 2011; Kothawala et al., 2015). Regardless of the specific interactions between landcover and DOM, our results indicate two key patterns: (1) The RCC predictions related to DOM diversity do not hold true within the YRB, and (2) as catchment area within the YRB (and potentially similar basins) increases, the diversity of potential biochemical transformations increases both in an absolute sense and relative to number of unique types of organic molecules. By expanding this analysis to incorporate functional trait information, we begin to develop a more comprehensive conceptual model for DOM chemodiversity within the YRB.
3.3. Functional diversity of riverine DOM increases with catchment area
Functional diversity associated with both thermodynamics (i.e., NOSC) and biodegradability (i.e., H/C) were significantly related to catchment area, indicating a potential spatial organization to biogeochemical function. Unlike the number of transformations, traits associated with molecular formulas are often observed to be directly related to biogeochemical rates. For example, microcosm experiments revealed that the Gibb's Free Energy of Carbon Oxidation based on molecular formula was significantly related to respiration under carbon limited conditions (Garayburu-Caruso et al., 2020b). It has also been shown that that degradation of marine DOM results in the homogenization of NOSC and H/C values (Mentges et al., 2017). This indicates that systematic increases or decreases in functional trait diversity of DOM may provide greater insight into biogeochemical function. By using Rao's functional diversity metric, we can evaluate variability in OM traits and identify putative connections between catchment area and biogeochemistry (Botta-Dukát, 2005). Importantly, Rao's functional diversity (Rao's FD) can also be calculated using presence/absence data instead of relative abundances which is important for FTICR-MS data, which do not allow for inferences of abundance across molecular formulas (Tfaily et al., 2017).
Here, we calculated Rao's FD using four different individual traits (i.e., number of carbon, H/C, NOSC, and Distance-to-CRAM) and a multivariate combination of the individual traits. Both the number of carbons and H/C provide insight into the degradation state of DOM, while NOSC offers information about thermodynamics (Mentges et al., 2017). Distance-to-CRAM is a metric that approximates the similarity of a given molecular formula to a carboxyl-rich alicyclic molecule (CRAM) (Mosher et al., 2015). Given that CRAM-like formulas are characteristic of freshwater ecosystems, Distance-to-CRAM indicates the degree of convergence or divergence of DOM relative to a common DOM signature. The multivariate combination of the individual traits will potentially reveal patterns that are not demonstrated by any single trait.
Rao's FDH/C and Rao's FDNOSC were significantly related to catchment area indicating that a greater diversity in potential biodegradability and the thermodynamic properties occur when moving down the YRB's stream network (Figure 3A). Evaluated through the lens of decomposition proposed by Lehmann et al. (2020), this pattern could be linked to biogeochemical rates in two ways. One possibility is that increased functional diversity moving down the catchment could lead to decreased decomposition due to increased metabolic costs of metabolizing a broader range of organic molecules (Arrieta et al., 2015; Stegen et al., 2018; Lehmann et al., 2020). Alternatively, higher functional diversity could also enhance biogeochemical activity through priming, whereby a subset of compounds increase the degradation of other compounds (Guenet et al., 2010; Stegen et al., 2018). Adding to the complexity of the system is that the Rao's FD patterns mirror those of the biochemical transformation counts. This suggests a link between DOM functional diversity and the biochemical potential identified via the transformations analysis. We suggest that the combination of higher functional diversity and potentially greater biochemical diversity could be associated with higher rates of OM mineralization associated with catabolic and/or anabolic processes. We further argue that this connection might be self-reinforcing whereby increased variability in functional traits could lead to an increased variety of transformations that lead to further variation in functional traits. This hypothesis suggests that rather than simply being driven by more unique organic molecules, the diversity of biochemical transformations is tied to the breadth of trait space covered by organic molecules. This interpretation is similar to interpretations in community and ecosystem ecology where increased functional diversity enhances ecosystem function (Loreau, 1998; Cadotte et al., 2011; Gagic et al., 2015). However, we consider this an emergent hypothesis that requires evaluation through controlled experiments and/or measured rates. To better contextualize these results, we also look to see how these metrics vary in conjunction with landcover values.
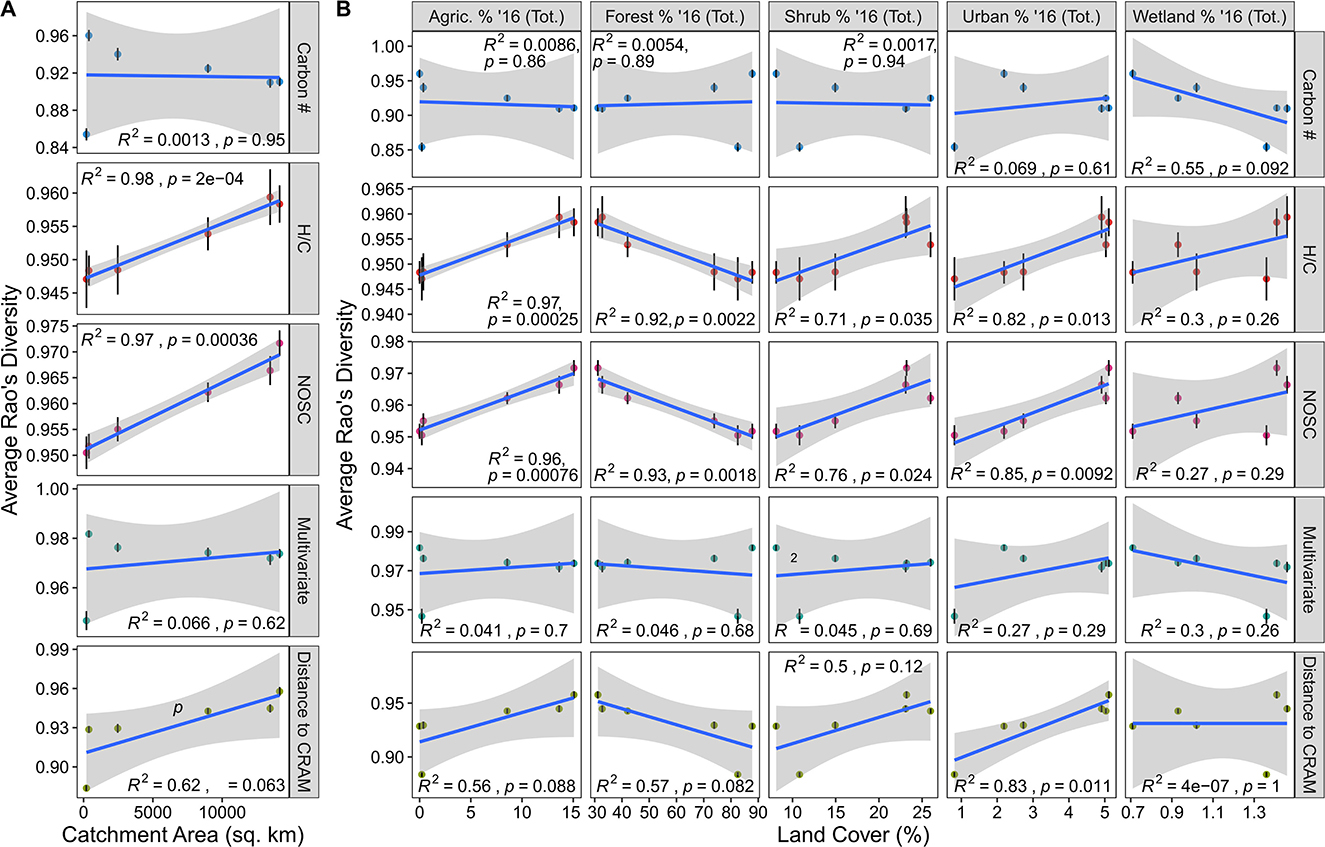
Figure 3. Rao's functional diversity (FD) plotted against catchment area and land coverage. (A) Average Rao's for various molecular traits indicated on the right plotted against catchment area. (B) Average Rao's for various molecular traits indicated on the right plotted against land coverage types indicated on the top. In both panels, the blue line indicates the line-of-best-fit while Pearson correlation results are indicated in each facet. Error bars illustrate the standard error associated with the mean.
Functional diversity-landcover relationships largely mirror those observed in the alpha diversity data. Relationships between any Rao's FD metric and DOC/TN were relatively weak (~0.05 < R2 < 0.3), suggesting that these geochemical parameters are mostly decoupled from DOM functional diversity (Supplementary Figure 3). Relationships between landcover and Rao's FDH/C, Rao's FDNOSC, Rao's FDCarbon, and Rao's FDMulti were similar to the relationships between the other diversity metrics (e.g., Faith's PD for both the MCD and TD) and landcover (Figure 3B). Specifically, we saw that agriculture, forest, shrub, urban and wetland coverage exhibited similar relationships to functional diversity as these landcover types did with Faith's PD and the number of peaks (Figure 3B). With these common patterns come the same caveats and interpretations discussed in the previous subsection. However, we observed that Rao FDCRAM departed from these consistent patterns and was significantly related to urban coverage. This means that with an increased proportion of urban land, organic molecules became more distant from a CRAM-like signature. Given that CRAM-like molecular formulas are common across rivers (Mosher et al., 2015), our results support the notion that greater urban development may disrupt natural riverine DOM chemistry (Kamjunke et al., 2019; Roebuck et al., 2020). More sampling across other catchments/watersheds with natural-to-urban gradients is necessary to evaluate this hypothesis more deeply, however.
4. Conclusions
Our analysis of samples collected across an environmentally diverse catchment revealed previously unrecognized linkages among catchment area, landcover, and DOM biochemical and functional diversity. The diversity of DOM biochemical transformations increased with increasing catchment area and changes in landcover. These gradients were connected to an expanded DOM trait space, and we propose that one type of diversity may beget another type of diversity, whereby increases in functional and biochemical diversity positively feedback on each other (Figure 4). The diversity gradients are conceptually similar to species area relationships that are commonly observed in macroecological systems. That is, OM functional and transformation-based diversity scale with catchment area, and we hypothesize that these spatial scaling patterns are due, in part, to diversity of upstream landcover. The accumulation of landcover types in the upstream catchment likely expands the DOM functional trait space, which is then reinforced through a higher diversity of biochemical transformations. While urban development appears to disrupt standard DOM composition (e.g., increasing the distance-to-CRAM), this influence is not strong enough in the YRB to overcome other mechanisms leading to very strong spatial scaling. Overall, our results point to a conceptual model whereby more landcover types in larger catchments increase the functional diversity of DOM reinforced by transformations of DOM, ultimately leading to greater biogeochemical potential.
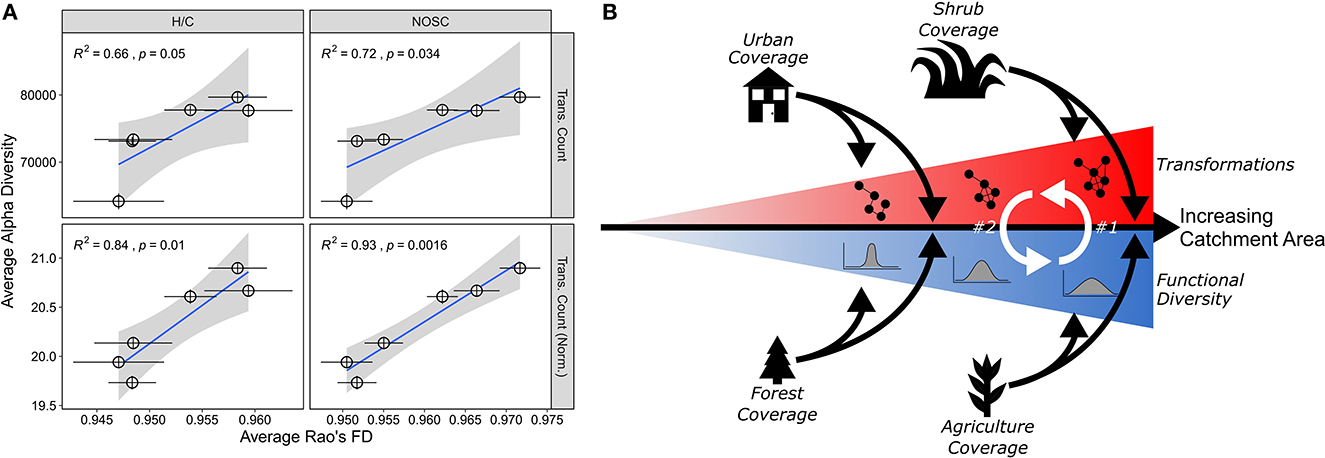
Figure 4. Functional diversity and transformation relationships and conceptual figure. (A) These plots depict the relationship between two Rao's FD metrics (H/C, NOSC) and two transformation metrics (absolute transformation count, transformation count normalized to peak count). Pearson correlation stats are in the upper right of each panel. Error bars plot the standard error of the mean for both metrics. (B) A conceptual depiction of the relationship between functional diversity and potential biochemical transformations. As catchment area increases (rightward black arrow), we observe both increasing functional diversity and increasing numbers of transformations (red and blue triangles each containing cartoon representations of transformations and functional diversity, respectively). We argue that the increasing diversity can act as potential mechanism for the expanded transformation potential in larger catchments (white arrow #1); in turn, this increased transformation potential could reinforce an increase in functional diversity (white arrow #2). As the catchment area increases, different land cover types (urban, shrub, forest, and agriculture) are significantly related to both metrics and act as a modulating force (e.g., organic matter derived from these land types are, at least in part, driving this relationship).
Data availability statement
The datasets presented in this study can be found in online repositories. The names of the repository/repositories and accession number(s) can be found at: https://data.ess-dive.lbl.gov/datasets/doi:10.15485/1898912.
Author contributions
RD, VG-C, and JS conceptualized the study. JR, MK, LR, SF, SM, OO, and SG carried out the field work and laboratory geochemical analysis. KS extracted geospatial information for the Yakima River Basin. RD performed data processing. RD, VG-C, KS, AM-P, JR, JS, and MK drafted the manuscript. All authors contributed to the article and approved the submitted version.
Funding
This research was supported by the U.S. Department of Energy, Office of Science, Office of Biological and Environmental Research, Environmental System Science (ESS) Program. This contribution originates from the River Corridor Scientific Focus Area (SFA) project at Pacific Northwest National Laboratory (PNNL). Pacific Northwest National Laboratory is operated by Battelle Memorial Institute for the U.S. Department of Energy under Contract DE-AC05-76RL01830. FTICR-MS data was generated at the DOE BER Environmental Molecular Science Laboratory User Facility under user proposal 60221.
Conflict of interest
The authors declare that the research was conducted in the absence of any commercial or financial relationships that could be construed as a potential conflict of interest.
Publisher's note
All claims expressed in this article are solely those of the authors and do not necessarily represent those of their affiliated organizations, or those of the publisher, the editors and the reviewers. Any product that may be evaluated in this article, or claim that may be made by its manufacturer, is not guaranteed or endorsed by the publisher.
Supplementary material
The Supplementary Material for this article can be found online at: https://www.frontiersin.org/articles/10.3389/frwa.2023.1087108/full#supplementary-material
Supplementary Figure 1. Average NPOC and TDN concentration plotted against various alpha diversity metrics. The blue line indicates line-of-best-fit while the statistics report the results of Pearson correlations.
Supplementary Figure 2. Various geospatial parameters corresponding to each sampling site correlated against catchment area. The blue line indicates line-of-best-fit while the statistics report the results of Pearson correlations.
Supplementary Figure 3. Average NPOC and TDN concentration plotted against various versions of Rao's functional diversity. The blue line indicates line-of-best-fit while the statistics report the results of Pearson correlations.
References
Ågren, A., Berggren, M., Laudon, H., and Jansson, M. (2008). Terrestrial export of highly bioavailable carbon from small boreal catchments in spring floods. Freshwater Biol. 53, 964–972. doi: 10.1111/j.1365-2427.2008.01955.x
Allafta, H., and Opp, C. (2022). Understanding the combined effects of land cover, precipitation and catchment size on nitrogen and discharge—a case study of the mississippi river basin. Water 14, 865. doi: 10.3390/w14060865
Arrieta, J. M., Mayol, E., Hansman, R. L., Herndl, G. J., Dittmar, T., Duarte, C. M., et al. (2015). Dilution limits dissolved organic carbon utilization in the deep ocean. Science 348, 331–333. doi: 10.1126/science.1258955
Battin, T. J., Luyssaert, S., Kaplan, L. A., Aufdenkampe, A. K., Richter, A., Tranvik, L. J., et al. (2009). The boundless carbon cycle. Nat. Geosci. 2, 598–600. doi: 10.1038/ngeo618
Botta-Dukát, Z. (2005). Rao's quadratic entropy as a measure of functional diversity based on multiple traits. J. Veg. Sci. 16, 533–540. doi: 10.1111/j.1654-1103.2005.tb02393.x
Bramer, L. M., and White, A. (2019). ftmsRanalysis: Analysis and visualization tools for FT-MS data. R package version 1, 0.0. Available online at: https://github.com/EMSL-Computing/ftmsRanalysis (accessed April 18, 2019).
Bramer, L. M., White, A. M., Stratton, K. G., Thompson, A. M., Claborne, D., Hofmockel, K., et al. (2020). FtmsRanalysis: An R package for exploratory data analysis and interactive visualization of FT-MS data. PLoS Comput. Biol. 16, 1–12. doi: 10.1371/journal.pcbi.1007654
Buser-Young, J. Z., Garcia, P. E., Schrenk, M. O., Regier, P. J., Ward, N. D., Biçe, K., et al. (2023). Determining the biogeochemical transformations of organic matter composition in rivers using molecular signatures. Front. Water 5, 1005792. doi: 10.3389/frwa.2023.1005792
Cadotte, M. W., Carscadden, K., and Mirotchnick, N. (2011). Beyond species: functional diversity and the maintenance of ecological processes and services. J. Appl. Ecol. 48, 1079–1087. doi: 10.1111/j.1365-2664.2011.02048.x
Casas-Ruiz, J. P., Spencer, R. G. M., Guillemette, F., Schiller, D., Obrador, B., Podgorski, D. C., et al. (2020). Delineating the continuum of dissolved organic matter in temperate river networks. Glob. Biogeochem. Cycles 34, 1–15. doi: 10.1029/2019GB006495
Coble, A. A., Wymore, A. S., Potter, J. D., and McDowell, W. H. (2022). Land use overrides stream order and season in driving dissolved organic matter dynamics throughout the year in a river network. Environ. Sci. Technol. 56, 2009–2020. doi: 10.1021/acs.est.1c06305
Cole, J. J., Prairie, Y. T., Caraco, N. F., McDowell, W. H., Tranvik, L. J., Striegl, R. G., et al. (2007). Plumbing the global carbon cycle: Integrating inland waters into the terrestrial carbon budget. Ecosystems 10, 171–184. doi: 10.1007/s10021-006-9013-8
Cory, R. M., and Kling, G. W. (2018). Interactions between sunlight and microorganisms influence dissolved organic matter degradation along the aquatic continuum. Limnol. Oceanograph. Lett. 2, 102–116. doi: 10.1002/lol2.10060
Danczak, R. E., Chu, R. K., Fansler, S. J., Goldman, A. E., Graham, E. B., Tfaily, M. M., et al. (2020). Using metacommunity ecology to understand environmental metabolomes. Nat. Commun. 11, 6369. doi: 10.1038/s41467-020-19989-y
Danczak, R. E., Goldman, A. E., Chu, R. K., Toyoda, J. G., Garayburu-Caruso, V. A., Tolić, N., et al. (2021). Ecological theory applied to environmental metabolomes reveals compositional divergence despite conserved molecular properties. Sci. Total Environ. 788, 147409. doi: 10.1016/j.scitotenv.2021.147409
Doretto, A., Piano, E., and Larson, C. E. (2020). The river continuum concept: lessons from the past and perspectives for the future. Can. J. Fisheries Aquatic Sci. 77, 1853–1864. doi: 10.1139/cjfas-2020-0039
Drake, T. W., Raymond, P. A., and Spencer, R. G. M. (2018). Terrestrial carbon inputs to inland waters: a current synthesis of estimates and uncertainty. Limnol. Oceanography Letters 3, 132–142. doi: 10.1002/lol2.10055
Faith, D. P. (1992). Conservation evaluation and phylogentic diversity. Biol. Conserv. 61, 1–10. doi: 10.1016/0006-3207(92)91201-3
Fellman, J. B., D'Amore, D. V., Hood, E., and Boone, R. D. (2008). Fluorescence characteristics and biodegradability of dissolved organic matter in forest and wetland soils from coastal temperate watersheds in southeast Alaska. Biogeochemistry 88, 169–184. doi: 10.1007/s10533-008-9203-x
Fork, M. L., Osburn, C. L., and Heffernan, J. B. (2020). Bioavailability and compositional changes of dissolved organic matter in urban headwaters. Aquat Sci. 82, 66. doi: 10.1007/s00027-020-00739-7
Fudyma, J. D., Chu, R. K., Graf Grachet, N., Stegen, J. C., and Tfaily, M. M. (2021). Coupled biotic-abiotic processes control biogeochemical cycling of dissolved organic matter in the columbia river hyporheic zone. Front. Water 2, 1–20. doi: 10.3389/frwa.2020.574692
Gagic, V., Bartomeus, I., Jonsson, T., Taylor, A., Winqvist, C., Fischer, C., et al. (2015). Functional identity and diversity of animals predict ecosystem functioning better than species-based indices. Proc. R. Soc. B. 282, 20142620. doi: 10.1098/rspb.2014.2620
Garayburu-Caruso, V. A., Danczak, R. E., Stegen, J. C., Renteria, L., Mccall, M., Goldman, A. E., et al. (2020a). Using community science to reveal the global chemogeography of river metabolomes. Metabolites 10, 518. doi: 10.3390/metabo10120518
Garayburu-Caruso, V. A., Stegen, J. C., Song, H-. S., Renteria, L., Wells, J., Garcia, W., et al. (2020b). Carbon limitation leads to thermodynamic regulation of aerobic metabolism. Environ. Sci. Technol. Lett. 7, 517–524. doi: 10.1021/acs.estlett.0c00258
Graham, E. B., Crump, A. R., Kennedy, D. W., Arntzen, E., Fansler, S., Purvine, S. O., et al. (2018). Multi 'omics comparison reveals metabolome biochemistry, not microbiome composition or gene expression, corresponds to elevated biogeochemical function in the hyporheic zone. Sci. Total Environ. 642, 742–753. doi: 10.1016/j.scitotenv.2018.05.256
Graham, E. B., Tfaily, M. M., Crump, A. R., Goldman, A. E., Bramer, L. M., Arntzen, E., et al. (2017). Carbon inputs from riparian vegetation limit oxidation of physically bound organic carbon via biochemical and thermodynamic processes. J. Geophy. Res. Biogeosci. 122, 3188–3205. doi: 10.1002/2017JG003967
Guenet, B., Danger, M., Abbadie, L., and Lacroix, G. (2010). Priming effect: bridging the gap between terrestrial and aquatic ecology. Ecology 91, 2850–2861. doi: 10.1890/09-1968.1
Hertkorn, N., Benner, R., Frommberger, M., Schmitt-Kopplin, P., Witt, M., Kaiser, K., et al. (2006). Characterization of a major refractory component of marine dissolved organic matter. Geochim. Cosmoch. Acta 70, 2990–3010. doi: 10.1016/j.gca.2006.03.021
Hughey, C. A., Hendrickson, C. L., Rodgers, R. P., Marshall, A. G., and Qian, K. (2001). Kendrick mass defect spectrum: a compact visual analysis for ultrahigh-resolution broadband mass spectra. Anal. Chem. 73, 4676–4681. doi: 10.1021/ac010560w
Jacobs, S. R., Breuer, L., Butterbach-Bahl, K., Pelster, D. E., and Rufino, M. C. (2017). Land use affects total dissolved nitrogen and nitrate concentrations in tropical montane streams in Kenya. Sci. Total Environ. 603–604, 519–532. doi: 10.1016/j.scitotenv.2017.06.100
Kaling, M., Schmidt, A., Moritz, F., Rosenkranz, M., Witting, M., Kasper, K., et al. (2018). Mycorrhiza-triggered transcriptomic and metabolomic networks impinge on herbivore fitness. Plant Physiol. 176, 2639–2656. doi: 10.1104/pp.17.01810
Kamjunke, N., Hertkorn, N., Harir, M., Schmitt-Kopplin, P., Griebler, C., Brauns, M., et al. (2019). Molecular change of dissolved organic matter and patterns of bacterial activity in a stream along a land-use gradient. Water Res. 164, 114919. doi: 10.1016/j.watres.2019.114919
Kassambara, A. (2020). ggpubr: “ggplot2” Based Publication Ready Plots. Available online at: https://CRAN.R-project.org/package=ggpubr (accessed October 2, 2020).
Kembel, S. W., Cowan, P. D., Helmus, M. R., Cornwell, W. K., Morlon, H., Ackerly, D. D., et al. (2010). Picante: R tools for integrating phylogenies and ecology. Bioinformatics 26, 1463–1464. doi: 10.1093/bioinformatics/btq166
Koch, B. P., and Dittmar, T. (2006). From mass to structure: an aromaticity index for high-resolution mass data of natural organic matter. Rapid Commun. Mass Spectr. 20, 926–932. doi: 10.1002/rcm.2386
Kothawala, D. N., Ji, X., Laudon, H., Ågren, A. M., Futter, M. N., Köhler, S. J., et al. (2015). The relative influence of land cover, hydrology, and in-stream processing on the composition of dissolved organic matter in boreal streams. J. Geophys. Res. Biogeosci. 120, 1491–1505. doi: 10.1002/2015JG002946
Kujawinski, E. B., and Behn, M. D. (2006). Automated analysis of electrospray ionization fourier transform ion cyclotron resonance mass spectra of natural organic matter. Anal. Chem. 78, 4363–4373. doi: 10.1021/ac0600306
Laliberté, E., and Legendre, P. (2010). A distance-based framework for measuring functional diversity from multiple traits. Ecology 91, 299–305. doi: 10.1890/08-2244.1
LaRowe, D. E., and Van Cappellen, P. (2011). Degradation of natural organic matter: a thermodynamic analysis. Geochim. Cosmoch. Acta 75, 2030–2042. doi: 10.1016/j.gca.2011.01.020
Laudon, H., Berggren, M., Ågren, A., Buffam, I., Bishop, K., Grabs, T., et al. (2011). Patterns and dynamics of dissolved organic carbon (DOC) in boreal streams: the role of processes, connectivity, and scaling. Ecosystems 14, 880–893. doi: 10.1007/s10021-011-9452-8
Lehmann, J., Hansel, C. M., Kaiser, C., Kleber, M., Maher, K., Manzoni, S., et al. (2020). Persistence of soil organic carbon caused by functional complexity. Nat. Geoscience 13, 529–534. doi: 10.1038/s41561-020-0612-3
Little, C. J., Rizzuto, M., Luhring, T. M., Monk, J. D., Nowicki, R. J., Paseka, R. E., et al. (2022). Movement with meaning: integrating information into meta-ecology. Oikos 25, 2022. doi: 10.1111/oik.08892
Loreau, M. (1998). Biodiversity and ecosystem functioning: a mechanistic model. Proc. Natl. Acad. Sci. U.S.A. 95, 5632–5636. doi: 10.1073/pnas.95.10.5632
Mentges, A., Feenders, C., Seibt, M., Blasius, B., and Dittmar, T. (2017). Functional molecular diversity of marine dissolved organic matter is reduced during degradation. Front. Marine Sci. 4, 1–10. doi: 10.3389/fmars.2017.00194
Minor, E. C., Steinbring, C. J., Longnecker, K., and Kujawinski, E. B. (2012). Characterization of dissolved organic matter in Lake Superior and its watershed using ultrahigh resolution mass spectrometry. Org. Geochem. 43, 1–11. doi: 10.1016/j.orggeochem.2011.11.007
Morace, J. L., Fuhrer, G. J., Rinella, J. F., McKenzie, S. W., Gannett, M. W., Bramblett, K. L., et al. (1999). Surface-Water-Quality Assessment of the Yakima River Basin, Washington: Overview of major findings, 1987-91. Portland, OR: Yakima River Basin.
Moritz, F., Kaling, M., Schnitzler, J., and Schmitt-Kopplin, P. (2017). Characterization of poplar metabotypes via mass difference enrichment analysis. Plant Cell Environ. 40, 1057–1073. doi: 10.1111/pce.12878
Mosher, J. J., Kaplan, L. A., Podgorski, D. C., McKenna, A. M., and Marshall, A. G. (2015). Longitudinal shifts in dissolved organic matter chemogeography and chemodiversity within headwater streams: a river continuum reprise. Biogeochemistry 124, 371–385. doi: 10.1007/s10533-015-0103-6
Otenburg, O., Barnes, M., Borton, M. A., Chen, X., Chu, R., Farris, Y., et al. (2022). Temporal Study 2021-2022: Sample-Based Surface Water Chemistry and Organic Matter Characterization across Watersheds in the Yakima River Basin, Washington, DC: Yakima River Basin.
Regnier, P., Friedlingstein, P., Ciais, P., Mackenzie, F. T., Gruber, N., Janssens, I. A., et al. (2013). Anthropogenic perturbation of the carbon fluxes from land to ocean. Nature Geoscience 6, 597–607. doi: 10.1038/ngeo1830
Roebuck, J. A., Seidel, M., Dittmar, T., and Jaffé, R. (2020). Controls of land use and the river continuum concept on dissolved organic matter composition in an anthropogenically disturbed subtropical watershed. Environ. Sci. Technol. 54, 195–206. doi: 10.1021/acs.est.9b04605
Romero González-Quijano, C., Herrero Ortega, S., Casper, P., Gessner, M. O., and Singer, G. A. (2022). Dissolved organic matter signatures in urban surface waters: spatio-temporal patterns and drivers. Biogeosciences 19, 2841–2853. doi: 10.5194/bg-19-2841-2022
Sengupta, A., Fansler, S. J., Chu, R. K., Danczak, R. E., Garayburu-Caruso, V. A., Renteria, L., et al. (2021). Disturbance triggers non-linear microbe–environment feedbacks. Biogeosciences 18, 4773–4789. doi: 10.5194/bg-18-4773-2021
Sokal, R. R., and Michener, C. D. (1958). A statistical method for evaluating systematic relationships. Univ. Kansas Sci. Bulletin 38, 1409–1438.
Stanley, E. H., and Maxted, J. T. (2008). Changes in the dissolved nitrogen pool across land cover gradients in Wisconsin streams. Ecol. Appl. 18, 1579–1590. doi: 10.1890/07-1379.1
Stegen, J., Fansler, S., Tfaily, M., Garayburu-Caruso, V., Goldman, A., Danczak, R., et al. (2022). Organic matter transformations are disconnected between surface water and the hyporheic zone. Biogeochemistry 19, 3099–3110. doi: 10.5194/bg-2022-19
Stegen, J. C., Johnson, T., Fredrickson, J. K., Wilkins, M. J., Konopka, A. E., Nelson, W. C., et al. (2018). Influences of organic carbon speciation on hyporheic corridor biogeochemistry and microbial ecology. Nat. Commun. 9, 585. doi: 10.1038/s41467-018-02922-9
Tank, S. E., Fellman, J. B., Hood, E., and Kritzberg, E. S. (2018). Beyond respiration: controls on lateral carbon fluxes across the terrestrial-aquatic interface. Limnol. Oceanogr Lett. 3, 76–88. doi: 10.1002/lol2.10065
Tfaily, M. M., Chu, R. K., Tolić, N., Roscioli, K. M., Anderton, C. R., Paša-Tolić, L., et al. (2015). Advanced solvent based methods for molecular characterization of soil organic matter by high-resolution mass spectrometry. Anal. Chem. 87, 5206–5215. doi: 10.1021/acs.analchem.5b00116
Tfaily, M. M., Chu, R. K., Toyoda, J., Tolić, N., Robinson, E. W., Paša-Tolić, L., et al. (2017). Sequential extraction protocol for organic matter from soils and sediments using high resolution mass spectrometry. Anal. Chim. Acta 972, 54–61. doi: 10.1016/j.aca.2017.03.031
Tolić, N., Liu, Y., Liyu, A., Shen, Y., Tfaily, M. M., Kujawinski, E. B., et al. (2017). Formularity: software for automated formula assignment of natural and other organic matter from ultrahigh-resolution mass spectra. Anal. Chem. 89, 12659–12665. doi: 10.1021/acs.analchem.7b03318
Vannote, R. L., Minshall, G. W., Cummins, K. W., Sedell, J. R., and Cushing, C. E. (1980). The river continuum concept. Can. J. Fisheries Aquatic Sci. 37, 130–137. doi: 10.1139/f80-017
Vano, J. A., Scott, M. J., Voisin, N., Stöckle, C. O., Hamlet, A. F., Mickelson, K. E. B., et al. (2010). Climate change impacts on water management and irrigated agriculture in the Yakima River Basin, Washington, USA. Climatic Change 102, 287–317. doi: 10.1007/s10584-010-9856-z
Wang, Y., Xie, R., Shen, Y., Cai, R., He, C., Chen, Q., et al. (2022). Linking microbial population succession and DOM molecular changes in synechococcus -derived organic matter addition incubation. Microbiology Spectrum 10, 21. doi: 10.1128/spectrum.02308-21
Ward, N. D., Bianchi, T. S., Medeiros, P. M., Seidel, M., Richey, J. E., Keil, R. G., et al. (2017). Where carbon goes when water flows: carbon cycling across the aquatic continuum. Front. Marine Sci. 4, 1–27. doi: 10.3389/fmars.2017.00007
Wickham, H., Averick, M., Bryan, J., Chang, W., McGowan, L., François, R., et al. (2019). Welcome to the Tidyverse. JOSS 4, 1686. doi: 10.21105/joss.01686
Wieczorek, M. E., Jackson, S. E., and Schwarz, G. E. (2018). Select Attributes for NHDPlus Version 2.1 Reach Catchments and Modified Network Routed Upstream Watersheds for the Conterminous United States (Ver. 3.0, January 2021). U.S. Geological Survey Data Release. doi: 10.5066/F7765D7V
Wohl, E., Hall, R. O., Lininger, K. B., Sutfin, N. A., and Walters, D. M. (2017). Carbon dynamics of river corridors and the effects of human alterations. Ecol. Monographs 87, 379–409. doi: 10.1002/ecm.1261
Zarnetske, J. P., Bouda, M., Abbott, B. W., Saiers, J., and Raymond, P. A. (2018). Generality of hydrologic transport limitation of watershed organic carbon flux across ecoregions of the United States. Geophys. Res. Letters 45, 112–711. doi: 10.1029/2018GL080005
Keywords: dissolved organic matter, FTICR-MS, functional diversity, meta-metabolome ecology, transformation analysis
Citation: Danczak RE, Garayburu-Caruso VA, Renteria L, McKever SA, Otenburg OC, Grieger SR, Son K, Kaufman MH, Fulton SG, Roebuck JA Jr, Myers-Pigg AN and Stegen JC (2023) Riverine organic matter functional diversity increases with catchment size. Front. Water 5:1087108. doi: 10.3389/frwa.2023.1087108
Received: 02 November 2022; Accepted: 19 June 2023;
Published: 05 July 2023.
Edited by:
Jon Chorover, University of Arizona, United StatesReviewed by:
Yuanbi Yi, Hong Kong University of Science and Technology, Hong Kong SAR, ChinaMalak M. Tfaily, University of Arizona, United States
Copyright © 2023 Danczak, Garayburu-Caruso, Renteria, McKever, Otenburg, Grieger, Son, Kaufman, Fulton, Roebuck, Myers-Pigg and Stegen. This is an open-access article distributed under the terms of the Creative Commons Attribution License (CC BY). The use, distribution or reproduction in other forums is permitted, provided the original author(s) and the copyright owner(s) are credited and that the original publication in this journal is cited, in accordance with accepted academic practice. No use, distribution or reproduction is permitted which does not comply with these terms.
*Correspondence: Robert E. Danczak, RGFuY3pha1IxQGhpcmFtLmVkdQ==; James C. Stegen, amFtZXMuc3RlZ2VuQHBubmwuZ292