 María Esther Leyva Ollivier
 Alice Newton
 Heath Kelsey
- 1Murray Foundation, c/o Brabners LLP, Liverpool, United Kingdom
- 2CIMA - ARNET, Centre for Marine and Environmental Research, University of Algarve Gambelas Campus, Faro, Portugal
- 3University of Maryland Center for Environmental Science, Cambridge, MD, United States
The concern with preserving natural resources for the future has been capturing global attention due to the state of decline of productive ecosystems. Chesapeake Bay, a large estuary located on the mid-Atlantic coast of the United States of America is such a productive ecosystem supporting thousands of animal and plants species, and the surrounding human population. Despite the concept of sustainable development, there has been continued pressure on the natural resources and the ecosystem services of the Bay. Institutional restoration and management efforts have been extensive, generating organizations, agreements, regulations and projects, among others. This research assesses Chesapeake Bay’s sustainability in four domains: environment, social, economy, and governance, using the Circles of Coastal Sustainability methodology. Each of the four domains has five categories, and each category is evaluated by the authors’ expert judgment using indicators related to the socio-ecological system and the definition of sustainable development. The article proposes a global sustainability score developed by a literature review of sustainability evaluated through the expert judgment of the authors. The results from the framework gave a “Satisfactory” score to the overall system; the environment and economic domains obtained the “Satisfactory” score, whilst the government and social domains obtained “Good” and “Poor” scores, respectively. The categories ranged between “Excellent” and “Poor” scores. The “Excellent” score was obtained by organization. The “Poor” score was obtained by five categories across the domains including social benefits, demographic, identity, security, and economic wellbeing. The assessment showed that the system has degradation problems, but the results have provided a general foundation for management bridges and barriers for sustainable development, with the barriers used to discuss new bridges towards holistic management proposals. The framework is a tool in progress to communicate to various actors the current sustainability development with the available information, provide a holistic system view, and find knowledge gaps in the research of a system. Similarly, the framework and assessment can be complemented, adapted, refined, and improved with each application as part of an adaptive management iterative cycle.
1 Introduction
The 1987 Brundtland Report was developed by the United Nations to propose “a global agenda for change” (Keeble, 1988). The report was the first to define the concept of sustainable development as “development that meets the needs and aspirations of the present generation without destroying the resources needed for the future generation to meet their needs” (Keeble, 1988). Concern about preserving natural resources for the future has been capturing the attention of the global public due to the state of decline of productive ecosystems (Keeble, 1988; Kuhlman and Farrington, 2010). This raises the question of how to assess the sustainability of a social-ecological system to reveal the management needs.
The Chesapeake Bay is a large estuary with an area of 6,100 km2 located on the mid-Atlantic United States of America (USA) coast (Goetz et al., 2004; Bilkovic et al., 2019). The Chesapeake Bay watershed drainage covers 167,000 km2 within six states of the country, Delaware, Maryland, New York, Pennsylvania, Virginia, and West Virginia, and the Federal District of Columbia, the nation’s capital (Boesch et al., 2001; Testa et al., 2017; McLaughlin et al., 2022). Currently, its natural resources support thousands of animal and plant species and a human population of approximately 18 million (Morgan and Owens, 2001; Phillips and McGee, 2016; Ator et al., 2020; Delia et al., 2021). However, since the mid-1900s, there has been a substantial loss of natural resource quality and productivity (Phillips and McGee, 2016; Hood et al., 2021; CBP-Who, 2023). In 1970, the nation’s Congress sponsored a study to analyze the source of the Bay’s degradation (CBP-Who, 2023). The main issue identified was cultural eutrophication, an excessive algae growth resulting from nutrient enrichment by human activities (Boesch et al., 2001; Kemp et al., 2005). Some of the nutrient enrichment activities in the region are agricultural fertilization, runoff of sediments and animal waste, and atmospheric nitrogen deposition from the fuel combustion of cars or industries (Boesch, 2006; Williams et al., 2009).
One of the results of these algae blooms is hypoxia, which occurs when organic matter from algae sinks into the deep water, where it is decomposed, depleting dissolved oxygen to a certain low level (Kemp et al., 2005; Du et al., 2018). Natural ecological processes in forests and wetlands around the watershed and the coastline tended to “buffer” and regulate nutrient enrichment. Some examples of “buffers” are forests, wetlands, oyster reefs, and submerged aquatic vegetation (SAV), which trap and absorb nutrients and sediments (CBP-Dev, 2023). However, land-use change to accommodate a growing population has compromised many of these natural systems (Kemp et al., 2005; CBP-Issues, 2023).
The development and exploitation of the Chesapeake Bay natural resources contribute billions of dollars and thousands of jobs to the region’s economy and quality of life (McLeod and Leslie, 2009; Phillips and McGee, 2016; CBF-Fisheries, 2023). The Bay provides countless valuable and quantifiable economic goods and services, such as recreational activities, tourism, food, real estate, and shipping transport (Phillips and McGee, 2016). Further ecosystem degradation threatens the natural resources, which are the basis of the region’s economy. The decline in water quality can affect the fisheries, esthetic, and human health (Kemp et al., 2005; Birch et al., 2011; Compton et al., 2011; Steinzor et al., 2012; Phillips and McGee, 2016; George, 2019; Miller Hesed et al., 2020; Kenney and Gerst, 2021).
In response to the observed ecosystem decline, the government promoted agreements to guide the effort to reduce pollution and restore ecosystem health. This is led by the Chesapeake Bay Program (Hood et al., 2021; CBP-Accomplishments, 2023; CBP-Who, 2023). The Chesapeake Bay Program (CBP) partner institutions gathered input from citizens, stakeholders, academic institutions, and local government to draft an inclusive, goal-oriented document that addresses current and emerging environmental concerns, the Chesapeake Bay Watershed Agreement (CBWA) (CBP-Who, 2023). The community-based management’s initiative to incorporate, consult, and lead new actors to participate in the management has increased to benefit the system’s wellbeing. The results are the Total Maximum Daily Load (TMDL), a federal “pollution diet” to restore the water quality, and “Watershed Implementation Plans,” often called WIPs (CBP-TMDL, 2023; CBP-WIP, 2023). The WIP documents include specific steps and plans each jurisdiction will take to meet the goals of the TMDL by 2025 (CBP-WIP, 2023).
The extensive information and overall institutionalized management effort transcending six states and the USA’s national capital in the Chesapeake Bay watershed makes it an ideal socio-ecological system for assessing sustainable development. There are several holistic frameworks that assess the sustainability of a system. However, most of them focus on only one sustainability domain (environmental, social, or economic) or evaluate the causes and responses to a particular issue, such as eutrophication. The framework chosen in this assessment is based on the Circles of Coastal Sustainability (De Alencar et al., 2020), further developed by Gallo-Vélez et al. (2023). This framework is designed to assess environmental, social, economical, and governance domains to understand the complex interactions of the region’s development. Governance was added to the three previous pillars of sustainability (ecological, social, and economic) because the fragmented nature of governance and management has been recognized as one of the main limitations of sustainable development (Neumann et al., 2017; De Alencar et al., 2020).
At present, the method to evaluate sustainability is still in development, and the assessment is highly subjective because of the availability of quantitative and qualitative information from each domain (De Alencar et al., 2020; Gallo-Vélez et al., 2023). Moreover, evaluating sustainability requires the expertise of scientific professionals familiar with the system. Nevertheless, the assessment serves as a foundation tool for understanding the concept of sustainability within the system. It initiates dialog about the meaning of sustainability and aims to identify indicators that must be quantified for its achievement. The assessment, while acknowledging its limitations, can serve as a basis for developing comprehensive, holistic responses considering the environmental, economic, and social impacts.
2 Methods
2.1 Study area
The Chesapeake Bay is an estuary with a watershed 14 times the size of the Bay (11,603 km2:166,000 km2), located in the middle of the USA Atlantic coast (Figure 1) (Bilkovic et al., 2019). The Bay is approximately 300 km long from north to south, with the width varying from 20 km in its mouth to 45 km in the middle and a few km in the upper (Kemp et al., 2005; Garzon et al., 2018). The mean depth is 6.5 m, with the deepest point (53 m) located in the middle of the Bay (Hardaway and Byrne, 1999; Lin et al., 2002; Bilkovic et al., 2019; CBP-Facts, 2023).
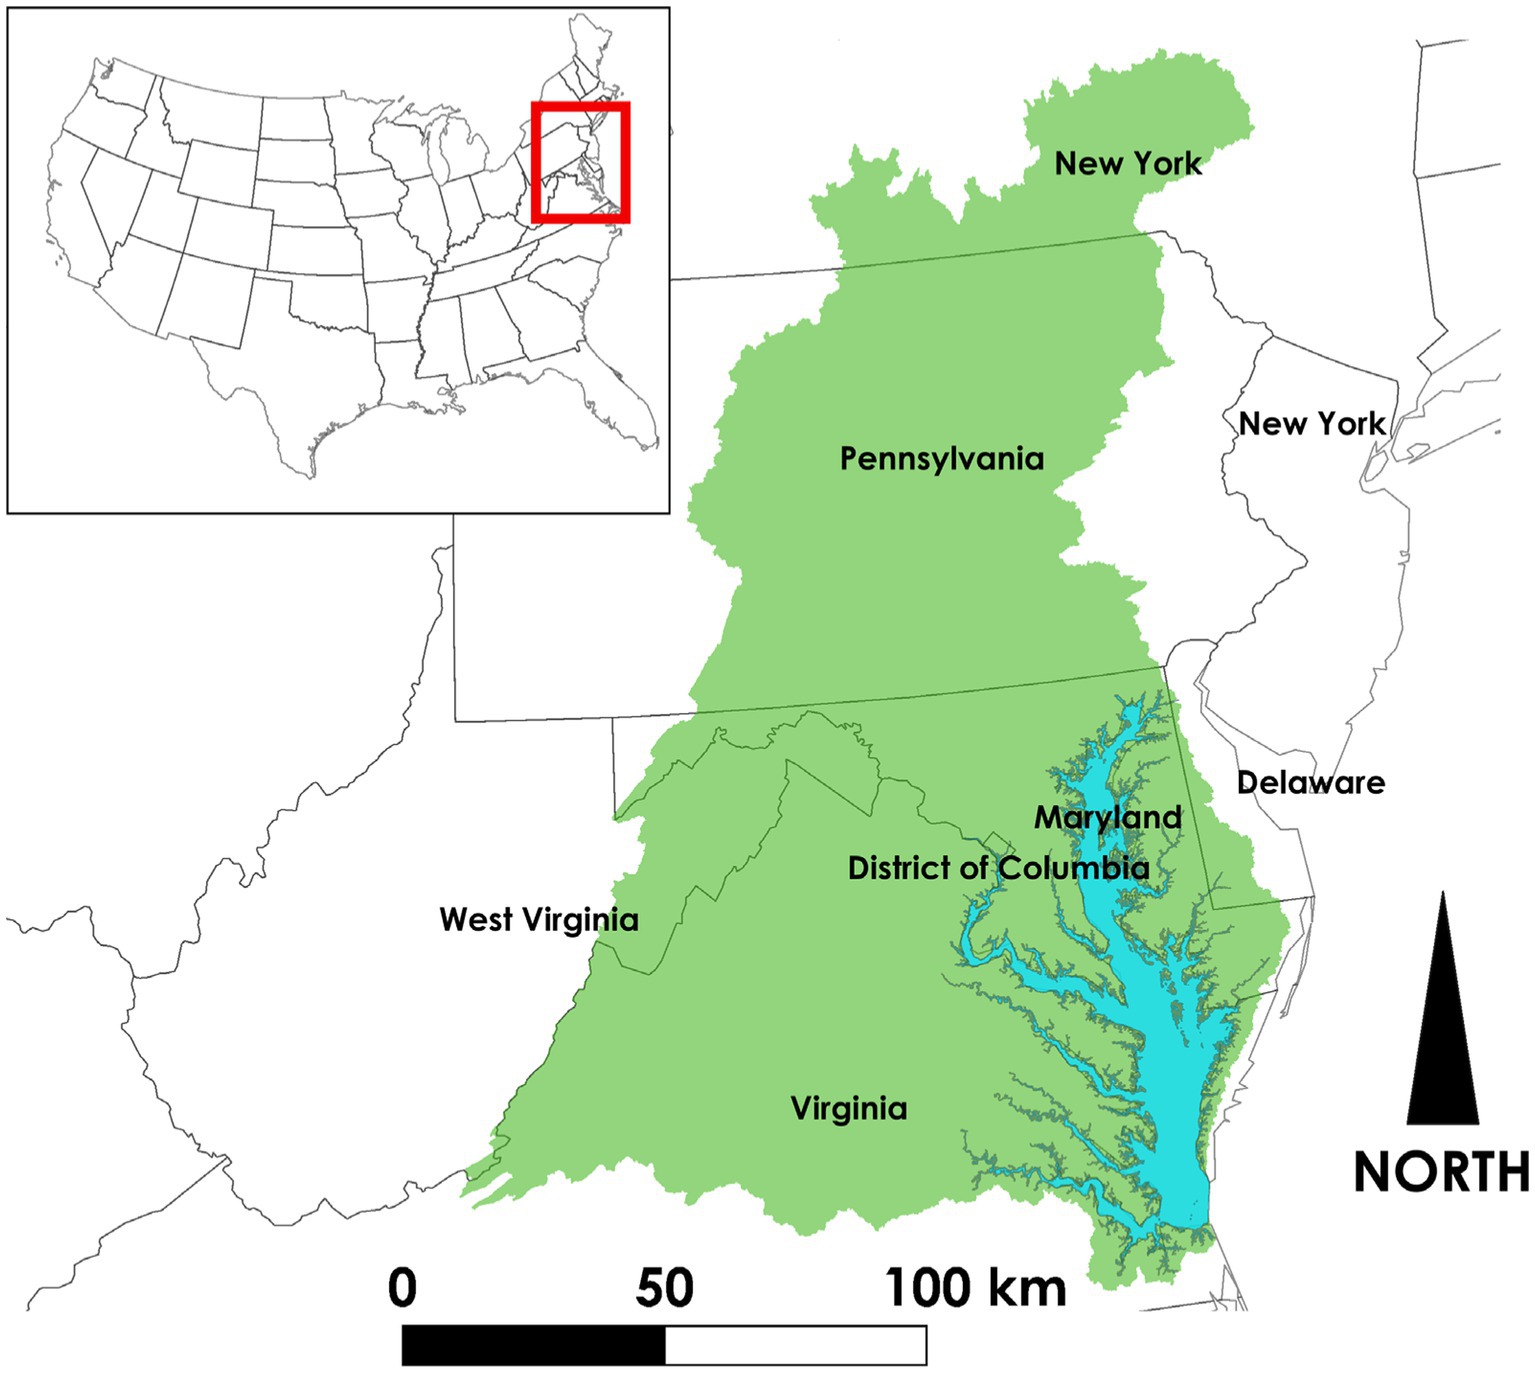
Figure 1. Chesapeake Bay Watershed boundaries and location in the United States of America.
Overall, the watershed remains mostly forested, with some urban development areas. The land use is divided mainly into agriculture and a mix of urban and rural development (CBP-LandCover, 2023). Agriculture dominates most of the watershed (CBF-LandUse, 2023), while the main expansion of metropolitan areas are Washington, D.C., Baltimore, Philadelphia, Richmond, and Hampton Roads (Ruark, 2010). Based on the 2020 USA Census data, the cities positioned between these major metropolitan areas have the highest population, with an estimated total of approximately 10 million people (Bureau, 2023). The population is growing, particularly near the waterfronts of the Bay’s tidal waters (Walsh et al., 2019). On the shoreline, the major structural habitats are seagrass beds, marshes, and oyster reefs (Bilkovic et al., 2019).
The main source of freshwater input comes from the Susquehanna, Potomac, Rappahannock, York, and James rivers (Kemp et al., 2005; Du and Shen, 2017). The flow of freshwater drives the estuarine circulation and suppresses vertical exchange. Destratification can occur because of strong, episodic winds. However, stratification is quickly reestablished, retaining particulate and dissolved materials in the lower layer. The circulation of the Bay makes this a productive system, with efficient ecosystem nutrient use and a tendency for oxygen depletion from deep water (Kemp et al., 2005).
The socio-economic system of the Chesapeake Bay watershed is divided among six states of the USA. The north part of the watershed includes New York State, flows south to parts of Pennsylvania State, and then to Virginia at the southern border. In the middle, there are parts of Delaware and West Virginia States, most of Maryland, and the whole District of Columbia (Figure 1) (Arnold et al., 2021).
2.2 Socio-ecological assessment framework
The Circles of Coastal Sustainability framework was adapted from the Circles of Sustainability developed by De Alencar et al. (2020). The objective was to design a holistic framework to assess the sustainability of the socio-ecological systems of the world’s coasts. The framework is divided into four domains (environment, social, economy, and governance), each with five categories related to any coastal environment. The categories were developed by the multi-disciplinary Scientific Committee of Future Earth Coasts1 in 2016 and have been applied to the Spanish coast (De Alencar et al., 2020) and Magdalena River delta in Colombia (Gallo-Vélez et al., 2023).
2.2.1 Sub-categories and indicators for the Chesapeake Bay watershed
The categories are generic qualities of coastal sustainability; they can be applied to a diverse range of socio-ecological systems and size scales. To adapt the framework to the Chesapeake Bay watershed, the categories were divided into sub-categories related to recognizable and comprehensive indicators from the region (Table 1).
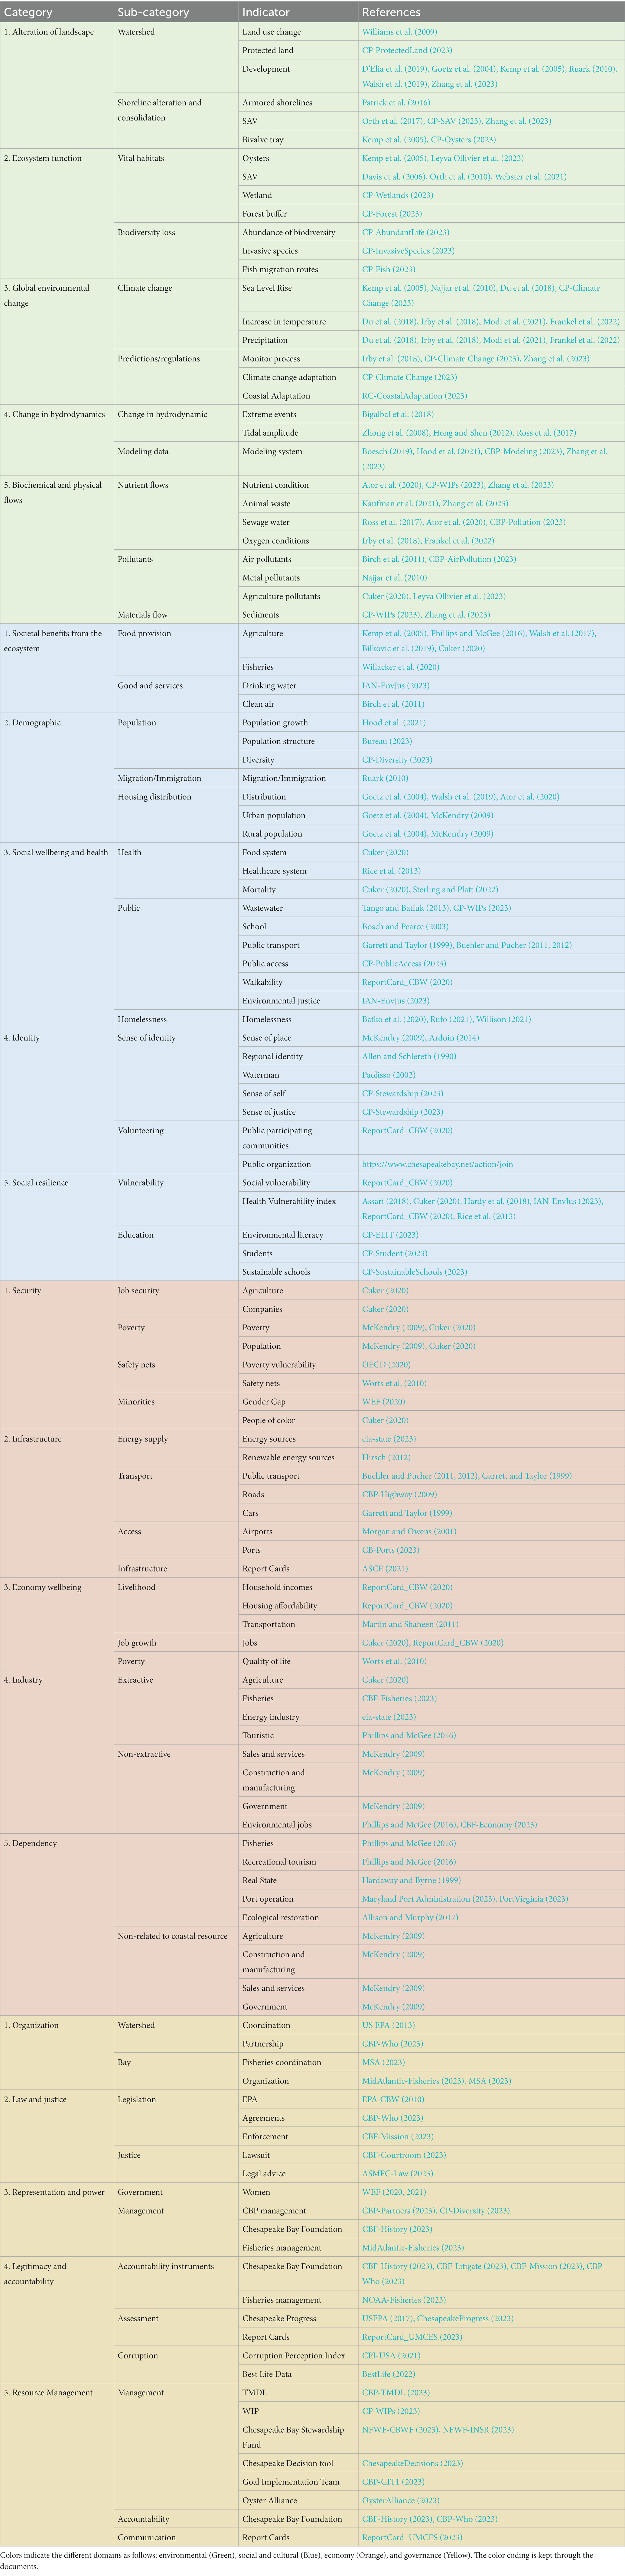
Table 1. Sub-category and indicator used for the Chesapeake Bay watershed sustainability assessment with their corresponding reference.
Table 1 has a total of 129 indicators: 30 indicators for the environment domain, 33 for society and culture, 39 for economy, and 27 for politics and governance. The Chesapeake Bay watershed is one of the most studied places in the world (Arnold et al., 2021). The enormous availability of information, management, and communication makes it a challenge to choose indicators. Therefore, the selection of the indicator was based on the Chesapeake Bay Program (CBP-Issues, 2023) and a literature review of the system. The available information was adapted to the framework with the main commitment to reflect the “real-life” sustainability of the system.
2.2.2 Propose global sustainability score
The sustainability score thresholds were developed by De Alencar et al. (2020), as shown in Figure 2. The sustainability score has five levels ranging from “Excellent” optimal condition to “Bad” worst condition. The color range from De Alencar et al. (2020) was changed from red-blue, based on the European Union Water Framework Directive, to a more globally recognizable “traffic light” range of red-green, also used by Gallo-Vélez et al. (2023).
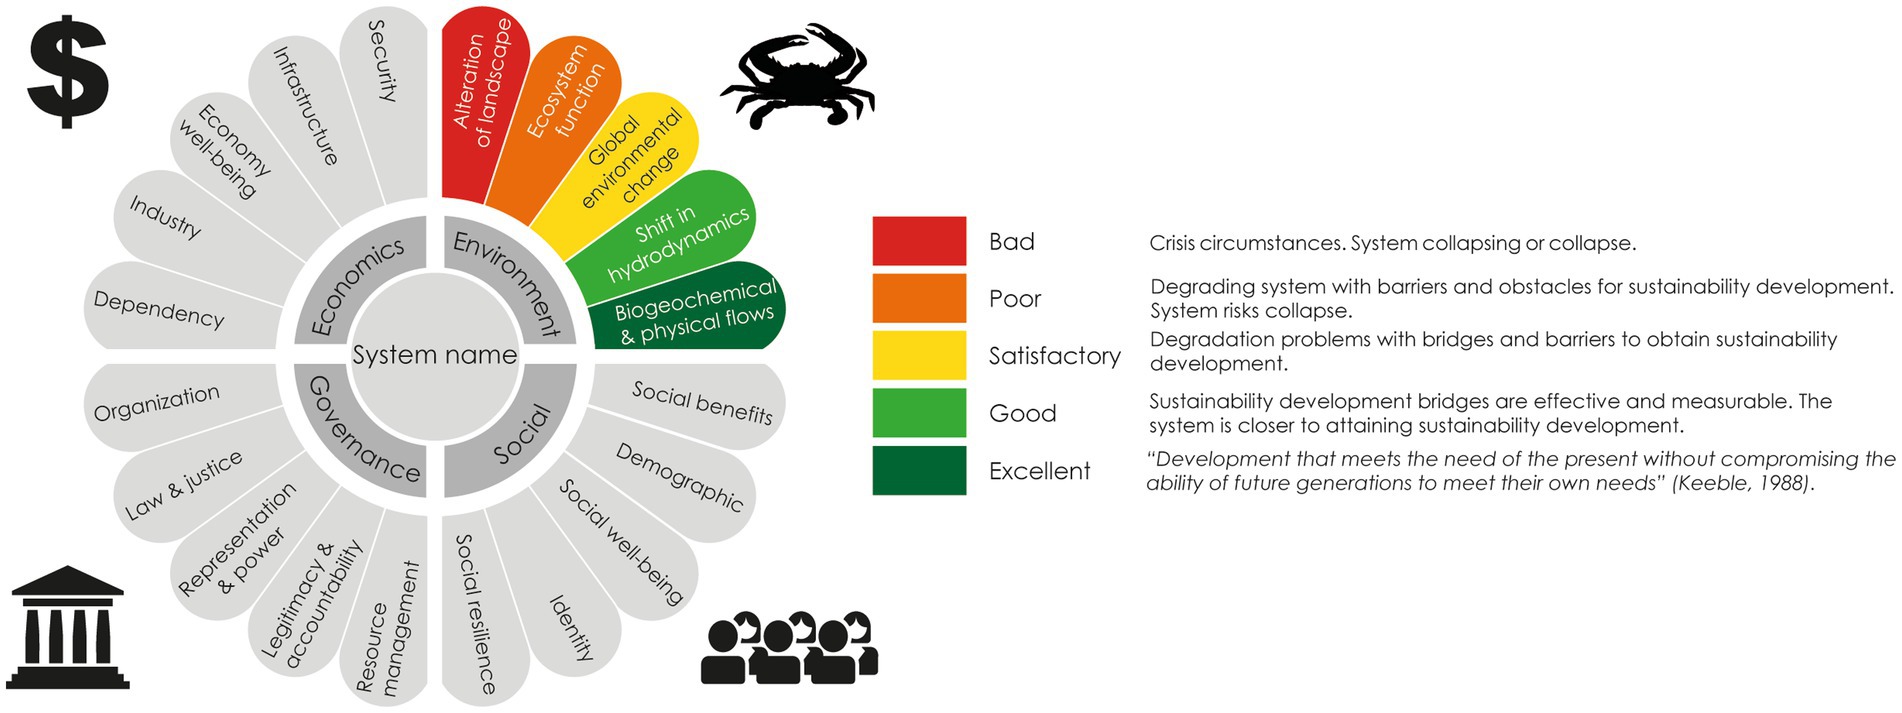
Figure 2. Design template representing the overall system, domains, and categories of the Circles of Coastal Sustainability framework applied to the Chesapeake Bay watershed, with its respective score system color palette and example. Additionally, the design includes the proposed global sustainability score system definitions. Adaptation from De Alencar et al. (2020).
Gallo-Vélez et al. (2023) developed a score based on a decision tree adapted from Sachs et al. (2021) to define a threshold for each indicator. Each indicator obtained a numerical value according to its sustainability level: “Excellent” = 5, “Good” = 4, “Satisfactory” = 3, “Poor” = 2, and “Bad” = 1. However, this approach requires extensive details about each indicator, and the general result can be misinterpreted.
Therefore, this study proposes a different sustainability assessment based on an extensive literature review of “Sustainability development.” The overall socio-ecological system is assessed on a simple Excellent-Bad scale, using the authors’ expert judgment, as shown in Figure 2. This approach is based on the definition of sustainability by Keeble (1988), which represents “Excellent.” The other grades (“Good,” “Satisfactory,” “Poor,” and “Bad”) represent degrees of deviations from “Excellent.” The simplification is to convey a clear message about the current circumstances of the system to a non-scientific audience. For example, a “Bad” score would be given to a region during an economic crisis (recession, currency crisis, or others) because the system lacks one of the pillars for sustainability development. This could also be applied if the region has a crisis in any of the domains: a government crisis, such as a war or military coup; an environmental crisis, natural or man-made, such as a flooding area or oil spill; or a social crisis, such as homelessness.
The socio-economic crisis may not look related to a degraded ecosystem. However, according to Mensah (2019), a social crisis (such as poverty) has the potential to lead to environmental destruction and economic stability. The destruction of available natural resources can subsequently contribute to increased economic instability, leading to a cycle of further environmental destruction and increased social inequality (Mensah, 2019). It is important to note that this correlation is not universally applicable or instant; it may manifest over the years. Nonetheless, it is crucial to consider.
Furthermore, Figure 2 has two words that require to be defined: “barriers” and “bridges.” These words were defined using Boesch’s (2019) article as a metaphor for barriers against and bridges toward effective regional ecosystem management. Some examples can be seen in the same article, e.g., barriers could be limited knowledge of causes and consequences, managers’ lack of authority and responsibility, limited public and stakeholders’ concerns, and others. Some examples of bridges are education, enduring engagement of responsible managers, and effective communication of causes, risks, and benefits (Boesch, 2019).
The general score (Figure 2) was developed based on a literature review to propose a global sustainability score using the authors’ expert judgment for each domain (Table 2) and each category (Table 3). The normalization process is done by using expert judgment to assess the collective set of indicators for each category and then using Table 3 to provide a general evaluation; then, each domain is assessed using Table 2; and finally, the overall system evaluation is conveyed to stakeholders in Figure 2.
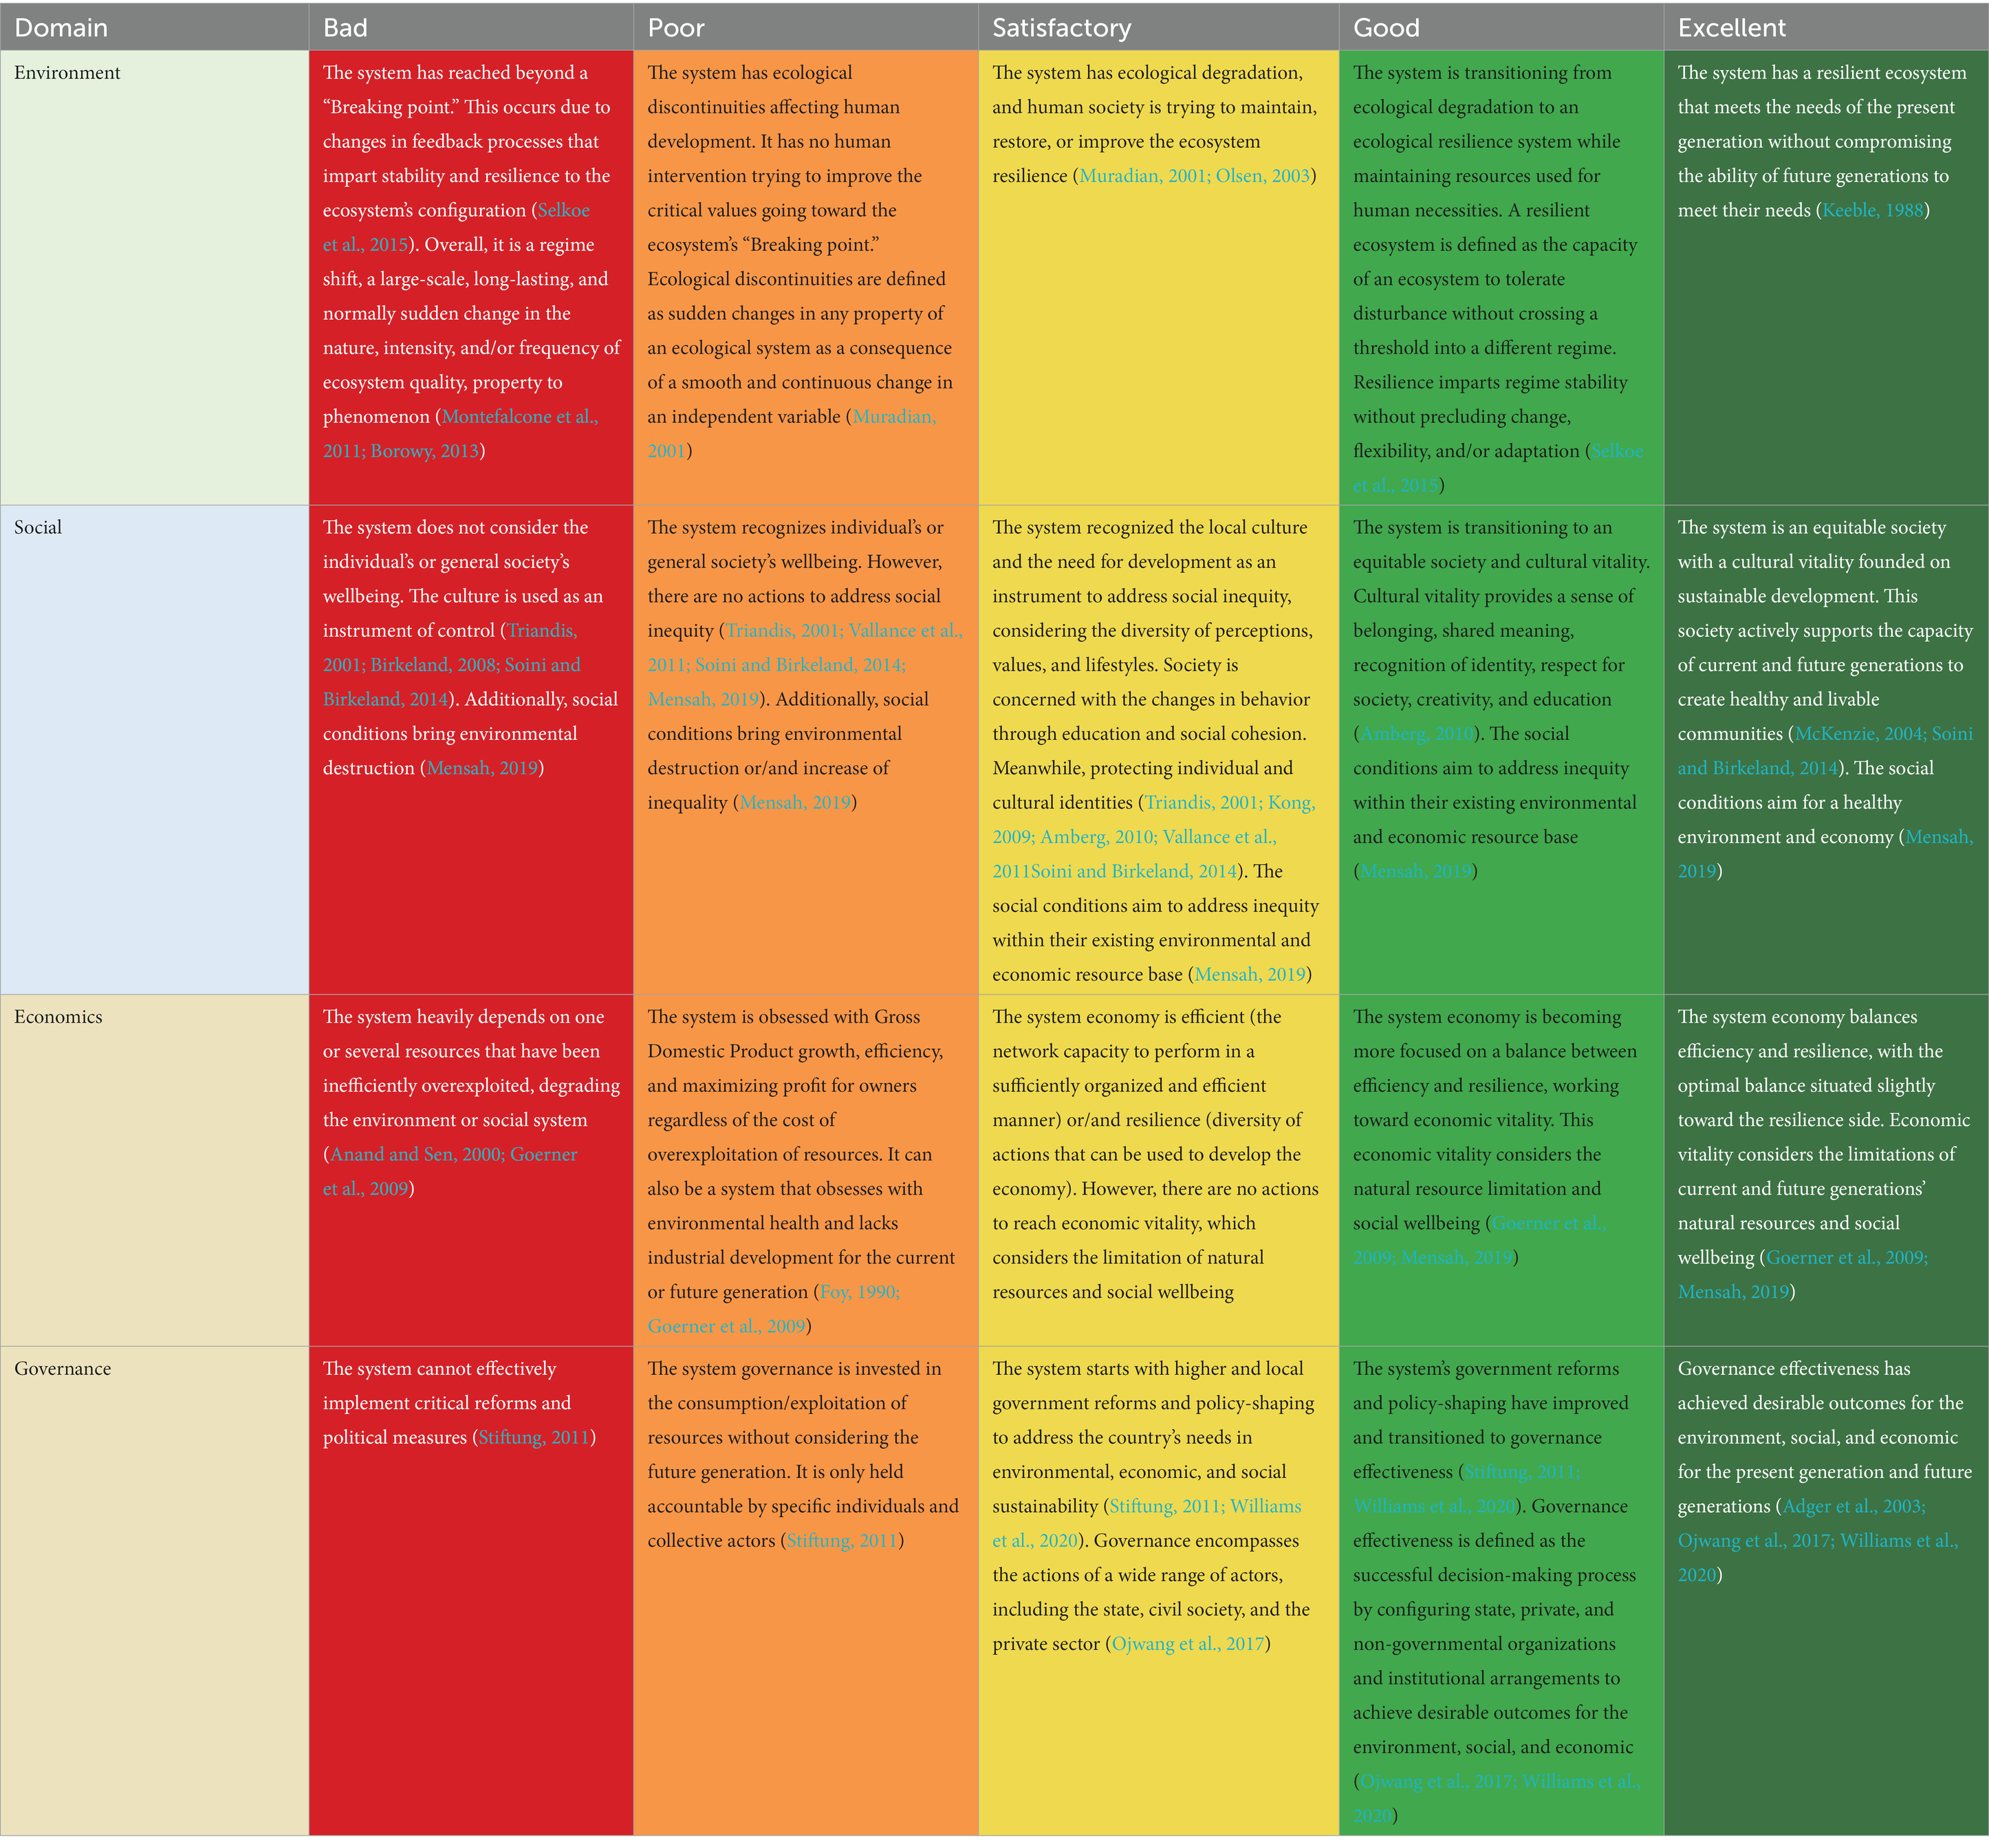
Table 2. Categorical scales to globalize the score for each domain.
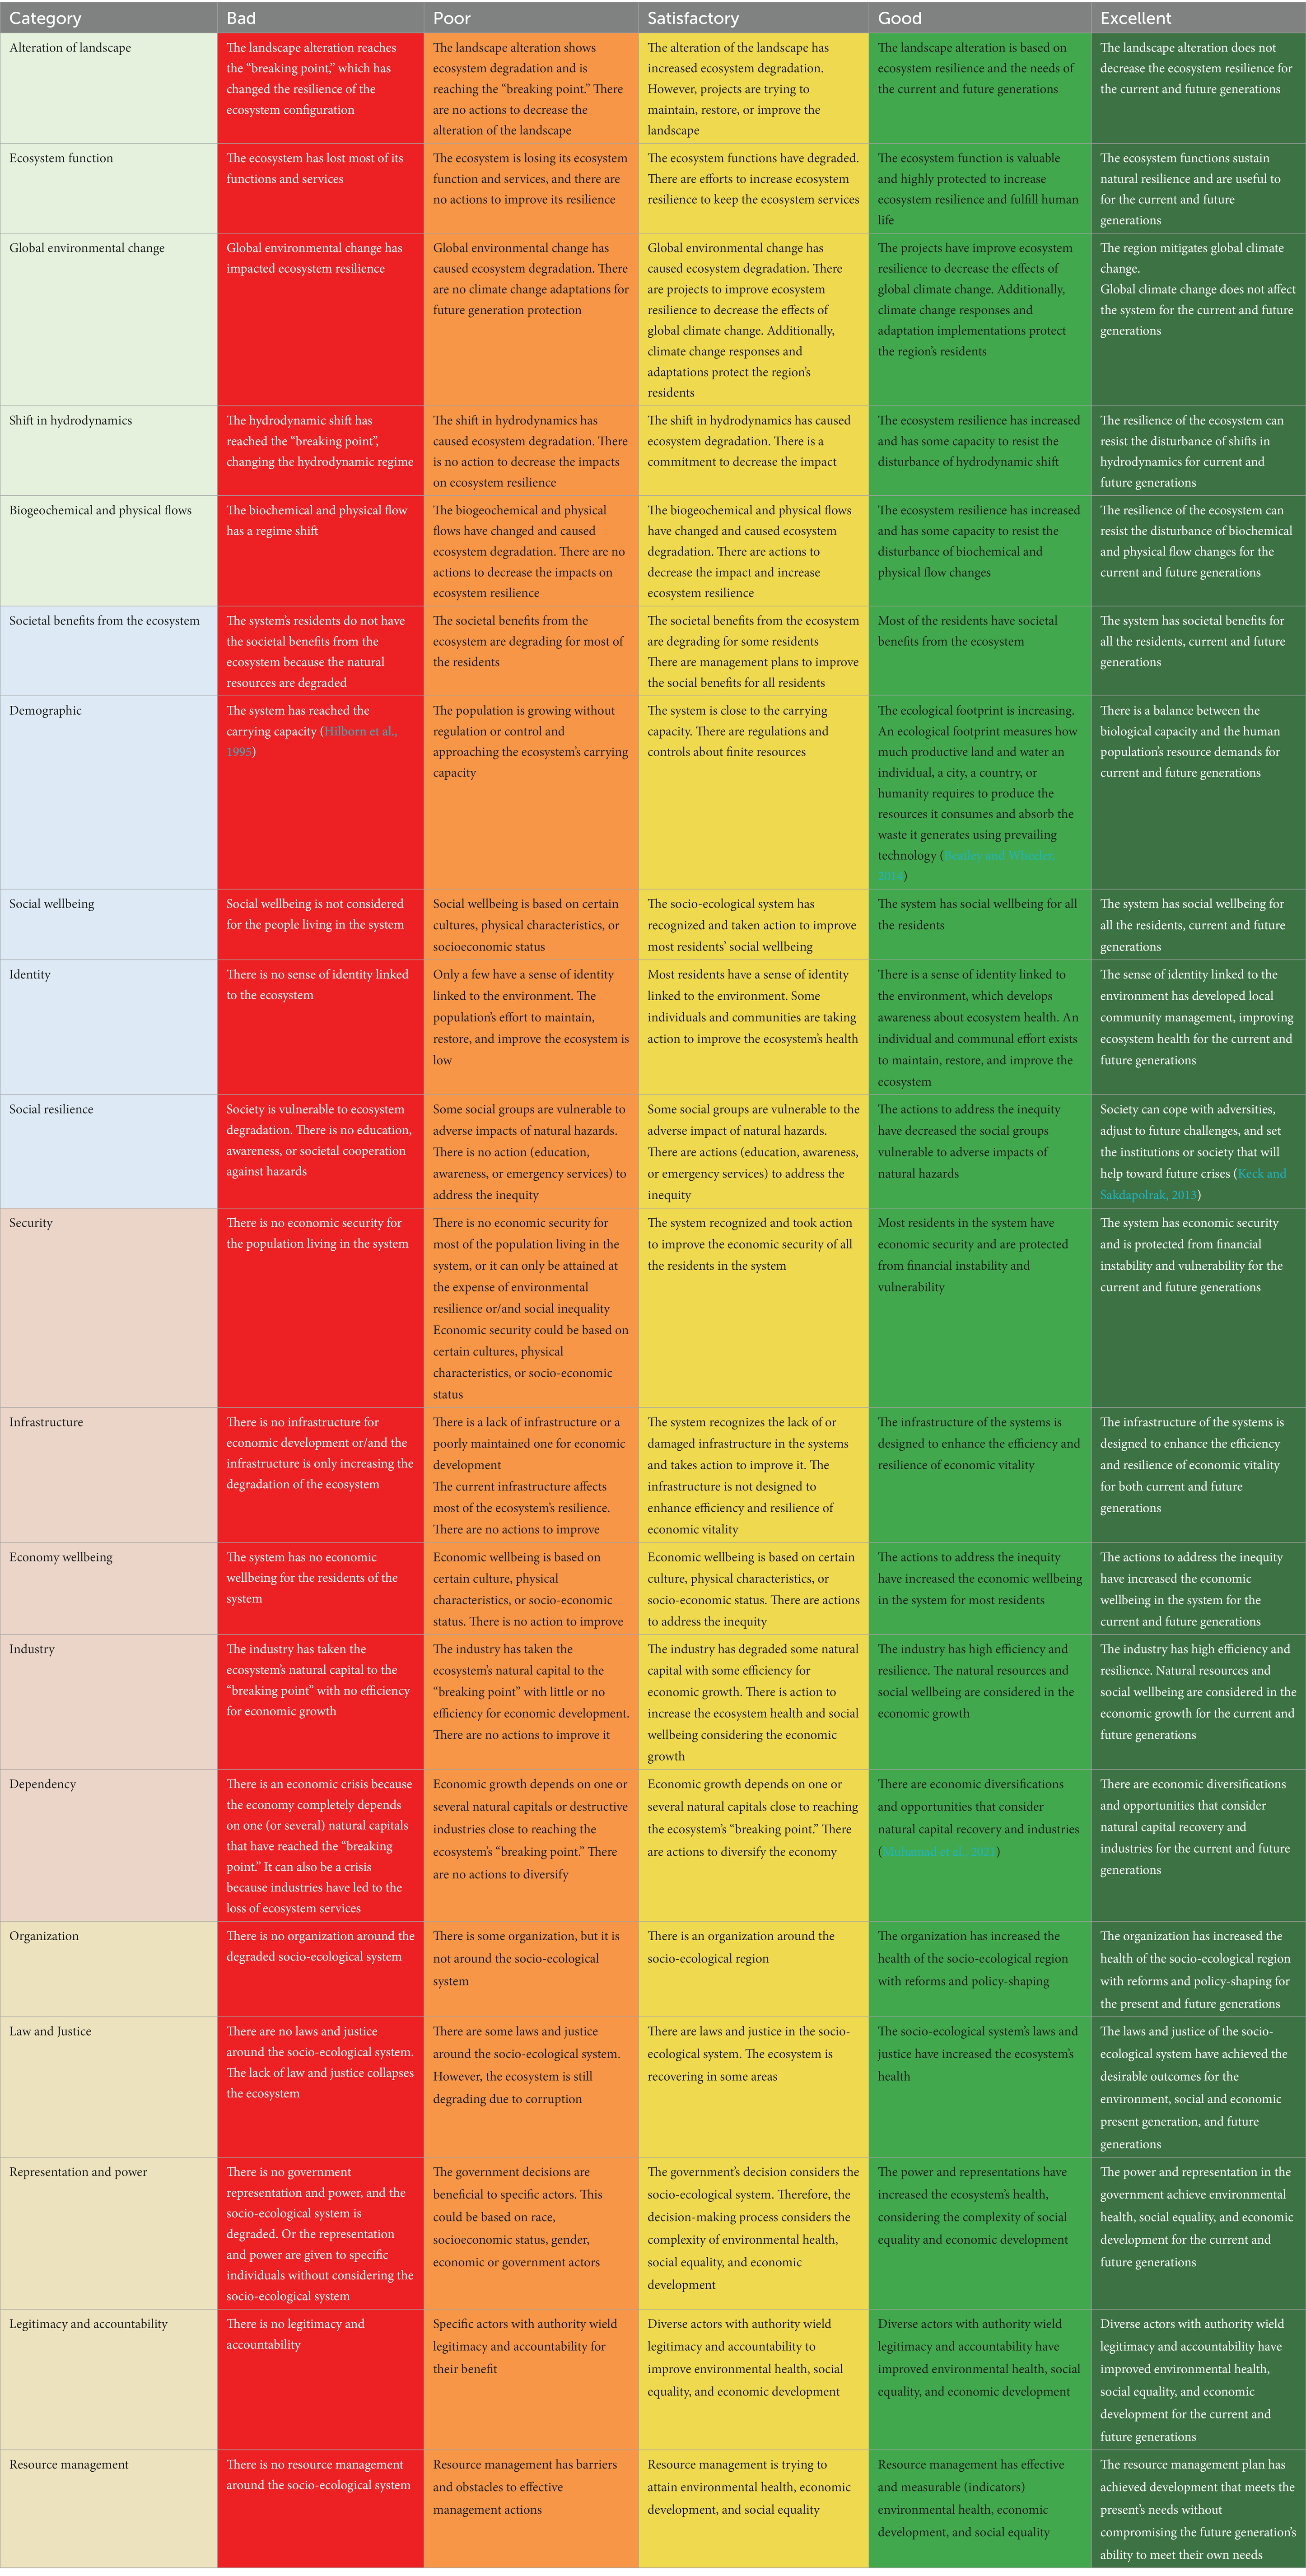
Table 3. Categorical scales to globalize the score for each category.
It is essential to note that the evaluation of the Chesapeake Bay watershed was developed using indicators from Table 1, drawing from scientific and non-scientific sources spanning 1999 to 2023. Therefore, this evaluation remains valid for the duration of the specified timeframe.
2.2.3 Communication of science
One of the main goals of the sustainability assessment was to improve communication with stakeholders and the general public. Understanding sustainability development can be overwhelming when the interconnection between the domains can be incredibly complex. Therefore, science communication tools are helpful in knowledge-sharing with the general public and policy/decision-makers. This requires a modification of De Alencar et al.’s (2020) “bull’s eye” image to make it more easily understandable as an assessment of the sustainability of a socio-ecological system. The new representation resembles a daisy-like flower, so the image is called “Sustainability Daisy” (Figure 2). The socio-ecological system’s name is at the center of the new design, surrounded by each of the domain’s divisions with its five categories as petals. On the outside of the wheel, IAN symbols represent the four domains2. These symbols can be locally adapted, e.g., Dollar $ represents the currency of the USA, and the blue crab represents the Chesapeake Bay ecosystem because of the cultural importance of the fisherman in the region (Paolisso, 2002).
3 Results
Table 4 has a total of 129 indicators, with the evaluation of each category using the authors’ expert judgment coupled with the proposed global assessment (Table 3). The “Economics” domain has the highest number of indicators (39), followed by the “Social” domain with 33. Finally, the “Environment” domain has 30 and the “Governance” 27.

Table 4. Data for the assessment of indicators.
Tables 5–8 have the authors’ best judgment to evaluate each domain and category (Tables 2, 3) using the information provided by Table 4. Additionally, these tables have the main bridges and barriers toward sustainable development found by the indicators. It is important to note that some of these bridges and barriers can be connected; however, this is not applicable to all cases. Finally, the sustainability of the overall Chesapeake Bay watershed socio-ecological system was assessed using the information provided by Tables 5–8 and the proposed global assessment (Figure 2).
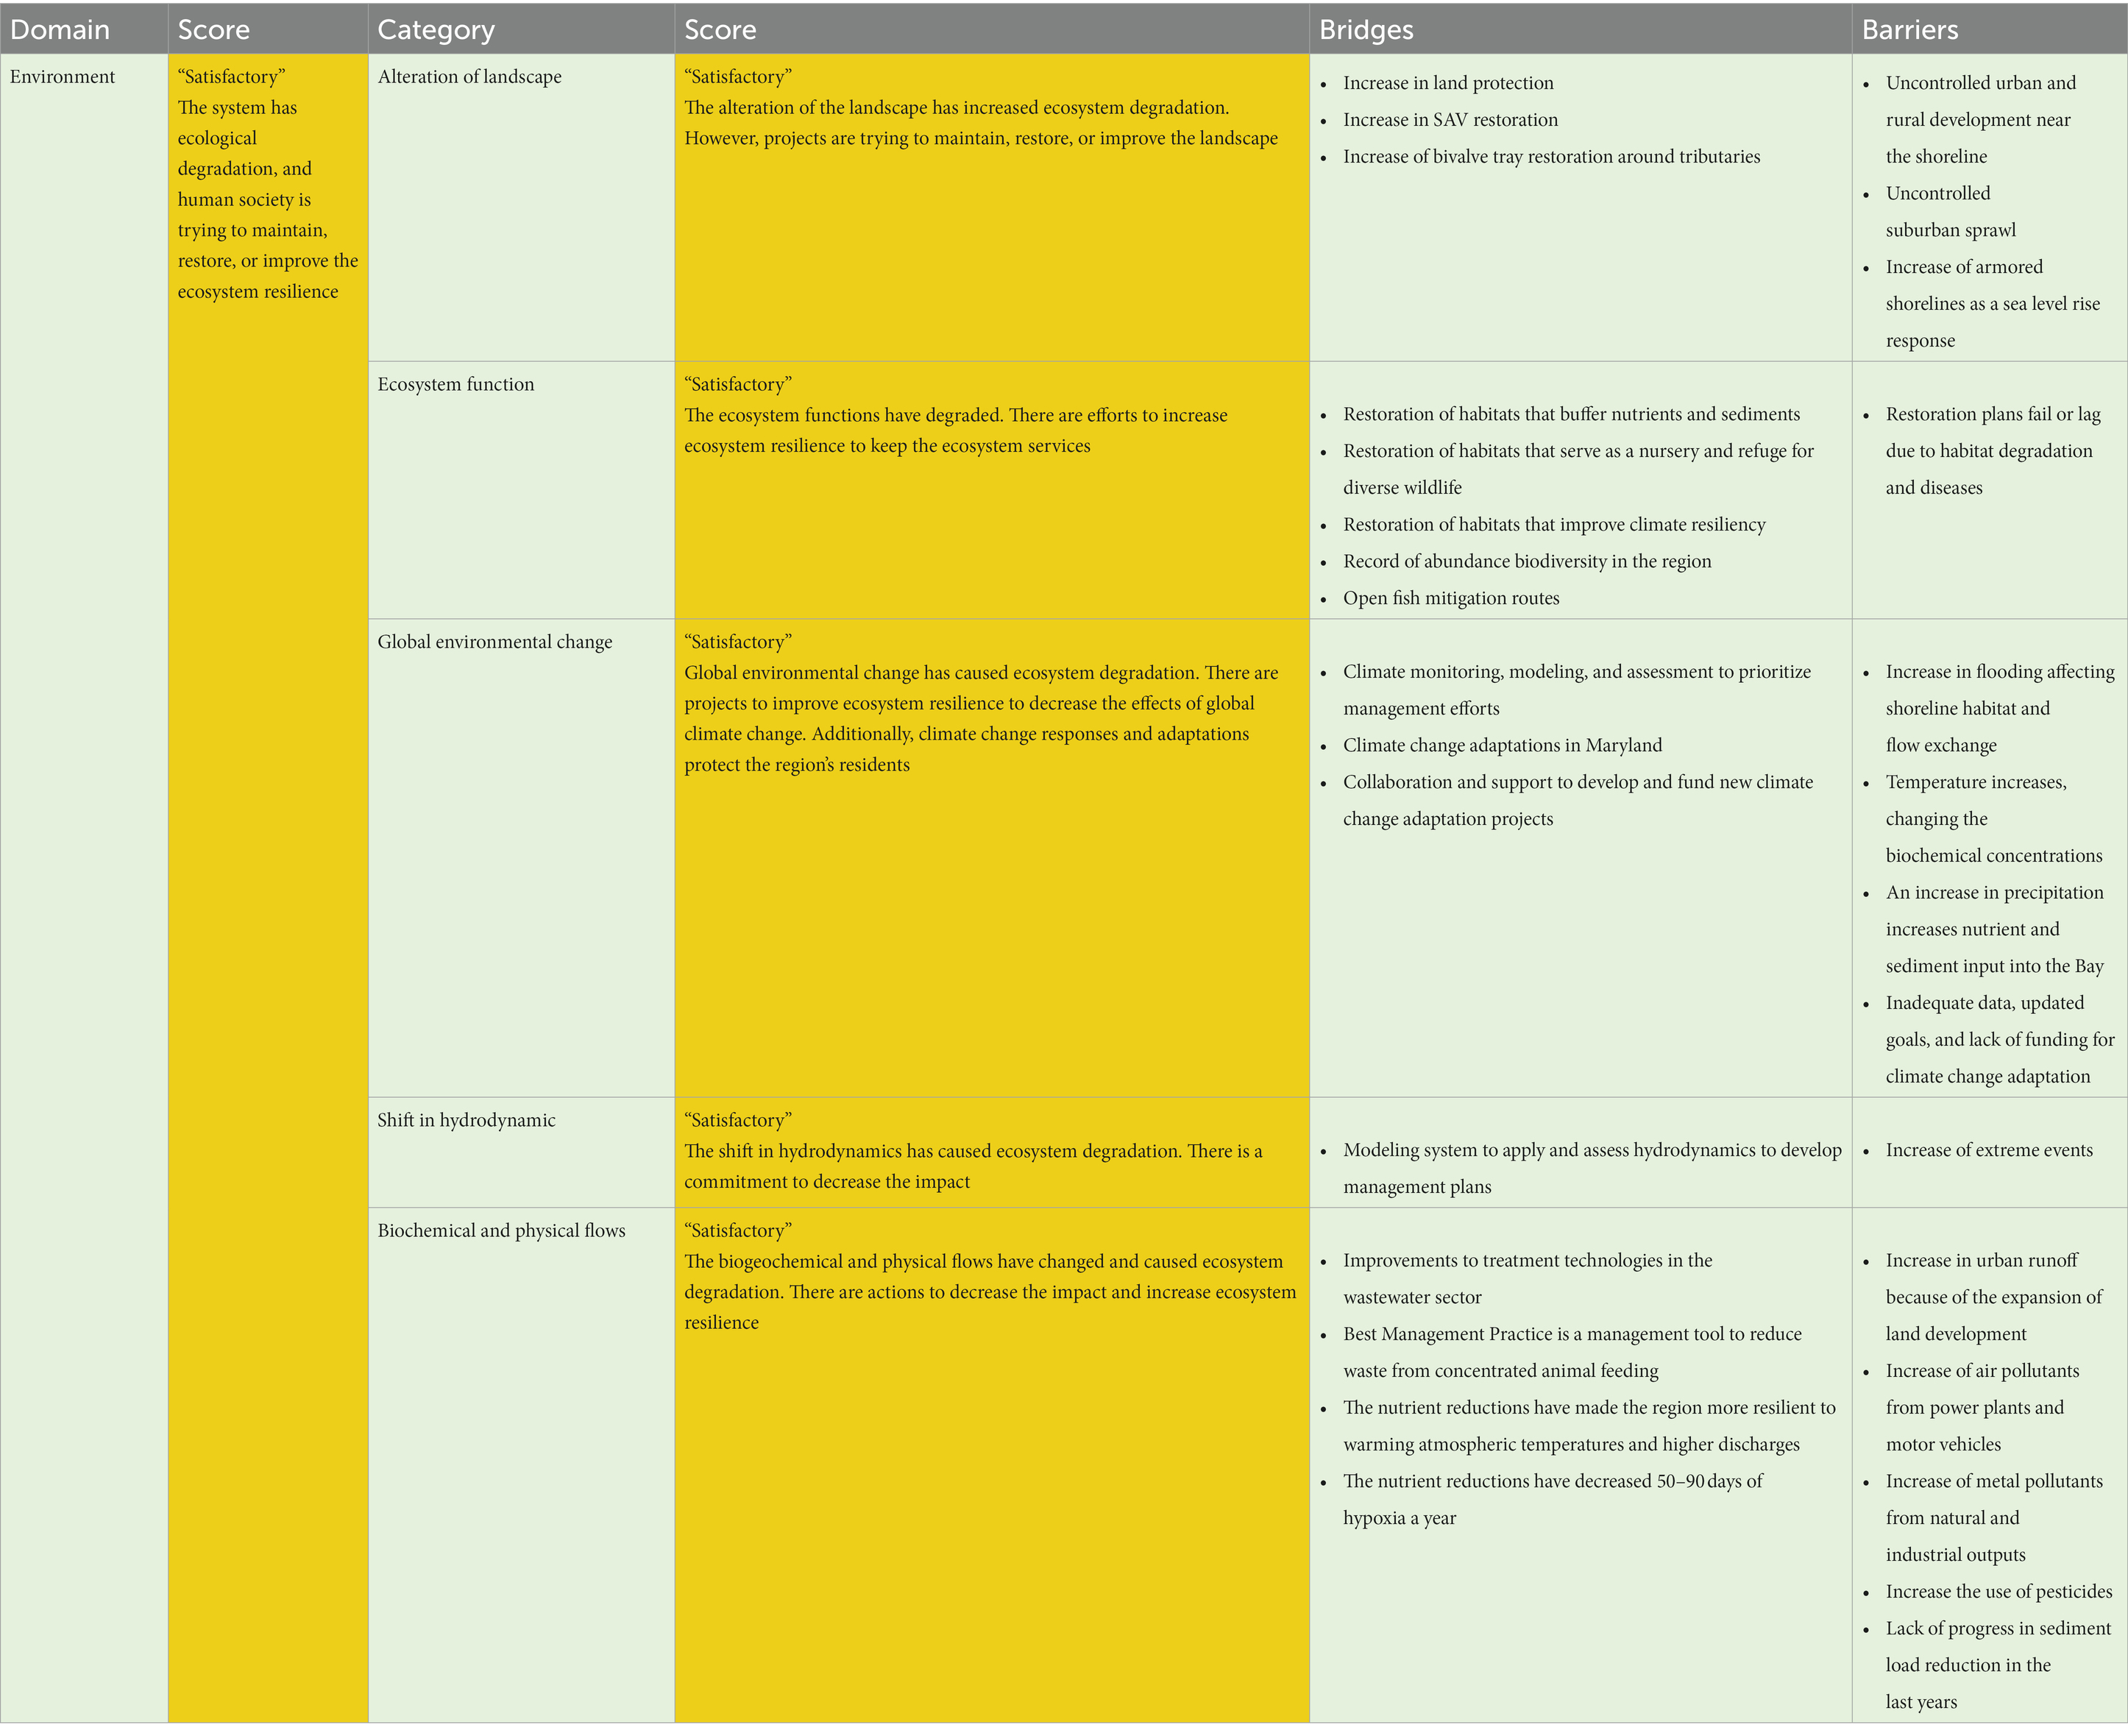
Table 5. Environment score with the bridges and barriers from each category.
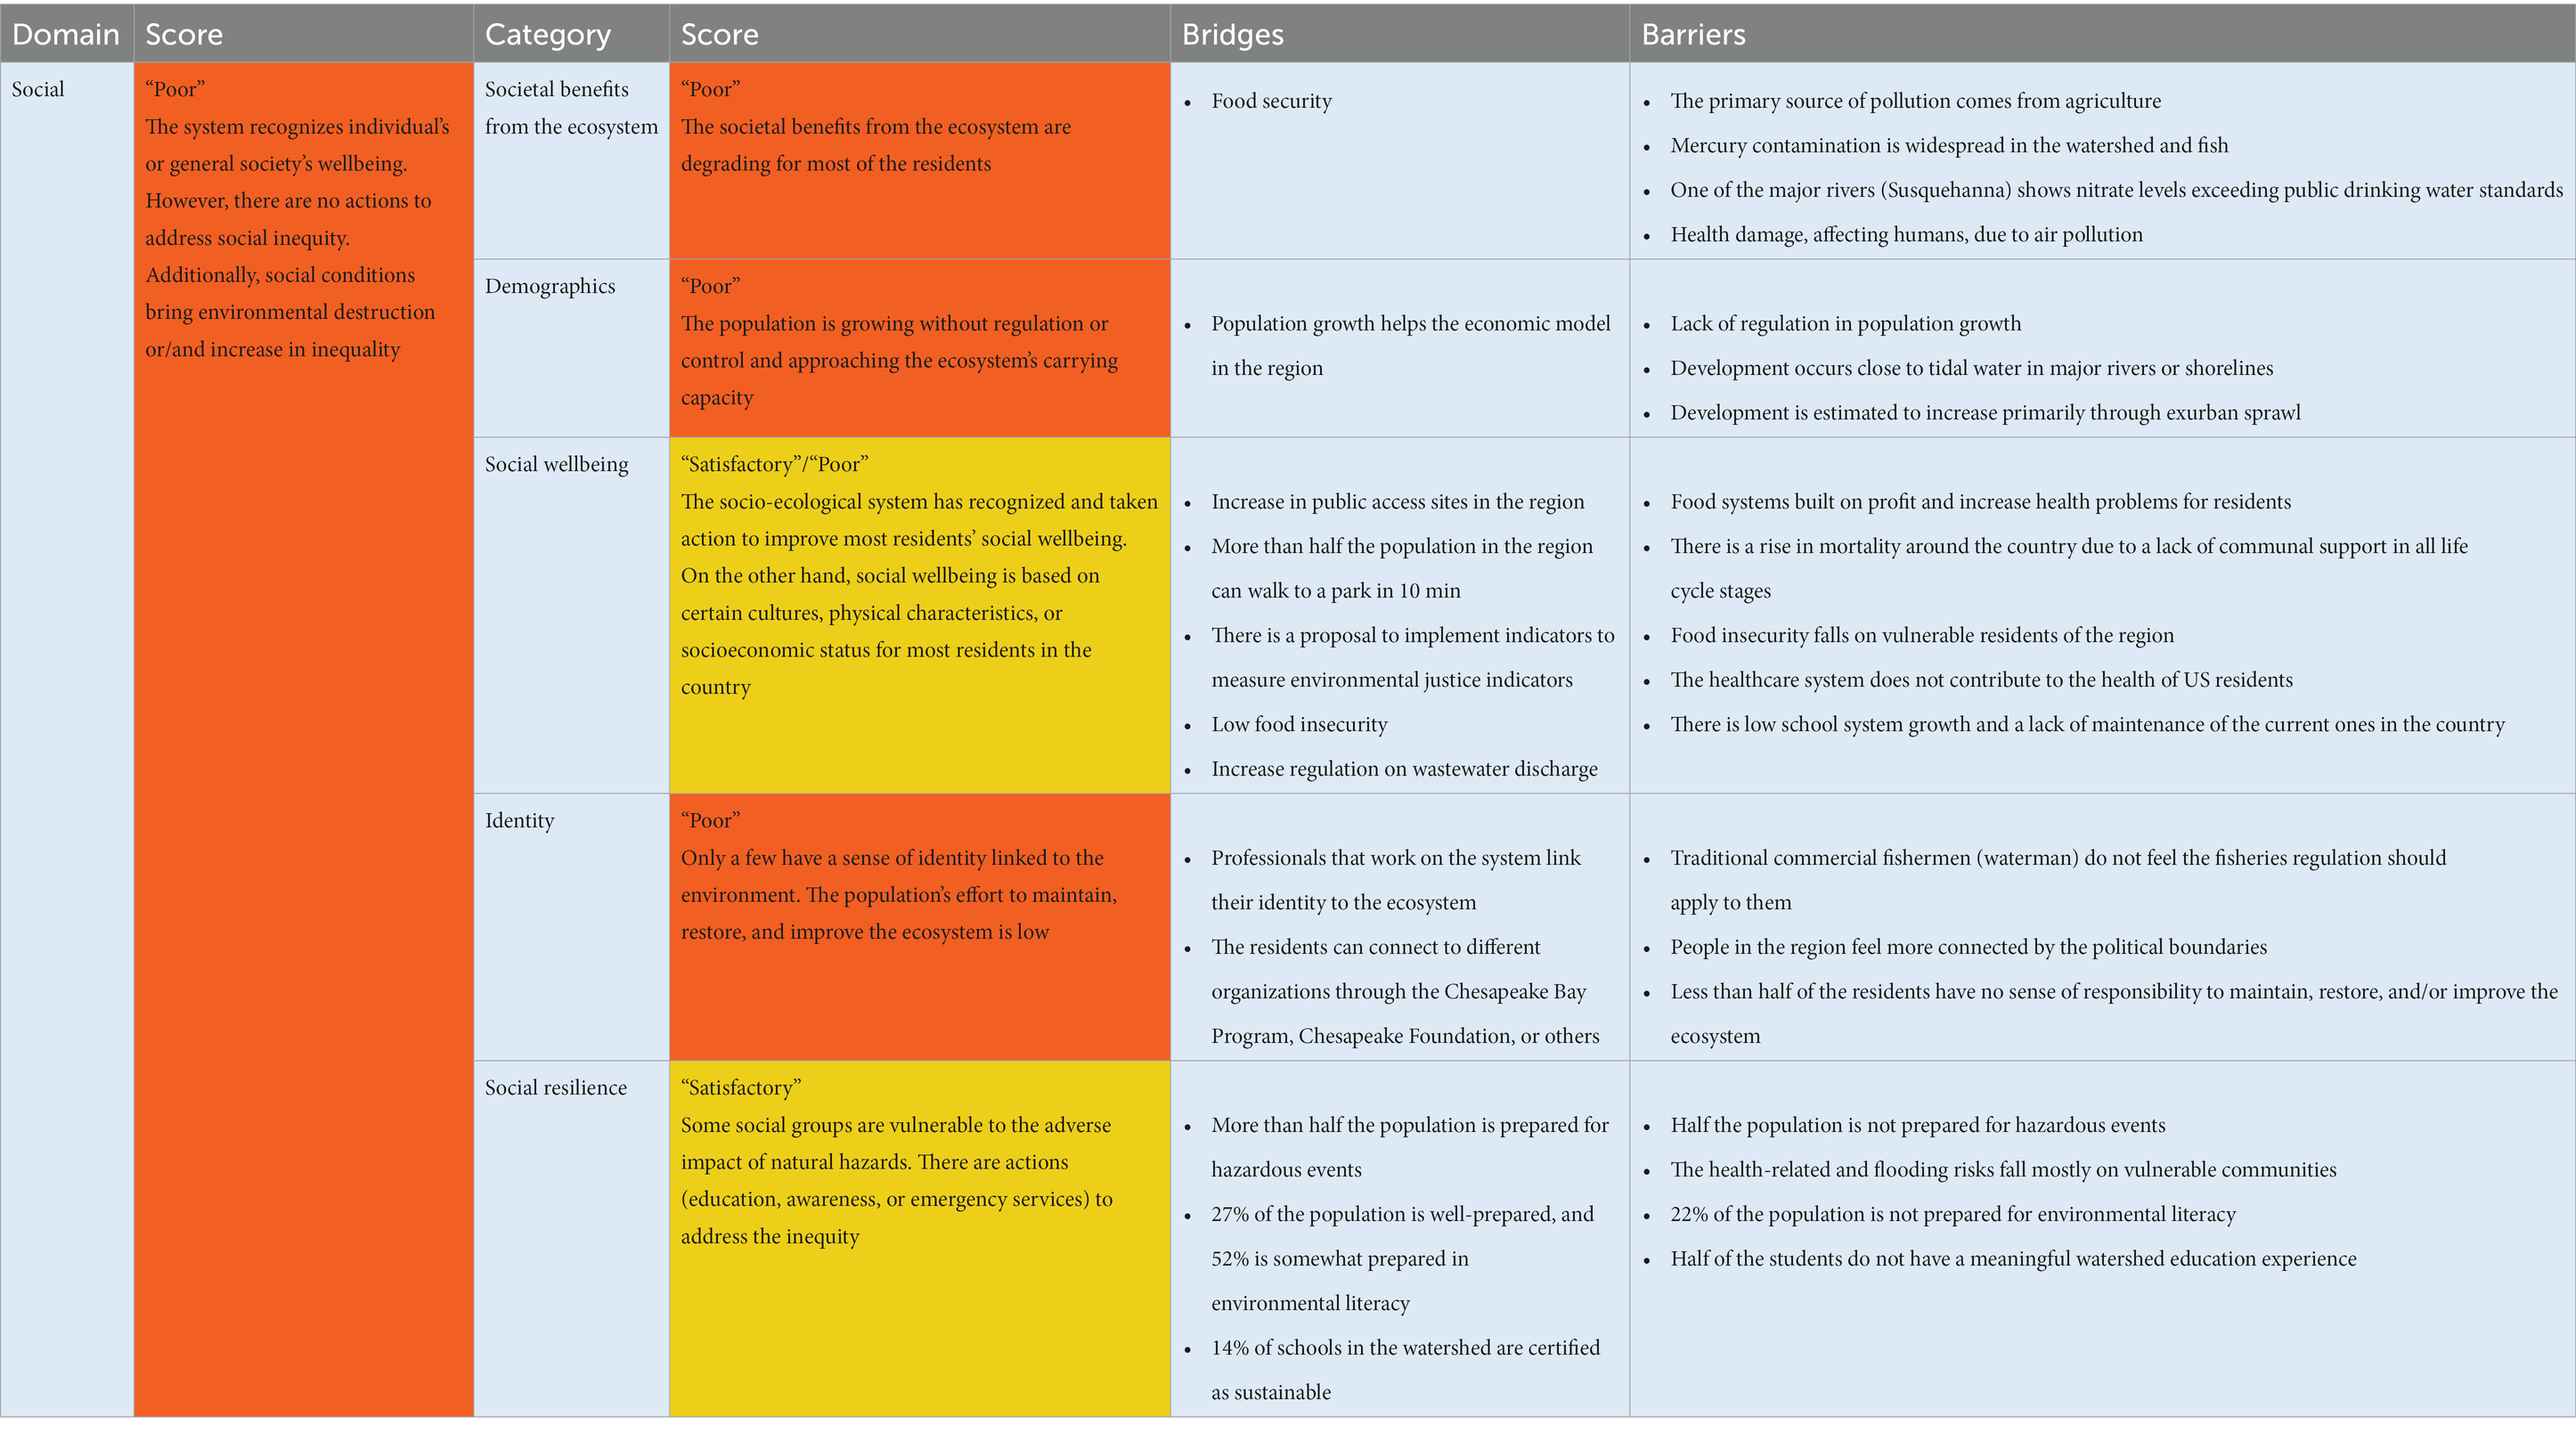
Table 6. Social score with the bridges and barriers from each category.
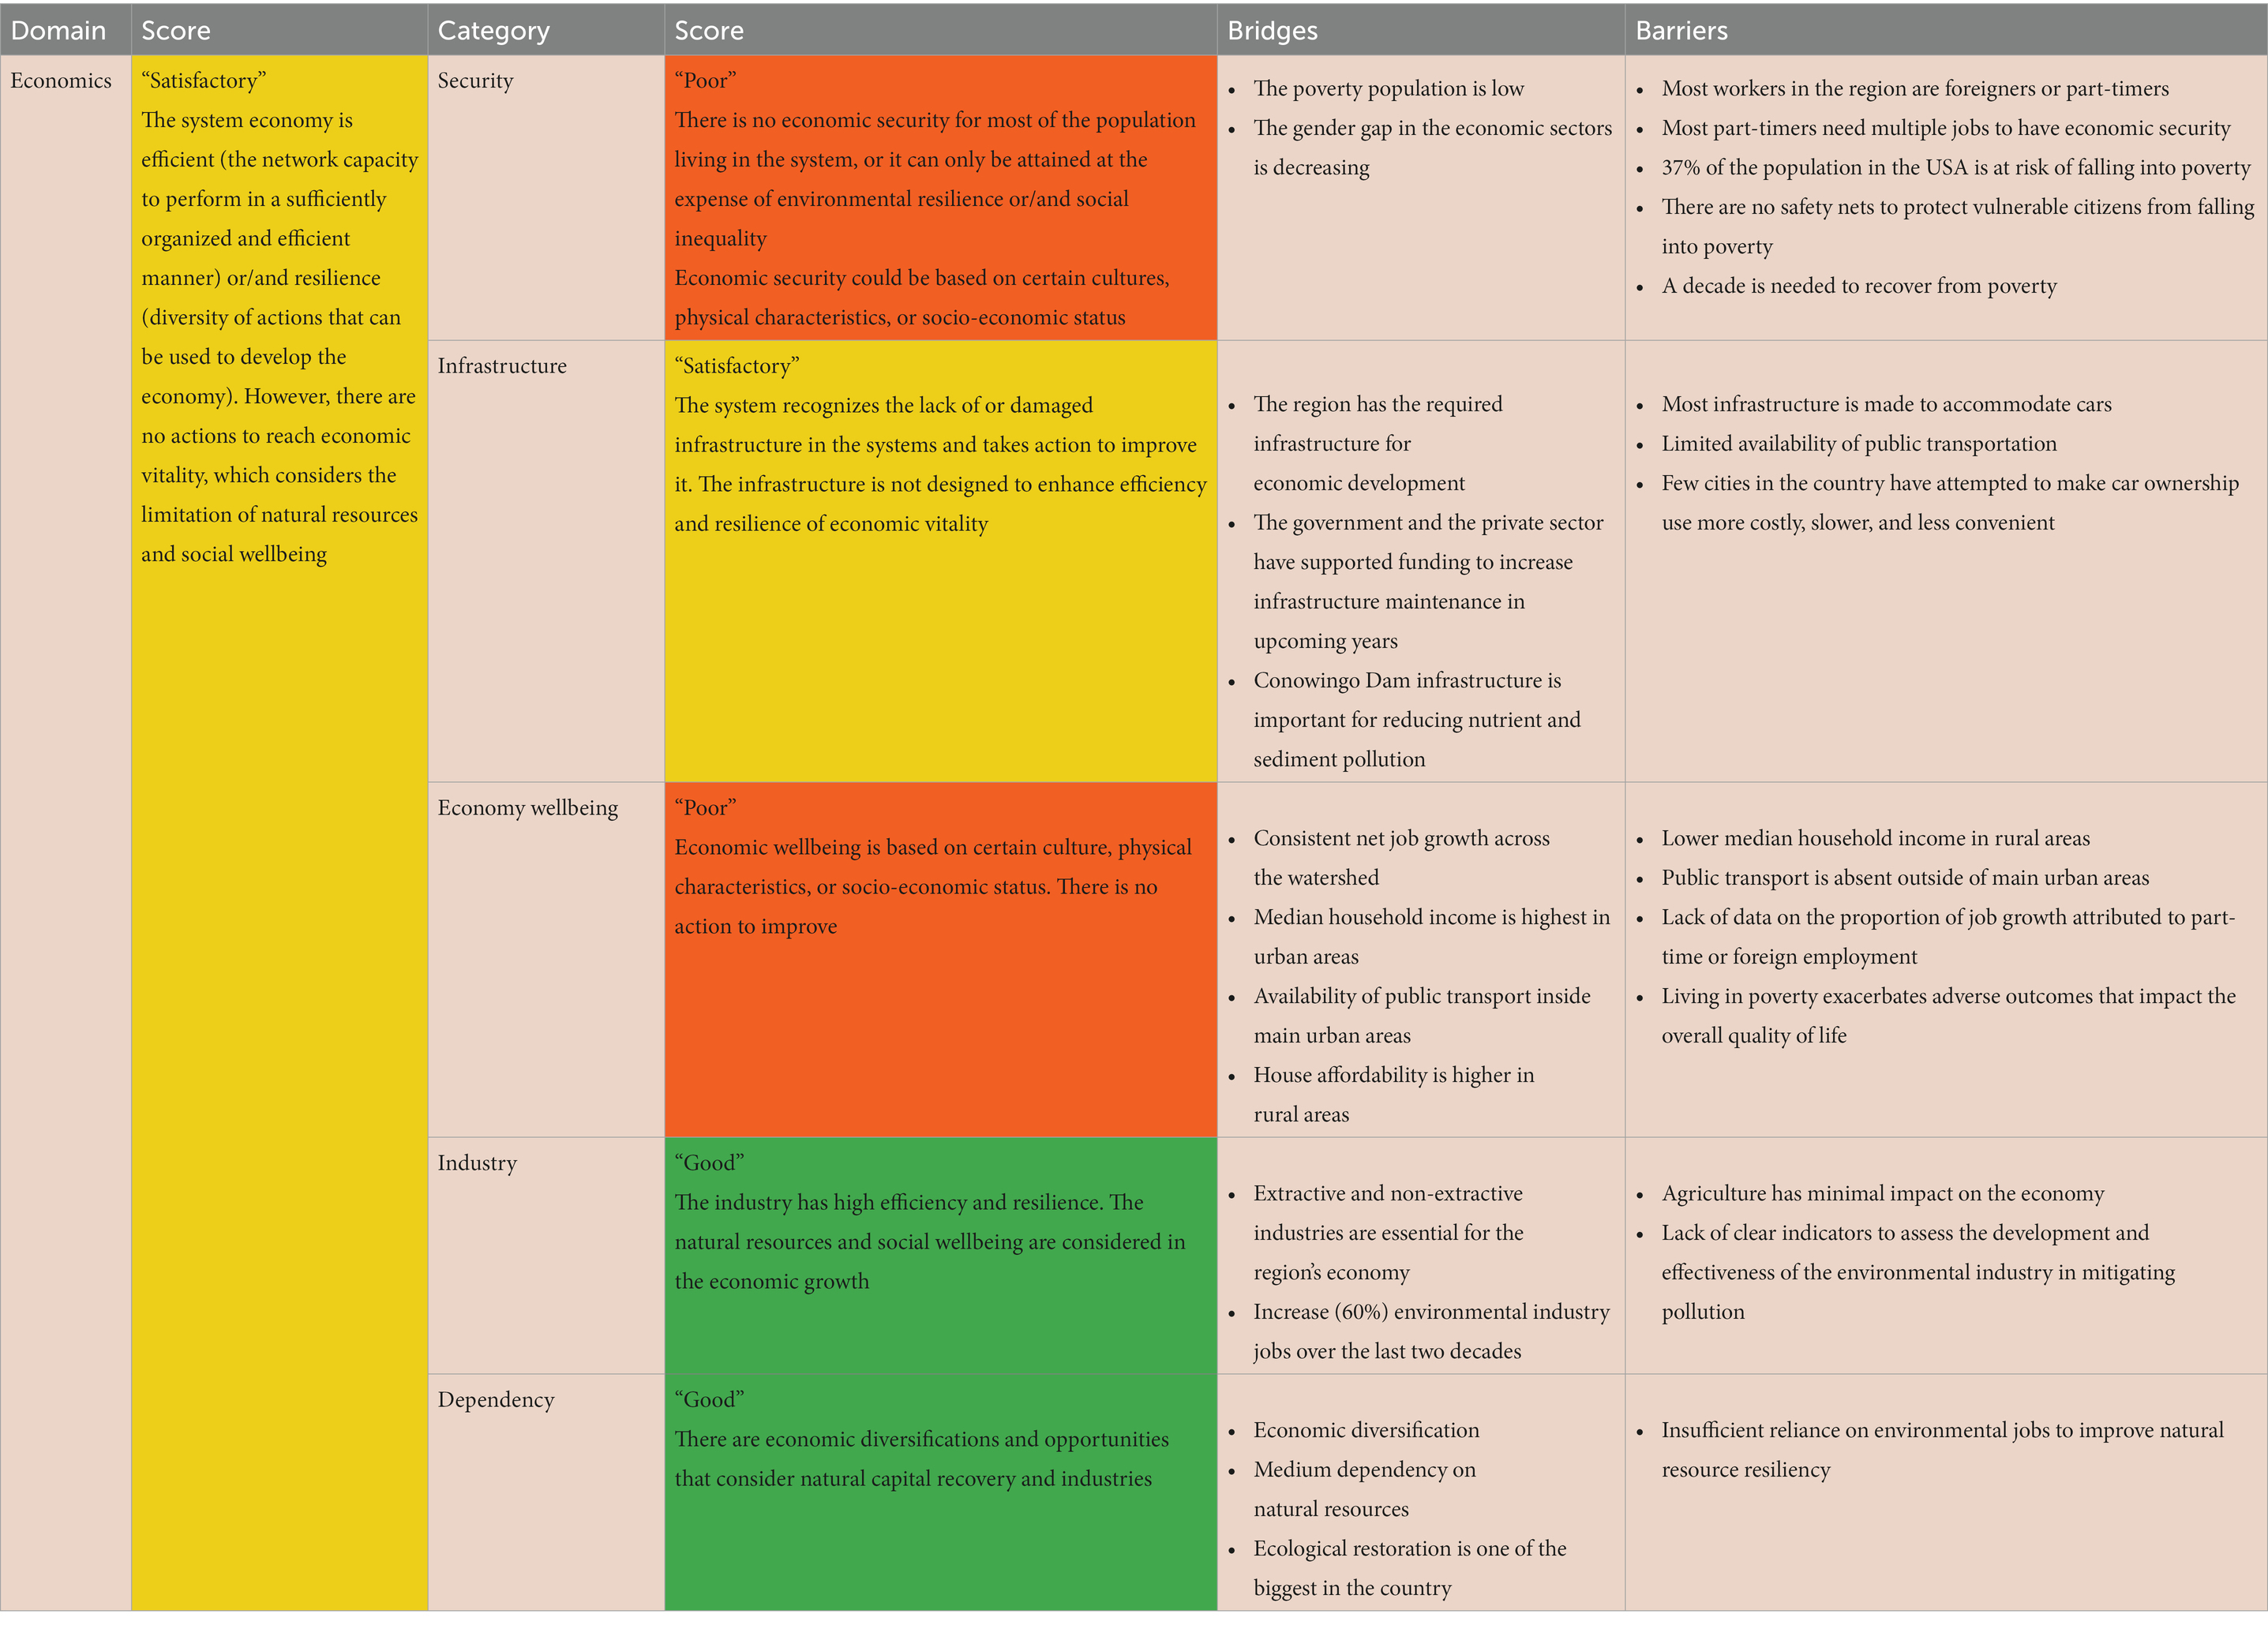
Table 7. Economics score with the bridges and barriers from each category.
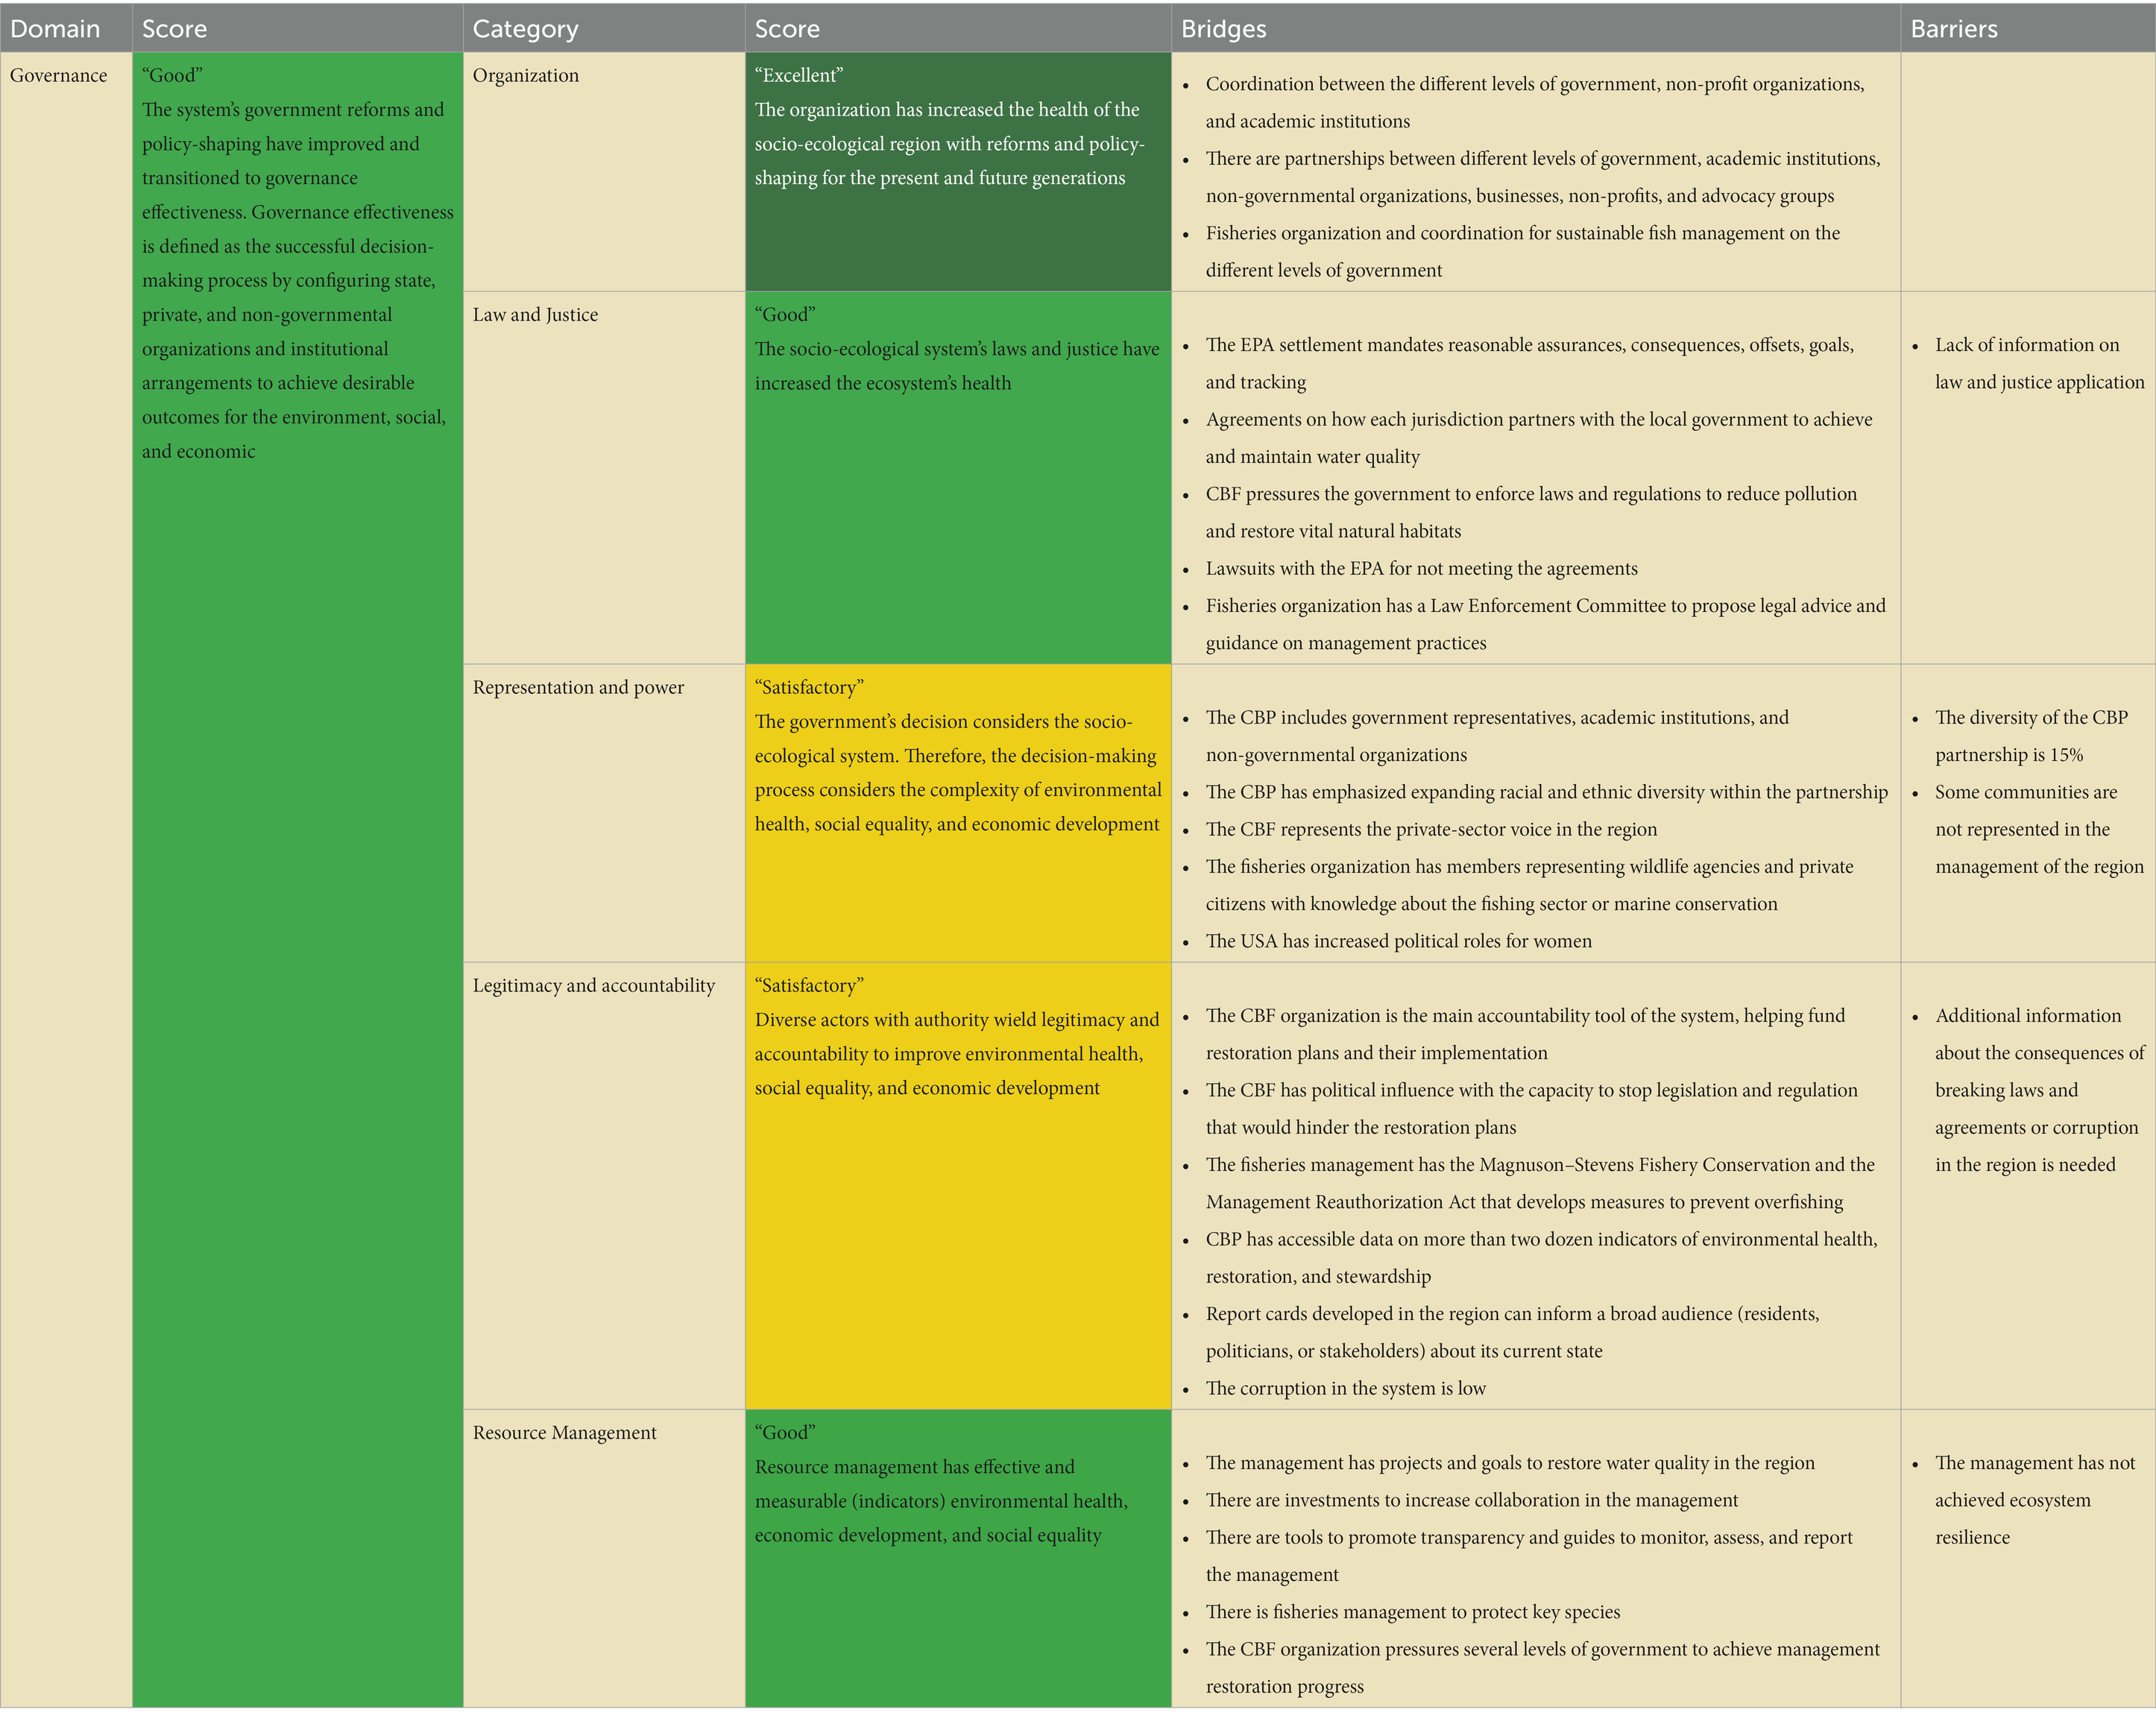
Table 8. Governance score with the bridges and barriers from each category.
The sustainability daisy of the Chesapeake Bay watershed using the Circles of Coastal Sustainability framework and proposed global evaluation is presented in Figure 3. This graphical representation summarizes the socio-ecological evaluation. The “Satisfactory” score is presented in the middle of the figure, which means the overall system has degradation problems with bridges and barriers to obtaining sustainable development. The following chapters of the results elaborate on each domain and category evaluation.
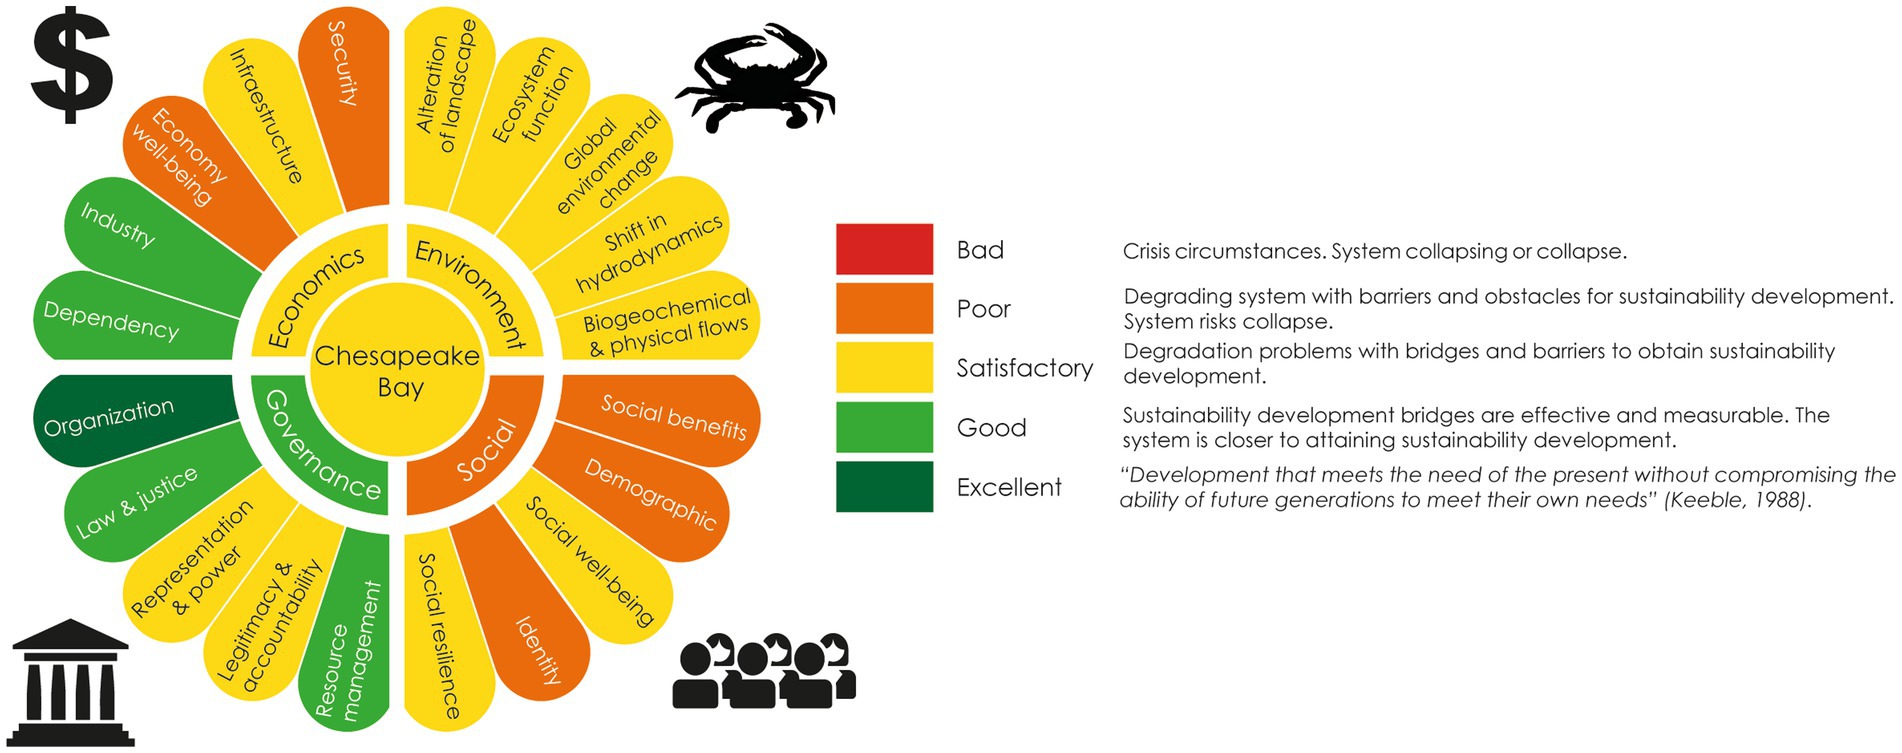
Figure 3. Chesapeake Bay watershed sustainability daisy.
3.1 Environmental
The environmental domain obtained a “Satisfactory” score because the system shows ecological degradation with a human society trying to maintain, restore, and improve it. All the categories obtain the same “Satisfactory” score (Table 5). The “Alteration of Landscape” score was based on increasing land protection, and there are management programs to improve the restoration of the shoreline ecosystems (CP-ProtectedLand, 2023). The main barrier is increased development around the tidal water and in major rivers and increasing armored shorelines around the Bay as a sea level rise (SLR) response (Goetz et al., 2004; Patrick et al., 2016).
The “Ecosystem functions” category score is based on the management projects to improve nutrient filtration, stabilization of shorelines and river edges, and sediment buffers through what the management calls “vital habitats” (CP-VitalHabitats, 2023). Some examples are oyster reefs, SAV restoration, wetland management, and forest buffers. There are also management responses to support animal and plant species (CP-AbundantLife, 2023). Some challenges include habitat degradation and disease of oysters, increased shoreline armoring, decreasing SAV ecosystems, and invasive species endangering endemic species (Jackson et al., 2001; Patrick et al., 2016; CP-InvasiveSpecies, 2023).
The “Global environmental change” score is based on the climate change projections in SLR, increase temperature, and precipitation. The changes in these variables could hinder current management efforts to preserve ecosystem resilience (Du et al., 2018). Nevertheless, there are climate change and coastal management adaptations, according to current information in the Maryland Coastal Adaptation Report Card 2021 (RC-CoastalAdaptation, 2023). The main barriers identified in the report are inadequate data, static goals, and lack of funding.
The “Shift in hydrodynamic” category score is based on climate change that increases extreme events and tidal amplitude (Zhong et al., 2008; Hong and Shen, 2012; Ross et al., 2017; Bigalbal et al., 2018). However, management efforts have developed computer models to predict these changes and develop management responses to decrease the impact of this event on the ecosystem’s resilience (Hood et al., 2021).
Finally, the “Biochemical and physical flows” category score is based on reducing nitrogen, phosphorus, and suspended sediments (Ator et al., 2020; Frankel et al., 2022; Zhang et al., 2023). The reduction has decreased hypoxia by 50–90 days (Frankel et al., 2022). The potential impact of climate change on the bay will be significantly smaller if the nutrient reductions continue improving (Irby et al., 2018). Therefore, more reductions are needed to accomplish ecosystem resilience and achieve a “Good” score. The main barrier is urban runoff due to the increase in land development in the last decade and the increase in future predictions (Goetz et al., 2004; Ator et al., 2020; Zhang et al., 2023).
3.2 Social
The social domain obtained the lowest score in the system. The “Poor” score was given because the social conditions bring environment destruction and increase inequity (Table 6). The same score for “Social benefits from ecosystem” is based on the degradation of natural resources, providing goods and services to the region’s society due to the state of decline of the environment (Phillips and McGee, 2016). Some examples are the fish advisory consumption due to mercury, nitrate levels in drinking water wells, and the cost of illness of vulnerable groups due to fine particle pollution in the air (Birch et al., 2011; Cuker, 2020; Willacker et al., 2020; IAN-EnvJus, 2023).
The “Demographic” category “Poor” score was given because there is no regulation on population growth considered necessary for the economic model (Ruark, 2010). Additionally, the distribution is primarily sprawling, with no development regulation to decrease environmental degradation (Goetz et al., 2004; Ator et al., 2020). Finally, the “Identity” category obtained the same score because residents feel more connected by the political boundaries than the ecological ones, with little community or individual action to improve the Bay’s environmental health (Ardoin, 2014; CP-Stewardship, 2023).
On the other hand, the “Satisfactory” score for “Social well-being” is based on the management efforts that have improved the public access for boating, swimming, and fishing; the walkability to a green area; and there is a proposal from the report cards to implement indicators to measure environmental justice in the region (ReportCard_CBW, 2020; CP-PublicAccess, 2023; IAN-EnvJus, 2023). Additionally, due to the TMDL, there is an increase in wastewater regulations (Tango and Batiuk, 2013), and homelessness has decreased on average on the study site from 2009 to 2019 (Batko et al., 2020). The main barrier is obesity mortality due to the high-calorie and low-nutrient food dominated by the Standard American Diet (SAD) (Cuker, 2020). The burden of an unhealthy diet falls mainly on low-income individuals in the region (Cuker, 2020). The added “Poor” score is a result of the evaluation of “Social well-being” indicators in the entire country. The “Satisfactory” score was left because the evaluation is on the region. In the context of the entire country, the main barriers are the current rise of mortality in the country due to a lack of communal support and obesity (Sterling and Platt, 2022). Communal support refers to prenatal care, maternal leave, preschool care, elementary and high school education, education beyond high school, and substantial time off for non-economic activities (Sterling and Platt, 2022). Additionally, a review of the healthcare system found that the system is not the main contributor to people’s health in the country, and the main contribution is more related to social determinants (Rice et al., 2013). More research about these regional barriers is necessary to assess its sustainability.
The “Satisfactory” was also given to “Social resilience” because more than half the population is prepared for a hazardous event and have the environment literacy needed to act responsibly to protect and restore their local watershed (ReportCard_CBW, 2020; CP-ELIT, 2023). The main barriers are the vulnerable communities related to neighborhoods with race-based housing discrimination, low-income communities, children, and the elderly (Rice et al., 2013; ReportCard_CBW, 2020).
3.3 Economic
The economic domain obtained a “Satisfactory” score. This score is based on the efficient and resilient economy of the system. However, there are barriers and obstacles to economic vitality, which considers the limitation of natural resources and social wellbeing (Table 7).
The “Security” category “Poor” score is based on the high proportion of foreign workers in the region working in agriculture and an increase of part-time workers of almost 30% in larger companies that want to avoid paying additional benefits (Cuker, 2020). The 13% of the population in the region is in poverty (McKendry, 2009; Cuker, 2020), and after losing 3 months’ salary, there is a 37% risk of falling into poverty in the country (OECD, 2020). There are no economic safety nets to protect the vulnerable from falling into poverty, and a decade is needed to recover (Worts et al., 2010). However, there are some bridges toward sustainability, such as a low-poverty population and a decrease in the gender gap in the economic sectors (McKendry, 2009; Cuker, 2020; WEF, 2020).
The category “Economy well-being” also obtained a “Poor” score. This score is attributed to the difference in urban and rural areas. Urban areas have higher median household incomes, while rural areas have greater house affordability (ReportCard_CBW, 2020). However, since there is no public transportation outside the main urban areas, transportation between the two regions relies on cars (Martin and Shaheen, 2011). This, in turn, increases expenses and has a negative impact on the environment (Martin and Shaheen, 2011; Zhang et al., 2023). On the other hand, while there has been a consistent net growth of jobs across the entire watershed (ReportCard_CBW, 2020), it is important to note that further information is required to determine the number of part-time positions or foreign workers within these employment opportunities.
The “Infrastructure” category “Satisfactory” score is based on the existence of the necessary infrastructure for an efficient and resilient economy, such as energy, roads, airports, and ports (Morgan and Owens, 2001; CBP-Highway, 2009; CB-Ports, 2023; eia-state, 2023). The barriers are the low availability of public transport (Garrett and Taylor, 1999; Buehler and Pucher, 2011, 2012) and limited maintenance of the existing infrastructure (ASCE, 2021). However, in recent years, the government and private sector have supported additional funding to increase infrastructure maintenance (ASCE, 2021).
Finally, the last categories obtain a “Good” score because there is a balance between economic efficiency and resilience, which, according to Table 2, considers the organization and diversity of the economy. The “Industry” category score is based on the extractive and non-extractive resources. Furthermore, in the last two decades, there has been a significant increase in environmental industry jobs, which is a positive development for the environmental resilience of the region (Phillips and McGee, 2016; CBF-Economy, 2023). The “Dependency” category is based on the diverse economic activities. The population does not depend only on coastal resources, although coastal resources are important to the economy (McKendry, 2009; Phillips and McGee, 2016; Maryland Port Administration, 2023; PortVirginia, 2023). To achieve economic vitality, the region could establish an economic foundation that depends on “green jobs” or “sustainable jobs.”
3.4 Governance
The governance domain obtained the highest score in the system. The “Good” reflects the local government, higher-level reforms, and policy-shaping projects that have improved the region’s environmental health. Enhancing the ecosystem’s health leads to improvements in both the economic and social domains. The governance domain has yet to achieve effectiveness in achieving environmental resilience (Table 8) despite substantial progress (Irby et al., 2018; Frankel et al., 2022; ReportCard_UMCES, 2023).
The “Excellent” score was given to the “Organization” category. The score acknowledges the coordination and partnerships between the federal government, state agencies, local governments, non-profit organizations, academic institutions, and others (USEPA, 2017; CBP-Who, 2023; MidAtlantic-Fisheries, 2023; MSA, 2023). The current organization works toward environmental restoration and has implemented various reforms and policies to accomplish its objectives through continuous research, implementation, and adaptation (CBP-Who, 2023).
The “Law and justice” score was “Good” because the Environmental Protection Agency (EPA) settlements require reasonable assurance, consequences, offset, goals, and tracking mechanisms of the socio-ecological system (EPA-CBW, 2010). There is also an agreement on how each jurisdiction partners with the local government to achieve and maintain water quality standards (CBP-Who, 2023). Currently, the Chesapeake Bay Foundation (CBF) serves as a non-profit organization that pressures the government to enforce laws and regulations by applying lawsuits against state governments that have not followed the agreements (CBF-Mission, 2023). Moreover, the Atlantic States Marine Fisheries Commission (ASMFC) has a law enforcement committee to guide the fisheries management plans and propose legal advice (ASMFC-Law, 2023).
The other category that scored “Good” was “Resource management.” The Chesapeake Bay is an example of an institutionalized effort to develop and apply marine ecosystem management (CBP-Who, 2023). Currently, there are Watershed Implementation Plans to meet the TMDL federal “pollution diet” goals (CBP-TMDL, 2023). The Chesapeake Bay Stewardship Fund supports networking and information sharing between partners (NFWF-CBWF, 2023; NFWF-INSR, 2023). There are accountability tools, such as the Chesapeake Decision tool, that explain how the outcomes will be accomplished (ChesapeakeDecisions, 2023); the University of Maryland Center for Environmental Science (UMCES) Chesapeake Bay Report Card, which helps stakeholders and the general public understand the state of the Bay by providing ecosystem, economic, and social indicators (ReportCard_UMCES, 2023); and the CBF, which as it was stated before is a non-governmental foundation that pressures several levels of the government to achieve the management restoration projects (CBF-History, 2023). On the other hand, fisheries management comprises two basic functions: conservation and allocation (CBF-Fisheries, 2023). The accountability measures include size limits, seasonal closures, trip limits, and gear restrictions (NOAA-Fisheries, 2023).
The last two categories scored as “Satisfactory.” The “Representation and power” score was based on the system’s management, which has government representatives, academic institutions, non-governmental organizations, fish and wildlife agencies, and private citizens (CBP-Partners, 2023). Additionally, the political roles of women have increased in recent years (WEF, 2020, 2021). The main barrier is the lack of representation of people who identify as “non-white.” Currently, in the CBP, 15% of “non-white” races work in partnership, and 7.7% are in leadership positions. The CBP is working toward increasing diversity to represent the communities suffering the most from environmental injustice (CP-Diversity, 2023).
Finally, the “Legitimacy & accountability” category “Satisfactory” score was given because there are several sources of data, assessment, and institutions to hold the management of restoration projects accountable (CBF-Mission, 2023; ChesapeakeProgress, 2023; ReportCard_UMCES, 2023). The USA is the 25th least corrupt country in the world (CPI-USA, 2021), and the watershed has generally low corruption, with the Delaware state holding the highest corruption value (BestLife, 2022). The main barrier is the lack of accountability responses. There is no information about the consequences of breaking the law and policies within literature or official government web pages.
4 Discussion
4.1 The Chesapeake Bay watershed sustainability
The score for each domain provided new information about the Chesapeake Bay as a socio-ecological system. The indicators gave an idea of “real life” sustainability, which gives a deeper understanding of the current state using available scientific information or other reliable sources. The categories, domains, and overall system used this information to evaluate the global sustainability score proposed by this article (Figure 2 and Tables 2, 3). The main bridges and barriers to sustainability for each domain are presented in Tables 5–8.
It is important to consider that this global score’s main objective is to communicate the assessment at a more general level for various participatory stakeholders. Communication can become a bridge between scientists and stakeholders, which can help improve ecological and socio-economic wellbeing.
The evaluation was based on an extensive literature review of existing indicators, but the need for more measurable and verifiable indicators was apparent. Additionally, a quantitative threshold for each indicator category should be developed. The chosen indicators should be appropriate to evaluate the overall system, with a high spatial and temporal resolution, analysis methods, and holistic discussion. This kind of information requires high governmental, scientific, and local participation. This research can be the starting point for developing new information about the meaning of sustainability in the Chesapeake Bay watershed, as it starts the conversation about the indicators, thresholds, goals, barriers, and bridges needed to achieve it. By developing this research and implementing the management, the score system could increase to a “Good” score (Figure 2).
The overall “Satisfactory” score obtained with this framework is consistent with other literature and frameworks. For instance, the 2022 Chesapeake Bay and Watershed Report Card scored 51%, with an improving trend in some areas. Furthermore, according to recent literature (Ator et al., 2020; Frankel et al., 2022; Zhang et al., 2023), there are improvements in the water quality due to the management, with some barriers to becoming a restored ecosystem.
4.1.1 Environmental
The management barriers for the environment are presented in Table 5. Most barriers are related to changes in hydrodynamics due to climate change. Increasing evidence suggests that climate change, particularly global warming, makes the coastal ecosystem more vulnerable to the effects of nutrient enrichment, one of the main issues in the Chesapeake Bay (Kemp et al., 2005; Frankel et al., 2022). This causes the management plans for the ecosystem resilience of the region to lag or fail, resulting in a lack of improvement in biochemical and physical flows (Meals et al., 2010; Du et al., 2018; Frankel et al., 2022). This could discourage actors, such as stakeholders, from trusting, applying, or investing in management plans to increase ecosystem resilience (Meals et al., 2010; Boesch, 2019; Frankel et al., 2022; Zhang et al., 2023). Boesch (2019) discusses how important it is for stakeholders to understand that models and reality differ, the recovery of an ecosystem could take decades, and there are variables that cannot be predicted. Expressing the complexity of recovering an ecosystem is not meant to discourage or criticize the management of the Chesapeake Bay but to highlight the complex process that requires much effort and resources. Understanding this could make the stakeholder more inclined to protect the environment and the ecosystem services it provides. Nevertheless, some studies have shown that the current nutrient reduction management goals (TMDL) can potentially decrease the impact of climate change on the system (Irby et al., 2018; Frankel et al., 2022).
Given the complexity of global environmental change, it is crucial to focus on developing strategies manageable inside the region, such as obtaining adequate data, regularly updating goals, and securing additional funding for coastal adaptation. Furthermore, establishing bridges to enhance ecosystem resilience can mitigate some of the effects of climate change worldwide.
One of the leading polluters that can be managed in the watershed is uncontrolled urban and suburban development (Goetz et al., 2004; Ator et al., 2020; Zhang et al., 2023). There needs to be more accountability and developed limits for the housing growth in the watershed and shoreline. Additionally, more incentives are needed to restore, conserve, and improve the forest buffers, wetlands, and SAV at a more local management level. These vital habitats could stabilize the shoreline from the SLR and mitigate the input of nutrients from the increased precipitation (Davis et al., 2006; Leyva Ollivier et al., 2023). Finally, to enhance environmental resilience, it is crucial to have clear information about the quantity of these vital habitats. Currently, the vital habitats management projects are meeting the goals with little change in the system’s resilience. A clear threshold of area cover to buffer the current nutrients and sediments could be a helpful goal to increase management efforts.
Agriculture activities are another example of some barriers that can be managed in the region. The main nutrient and sediment input comes from a lack of regulation on agricultural activities. Since 2014, agriculturists have voluntarily implemented many Best Management Practices (BMPs), which are nutrient-reduction tools (Fox et al., 2021). More funding and incentives for BMPs could be applied to the system to improve water quality (Chadwick et al., 2011). According to Saacke Blunk et al. (2020), incentives can also be a bridge to build education for the best professional guidance for landowner conservation, farm and nutrient management, and water conservation.
4.1.2 Social
Table 6 presents the main barriers of this domain. The social benefits from the ecosystem, such as food and water, are degrading due to the increasing pollution of the watershed (Phillips and McGee, 2016). This has been addressed in the environmental section. Furthermore, the health of the Bay should be a main priority for the residents, who are the beneficiaries of the ecosystem services it offers. However, the main solution for residents is to move or build bigger houses outside the city (Goetz et al., 2004; CBP-Dev, 2023). Continued population growth makes this last action counter-productive because it only increases the pollution around the system with more infrastructure needed for urban or rural development. Therefore, one of the main barriers is the sprawling development around the watershed, which could be regulated.
Another consideration is the social wellbeing of the residents. According to Cuker (2020), the food system is built on making profits by focusing the standard American diet on animal-based food, refined carbohydrates, and a few fiber-rich fruits and vegetables. The result is a diet with low nutritional value and high caloric intake, which has health consequences. The same study identifies that the burden of unhealthy food falls mainly on low-income residents. Similarly, the healthcare system in the country is not the main contributor to people’s health (Rice et al., 2013). Rice et al. (2013) provide a review of the healthcare system in the USA and found that the “social determinants of health” include cultural and environmental factors, such as poverty, education, racial segregation, and others. The results indicate that social wellbeing could be mainly linked to socioeconomic status and race. However, more research in the region is needed to validate this information with more quantitative indicators.
There is also a lack of identity around the ecoregion. The few people who relate to the environment work professionally in the system (Ardoin, 2014). The people feel more connected by the political boundaries than the ecological ones due to the different government dependencies on the rural and urban development on the Bay (McKendry, 2009). Allen and Schlereth (1990) argue that the regional identity is strongly marked by an “us versus them” mentality by what is called the Eastern Sharemen’s regional consciousness due to the isolation and outrage at perceived outside interferences. Overall, the success and sustainability of the Chesapeake Bay restoration will ultimately depend on the actions and support of the region’s residents. Therefore, a sense of identity outside the political views is needed to form a bridge.
There are some management efforts in the system to increase social sustainability. The UMCES Chesapeake Bay Report Cards have developed social indicators, such as stewardship, vulnerability, and walkability (ReportCard_CBW, 2020). These indicators were added considering the impact human communities have on the environment and the environment on human communities (Laumann et al., 2019). The information provided by the Report Cards presents the opportunity to understand the link between the environment and social issues and to develop management actions that consider both. There are also proposals to develop environmental injustice indicators (IAN-EnvJus, 2023). This information can be helpful as a bridge to improve the residents’ social wellbeing by providing environmental justice regardless of socio-economic status or race.
Education and outreach to the region’s residents are some of the main bridges that require high attention. The knowledge of environmental justice, preparedness for hazards, urban sprawl issues, and ecosystem services to all the residents can increase the sense of responsibility for the ecosystem’s health. Awareness of the socio-ecological system dynamic can increase social resilience to hazard events and develop a sense of belonging, which is highly needed to improve ecosystem resilience.
4.1.3 Economic
The economy in the system is highly efficient and resilient, and although some sustainability barriers exist (Table 7), these barriers are more related to economic vitality (Goerner et al., 2009; Mensah, 2019).
Security and economic wellbeing need improvements with more equitable opportunities for different communities and socioeconomic status (McKendry, 2009; Worts et al., 2010; Cuker, 2020; OECD, 2020). To improve economic sustainability, the wellbeing and security of the workers should become a priority. Currently, the main economic activities in the region purposely hire foreign or part-time workers, mainly because it reduces expenses or avoids paying additional benefits (Cuker, 2020). Furthermore, 37% of the residents of the USA are at risk of falling into poverty, and 18% live in poverty (OECD, 2020). According to Worts et al. (2010), recovering after falling into poverty takes a decade due to the absence of social safety nets in the country. Implementing regulations around part-time jobs and foreign workers is the main bridge to overcome these barriers. Another improvement would be to increase social safety nets to protect vulnerable communities from poverty.
On the other hand, economic wellbeing and security are highly linked to individual transport, which puts individuals with no financial means or access to cars at an economic disadvantage. Moreover, the well-established reliance on private automobiles for urban and rural transportation creates a unique challenge to the region’s environmental resilience (Buehler and Pucher, 2011, 2012; Martin and Shaheen, 2011). Improving and increasing alternatives to public transport could become a bridge to decrease pollution from motor vehicles and improve equality in the security and economic wellbeing of the residents.
Finally, although the region’s economy is highly diverse and efficient, some barriers exist. The insufficient reliance on environmental jobs leads to a decline in natural resources, reducing the economy’s and environment’s resilience. The main bridge could be increasing environmental industry jobs to develop a more circular and local economy, which helps increase environmental resilience and thereby improve extractive natural resources (Morseletto, 2020). There can also be incentives to improve residents’ participation in the region’s sustainability management plans. Additionally, another proposed bridge is the development of clear indicators about the effectiveness of the environmental industry in maintaining, restoring, and improving the ecosystem.
4.1.4 Governance
Governance was attributed the highest score due to the high capacity of governmental organizations, management plans, and transdisciplinary collaboration (Table 8). These bridges have made the region’s management an example of ecosystem-based management by increasing the environmental resilience of the Bay in the last few years (Irby et al., 2018; Frankel et al., 2022; CBP-Who, 2023). The main barrier is the limited information in the literature about implementing accountability measures. Therefore, to enhance governance sustainability, the government needs to establish bridges that ensure the application of accountability measures. The consequences for polluters must be clear, and law enforcement must be robust to ensure accountability and decrease future environmental violations. Fines or subsidies could become this bridge by the principle of “polluter-pays” or by compensating those following the restoration plans.
The 2014 Agreement of the CBP contains a “Stewardship Outcome” to increase diversity (CP-Stewardship, 2023). The main objective is to increase the number of trained members of society from diverse backgrounds to enhance the ecosystem health of their local community. Similarly, this bridge could help identify bottom-up and community-led solutions that produce equitable, efficient, and effective outcomes (CBF-Sprawl, 2023). The project is relatively new; obtaining the expected results from this bridge may require more time.
4.2 Holistic management application of the Circles of Coastal Sustainability
Table 9 was developed considering the barriers obtained by the results and bridges proposed in each previous domain’s discussion. Upon examination of the table, it becomes apparent that bridges are repeated or sometimes adapted accordingly to the domain or category. These repeated bridges were used as a foundation for holistic management response proposals for the Chesapeake Bay watershed.
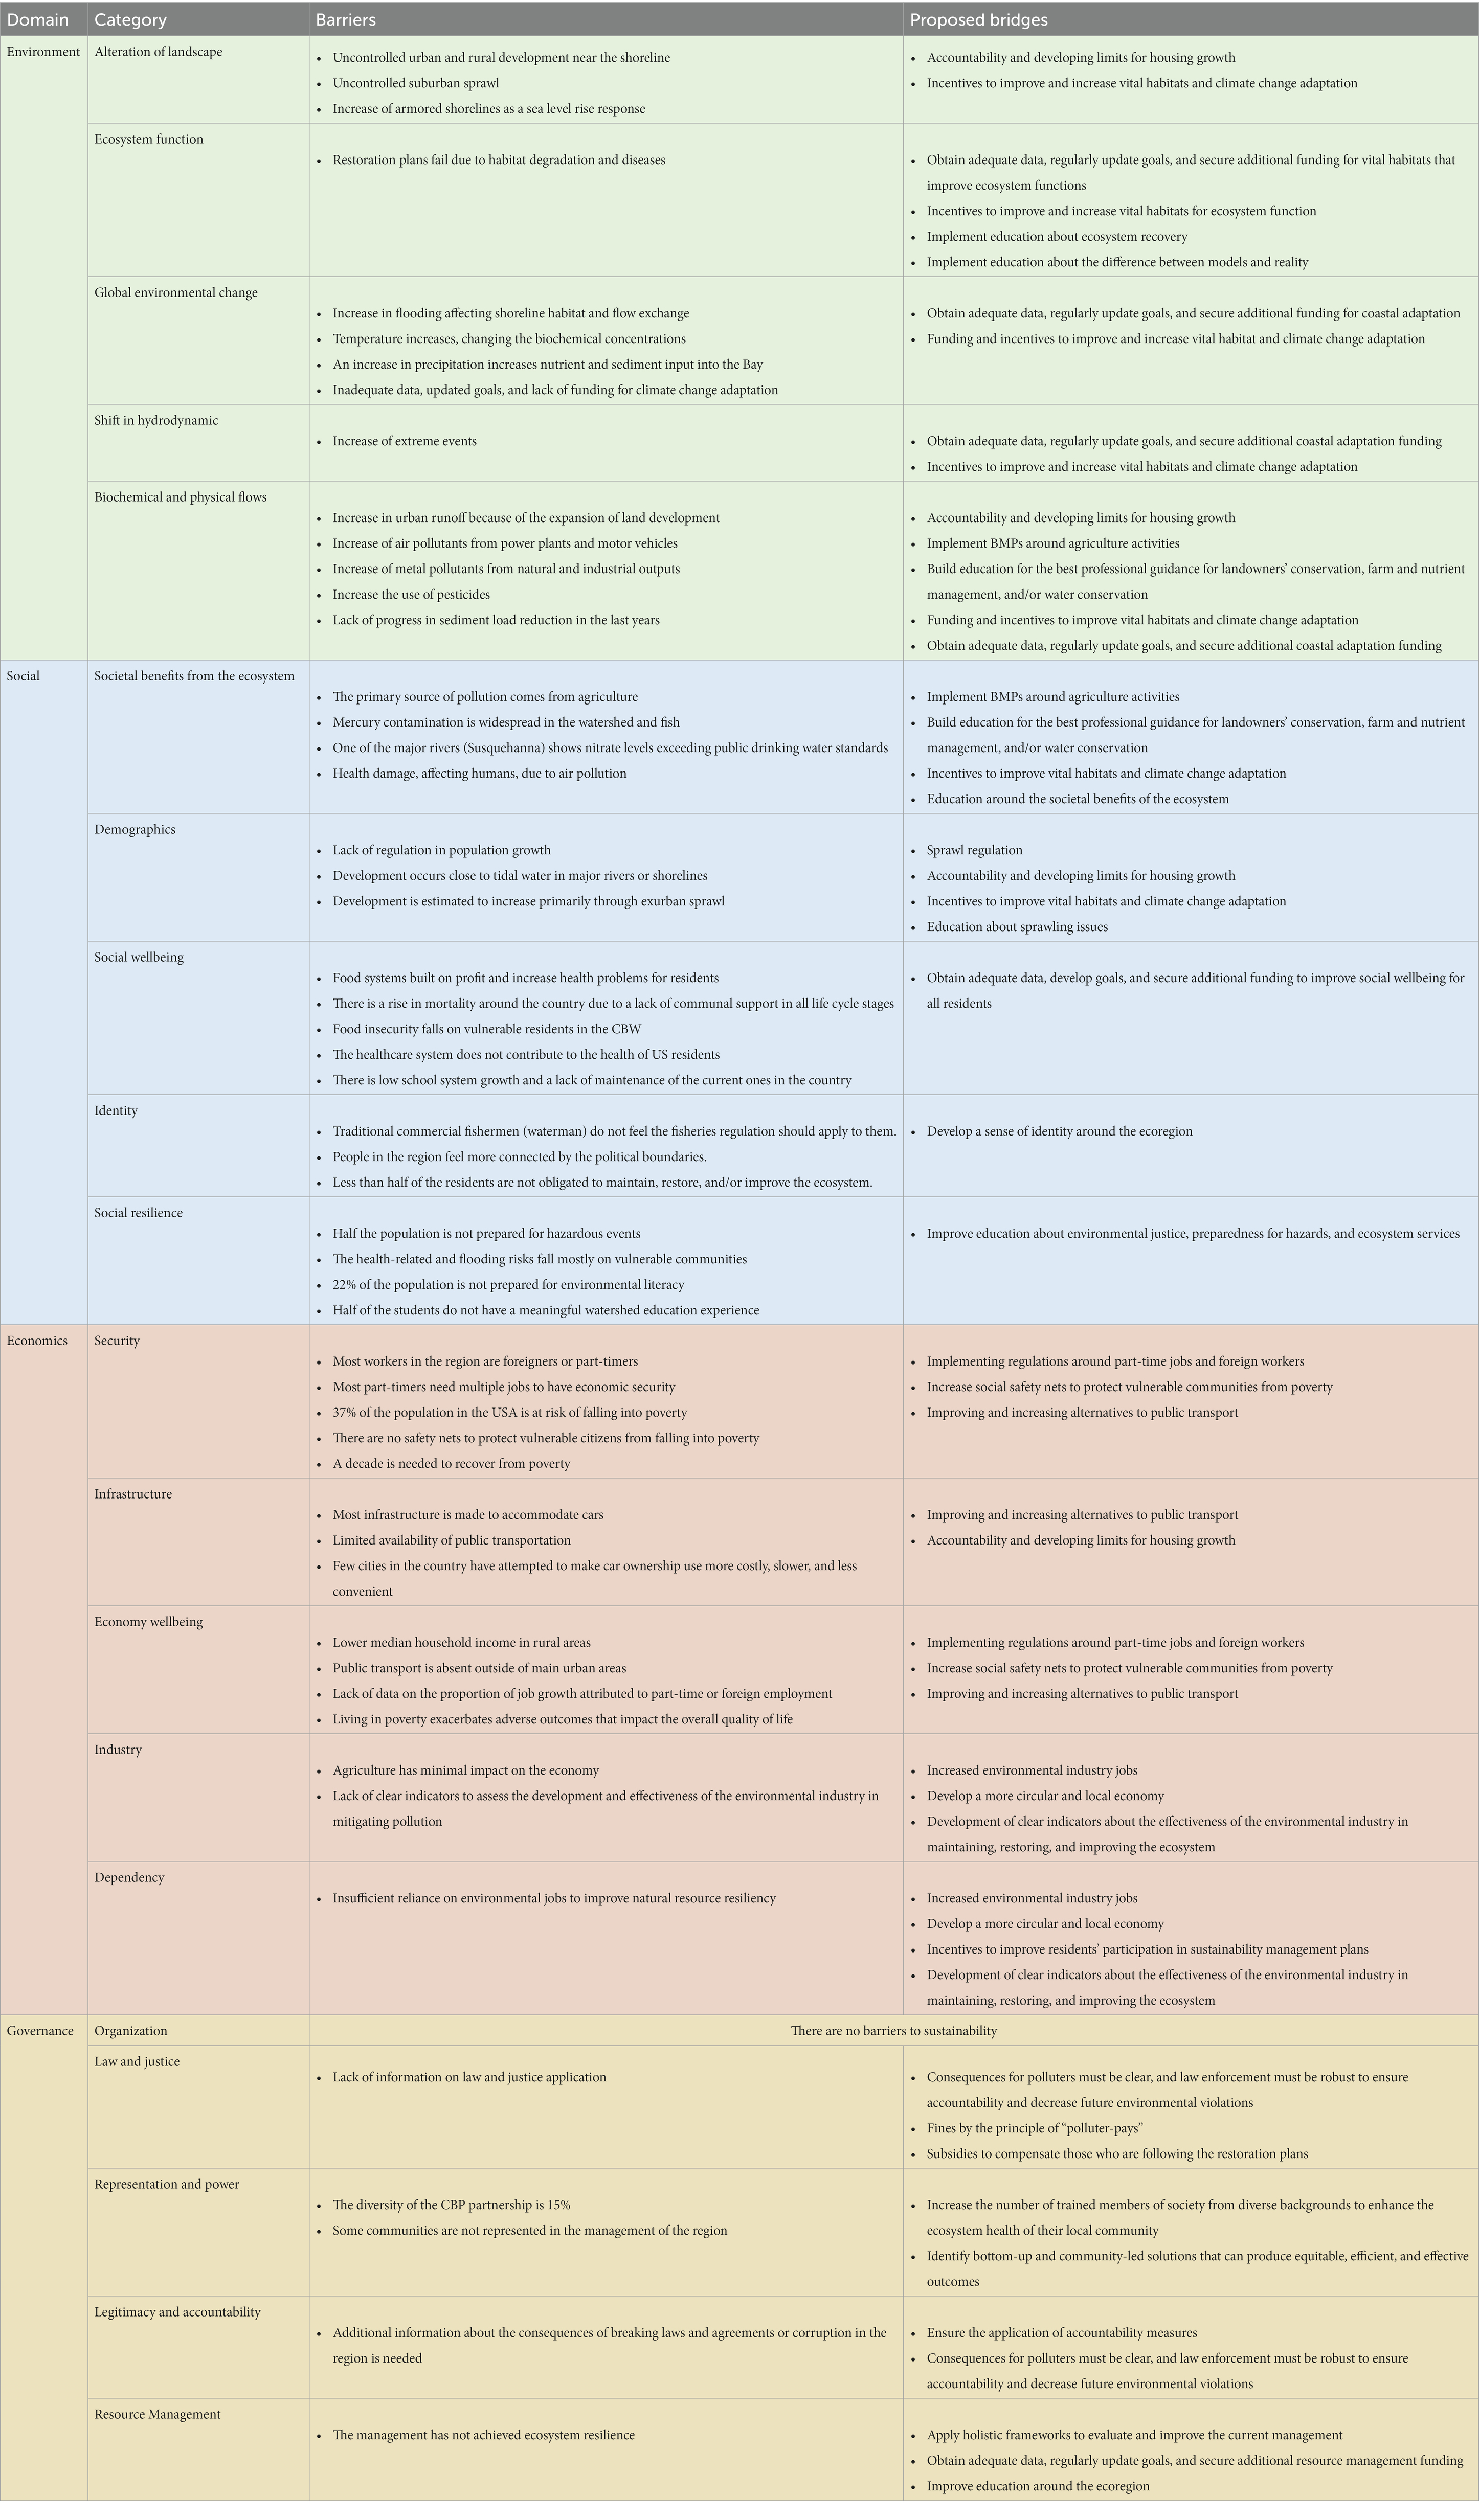
Table 9. Chesapeake Bay watershed barriers and proposed bridges.
One of the main repeated bridges is accountability and developing limits for housing growth. This bridge is considered because of the barriers in the urban and rural sprawl development, the growth close to tidal water in major rivers or shorelines, and the infrastructure made to accommodate cars for transportation. These barriers cause other problems, such as the high cost of infrastructure and social segregation (Bueno-Suárez and Coq-Huelva, 2020). A holistic response that considers these barriers is the concept of “compact city growth.” The compact city growth is defined as a high-density, mixed-use city with efficient public transport and dimensions that encourage walking and cycling (Bibri et al., 2020). This concept can regulate sprawl and the growth close to tidal waters. Additionally, in the region, where car ownership is crucial for the residents’ economic and social wellbeing (Buehler and Pucher, 2011, 2012; CBF-Sprawl, 2023), public transport development could become a bridge to decrease greenhouse gas emissions and reduce social exclusion from residents of different socioeconomic statuses (Kwan and Hashim, 2016; Saif et al., 2018). Some social benefits include reducing traffic injuries, noise, congestion, and physical inactivity (Kwan and Hashim, 2016).
Another repeated bridge is the funding and incentives to increase vital habitats and climate change adaptation. The proposed holistic management is the increase of natural spaces around the urban areas surrounding the Bay. The selection of natural spaces could serve as a climate change adaptation tool by using green infrastructure. Green infrastructure is defined as green spaces that promote recreation activities, preserve biodiversity, and help regulate and manage technical problems such as stormwater (Patra et al., 2021). In the Chesapeake Bay case, the green infrastructure could increase vital habitats that serve as nutrient and sediment buffers, mitigate SLR, and attenuate indoor temperatures and heat islands (Leyva Ollivier et al., 2023).
Accessibility to nature can also improve social wellbeing by improving aesthetic and environmental injustice (Wood et al., 2017; Nieuwenhuijsen, 2021). Moreover, it can potentially decrease suburban sprawl for residents looking for green areas, providing natural areas within the cities (Bueno-Suárez and Coq-Huelva, 2020). Rural populations could collaborate by using traditional knowledge from the ecosystem to implement green infrastructure in urban areas. This collaboration could help reconcile the cultural boundary, decreasing the “us versus them” mentality (Allen and Schlereth, 1990) and increasing the economic wellbeing of rural areas while improving ecosystem resilience. The increase in natural areas has the potential to develop a sense of identity around the ecoregion and improve education in vital habitats, as it is part of the daily life of urban citizens.
The repeated bridge of obtaining adequate data and regularly updating goals is highly related to the scientific community. However, as straightforward as this action is, to be considered a holistic management response, it must be taken further by sharing this information with various actors. The research, education, and outreach of this data and goals could increase the awareness of the current socio-ecological system conditions and the sense of responsibility. The education of the residents could be focused on sustainable development, ecosystem health, climate change adaptation, societal benefits from the ecosystem, issues with sprawling, environmental justice, preparedness for hazards, public transport advantages, and others. There could also be more focused education with specific stakeholders, such as agriculturists, stakeholders investing in management restoration plans, or teachers from various academic stages. The scientific community embraces a significant role in sustainability development as it develops the information needed to achieve and share this goal.
Finally, according to this framework, the Chesapeake Bay watershed socio-ecological region has the governance effectiveness to implement holistic projects to improve sustainability development. Nevertheless, some proposed bridges could improve the effectiveness of current and future governance. The repeated bridge is that the consequences for polluters must be clear, and law enforcement must be robust to ensure accountability and decrease future environmental violations. This article proposes using financial instruments as an incentive mechanism and an accountability tool to ensure the implementation of current and future restoration plans. Fines could be employed under the ‘polluter pays’ principle, while subsidies could be provided to compensate those who adhere to the management plans. The additional funds from the fines can be invested in the current conservation project on climate change adaptation, vital habitat conservation, sustainable fishing technologies, and the application of BMP for low-income farms.
On the other hand, subsidies could be used as incentives for diverse actors, such as agriculturists, fishers, or residents. Agriculturists could be rewarded for following the BMPs, and the fisheries could be rewarded for the conservation and allocation of key species or for using sustainable fishing technologies. Similarly, the residents could receive subsidies for water conservation, recycling, compost practices, stewardship, and others.
These subsidies could help increase community-based management (Ostrom, 1990) around the watershed, promoting social and economic wellbeing improvements. The social benefits of working directly with land management are a sense of belonging to the local community, improving general health, both physical and psychological, feeling safer in the local community, and utility skills (Moore et al., 2007). The subsidies could also have economic benefits, such as a social safety net for citizens who risk falling into poverty from losing a job. The government could temporarily employ full-time workers who have recently lost their jobs, allowing them to use their skills to improve the region’s environmental health while actively seeking permanent employment. Furthermore, part-time workers who seek economic security could participate in community management roles, simultaneously improving their economic and social capital while contributing to ecosystem resilience. Social capital is defined as the network, trust, and norms that facilitate community cooperation and cohesion (Moore et al., 2007).
4.3 Communication of science
The previous discussion about the scientific community outcome and education falls into the communications of science. The change in the graphic design for the framework was developed to communicate to a broad audience with different specialties. The UMCES Science Communicators who developed the design for the report cards also participated in the development of these new designs to communicate the framework better. According to Vargas-Nguyen (2020), the report cards have helped the residents, giving them the knowledge to improve and protect their communities, which is part of the intention of the design presented in this study. Therefore, the result is expected to enhance public awareness, understanding, literacy, and culture of the system and sustainability.
In Figure 2, daisy shapes and icons were selected because of their well-known shape around the world. The icons were used to attract stakeholders from the region with non-scientific backgrounds. According to Malamed (2009), the brain processes visual information first, as humans have an excellent capacity for picture memory. After the first viewing, our minds need to make sense of the images. Our brain scans our memory and uses what we already understand to interpret and infer meaning from the unknown. The understanding derives pleasure, satisfaction, and competence, increasing our desire for further understanding (Malamed, 2009). This design serves as a tool to capture the interest of several actors to engage and motivate them to understand its content more, thereby prompting more attention toward the accompanying explanation.
4.3.1 Propose global sustainability score
The scoring system for this article (Figure 2 and Tables 2, 3) was developed considering the same goal as the sustainability daisy: clear communication. The “Excellent” score aligns with the definition of sustainable development. The “Good” score is a system with the necessary bridges, such as tools and information, to achieve sustainability. Therefore, this communicates that there is effective management and that the categories with these scores do not require immediate action. The “Satisfactory” score conveys the bridges and barriers for effective management toward sustainable development. Meanwhile, the score “Poor” conveys mostly the obstacles and barriers. These scores increase knowledge and awareness of the barriers to sustainable development. This increases the urgency of management actions. Finally, the “Bad” score was given to the system in a crisis. The lowest score was considered because sustainability development cannot be attained without a sustainability pillar: environment, social, economic, or government. The sustainability daisy can also represent insufficient data for assessing sustainability. In Figure 2, the presence of gray is noticeable; this color is assigned when there is insufficient data to assess a particular category or domain.
Gallo-Vélez et al. (2023) used a more quantitative score system with the goal of communicating the urgency for effective management actions. However, this scoring system may create expectations that reaching these values guarantees success, presenting a potential challenge to oversimplifying the system’s barriers toward sustainable development (Boesch, 2019). What happens if the goal is reached with little progress toward sustainability? How does a change in the quantity of one indicator affect the others? Additionally, what if these goals do not consider the dynamic of diverse socio-ecological systems? These goals could potentially become static, hindering adaptive and management responses toward sustainable development.
The proposed global score system approach aims to communicate the meaning of sustainability in a more generalized manner. Then, when the main message is communicated, the barriers and bridges based on scientific methods can be taught to give policy decision-makers more specialized information. These bridges and barriers must be discussed by specialists in the different domains. Similarly, transdisciplinary participation and collaboration are required. Therefore, the proposed global score system could become a guide toward adaptive management for sustainable development within diverse coastal ecosystems.
There are some challenges to this global score system approach. The diversity of ecosystems, societies, economies, and governments makes this assessment highly general, which could cause misunderstanding compared to other systems that obtain a better score. Some policy decision-makers could misunderstand that applying identical management strategies in different regions guarantees success. Therefore, understanding the differences in socio-ecological systems and developing reliable scientific information from each region are crucial.
Appropriate management responses are urgently needed to improve sustainable development on a global scale. The framework opens the communication between diverse actors about the current indicator’s threshold and the importance of transdisciplinary collaboration. Nevertheless, it is essential to clarify that this scoring system is still in development.
5 Conclusion
The sustainability of the Chesapeake Bay watershed socio-ecological system was assessed with a “Satisfactory” score. This score was given because the region has degradation problems with bridges and barriers to obtaining sustainability development. The score system on the Circles of Sustainability Framework is still in development. However, the results convey a general idea of the current status of the region.
The results of the domain, categories, and indicators assessment gave a general foundation of the management necessities. Overall, the Chesapeake Bay Program has environmental projects around the system to improve the health of the Bay. These projects have increased and protected the environmental resilience of the ecosystem. Similarly, this article proposes additional bridges, which were summarized in holistic management proposals. This proposal includes the concept of compact city growth; increased natural areas using green infrastructure; high involvement of scientists with research, education, and outreach on the socio-ecological system; and financial instruments as an incentive mechanism and an accountability tool to ensure the implementation of the restoration plans.
Specialists from each domain should discuss the results of the assessment together. The indicators were taken from different sources, so the assessment can be subject to bias if analyzed according to an individual discipline and availability of information within a timeframe. Therefore, transdisciplinary participation and collaboration are required, which is one of the framework’s objectives. The framework is a tool to communicate the current sustainability development, provide a holistic system view, and find knowledge gaps in the research of a system. The framework and assessment can be complemented, adapted, refined, and improved with each application as part of an adaptive management iterative cycle.
Data availability statement
The datasets presented in this study can be found in online repositories. The names of the repository/repositories and accession number(s) can be found in the article/supplementary material.
Author contributions
ML: Data curation, Formal analysis, Investigation, Methodology, Visualization, Writing – original draft, Writing – review & editing. AN: Conceptualization, Data curation, Formal analysis, Investigation, Methodology, Supervision, Writing – review & editing. HK: Conceptualization, Data curation, Investigation, Methodology, Supervision, Validation, Visualization, Writing – review & editing.
Funding
The author(s) declare financial support was received for the research, authorship, and/or publication of this article. This research was supported by the Murray Foundation and the ERASMUS+ program of the European Commission, Erasmus Mundus Joint Master Degree in Water and Coastal Management (WACOMA) 2020/2022 (WACOMA; Project No. 586596-EPP-1-2017-1-IT-EPPKA1-JMD-MOB). The authors acknowledge the funding provided by FCT to the projects LA/P/0069/2020, awarded to the Associate Laboratory ARNET, and UID/00350/2020, awarded to CIMA of the University of the Algarve https://doi.org/10.54499/UIDP/00350/2020.
Acknowledgments
The lead author thanks ARNET - CIMA of the Universidade do Algarve and the University of Maryland Center for Environmental Science. Alice Newton and Heath Kelsey acknowledge Future Earth Coasts. Alice Newton acknowledges IMBeR, the Ocean KAN. Thank you to John D. Icely for revising the proofs.
Conflict of interest
ML was employed by Murray Foundation, c/o Brabners LLP.
The remaining authors declare that the research was conducted in the absence of any commercial or financial relationships that could be construed as a potential conflict of interest.
Publisher’s note
All claims expressed in this article are solely those of the authors and do not necessarily represent those of their affiliated organizations, or those of the publisher, the editors and the reviewers. Any product that may be evaluated in this article, or claim that may be made by its manufacturer, is not guaranteed or endorsed by the publisher.
Footnotes
References
Adger, W. N., Brown, K., Fairbrass, J., Jordan, A., Paavola, J., Rosendo, S., et al. (2003). Governance for sustainability: towards a ‘thick’ analysis of environmental Decisionmaking. Environ. Plan. A Econ. Space 35, 1095–1110. doi: 10.1068/a35289
Allen, B., and Schlereth, T. J. (Eds.) (1990). Sense of place: American regional cultures Lexington: The University Press of Kentucky.
Allison, S. K., and Murphy, S. D. (2017). Routledge handbook of ecological and environmental restoration. London and New York: Routledge, Taylor and Francis Group.
Amberg, P. (2010). Where angels fear to tread: a nonlibrarian’s view of the sustainability of rural libraries. Australasian Public Libraries and Information Services. 23, 28–32.
Anand, S., and Sen, A. (2000). Human development and economic sustainability. World Dev. 28, 2029–2049. doi: 10.1016/S0305-750X(00)00071-1
Ardoin, N. M. (2014). Exploring sense of place and environmental behavior at an Ecoregional scale in three sites. Hum. Ecol. 42, 425–441. doi: 10.1007/s10745-014-9652-x
Arnold, R. R., Dennison, W. C., Etgen, L. A., Goodwin, P., Paolisso, M. J., Shenk, G., et al. (2021). “Chesapeake Bay - A case study in resiliency and restoration”, in Hydrolink 2021/1 Madrid: International Association for Hydro-Environment Engineering and Research (IAHR). S. 25–28. Available at: https://www.iahr.org/library/info?pid=9095
ASCE. (2021). A comprehensive assessment of AMERICA’S infrastructure. Available at: https://infrastructurereportcard.org/wp-content/uploads/2020/12/National_IRC_2021-report.pdf.
ASMFC-Law. (2023). Law enforcement committee—Atlantic states marine fisheries commission. Available at: http://www.asmfc.org/law-enforcement/the-law-enforcement-committee.
Assari, S. (2018). Life expectancy gain due to employment status depends on race, gender, education, and their intersections. J. Racial Ethn. Health Disparities 5, 375–386. doi: 10.1007/s40615-017-0381-x
Ator, S. W., Blomquist, J. D., Webber, J. S., and Chanat, J. G. (2020). Factors driving nutrient trends in streams of the Chesapeake Bay watershed. J. Environ. Qual. 49, 812–834. doi: 10.1002/jeq2.20101
Batko, S., Oneto, A. D., and Shroyer, A. (2020). Unsheltered homelessness: trends, characteristics, and homeless histories. Available at: https://policycommons.net/artifacts/1425918/unsheltered-homelessness/2040282/.
Beatley, T., and Wheeler, S. M. (Eds.). (2014). The sustainable urban development reader London, UK: Routledge.
BestLife. (2022). Most corrupt states [Updated May 2023]. Available at: https://worldpopulationreview.com/state-rankings/most-corrupt-states.
Bibri, S. E., Krogstie, J., and Kärrholm, M. (2020). Compact city planning and development: emerging practices and strategies for achieving the goals of sustainability. Dev. Built Environ. 4:100021. doi: 10.1016/j.dibe.2020.100021
Bigalbal, A., Rezaie, A., Garzon, J., and Ferreira, C. (2018). Potential impacts of sea level rise and coarse scale marsh migration on storm surge hydrodynamics and waves on coastal protected areas in the Chesapeake Bay. J. Mar. Sci. Eng. 6:86. doi: 10.3390/jmse6030086
Bilkovic, D. M., Mitchell, M. M., Havens, K. J., and Hershner, C. H. (2019). Chapter 15—Chesapeake Bay. En C. Sheppard (Ed.), World seas: An environmental evaluation (2) (pp. 379–404). London: Academic Press.
Birch, M. B. L., Gramig, B. M., Moomaw, W. R., Doering, O. C., and Reeling, C. J. (2011). Why metrics matter: evaluating policy choices for reactive nitrogen in the Chesapeake Bay watershed. Environ. Sci. Technol. 45, 168–174. doi: 10.1021/es101472z
Birkeland, I. (2008). Cultural sustainability: industrialism, Placelessness and the re-animation of place. Ethics, Place Environ. 11, 283–297. doi: 10.1080/13668790802559692
Boesch, D. F. (2006). Scientific requirements for ecosystem-based management in the restoration of Chesapeake Bay and coastal Louisiana. Ecol. Eng. 26, 6–26. doi: 10.1016/j.ecoleng.2005.09.004
Boesch, D. F. (2019). Barriers and bridges in abating coastal eutrophication. Front. Mar. Sci. 6:123. doi: 10.3389/fmars.2019.00123
Boesch, D. F., Brinsfield, R. B., and Magnien, R. E. (2001). Chesapeake Bay eutrophication: scientific understanding, ecosystem restoration, and challenges for agriculture. J. Environ. Qual. 30, 303–320. doi: 10.2134/jeq2001.302303x
Borowy, I. (2013). Defining sustainable development for our common future: A history of the world commission on environment and development (Brundtland commission) London and New York: Routledge, Taylor & Francis. doi: 10.4324/9780203383797
Bosch, S. J., and Pearce, A. R. (2003). Sustainability in public facilities: analysis of guidance documents. J. Perform. Constr. Facil. 17, 9–18. doi: 10.1061/(ASCE)0887-3828(2003)17:1(9)
Buehler, R., and Pucher, J. (2011). Making public transport financially sustainable. Transp. Policy 18, 126–138. doi: 10.1016/j.tranpol.2010.07.002
Buehler, R., and Pucher, J. (2012). Demand for public transport in Germany and the USA: an analysis of rider characteristics. Transp. Rev. 32, 541–567. doi: 10.1080/01441647.2012.707695
Bueno-Suárez, C., and Coq-Huelva, D. (2020). Sustaining what is unsustainable: a review of urban sprawl and urban socio-environmental policies in North America and Western Europe. Sustain. For. 12:4445. doi: 10.3390/su12114445
Bureau, U. C. (2023). Population under age 18 declined last decade. Available at: https://www.census.gov/library/stories/2021/08/united-states-adult-population-grew-faster-than-nations-total-population-from-2010-to-2020.html.
CBF-Courtroom. (2023). Chesapeake 2000 EPA suit. Available at: https://www.cbf.org/about-cbf/our-mission/litigate/chesapeake-2000/index.html.
CBF-Economy. (2023). The economic importance of the bay. Available at: https://www.cbf.org/issues/what-we-have-to-lose/economic-importance-of-the-bay/index.html.
CBF-Fisheries. (2023). Fisheries. Available at: https://www.cbf.org/issues/fisheries/index.html.
CBF-History. (2023). Our history. Available at: https://www.cbf.org/about-cbf/history/index.html.
CBF-LandUse. (2023). Land cover in the Chesapeake Bay watershed. Available at: https://cbforg.maps.arcgis.com/apps/instant/sidebar/index.html?appid=64e8d00794134bcba298208137b02992.
CBF-Litigate. (2023). Available at: https://www.cbf.org/about-cbf/our-mission/litigate/.
CBF-Mission. (2023). Advocate. Available at: https://www.cbf.org/about-cbf/our-mission/advocate/index.html.
CBF-Sprawl. (2023). Sprawl—Chesapeake Bay foundation. Available at: https://www.cbf.org/issues/land-use/the-impact-of-sprawl.html.
CBP-Accomplishments (2023). Our accomplishments Chesapeake Bay Available at: https://www.chesapeakebay.net/what/accomplishments.
CBP-AirPollution (2023). Air pollution Chesapeake Bay Available at: https://www.chesapeakebay.net/issues/threats-to-the-bay/air-pollution.
CBP-Dev (2023). Development Chesapeake Bay Available at: https://www.chesapeakebay.net/issues/threats-to-the-bay/development.
CBP-Facts (2023). Bay Trivia Chesapeake Bay Available at: https://www.chesapeakebay.net/discover/bay-trivia.
CBP-GIT1 (2023). Sustainable fisheries goal implementation team (GIT 1) Chesapeake Bay Available at: https://www.chesapeakebay.net/who/group/sustainable-fisheries.
CBP-Highway (2009). Chesapeake Bay states push Congress for tighter highway runoff controls Chesapeake Bay Available at: https://www.chesapeakebay.net/news/blog/chesapeake-bay-states-push-congress-for-tighter-highway-runoff-controls.
CBP-Issues (2023). Learn the issues Chesapeake Bay Available at: https://www.chesapeakebay.net/issues.
CBP-LandCover. (2023). Land cover: Chesapeake Bay watershed. Chesapeake Bay. Available at: https://www.chesapeakebay.net/what/maps/land-cover-chesapeake-bay-watershed.
CBP-Modeling. (2023). Bay 101: Monitoring and modeling the Chesapeake Bay. Chesapeake Bay. Available at: https://www.chesapeakebay.net/discover/videos/bay-101-monitoring-and-modeling-the-chesapeake-bay.
CB-Ports. (2023). Ports – Chesapeake Bay news. Available at: https://www.chesapeake-bay.org/index.php/chesapeake-bay-information/ports/.
CBP-Partners (2023). Our Partners En Chesapeake Bay Available at: https://www.chesapeakebay.net/who/partners.
CBP-Pollution (2023). Stormwater runoff Chesapeake Bay Available at: https://www.chesapeakebay.net/issues/threats-to-the-bay/stormwater-runoff.
CBP-TMDL (2023). Chesapeake Bay TMDL Chesapeake Bay Available at: https://www.chesapeakebay.net/what/programs/total-maximum-daily-load.
CBP-Who (2023). Our history Chesapeake Bay Available at: https://www.chesapeakebay.net/who/bay-program-history.
CBP-WIP (2023). Watershed implementation plans Chesapeake Bay Available at: https://www.chesapeakebay.net/what/programs/watershed-implementation-plans.
Chadwick, D., Sommer, S., Thorman, R., Fangueiro, D., Cardenas, L., Amon, B., et al. (2011). Manure management: implications for greenhouse gas emissions. Anim. Feed Sci. Technol. 166-167, 514–531. doi: 10.1016/j.anifeedsci.2011.04.036
ChesapeakeDecisions (2023). ChesapeakeDecisions Chesapeake Bay Available at: https://www.chesapeakebay.net/what/what-guides-us/decisions.
ChesapeakeProgress. (2023). Chesapeake Progress. Available at: https://www.chesapeakeprogress.com/.
Compton, J. E., Harrison, J. A., Dennis, R. L., Greaver, T. L., Hill, B. H., Jordan, S. J., et al. (2011). Ecosystem services altered by human changes in the nitrogen cycle: a new perspective for US decision making: ecosystem services and nitrogen management. Ecol. Lett. 14, 804–815. doi: 10.1111/j.1461-0248.2011.01631.x
CP-AbundantLife (2023). Abundant Life Chesapeake Progress Available at: https://www.chesapeakeprogress.com/abundant-life.
CP-Climate Change (2023). Climate change Chesapeake Progress Available at: https://www.chesapeakeprogress.com/climate-change.
CP-Diversity (2023). Diversity Chesapeake Progress Available at: https://www.chesapeakeprogress.com/engaged-communities/diversity.
CP-ELIT (2023). Environmental literacy planning Chesapeake Progress Available at: https://www.chesapeakeprogress.com/engaged-communities/environmental-literacy-planning.
CP-Fish (2023). Fish habitat Chesapeake Progress Available at: https://www.chesapeakeprogress.com/abundant-life/fish-habitat.
CP-Forest (2023). Forest Buffers Chesapeake Progress Available at: https://www.chesapeakeprogress.com/abundant-life/forest-buffers.
CP-InvasiveSpecies (2023). Invasive species Chesapeake Bay Available at: https://www.chesapeakebay.net/issues/threats-to-the-bay/invasive-species.
CPI-USA (2021). 2020 Corruption perceptions index—Explore the results Transparency.Org Available at: https://www.transparency.org/en/cpi/2020.
CP-Oysters. (2023). Oysters—Chesapeake Progress. Available at: https://www.chesapeakeprogress.com/abundant-life/oysters.
CP-ProtectedLand (2023). Protected lands Chesapeake Progress Available at: https://www.chesapeakeprogress.com/conserved-lands/protected-lands.
CP-PublicAccess (2023). Public access site development Chesapeake Progress Available at: https://www.chesapeakeprogress.com/engaged-communities/public-access-site-development.
CP-SAV (2023). Submerged aquatic vegetation (SAV) Chesapeake Progress Available at: https://www.chesapeakeprogress.com/abundant-life/sav.
CP-Stewardship (2023). Stewardship Chesapeake Progress Available at: https://www.chesapeakeprogress.com/engaged-communities/stewardship.
CP-Student (2023). Student Chesapeake Progress Available at: https://www.chesapeakeprogress.com/engaged-communities/student.
CP-SustainableSchools (2023). Sustainable schools Chesapeake Progress Available at: https://www.chesapeakeprogress.com/engaged-communities/sustainable-schools.
CP-VitalHabitats (2023). Abundant Life Chesapeake Progress Available at: https://www.chesapeakeprogress.com/abundant-life.
CP-Wetlands (2023). Wetlands Chesapeake Progress Available at: https://www.chesapeakeprogress.com/abundant-life/wetlands.
CP-WIPs (2023). 2025 watershed implementation plans (WIPs) Chesapeake Progress Available at: https://www.chesapeakeprogress.com/clean-water/watershed-implementation-plans.
Cuker, B. E. (Ed.) (2020). Diet for a sustainable ecosystem: The science for recovering the health of the Chesapeake Bay and its people. Switzerland: Springer International. doi: 10.1007/978-3-030-45481-4
D’Elia, C. F., Bidjerano, M., and Wheeler, T. B. (2019). “Chapter 17 - Population growth, nutrient enrichment, and science-based policy in the chesapeake bay watershed,” Coasts and estuaries, Elsevier. 293–310. doi: 10.1016/B978-0-12-814003-1.00017-4
Davis, J. L., Takacs, R. L., and Schnabel, R. (2006). Evaluating ecological impacts of living shorelines and shoreline habitat elements: an example from the upper western Chesapeake Bay. CRC Publ. No. 08-164, 55–61.
De Alencar, P., Le Tissier, M. N. M., Paterson, S. K., and Newton, A. (2020). Circles of coastal sustainability: a framework for coastal management. Sustain. For. 12:4886. doi: 10.3390/su12124886
Delia, K. A., Haney, C. R., Dyer, J. L., and Paul, V. G. (2021). Spatial analysis of a Chesapeake Bay sub-watershed: how land use and precipitation patterns impact water quality in the James River. Water 13:1592. doi: 10.3390/w13111592
Du, J., and Shen, J. (2017). Transport of riverine material from multiple Rivers in the Chesapeake Bay: important control of estuarine circulation on the material distribution: material distribution in Chesapeake Bay. J. Geophys. Res. Biogeo. 122, 2998–3013. doi: 10.1002/2016JG003707
Du, J., Shen, J., Park, K., Wang, Y. P., and Yu, X. (2018). Worsened physical condition due to climate change contributes to the increasing hypoxia in Chesapeake Bay. Sci. Total Environ. 630, 707–717. doi: 10.1016/j.scitotenv.2018.02.265
eia-state. (2023). U.S. Energy Information Administration—EIA - independent statistics and analysis. Available at: https://www.eia.gov/state/?sid=US.
EPA-CBW. (2010). Chesapeake Bay compliance and enforcement strategy. Available at: https://www.federalregister.gov/documents/2010/05/11/2010-11143/executive-order-13508-chesapeake-bay-protection-and-restoration-section-203-final-coordinated.
Fox, R. J., Fisher, T. R., Gustafson, A. B., Koontz, E. L., Lepori-Bui, M., Kvalnes, K. L., et al. (2021). An evaluation of the Chesapeake Bay management strategy to improve water quality in small agricultural watersheds. J. Environ. Manag. 299:113478. doi: 10.1016/j.jenvman.2021.113478
Foy, G. (1990). Economic sustainability and the preservation of environmental assets. Environ. Manag. 14, 771–778. doi: 10.1007/BF02394171
Frankel, L. T., Friedrichs, M. A. M., St-Laurent, P., Bever, A. J., Lipcius, R. N., Bhatt, G., et al. (2022). Nitrogen reductions have decreased hypoxia in the Chesapeake Bay: evidence from empirical and numerical modeling. Sci. Total Environ. 814:152722. doi: 10.1016/j.scitotenv.2021.152722
Gallo-Vélez, D., Restrepo, J. C., and Newton, A. (2023). Assessment of the Magdalena River delta socio-ecological system through the circles of coastal sustainability framework. Front. Earth Sci. 11:1058122. doi: 10.3389/feart.2023.1058122
Garrett, M., and Taylor, B. (1999). Reconsidering social equity in public transit. Berkeley Plan. J. 13. doi: 10.5070/BP313113028
Garzon, J. L., Ferreira, C. M., and Padilla-Hernandez, R. (2018). Evaluation of weather forecast systems for storm surge modeling in the Chesapeake Bay. Ocean Dyn. 68, 91–107. doi: 10.1007/s10236-017-1120-x
George, B. (2019). Communicating environmental justice: a CASE study of water and fracking. Available at: https://theieca.org/sites/default/files/conference-papers/COCE%202019%20Vancouver/george_barbara-barbara_george.coce_.20192-1161857976.pdf.
Goerner, S. J., Lietaer, B., and Ulanowicz, R. E. (2009). Quantifying economic sustainability: implications for free-enterprise theory, policy and practice. Ecol. Econ. 69, 76–81. doi: 10.1016/j.ecolecon.2009.07.018
Goetz, S. J., Jantz, C. A., Prince, S. D., Smith, A. J., Varlyguin, D., and Wright, R. K. (2004). “Integrated analysis of ecosystem interactions with land use change: the Chesapeake Bay watershed” in Geophysical monograph series. eds. R. S. DeFries, G. P. Asner, and R. A. Houghton Washington, DC: Ecosystems and Land Use Change, American Geophysical Union. 263–275. doi: 10.1029/153GM20
Hardaway, C., and Byrne, R. J. (1999). Shoreline Management In Chesapeake Bay. Special Report in Applied Marine Science and Ocean Engineering No. 356. Virginia Sea Grant Publication no. VSG-99-11. Virginia Institute of Marine Science, William & Mary. doi: 10.21220/V5DB1X
Hardy, D., Lazrus, H., Mendez, M., Orlove, B., Rivera-Collazo, I., Timmons, J., et al. (2018). Social vulnerability: Social science perspectives on climate change, part. Washington, DC: USGCRP Social Science Coordinating Committee.
Hilborn, R., Walters, C. J., and Ludwig, D. (1995). Sustainable exploitation of renewable resources. Annu. Rev. Ecol. Syst. 26, 45–67. doi: 10.1146/annurev.es.26.110195.000401
Hirsch, R. M. (2012). Flux of nitrogen, phosphorus, and suspended sediment from the Susquehanna River basin to the Chesapeake Bay during tropical storm Lee, September 2011, as an indicator of the effects of reservoir sedimentation on water quality. U.S. Geological Survey scientific investigations report 2012–5185 :17.
Hong, B., and Shen, J. (2012). Responses of estuarine salinity and transport processes to potential future sea-level rise in the Chesapeake Bay. Estuar. Coast. Shelf Sci. 104-105, 33–45. doi: 10.1016/j.ecss.2012.03.014
Hood, R. R., Shenk, G. W., Dixon, R. L., Smith, S. M. C., Ball, W. P., Bash, J. O., et al. (2021). The Chesapeake Bay program modeling system: overview and recommendations for future development. Ecol. Model. 456:109635. doi: 10.1016/j.ecolmodel.2021.109635
IAN-EnvJus. (2023). Developing a framework for an environmental justice index in the Chesapeake Bay watershed. Available at: https://ian.umces.edu/site/assets/files/27035/developing-a-framework-for-an-environmental-justice-index-in-the-chesapeake-bay-watershed.pdf.
Irby, I. D., Friedrichs, M. A. M., Da, F., and Hinson, K. E. (2018). The competing impacts of climate change and nutrient reductions on dissolved oxygen in Chesapeake Bay. Biogeosciences 15, 2649–2668. doi: 10.5194/bg-15-2649-2018
Jackson, J. B. C., Kirby, M. X., Berger, W. H., Bjorndal, K. A., Botsford, L. W., Bourque, B. J., et al. (2001). Historical overfishing and the recent collapse of coastal ecosystems. Science 293, 629–637. doi: 10.1126/science.1059199
Kaufman, D. E., Shenk, G. W., Bhatt, G., Asplen, K. W., Devereux, O. H., Rigelman, J. R., et al. (2021). Supporting cost-effective watershed management strategies for Chesapeake Bay using a modeling and optimization framework. Environ. Model Softw. 144:105141. doi: 10.1016/j.envsoft.2021.105141
Keck, M., and Sakdapolrak, P. (2013). What is social resilience? Lessons Learned and Ways Forward. Erdkunde 67, 5–19. doi: 10.3112/erdkunde.2013.01.02
Keeble, B. R. (1988). The Brundtland report: ‘our common future’. Med. War 4, 17–25. doi: 10.1080/07488008808408783
Kemp, W., Boynton, W., Adolf, J., Boesch, D., Boicourt, W., Brush, G., et al. (2005). Eutrophication of Chesapeake Bay: historical trends and ecological interactions. Mar. Ecol. Prog. Ser. 303, 1–29. doi: 10.3354/meps303001
Kenney, M. A., and Gerst, M. D. (2021). Synthesis of indicators, datasets, and frameworks available to establish resilience and adaptation indicators: case study of Chesapeake Bay region, USA. Curr. Clim. Chang. Rep. 7, 35–44. doi: 10.1007/s40641-021-00170-6
Kong, L. (2009). Making sustainable creative/cultural space in Shanghai and Singapore*. Geogr. Rev. 99, 1–22. doi: 10.1111/j.1931-0846.2009.tb00415.x
Kuhlman, T., and Farrington, J. (2010). What is sustainability? Sustain. For. 2, 3436–3448. doi: 10.3390/su2113436
Kwan, S. C., and Hashim, J. H. (2016). A review on co-benefits of mass public transportation in climate change mitigation. Sustain. Cities Soc. 22, 11–18. doi: 10.1016/j.scs.2016.01.004
Laumann, K. M., Nastase, E. A., Vargas-Nguyen, V., Kelsey, R. H., Carew, A., Donovan, E. C., et al. (2019). Moving beyond the ecosystem in ecosystem health report cards. Environ. Pract. 21, 216–229. doi: 10.1080/14660466.2019.1689087
Leyva Ollivier, M. E., Newton, A., and Kelsey, H. (2023). Socio-ecological analysis of the eutrophication in Chesapeake Bay, USA. Front. Mar. Sci. 10:1237493. doi: 10.3389/fmars.2023.1237493
Lin, W., Sanford, L. P., and Suttles, S. E. (2002). Wave measurement and modeling in Chesapeake Bay. Cont. Shelf Res. 22, 2673–2686. doi: 10.1016/S0278-4343(02)00120-6
Malamed, C. (2009). Visual language for designers: Principles for creating graphics that people understand. Beverly, MA. Rockport Publishers.
Martin, E. W., and Shaheen, S. A. (2011). Greenhouse gas emission impacts of Carsharing in North America. IEEE Trans. Intell. Transp. Syst. 12, 1074–1086. doi: 10.1109/TITS.2011.2158539
Maryland Port Administration. (2023). Economic impacts generated by the port of Baltimore. Available at: https://mpa.maryland.gov/Documents/EconomicImpactReport2017SummaryMaryland.pdf
McKendry, J. E. (2009). A Socio-Economic Atlas for the Chesapeake Bay Watershed. Chesapeake Bay Program Report. Available at: https://www.chesapeakebay.net/what/publications/socioeconomic-atlas-for-the-chesapeake-bay-watershed1
McKenzie, S. (2004). Social Sustainability: Toward some definitions. Hawke Research Institute Working Paper Series No 27. South Australia: University of South Australia Magill.
McLaughlin, P., Alexander, R., Blomquist, J., Devereux, O., Noe, G., Smalling, K., et al. (2022). Power analysis for detecting the effects of best management practices on reducing nitrogen and phosphorus fluxes to the Chesapeake Bay watershed, USA. Ecol. Indic. 136:108713. doi: 10.1016/j.ecolind.2022.108713
McLeod, K., and Leslie, H. (Ed.) (2009). Ecosystem-based management for the oceans. Washington, DC.: Island Press.
Meals, D. W., Dressing, S. A., and Davenport, T. E. (2010). Lag time in water quality response to best management practices: a review. J. Environ. Qual. 39, 85–96. doi: 10.2134/jeq2009.0108
Mensah, J. (2019). Sustainable development: meaning, history, principles, pillars, and implications for human action: literature review. Cogent Social Sciences 5:1653531. doi: 10.1080/23311886.2019.1653531
MidAtlantic-Fisheries (2023). Mid-Atlantic U.S. Regional Fishery Management Councils Available at: https://www.fisherycouncils.org/mid-atlantic.
Miller Hesed, C. D., Van Dolah, E. R., and Paolisso, M. (2020). Engaging faith-based communities for rural coastal resilience: lessons from collaborative learning on the Chesapeake Bay. Clim. Chang. 159, 37–57. doi: 10.1007/s10584-019-02638-9
Modi, P. A., Fuka, D. R., and Easton, Z. M. (2021). Impacts of climate change on terrestrial hydrological components and crop water use in the Chesapeake Bay watershed. J. Hydrol. Reg. Stud. 35:100830. doi: 10.1016/j.ejrh.2021.100830
Montefalcone, M., Parravicini, V., and Bianchi, C. N. (2011). “Quantification of coastal ecosystem resilience” in Treatise on Estuarine and Coastal Science eds. E. Wolanski and D.S. McLusky (Waltham: Academic Press), 10, 49–70. doi: 10.1016/B978-0-12-374711-2.01003-2
Moore, M., Townsend, M., and Oldroyd, J. (2007). Linking human and ecosystem health: the benefits of community involvement in conservation groups. EcoHealth 3, 255–261. doi: 10.1007/s10393-006-0070-4
Morgan, C., and Owens, N. (2001). Benefits of water quality policies: the Chesapeake Bay. Ecol. Econ. 39, 271–284. doi: 10.1016/S0921-8009(01)00212-9
Morseletto, P. (2020). Targets for a circular economy. Resour. Conserv. Recycl. 153:104553. doi: 10.1016/j.resconrec.2019.104553
MSA (2023). Magnuson-Stevens act U. S. Regional Fishery Management Councils Available at: https://www.fisherycouncils.org/about-the-msa.
Muhamad, G. M., Heshmati, A., and Khayyat, N. T. (2021). How to reduce the degree of dependency on natural resources? Resour. Policy 72:102047. doi: 10.1016/j.resourpol.2021.102047
Muradian, R. (2001). Ecological thresholds: a survey. Ecol. Econ. 38, 7–24. doi: 10.1016/S0921-8009(01)00146-X
Najjar, R. G., Pyke, C. R., Adams, M. B., Breitburg, D., Hershner, C., Kemp, M., et al. (2010). Potential climate-change impacts on the Chesapeake Bay. Estuar. Coast. Shelf Sci. 86, 1–20. doi: 10.1016/j.ecss.2009.09.026
Neumann, B., Ott, K., and Kenchington, R. (2017). Strong sustainability in coastal areas: a conceptual interpretation of SDG 14. Sustain. Sci. 12, 1019–1035. doi: 10.1007/s11625-017-0472-y
NFWF-CBWF. (2023). Chesapeake Bay stewardship fund. NFWF. Available at: https://www.nfwf.org/programs/chesapeake-bay-stewardship-fund.
NFWF-INSR. (2023). Innovative nutrient and sediment reduction grants. Available at: https://d18lev1ok5leia.cloudfront.net/chesapeakebay/documents/insr-2022-rfp.pdf.
Nieuwenhuijsen, M. J. (2021). Green infrastructure and health. Annu. Rev. Public Health 42, 317–328. doi: 10.1146/annurev-publhealth-090419-102511
NOAA-Fisheries. (2023). Fisheries one stop shop (FOSS) | NOAA fisheries | landings. Available at: https://www.fisheries.noaa.gov/foss/f?p=215:200:13554629443014:Mail::::
OECD (2020). How’s life? 2020: measuring well-being OECD. Available at: https://www.oecd.org/wise/how-s-life-23089679.htm
Ojwang, L., Rosendo, S., Celliers, L., Obura, D., Muiti, A., Kamula, J., et al. (2017). Assessment of coastal governance for climate change adaptation in Kenya: local coastal governance in Kenya. Earth’s Future 5, 1119–1132. doi: 10.1002/2017EF000595
Olsen, S. B. (2003). Frameworks and indicators for assessing progress in integrated coastal management initiatives. Ocean Coast. Manag. 46, 347–361. doi: 10.1016/S0964-5691(03)00012-7
Orth, R. J., Dennison, W. C., Lefcheck, J. S., Gurbisz, C., Hannam, M., Keisman, J., et al. (2017). Submersed aquatic vegetation in Chesapeake Bay: sentinel species in a changing world. Bioscience 67, 698–712. doi: 10.1093/biosci/bix058
Orth, R. J., Williams, M. R., Marion, S. R., Wilcox, D. J., Carruthers, T. J. B., Moore, K. A., et al. (2010). Long-term trends in submersed aquatic vegetation (SAV) in Chesapeake Bay, USA, related to water quality. Estuar. Coasts 33, 1144–1163. doi: 10.1007/s12237-010-9311-4
Ostrom, E. (1990). Governing the commons: The evolution of institutions for collective action. New York: Cambridge University Press.
OysterAlliance. (2023). Homepage—Chesapeake oyster Alliance. Available at: http://www.chesapeakeoysteralliance.org/?_gl=1*hfh6r5*_ga*MzkxNTg4OC4xNjI4MjYyMTkz*_ga_LZKG7DYJLG*MTYzOTA1MTkxMy41MC4xLjE2MzkwNTI1NTkuMA..&_ga=2.195664876.1913275894.1638973736-3915888.1628262193.
Paolisso, M. (2002). Blue crabs and controversy on the Chesapeake Bay: a cultural model for understanding Watermen’s reasoning about blue crab management. Hum. Organ. 61, 226–239. doi: 10.17730/humo.61.3.2dc5c4gxap2f6nwv
Patra, D., Chanse, V., Rockler, A., Wilson, S., Montas, H., Shirmohammadi, A., et al. (2021). Towards attaining green sustainability goals of cities through social transitions: comparing stakeholders’ knowledge and perceptions between two Chesapeake Bay watersheds, USA. Sustain. Cities Soc. 75:103318. doi: 10.1016/j.scs.2021.103318
Patrick, C. J., Weller, D. E., and Ryder, M. (2016). The relationship between shoreline armoring and adjacent submerged aquatic vegetation in Chesapeake Bay and nearby Atlantic coastal bays. Estuar. Coasts 39, 158–170. doi: 10.1007/s12237-015-9970-2
Phillips, S., and McGee, B. (2016). Ecosystem service benefits of a cleaner Chesapeake Bay. Coast. Manag. 44, 241–258. doi: 10.1080/08920753.2016.1160205
PortVirginia (2023). Port of Virginia Hampton Roads Alliance Available at: https://hamptonroadsalliance.com/port-of-virginia/.
RC-CoastalAdaptation. (2023). Maryland Coastal Adaptation Report Card 2021. Available at: https://ian.umces.edu/site/assets/files/28119/2021-maryland-coastal-adaptation-report-card.pdf.
ReportCard_CBW. (2020). Chesapeake bay & watershed report cards. Available at: https://ecoreportcard.org/site/assets/files/2560/2021-chesapeake-bay-watershed-report-card.pdf.
ReportCard_UMCES (2023). Chesapeake Bay | EcoHealth report cards EcoReportCard Available at: https://ecoreportcard.org/report-cards/chesapeake-bay/.
Rice, T., Rosenau, P., Unruh, L. Y., Barnes, A. J., Saltman, R. B., and Van Ginneken, E.World Health Organization. (2013). United States of America: Health system review. Available at: https://apps.who.int/iris/handle/10665/330305.
Ross, A. C., Najjar, R. G., Li, M., Lee, S. B., Zhang, F., and Liu, W. (2017). Fingerprints of sea level rise on changing tides in the Chesapeake and Delaware bays. J. Geophys. Res. Oceans 122, 8102–8125. doi: 10.1002/2017JC012887
Ruark, E. A. (2010). Immigration, Population Growth and the Chesapeake Bay. Available at: https://www.fairus.org/issue/publications-resources/immigration-population-growth-and-chesapeake-bay.
Saacke Blunk, K., Evans, K. H., Herzog, J. M., Herman, J., Hershner, C., Bilkovic, D., et al. (2020). Farm resiliency education for at-risk coastal areas in the Chesapeake Bay. Reports. doi: 10.25773/51e5-kd36
Sachs, J., Kroll, C., Lafortune, G., Fuller, G., and Woelm, F. (2021). Sustainable development report 2021 Cambridge University Press Available at: https://s3.amazonaws.com/sustainabledevelopment.report/2021/2021-sustainable-development-report.pdf.
Saif, M. A., Zefreh, M. M., and Torok, A. (2018). Public transport accessibility: a literature review. Period. Polytech. Transp. Eng. 47, 36–43. doi: 10.3311/PPtr.12072
Selkoe, K. A., Blenckner, T., Caldwell, M. R., Crowder, L. B., Erickson, A. L., Essington, T. E., et al. (2015). Principles for managing marine ecosystems prone to tipping points. Ecosyst. Health Sustain. 1, 1–18. doi: 10.1890/EHS14-0024.1
Soini, K., and Birkeland, I. (2014). Exploring the scientific discourse on cultural sustainability. Geoforum 51, 213–223. doi: 10.1016/j.geoforum.2013.12.001
Steinzor, R. I., Verchick, R. R. M., Vidargas, N. W., and Huang, Y. (2012). Fairness in the Bay: Environmental justice and nutrient trading. U of Maryland Legal Studies Research Paper No. 2012-57. doi: 10.2139/ssrn.2139116
Sterling, P., and Platt, M. L. (2022). Why deaths of despair are increasing in the US and not other industrial nations—insights from neuroscience and anthropology. JAMA Psychiatry 79, 368–374. doi: 10.1001/jamapsychiatry.2021.4209
Stiftung, B. (2011). Sustainable governance indicators 2011. Gütersloh: Bertelsmann. Available at: https://api.pageplace.de/preview/DT0400.9783867933933_A18798354/preview-9783867933933_A18798354.pdf.
Tango, P. J., and Batiuk, R. A. (2013). Deriving Chesapeake Bay water quality standards. J. Am. Water Resour. Assoc. 49, 1007–1024. doi: 10.1111/jawr.12108
Testa, J. M., Clark, J. B., Dennison, W. C., Donovan, E. C., Fisher, A. W., Ni, W., et al. (2017). Ecological forecasting and the science of hypoxia in Chesapeake Bay. Bioscience 67, 614–626. doi: 10.1093/biosci/bix048
Triandis, H. C. (2001). Individualism-collectivism and personality. J. Pers. 69, 907–924. doi: 10.1111/1467-6494.696169
US EPA. (2013) Restoration of the Chesapeake Bay (Northeast, Delaware, District of Columbia, Maryland, New York, Pennsylvania, Virginia, West Virginia, Chesapeake Bay) [Collections and Lists]. Available at: https://www.epa.gov/restoration-chesapeake-bay.
USEPA. (2017). Ambient water quality criteria for dissolved oxygen, water clarity and chlorophyll-a for the Chesapeake Bay and its tidal tributaries: 2017 addendum. USEPA region III Chesapeake bay Program Office EPA 903-R-17-002, Annapolis, Maryland.
Vallance, S., Perkins, H. C., and Dixon, J. E. (2011). What is social sustainability? A clarification of concepts. Geoforum 42, 342–348. doi: 10.1016/j.geoforum.2011.01.002
Vargas-Nguyen, V. (2020). The role of socio-environmental report cards in transdisciplinary collaboration and adaptive governance for a sustainable future [Doctoral dissertation]. Doctoral dissertation, University of Maryland.
Walsh, P., Griffiths, C., Guignet, D., and Klemick, H. (2017). Modeling the property Price impact of water quality in 14 Chesapeake Bay counties. Ecol. Econ. 135, 103–113. doi: 10.1016/j.ecolecon.2016.12.014
Walsh, P., Griffiths, C., Guignet, D., and Klemick, H. (2019). Adaptation, sea level rise, and property prices in the Chesapeake Bay watershed. Land Econ. 95, 19–34. doi: 10.3368/le.95.1.19
Webster, S. E., Landry, J. B., Laumann, K. M., Swanson, S., and Dennison, W. C. (2021). Co-creating and evaluating a citizen science program for monitoring submerged aquatic vegetation in Chesapeake Bay. Reg. Stud. Mar. Sci. 46:101906. doi: 10.1016/j.rsma.2021.101906
WEF (2020). Global Gender Gap Report 2020 World Economic Forum Available at: https://www.weforum.org/reports/gender-gap-2020-report-100-years-pay-equality/.
WEF (2021). Global Gender Gap Report 2021 World Economic Forum Available at: https://www.weforum.org/reports/global-gender-gap-report-2021/.
Willacker, J. J., Eagles-Smith, C. A., and Blazer, V. S. (2020). Mercury bioaccumulation in freshwater fishes of the Chesapeake Bay watershed. Ecotoxicology 29, 459–484. doi: 10.1007/s10646-020-02193-5
Williams, M., Longstaff, B., Buchanan, C., Llansó, R., and Dennison, W. (2009). Development and evaluation of a spatially-explicit index of Chesapeake Bay health. Mar. Pollut. Bull. 59, 14–25. doi: 10.1016/j.marpolbul.2008.11.018
Williams, D. S., Rosendo, S., Sadasing, O., and Celliers, L. (2020). Identifying local governance capacity needs for implementing climate change adaptation in Mauritius. Clim. Pol. 20, 548–562. doi: 10.1080/14693062.2020.1745743
Willison, C. E. (2021). Ungoverned and out of sight: Public health and the political crisis of homelessness in the United States. New York: Oxford University Press.
Wood, L., Hooper, P., Foster, S., and Bull, F. (2017). Public green spaces and positive mental health – investigating the relationship between access, quantity and types of parks and mental wellbeing. Health Place 48, 63–71. doi: 10.1016/j.healthplace.2017.09.002
Worts, D., Sacker, A., and McDonough, P. (2010). Falling short of the promise: poverty vulnerability in the United States and Britain, 1993–2003. Am. J. Sociol. 116, 232–271. doi: 10.1086/653542
Zhang, Q., Blomquist, J. D., Fanelli, R. M., Keisman, J. L. D., Moyer, D. L., and Langland, M. J. (2023). Progress in reducing nutrient and sediment loads to Chesapeake Bay: three decades of monitoring data and implications for restoring complex ecosystems. WIREs Water 10:e1671. doi: 10.1002/wat2.1671
Keywords: Chesapeake Bay watershed, socio-ecological system, indicators, sustainability assessment, coastal management
Citation: Leyva Ollivier ME, Newton A and Kelsey H (2024) Assessment of the Chesapeake Bay watershed socio-ecological system through the Circles of Coastal Sustainability framework. Front. Water. 6:1269717. doi: 10.3389/frwa.2024.1269717
Edited by:
Roman Seidl, Leibniz University Hannover, GermanyReviewed by:
Qutu Jiang, The University of Hong Kong, Hong Kong SAR, ChinaPatrick Biber, University of Southern Mississippi, United States
Copyright © 2024 Leyva Ollivier, Newton and Kelsey. This is an open-access article distributed under the terms of the Creative Commons Attribution License (CC BY). The use, distribution or reproduction in other forums is permitted, provided the original author(s) and the copyright owner(s) are credited and that the original publication in this journal is cited, in accordance with accepted academic practice. No use, distribution or reproduction is permitted which does not comply with these terms.
*Correspondence: María Esther Leyva Ollivier, ZXN0aGVyb2xsaXZpZXI4N0BnbWFpbC5jb20=