 George Kimbowa
 Joel Buyinza
 John M. Gathenya3
- 1Department of Agricultural Mechanization and Irrigation Engineering, Faculty of Engineering and Technology, Busitema University, Busitema, Uganda
- 2Agroforestry Research Program, National Forestry Resources Research Institute (NaFORRI), National Agricultural Research Organization (NARO), Entebbe, Uganda
- 3Jomo Kenyatta University of Agriculture and Technology, Nairobi, Kenya
- 4World Agroforestry Centre (Kenya), Nairobi, Kenya
Participatory Rural Appraisal was used to compare stakeholder perceptions of spatial and temporal variation in tree cover and water availability using Uganda’s Mt. Elgon Water Tower as a case study. This study was guided by the research question: How do multi-level stakeholders’ perceptions of changes in tree-cover and water availability vary across spatial and temporal scales of the water tower? Five Participatory Rural Appraisal tools were applied to understand multi-level stakeholders’ perspectives on the changes in tree-cover and water availability. Data was collected from farmers’ focus group discussions, key experts from local government offices and structured household interviews with local communities. This study focused on the upper and lower zones of the water tower, which differ in terms of proximity to Mt. Elgon National Forest Park, household water-use, elevation, and tree-cover. Results showed that there are both similarities and differences in perceptions of changes in tree cover and water availability among stakeholders. Farmers and key experts perceived a decrease in water availability and a decrease in overall tree cover for the period 1990–2020. There are differences in stakeholders’ perceptions of water availability across the zones and sub-catchments. For instance, more farmers in Sipi River Sub-catchment perceived a decrease in water availability during 2006–2020 compared to 1990–2005 period. There were notable contradictions in farmers’ and key experts’ perceptions on tree cover. Farmers’ perceptions of 1990–2020 precipitation were in agreement with trends in existing precipitation data. Declining trends of natural tree cover especially outside the Mt. Elgon national forest park pose great threat to water resources originating from forests. Changes in tree cover and water availability in the study area can be partly explained by the tree species grown. Local stakeholders’ perceptions complemented the existing data gaps in explaining the changes in tree cover and water availability. Participatory Rural Appraisal tools are helpful for documenting the perceptions of local communities. However, this cannot replace reliable data resulting from large-scale efforts for monitoring changes and variations in tree-cover and water availability. The findings of this paper can be valuable to inform strategies for community involvement in sustainable agroforested landscape management.
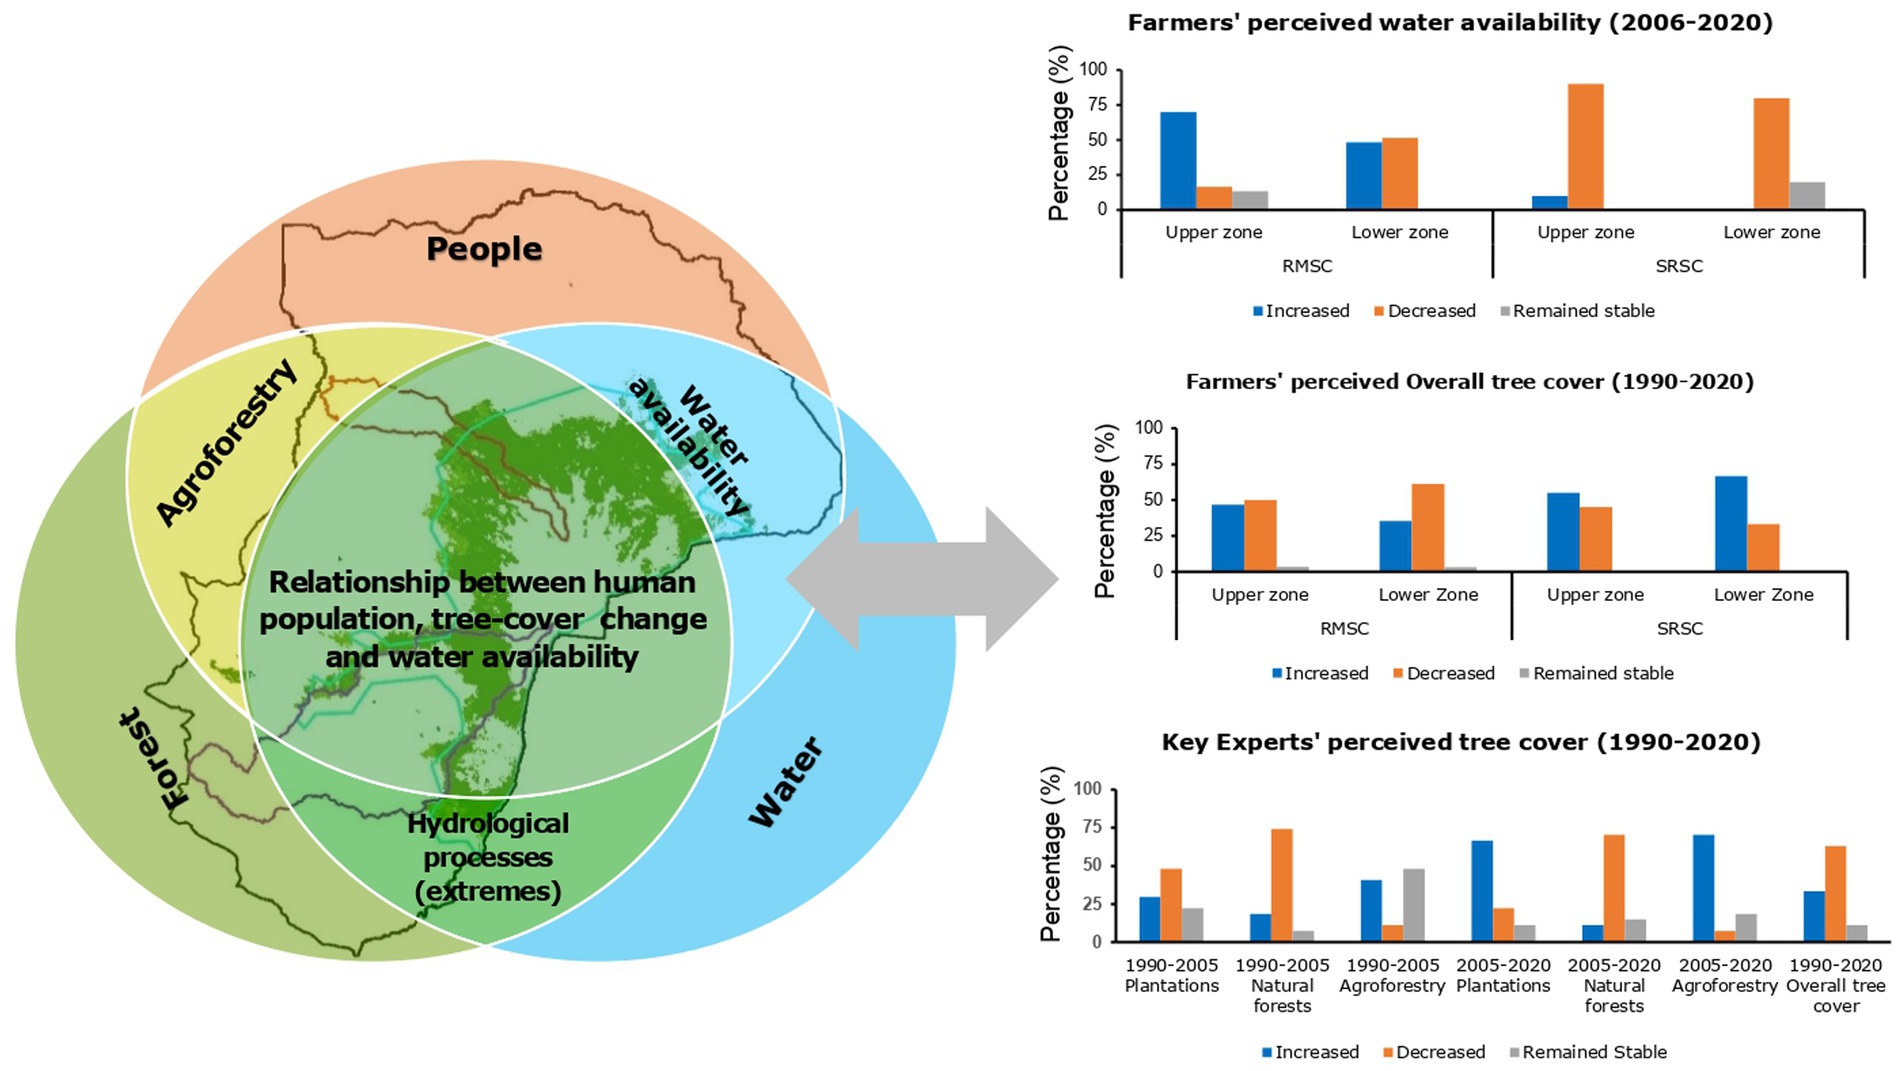
Graphical Abstract
Highlights
• Tree cover change follows different patterns across the two altitudinal zones in both River Manafwa and Sipi River sub-catchments.
• Key experts perceived a decrease in overall tree cover and in natural forest cover during the 1990–2020 period.
• Households selected from River Manafwa and Sipi River sub-catchments perceived that during 2006–2020 period, water availability in their catchments had increased and decreased, respectively.
• Differences between two zones for 2006–2020 water availability were noticeable in both River Manafwa and Sipi River sub-catchments.
• Since 2006, average monthly precipitation has increased and decreased in River Manafwa and Sipi River sub-catchments, respectively, corresponding with FGD exercise findings.
1 Introduction
Human population growth raises demand and competition for natural resources and the resulting change in land-use activities affects forest and water resources. For this study, a water tower is defined as a mountain ecosystem associated with rivers and streams that supplies/provides lowland areas with natural vital freshwater for different uses (Viviroli et al., 2008; Wamucii et al., 2021). East African water towers are essential sources for water provisioning to lowland actors demanding water. In the region, forest transition (Mather, 1992; Rudel et al., 2010) is driven by social transformations and anthropogenic pressures such as high population growth rates, urban extension, overdependence on natural resources for communities’ livelihoods, conflicting conservation policies, high poverty levels, previous regimes/politics, local cultural preferences, market access and changes (Bonell and Bruijnzeel, 2005; Norgrove and Hulme, 2006; Sassen, 2014; World Bank, 2016; Garcia et al., 2020). Mt. Elgon was first declared as a forest reserve gazette in 1929 (Vedeld et al., 2016), and is considered a contested landscape with a protected national park area, majorly comprising of Sabiny and Bagisu ethnic groups. The region is historically associated with displacements due to Karimojong raids, restricted access to national park by local people (Vedeld et al., 2016), besides evictions due to endemic species and degraded land (Sassen et al., 2013). Due to divergent values and interests of the densely populated communities, there is encroachment on the Mt. Elgon National park, thus fueling land-use and management related conflicts among farmers and government agencies that aim to protect the park (Norgrove and Hulme, 2006; Petursson et al., 2013; Cavanagh, 2015; Vedeld et al., 2016).
In the Mt. Elgon water Tower (MEWT) on the border of Kenya and Uganda, ensuring food security, water availability and improving income levels of the densely populated areas (Masiga, 2013) are major concerns and thus understanding the key drivers of land-use and land cover change (LULCC) and impact on the water balance is vital (MEMR, 2012; EAC, UNEP, and GRID-Arendal, 2016; Wasonga and Opiyo, 2018; Geussens et al., 2019; Luwa et al., 2021). According to Van Noordwijk (2020), water availability is influenced by trees, agroforestry and forests at varying landscape scales. In MEWT, limited hydrologic information (David, 2018) confines water resources evaluation allocation and planning. With an estimated tripling of MEWT 2014s population by 2035, domestic water demand is likely to exceed capacity of existing sources (Masiga, 2013). Scholars have long debated and came up with contradictory findings about human-induced tree-cover changes and impact on streamflow (Lacombe et al., 2016; Ellison et al., 2017; Qazi et al., 2017; Bennett and Barton, 2018; Guzha et al., 2018). Recent studies conducted in East Africa indicate an increase in surface runoff and streamflow due to forest cover loss (Mango et al., 2011; Guzha et al., 2018; Dibaba et al., 2020). According to Mango et al. (2011), converting forest land cover to agriculture and grassland correlates with reduction in streamflow during the dry season and increase in peak flows during the wet season. However, Schilling et al. (2014) indicate that LULCC in agricultural watersheds could also reduce the likelihood of flood events and severity of flood risks at downstream areas.
For the past few decades, MEWT has experienced increasing, recurring and extended climatic extremes (floods and drought) manifested in water scarcity, poor crop yield and sometimes famine. These prolonged extreme climatic events are frequently related to increasing climate variability and human activities such as deforestation (Mugagga, 2015). However, studies supporting and relating tree cover changes and water availability at regional level are not yet established (Guzha et al., 2018). In their review, Kilama Luwa et al. (2020) emphasized that population and agricultural area expansion are among the 23 reported major drivers of LULCC in Uganda. Recently, Luwa et al. (2021) focused on variabilities and trends of precipitation, temperature and streamflow in Sipi River Sub-Catchment (SRSC). Besides, Mugagga (2015) studied the effect of land-use on carbon stocks and implications for climate variability on the slopes of Mt. Elgon Region, Uganda. However, to the best of our knowledge, there is limited information linking and describing changes in tree cover and hydrology in MEWT. Limited spatial information and (local) community perceptions of tree cover changes is vital for understanding of actual trends and patterns of surface water availability in the landscape (Bruijnzeel, 2004; Ellison et al., 2017; Ahammad et al., 2019). Like most tropics, water availability in MEWT, especially during dry season is more relevant than total annual streamflow.
Understanding the extent, spatial and temporal variation of changes in tree-cover and water availability in a forested water tower can provide insights into stakeholders’ perceptions about extreme hydrological events experienced by the up- and down-stream communities as well as a water tower’s future water security. For Mt. Elgon, the changes in tree cover and water availability can be explored using available historical remote sensing products of LULC, precipitation data (CHIRPS) and streamflow data (local gauging stations). However, remote sensing is less reliable due to challenges associated with acquiring high quality remote sensed data and consistent datasets for ground truthing (Avitabile et al., 2012; Govender et al., 2022). Also, there are various uncertainties in precipitation and streamflow data due to limited weather and gauging stations (Onyutha et al., 2021). Besides, from the available remote-sensing data, one cannot for instance extract information on tree types/species yet such information plays a key role in producing and regulating water flows (Ellison et al., 2017) at farm and landscape levels.
It is worth noting that the uncertainties with regard to LULC (tree types) and hydrological data, for instance spatial and temporal resolution and accuracy further complicates understanding of the Forest-Water-People nexus. This can for instance be seen in the differences in methodologies and temporal satellite imagery availability used to produce LULC maps (Derdouri et al., 2021; Maviza and Ahmed, 2021). For Mt. Elgon water tower system, the data for analyzing the Forest-Water-People nexus was available for different periods thus complicating disentangling the relationship between tree cover changes and water availability. While LULC maps were available from 1990, some streamflow data were scattered for some years thus leaving little basis to analyze the potential relationship between tree cover and water availability.
The overall aim of this study was to explore and understand spatial and temporal variation of tree-cover changes and (surface) water availability in the MEWT using participatory rural appraisal (PRA) tools (Chambers, 1994a). The choice of PRA is based on its ability to allow for active learning, triangulation, flexibility and thus enabling sufficient knowledge sharing and on-the-spot analysis (Chambers, 1994b; Bar-on and Prinsen, 1999). Improved understanding of the effect of human-environment interactions on water availability at farm and landscape levels is indispensable for supporting sustainable forest/agroforestry management. A participatory approach based on the explicit inclusion of key stakeholders’ roles in landscape change processes and of the three-way interactions between people, forest and water was considered. PRA tools that allow for revelation of local perceptions that can be linked to the scientific knowledge were applied.
2 Materials and methods
2.1 Case study area
Mt. Elgon Water Tower (MEWT), Uganda comprises Bugisu and Sebei Sub-Regions. For this study, two representative sub-catchments for the two Sub-regions that are hypothesized to encompass full range of tree cover-water relationships in MEWT were considered that is River Manafwa Sub-Catchment (RMSC) in Bugisu Sub-region and Sipi River Sub-Catchment (SRSC) in Sebei Sub-region. There are serious future water-availability concerns within both sub-catchments due to climate variability (Bomuhangi et al., 2016; Onyutha et al., 2021). RMSC, 503 km2 in Mpologoma catchment, is characterized by high population growth rates, low income generating activities, high deforestation levels, seasonal downstream-floods, decreasing base flows and drying river streams (Lang and Byakola, 2006; Gunderman and Saravanan, 2010; Mugagga et al., 2012). SRSC, 124 km2 located in Awoja Catchment, experiences increased degradation of land through unfavorable land-use practices, overgrazing and deforestation, thus leading to downstream flooding.
2.2 Selecting study sites
During preliminary fieldwork, local government officials were consulted, talks were held with sub county residents, existing scientific literature was reviewed and the agroforested landscape was divided into two zones (i.e., upper and lower) following elevation differences (Figure 1). The survey and collection of data by PRA tools in both RMSC and SRSC was conducted over a period of 6 weeks (October–December, 2021) and subsequent data analysis took another 6 weeks (December 2021 to January 2022). Three to five key experts (officials) from each of the six districts of RMSC and SRSC and thus a total of 27 key experts were interviewed. Also, interviews were conducted with 91 households in 9 sub counties (6 and 3 sub counties from RMSC and SRSC respectively). Random stratified sampling was applied considering 3 sub counties from each of zone of the RMSC. For SRSC, 2 sub counties and 1 sub county were considered to represent the upper and lower zones, respectively.
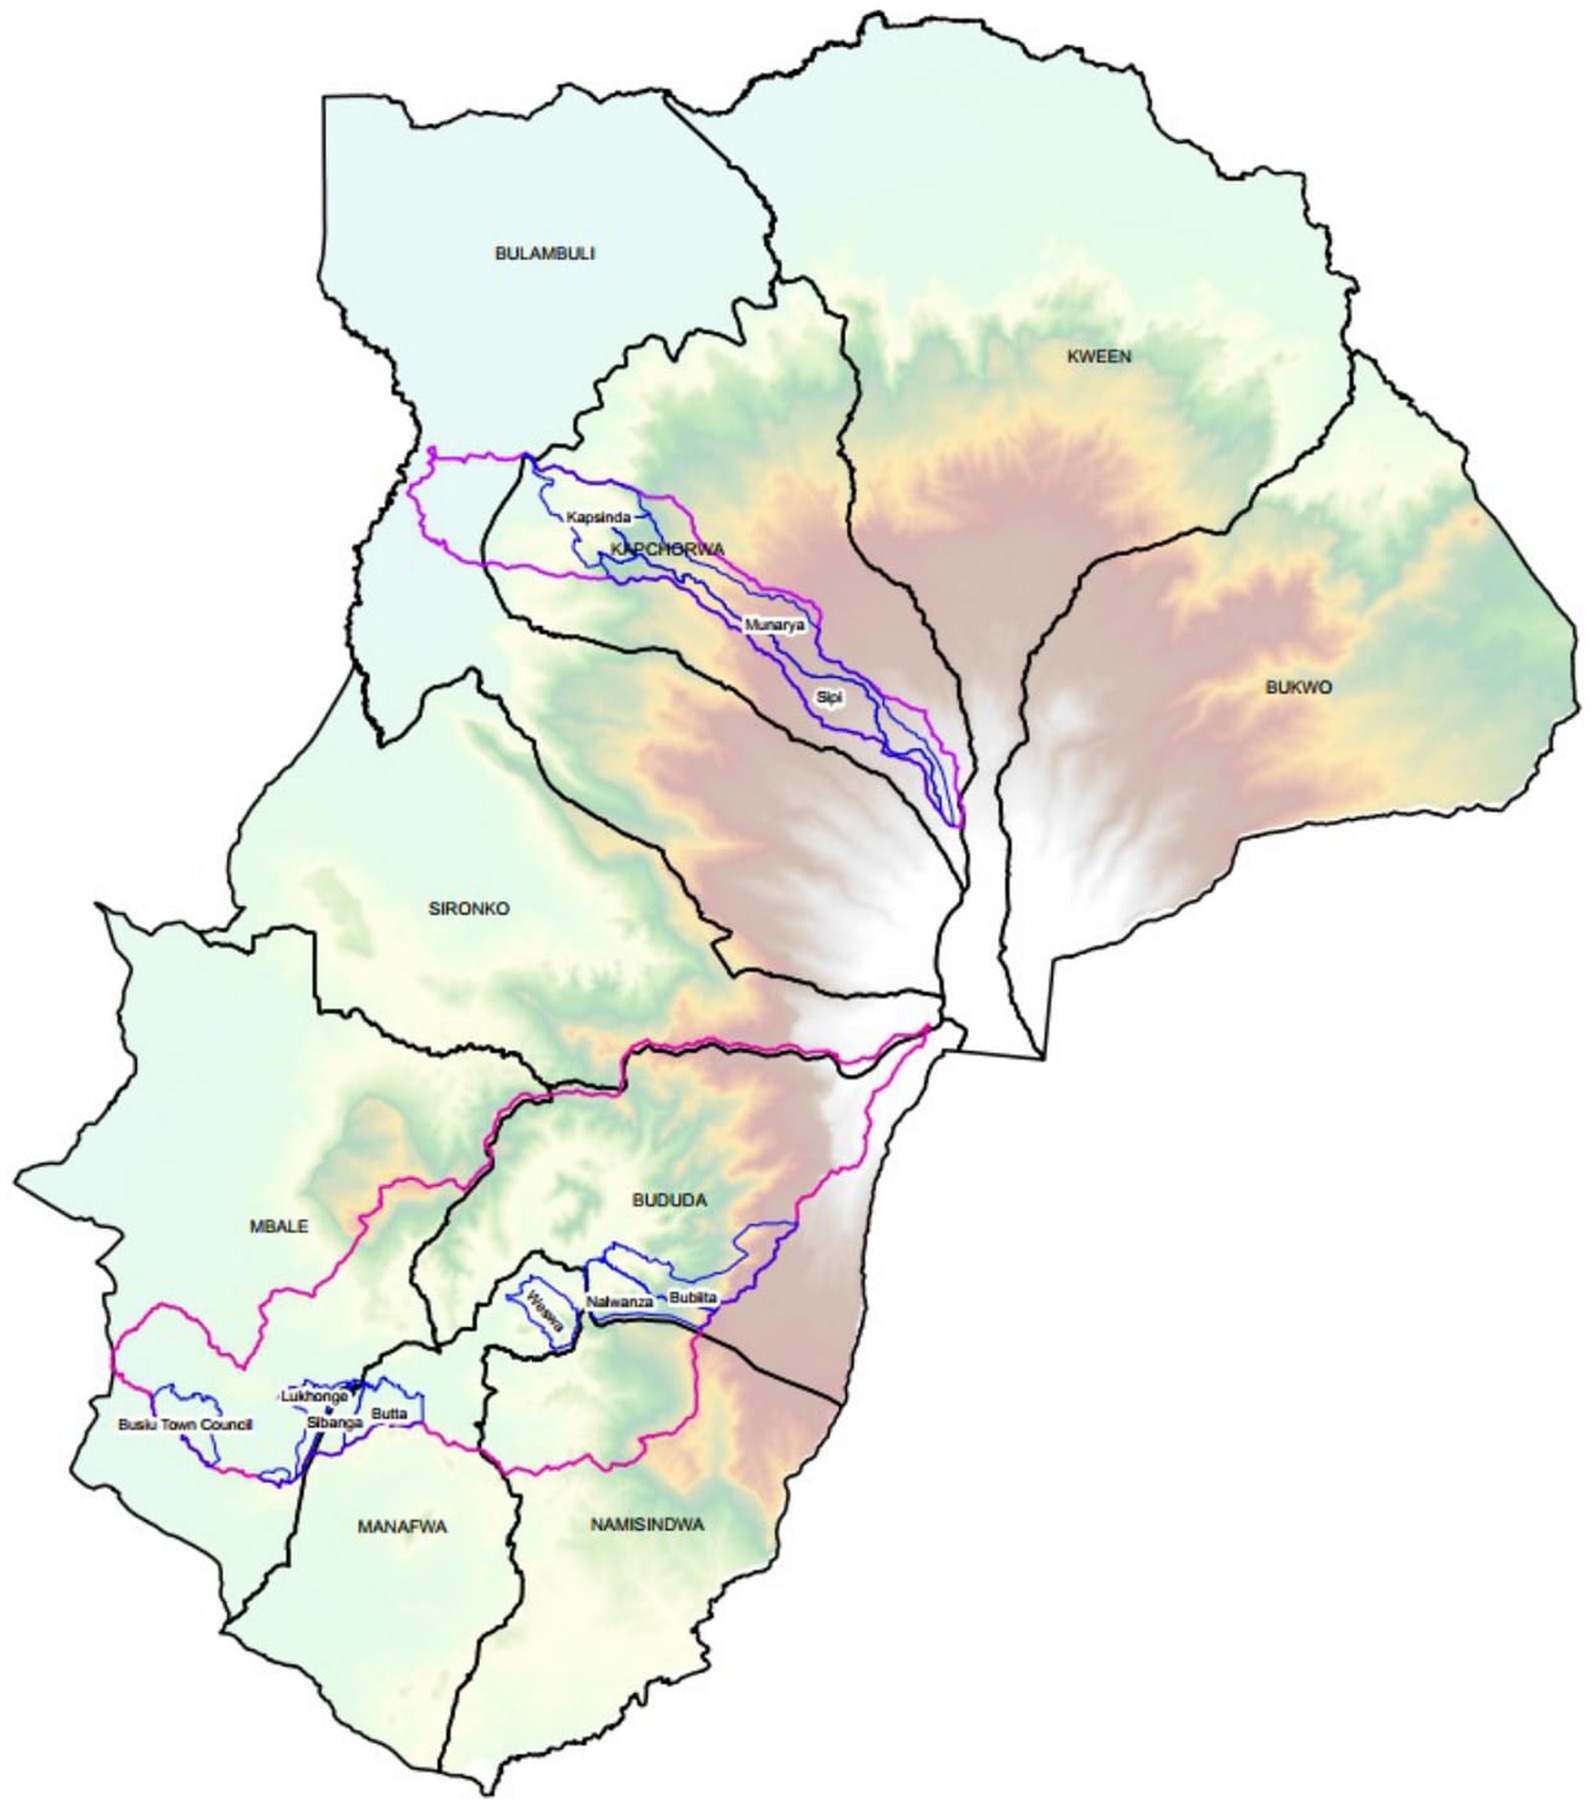
Figure 1. Map showing 10 sites (blue color) where PRA tools were administered: Six and three sub counties were selected from Manafwa River and River Sipi Sub-catchments. The household questionnaires was tested from one site.
2.3 The methodological approach
The specific steps of the research include: 1-scientific literature review of Forest-Water-People nexus of the MEWT system and 2-application of PRA tools to selected study sites (Figure 2). The methodological steps of the study for analyzing changes in tree cover and water availability are presented in Figure 3. It shows how implicit local social-ecological knowledge and available secondary information sources were explored to understand the Forest-Water-People nexus.
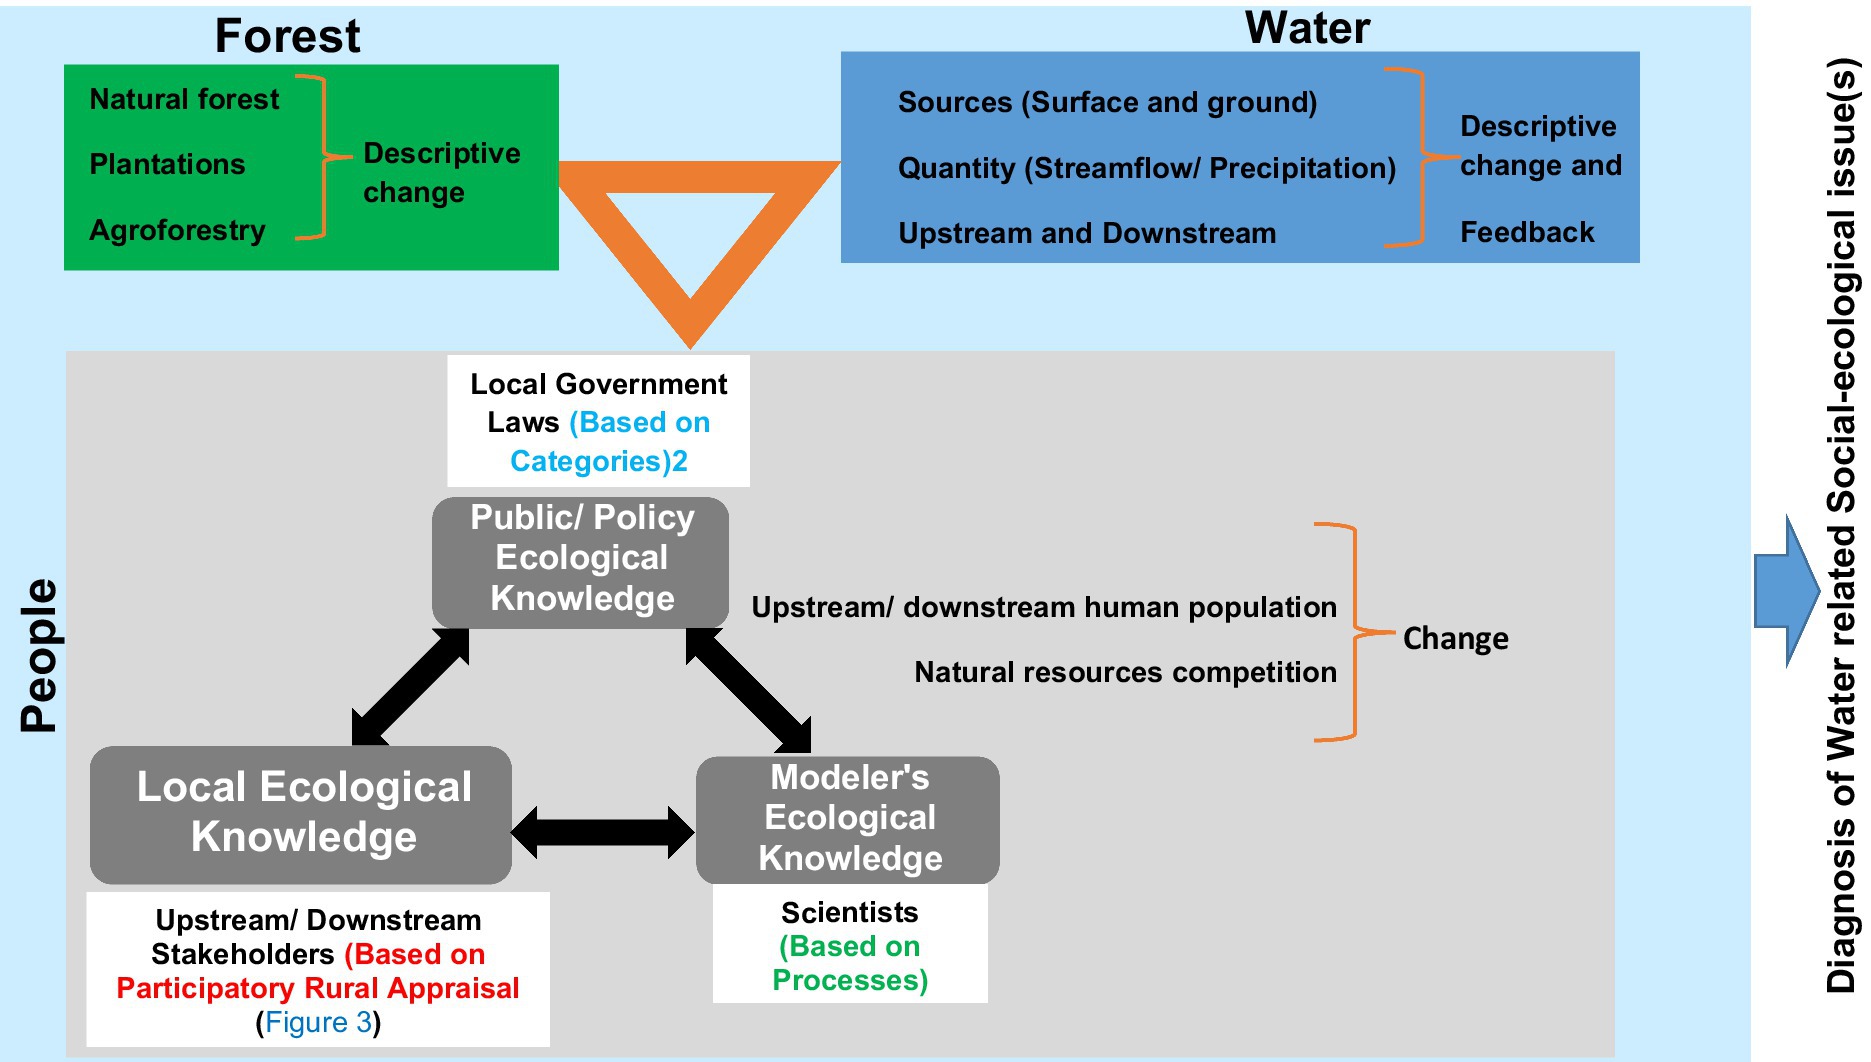
Figure 2. Conceptual Framework modified from van Noordwijk (2021) of how the social-ecological and knowledge systems and forest-water-people, FWP-nexus are linked. The social-ecological system is explored up to diagnostic level to understand the link between the FWP-nexus components in the Mt. Elgon Water Tower, Uganda. The knowledge system is used to describe and link changes in local and scientific knowledge as well as policies. Feedback resulting from diagnosis of social-ecological issues using PRA tools is shown.
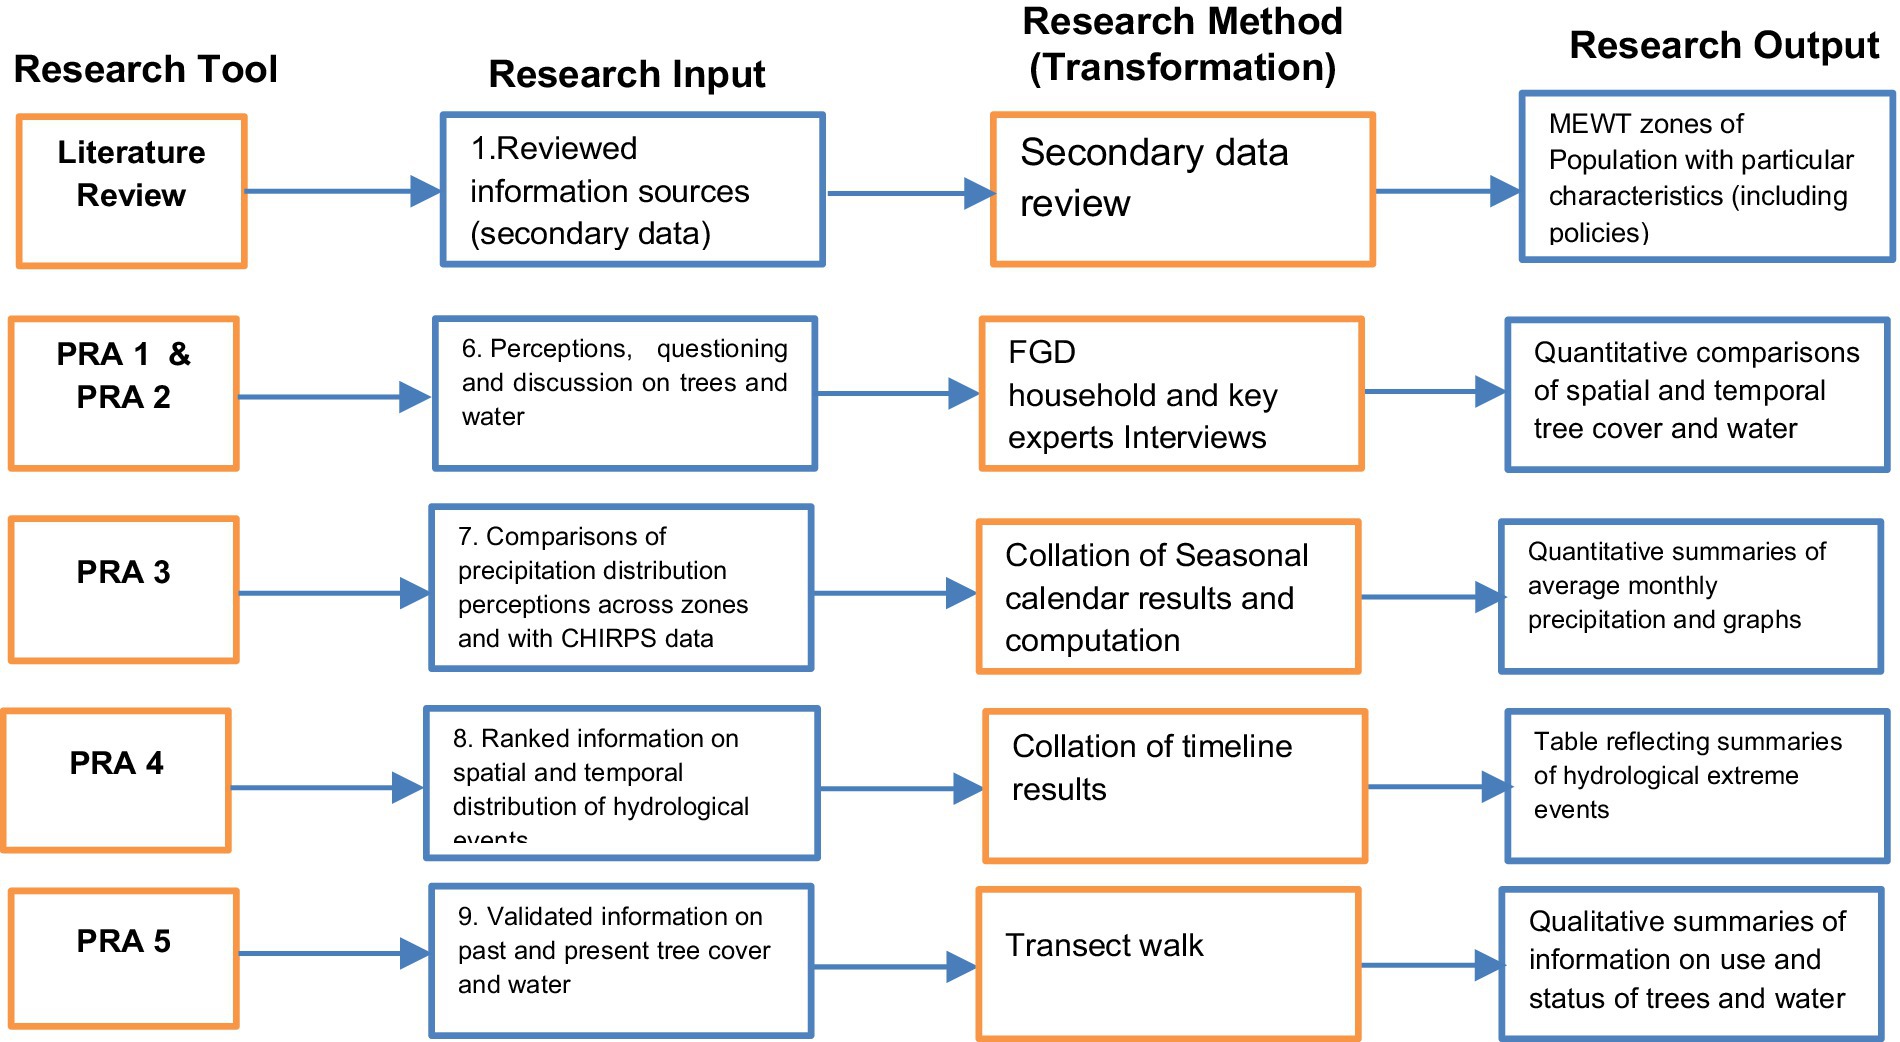
Figure 3. Flowchart of the methodological approach modified from Loader and Amartya (1999) and JICA (2002). Participatory Rural Appraisal tools used for analyzing tree cover changes and water availability in Mt. Elgon Water Tower, Uganda. The five PRA tools applied for this study are applied in both upper and lower zones of the two representative sub-catchments of Mt. Elgon Water tower considering 1990–2005 and 2006–2020 periods. Research output resulting from application of PRA tools is shown.
2.4 Participatory Rural Appraisal approach
Participatory Rural Appraisal (PRA), a qualitative data collection approach was adopted to gain an understanding of the relationship between population growth and tree cover changes and water availability of MEWT. This approach enables sharing of perceptions by local people through discussions (between participants), visualization and comparison among other means (Chambers, 1994b). The approach also enables participants to learn from the research other than just being study respondents (Stadler, 1995). PRA aids knowledge and experience sharing among local people hence enabling a plan of actions (Chambers, 1994a). PRA techniques have been applied in conservation research (Nyumba et al., 2018) and in management of natural resources including forestry (Ahammad et al., 2019). For this study, PRA approach was used to explore changes in tree-cover and water availability in a contested agricultural landscape. The method can account for people’s experiences regarding changes in land use and cropping patterns around their community (Chambers, 1994b). A combination of PRA techniques used in this study include: 1-structured interviews; 2-focus group discussions, 3-seasonal calendar; 4-timeline; and 5-transect walk and diagramming (direct observations). Prior to application of all the five, an informed consent was sought from all the study participants.
It should be noted that study results generated from PRA tools are: more reliable; applicable to community interests; and fairly represent participants’ complex and sophisticated expertise. However, the PRA approach: can restrict participants’ learning basing on the researcher’s interest for specific subject and choice of PRA tools; can be definitely biased to rural communities; has a tendency to use groups instead of individuals; and thus results in public knowledge rather than private discourses. This way, the approach may not thoroughly explore perceptions and knowledge of all community sections. Besides, there is possibility to misinterpret and misrepresent facts while summarizing the information. Additionally, the PRA techniques may underplay unseen conflicts and possible disputes/differences in social life and thus study results are often based on assumed consensus (Stadler, 1995).
2.4.1 PRA 1: household survey and key experts interviews
For this study, nine sub-counties from two Sub-catchments in MEWT, Uganda were selected based on suggestions by Sunderland et al. (2017) and considering their relative proximity to the Mt. Elgon National park and to the two main rivers (Manafwa and Sipi). A two-level sampling scheme was considered: 1- a sample of sub counties selected from the upper and lower zones of the two selected sub-catchments; and 2- random selection of 10 households from each subcounty. Two different sets of structured questionnaires were designed comprising 52 and 69 questions in English for key experts and households, respectively. The questionnaires were divided into four sections: basic socio-demographic information; tree-cover change; water availability and tree-water relationships. The key expert questionnaire was reviewed and discussed with ICRAF Uganda research scientist and two water and environment experts at Kyoga Water Management Zone. The household questionnaire was pretested with 10 participants from Lukhonge subcounty in RMSC to assess its clarity and suitability to participants. The key-expert questionnaire was administered in English. In RMSC, household survey was conducted in either English, Lugisu or Luganda basing on respondent’s fluency. Similarly, in SRSC, household interviews were conducted in either English, Kusabiny or Luganda.
Prior to interview, each participant (key expert and household) was requested to sign a consent form. For all interviews, answers were recorded on papers, using digital recording equipment and GPS devices to take elevation and location coordinates. For each of the sub-catchments, the trained survey team comprised a team of 4 people (one well-known community member, PhD Researcher, and 2 other persons experienced in working with communities) to ask questions, take photos, record data and GPS coordinates. A total of seven interviewers for both sub-catchments were selected based on experience with conducting related surveys among local communities and fluency in the local languages.
During preliminary field visits, the team contacted extension officers, requesting for household lists. From the lists, the team randomly selected 10 households for each sub county (Figure 1). The selected households were subsequently visited and interviewed. In case some selected household was not available for interview, another one from the same list could be randomly selected. The survey took 1.0–1.5 h. Exploratory data analysis and descriptive statistics was conducted to generate sample statistics. Also, upper and lower zone subgroup results were compared. In Table 1, the relative characteristics of the two zones basing on average statistics of the sampled sub counties were summarized.
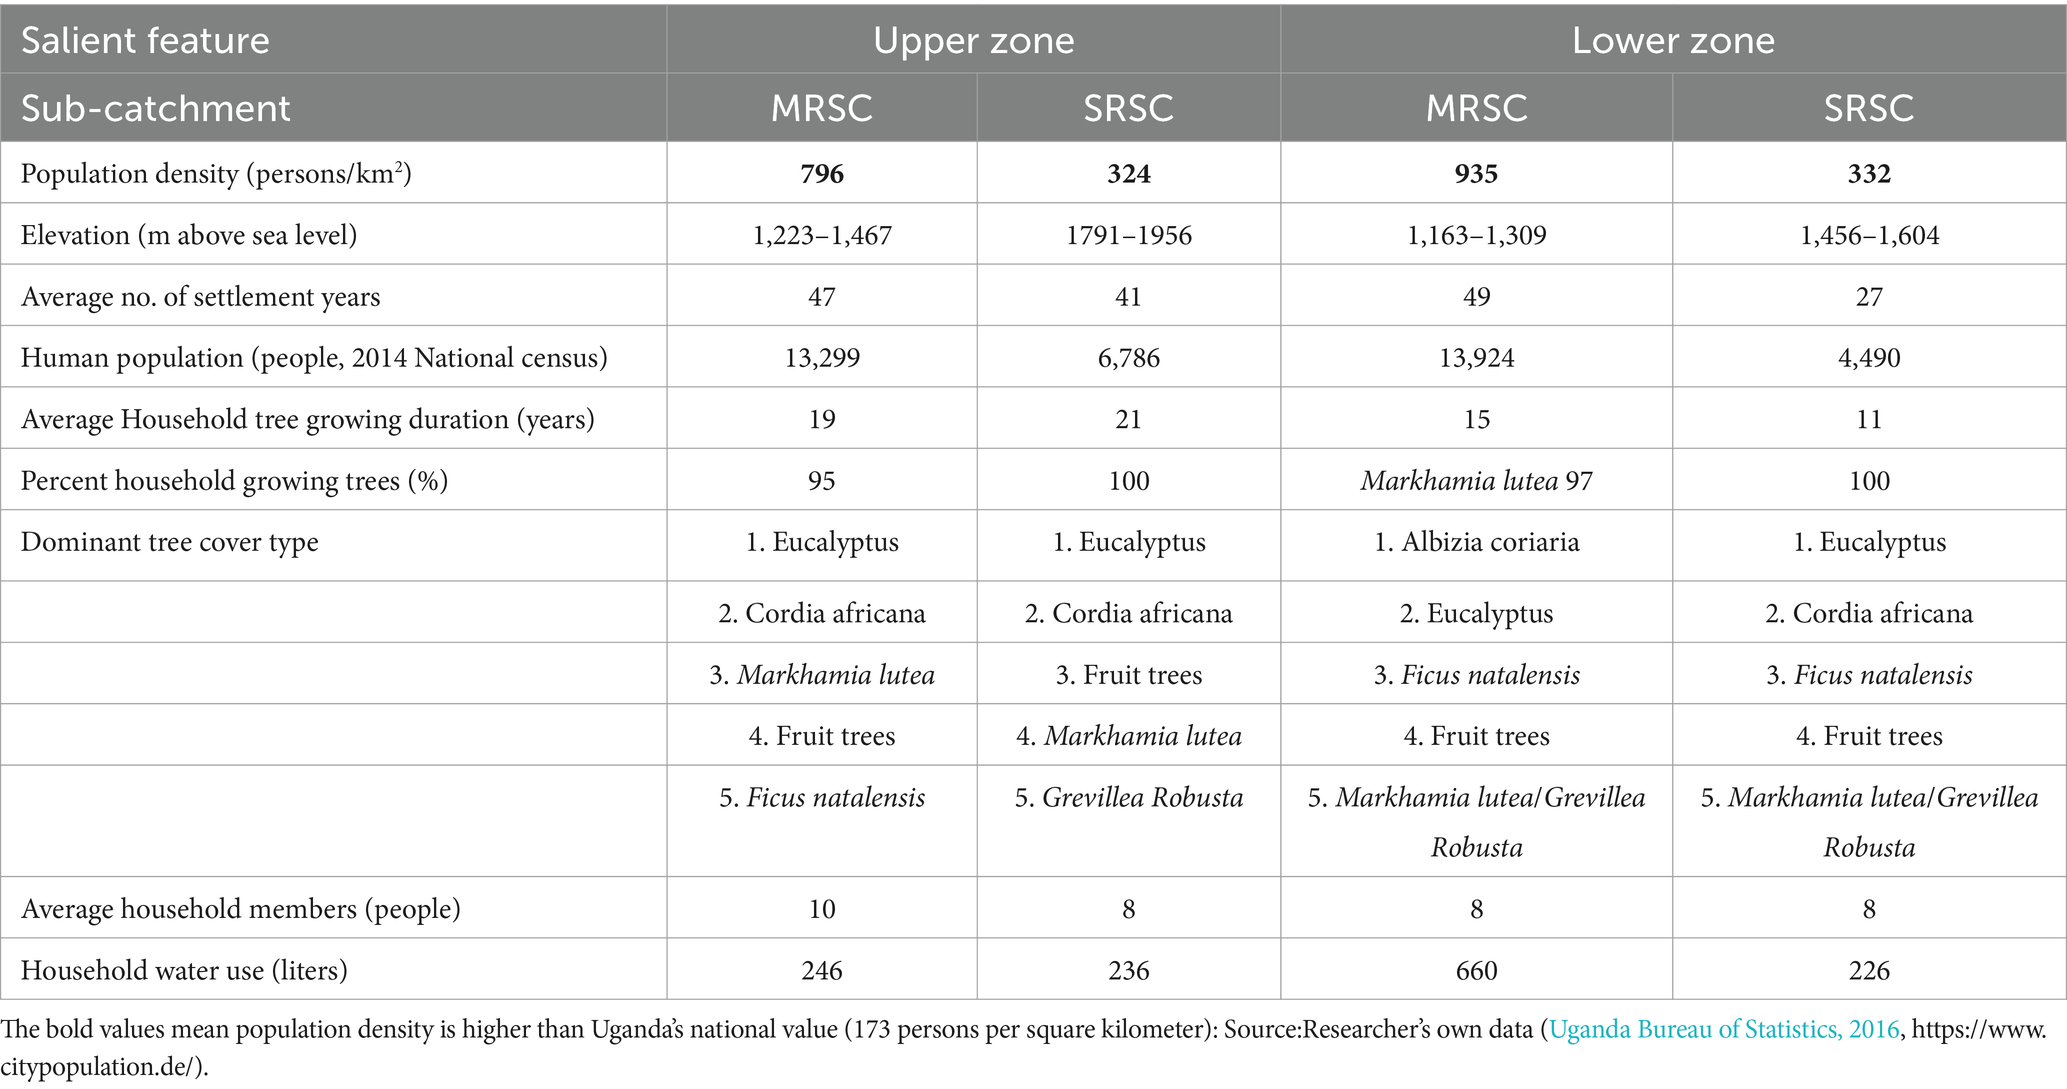
Table 1. Salient features of the two zones of Mt. Elgon Region Uganda.
2.4.2 PRA 2: focus group discussions
The main objective of the focus group discussion (FGD) was to understand local people’s knowledge on tree cover changes and water availability over the 1990–2020 period. Perceived change in tree cover at subcounty level was recorded as “increased,” “decreased,” or “remained stable.” For water availability, participants were asked what water uses they considered as important to their livelihoods and most affected? Participation of male and female farmers was encouraged to capture gender-based differences in understanding tree cover-water relations. The four steps (research design, data collection, analysis and reporting) recommended by Morgan (1997) were followed while conducting the FGDs. Purposive sampling was followed to select participants (Nyumba et al., 2018). A mixed group (to improve quality of discussion and outcome gender) of participants above 40 years (to capture historical views on tree-water relations) belonging to the same ethnic group was considered. This aimed at reaching consensus within a group and testing for diversity across groups. Ten participants, a number considered by Krueger and Casey (2015) large enough to gain variety of perceptions and small enough to avoid fragmentaion and disorderly was targeted. However, 10–15 participants were identified and recruited to cater for failure of some invited people to attend FGD (Rabiee, 2004). Following household lists provided by local government extension staff, a mix of local leaders, elderly, opinion and cultural leaders were contacted via telephone. For each study site, an accessible and reasonably sized venue away from distractions with sufficient space for FGD considering Covid-19 standard operating procedures was selected. Informed consent was sought for and a sitting arrangement that enabled participant clear view of each other and facilitator(s) was ensured.
Nine FGD sessions were conducted with an assumption that the principle of theoretical saturation where a clear pattern on local people’s perception emerges with subsequent sessions producing no new information was achieved (Krueger and Casey, 2015). Overall, 100 people participated in the nine FGDs conducted across the study area. The facilitation team comprised a skilled facilitator, an assistant facilitator, note-taker and photographer. The facilitator was responsible for managing existing relationships, creating a relaxed and comfortable environment for unfamiliar participants. The assistant facilitator was responsible for translating facilitator’s communication to local language and vice versa, observing non-verbal interactions, recording overall discussion content (Nyumba et al., 2018) and ensuring that all members participated. Methods of data collection included: 1-audio recording, 2-note taking; and 3-participant observation. Quantitative results were generated to draw comparisons across the focus groups (Carey and Smith, 1994; Morgan, 1995; Charmaz, 2006). Reporting was done using semi-structured interviews, ranking and matrix. Display boards, big flip charts, pencils and markers were used. Photographs of materials were taken for reference while reporting. The FGD lasted for 1.8–3.0 h.
2.4.3 PRA 3: seasonal calendar
This tool was used to explore seasonal changes in water availability using a big sheet of paper. The activity was guided by three main questions: 1-At what time of the year is water scarce?; 2-How does rainfall vary over the year?; and 3-How does water availability for household use vary over the year? Participants were asked to draw a matrix, indicating each month of the year along x-axis. Starting with rainfall patterns, participants were asked to choose a symbol (zero) for rainfall and draw it next to column illustrating rain. Using a flip chart, pencil and markers, each group was asked to draw symbols (zeros) under each month of calendar to present relative amount of rainfall. The following rating scale was used to guide participants in developing the rainfall matrix: 0-no rainfall; 1-less rainfall; 2-medium rainfall; 3- more rainfall; 4-too much rainfall; and 5-excess/rainfall. Participants were then asked to indicate month(s) during which water is usually scarce; to discuss reasons why it was scarce; to discuss the domestic water alternatives that households use. Then participants were asked to discuss linkages that they could see on calendar. Each seasonal calendar had a key to explain different items and symbols used.
2.4.4 PRA 4: timeline
This aimed at generating knowledge about past and present conditions of each of the nine sub counties. Guided by the facilitator, each group discussed particular hydrological events from 1990 to 2021. Basing on secondary data and together with local people, timeline of particular events (significantly perceived droughts, floods, landslides, etc.) was drawn. Units understood by local people, e.g., number of buckets/day was used (converted to liters/day) or trees/acre, river/streams that dried, etc. and information was recorded in a table. Also, tree-cover time line (1990–2021) was discussed for each of the selected sub-counties with participants with an aim to assess relationship between human population pressures, tree cover changes and water availability. As timeline neared completion, trends of particular events were discussed.
2.4.5 PRA 5: transect walk and diagramming
The objective was to visually represent features by conducting a field tour/discussion on past and present tree cover (species), water resources, etc. found in each sub county focusing on their uses and associated problems. These features were topographically illustrated (high hillside, plain/low hillside and valley) in a simple diagram. This complemented data from FGDs. The activity was guided by three questions: 1-What does each area contain trees(species), water (resources)?; 2-Who has access to trees/water resources?; and 3-Have significant (tree cover/water) changes occurred in past? 3–5 participants were selected and the objective of the exercise was explained to the group. The best route for the transect walk based on terrain and existing tree cover was then discussed. Following agreed route, the tour was began. During the transect walk, the research team kept writing down main features/changes in trees and water using local terms. The research team could stop and speak to people that were met along the way. During the walk, together with participants, information was written and created a diagram on a large sheet of paper describing terrain, areas visited and their names. The team checked with participants to agree on the classification. Together with participants, essential information on use and status of trees (species), water (resources), etc. was generated. The activity duration depended on distance covered and overall was within 1.0–1.5 h on average. Maps of sub counties, notebooks, paper(s), pencils and markers were used to generate the final diagram for each study site.
3 Results
3.1 Perception of spatial and temporal variation in tree cover changes across MEWT
The PRA results perceived diverse patterns of tree cover change. Respondents of the household survey (farmers) for instance perceived an overall decrease in tree cover for RMSC (Figure 4E). It was evident that 59% farmers perceived that tree cover around them had either decreased or remained stable. Across the two zones, more farmers (64%) in the lower zone perceived higher levels of tree cover loss (Figure 4E). Specifically, between 1990 and 2005, farmers perceived an increase in natural forest cover and a decrease in plantations and agroforestry across the two zones (Figure 4A). Considering 2006–2020, there was a notable increase in plantations and agroforestry as well as a decrease in natural forest cover (Figure 4C).
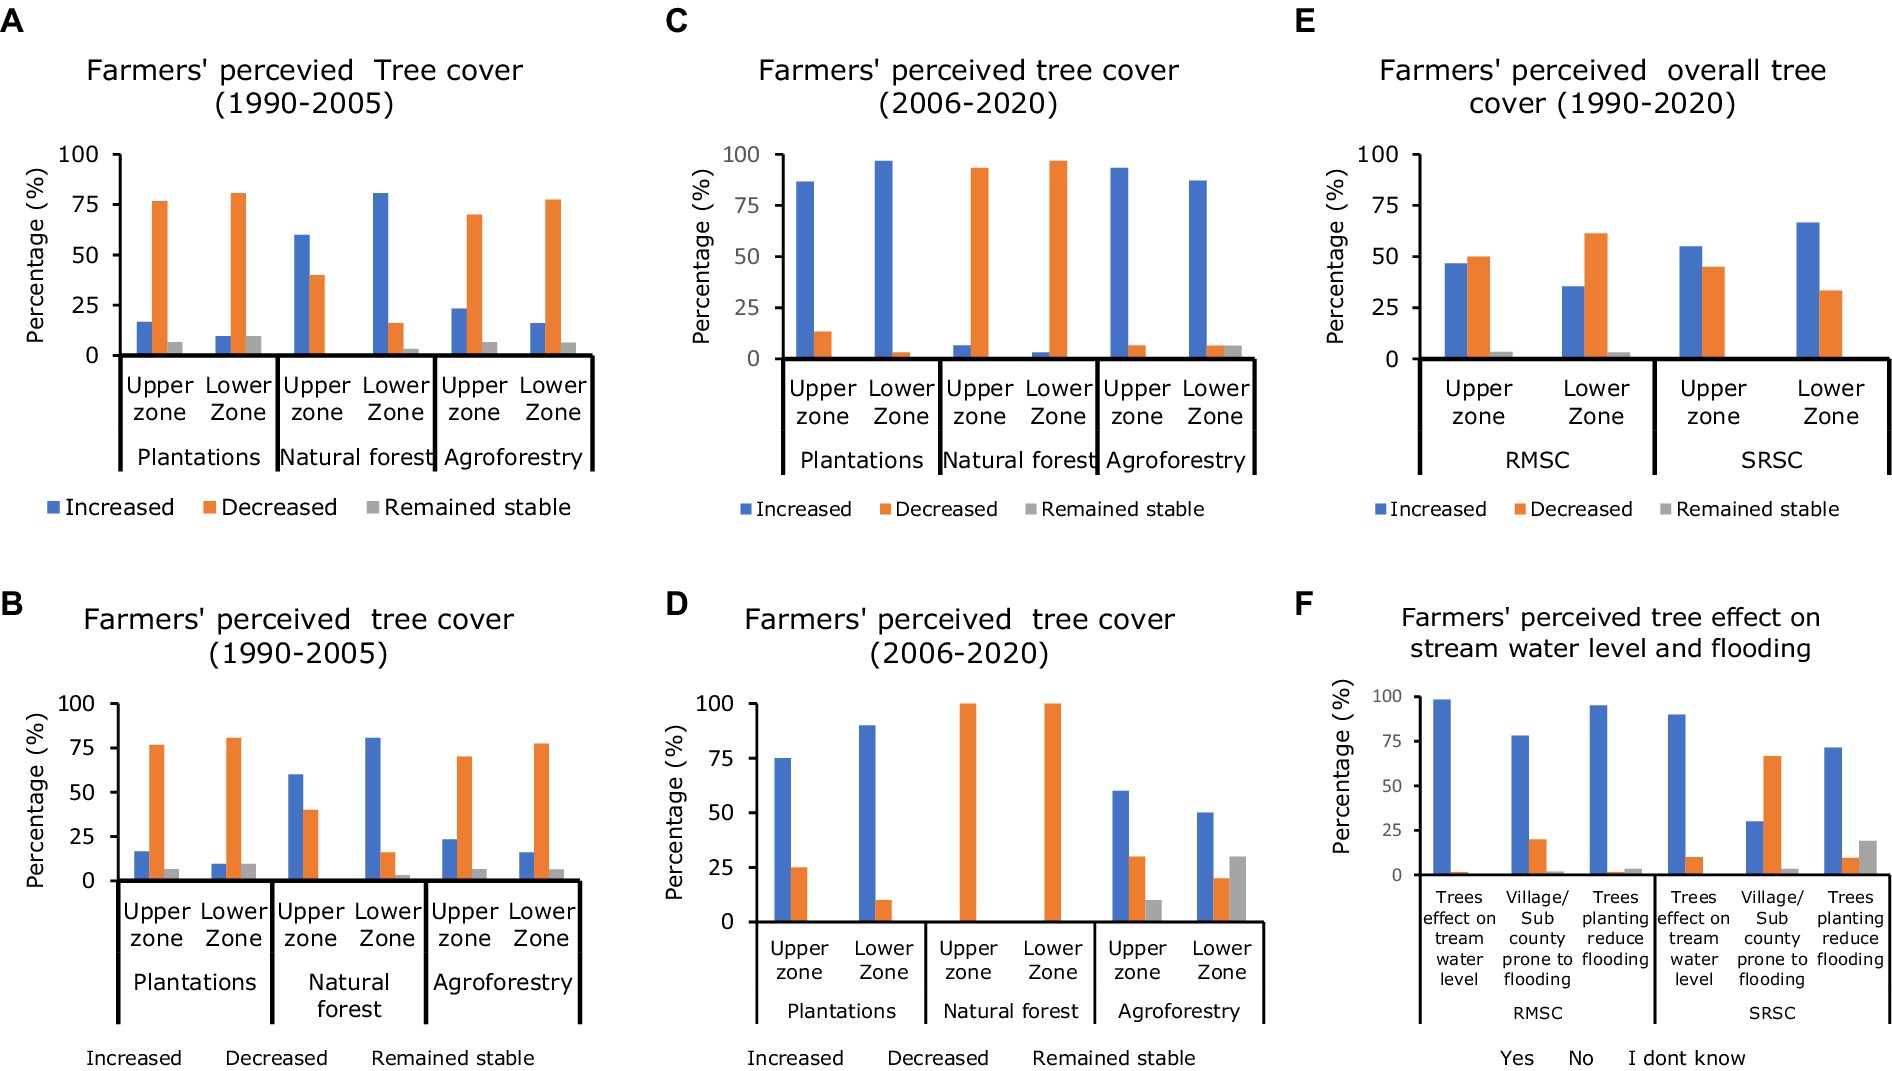
Figure 4. 1990–2005 household perceptions on plantations, natural forest and agroforestry for River Manafwa Sub-Catchment (A) and Sipi River Sub-Catchment (B); 2005–2020 household perceptions on plantations, natural forest and agroforestry for River Manafwa Sub-Catchment (C) and Sipi River Sub-Catchment (D); 1990–2020 household perceptions on overall tree cover for River Manafwa Sub-Catchment and Sipi River Sub-Catchment (E) and tree effect on stream level and flooding (F).
Considering the SRSC, during 1990–2020, farmers perceived an increase in overall tree cover across all the two zones (Figure 4E). It was evident that 61% farmers perceived an overall increase in tree cover around them. Across the two zones, more farmers (67%) in the lower zone perceived higher levels of tree cover gain (Figure 4E). Like in RMSC, considering 1990–2005, farmers in SRSC that perceived an increase in natural forest cover and a decrease in plantations across the two zones were almost equal to the respondents with the opposite perception (Figures 4B). Considering 2006–2020, reverse perceptions were notable in the three categories of tree cover across the two zones. That is farmers perceived an increase in plantations and agroforestry as well as a decline in natural forest cover (Figures 4D). Also, 63% key experts perceived a decrease in overall tree cover trend for the 1990–2020 period (Figure 5A). Overall, from 1990 to 2020, the plantations and natural forest cover change was perceived by key experts to follow a pattern similar to that of farmers. However, 74% key experts perceived a decline of natural forest cover during the 1990–2005 period (Figure 5A). During the tree cover trend analysis, the FGD participants considered tree cover loss as a decrease in the natural forest cover. Similarly, farmers perceived gain in tree cover as an increase in tree plantations and agroforestry expansion. It was evident that most farmers from upper zone sub counties that were in close proximity to the Mt. Elgon national forest park perceived a loss in tree cover.
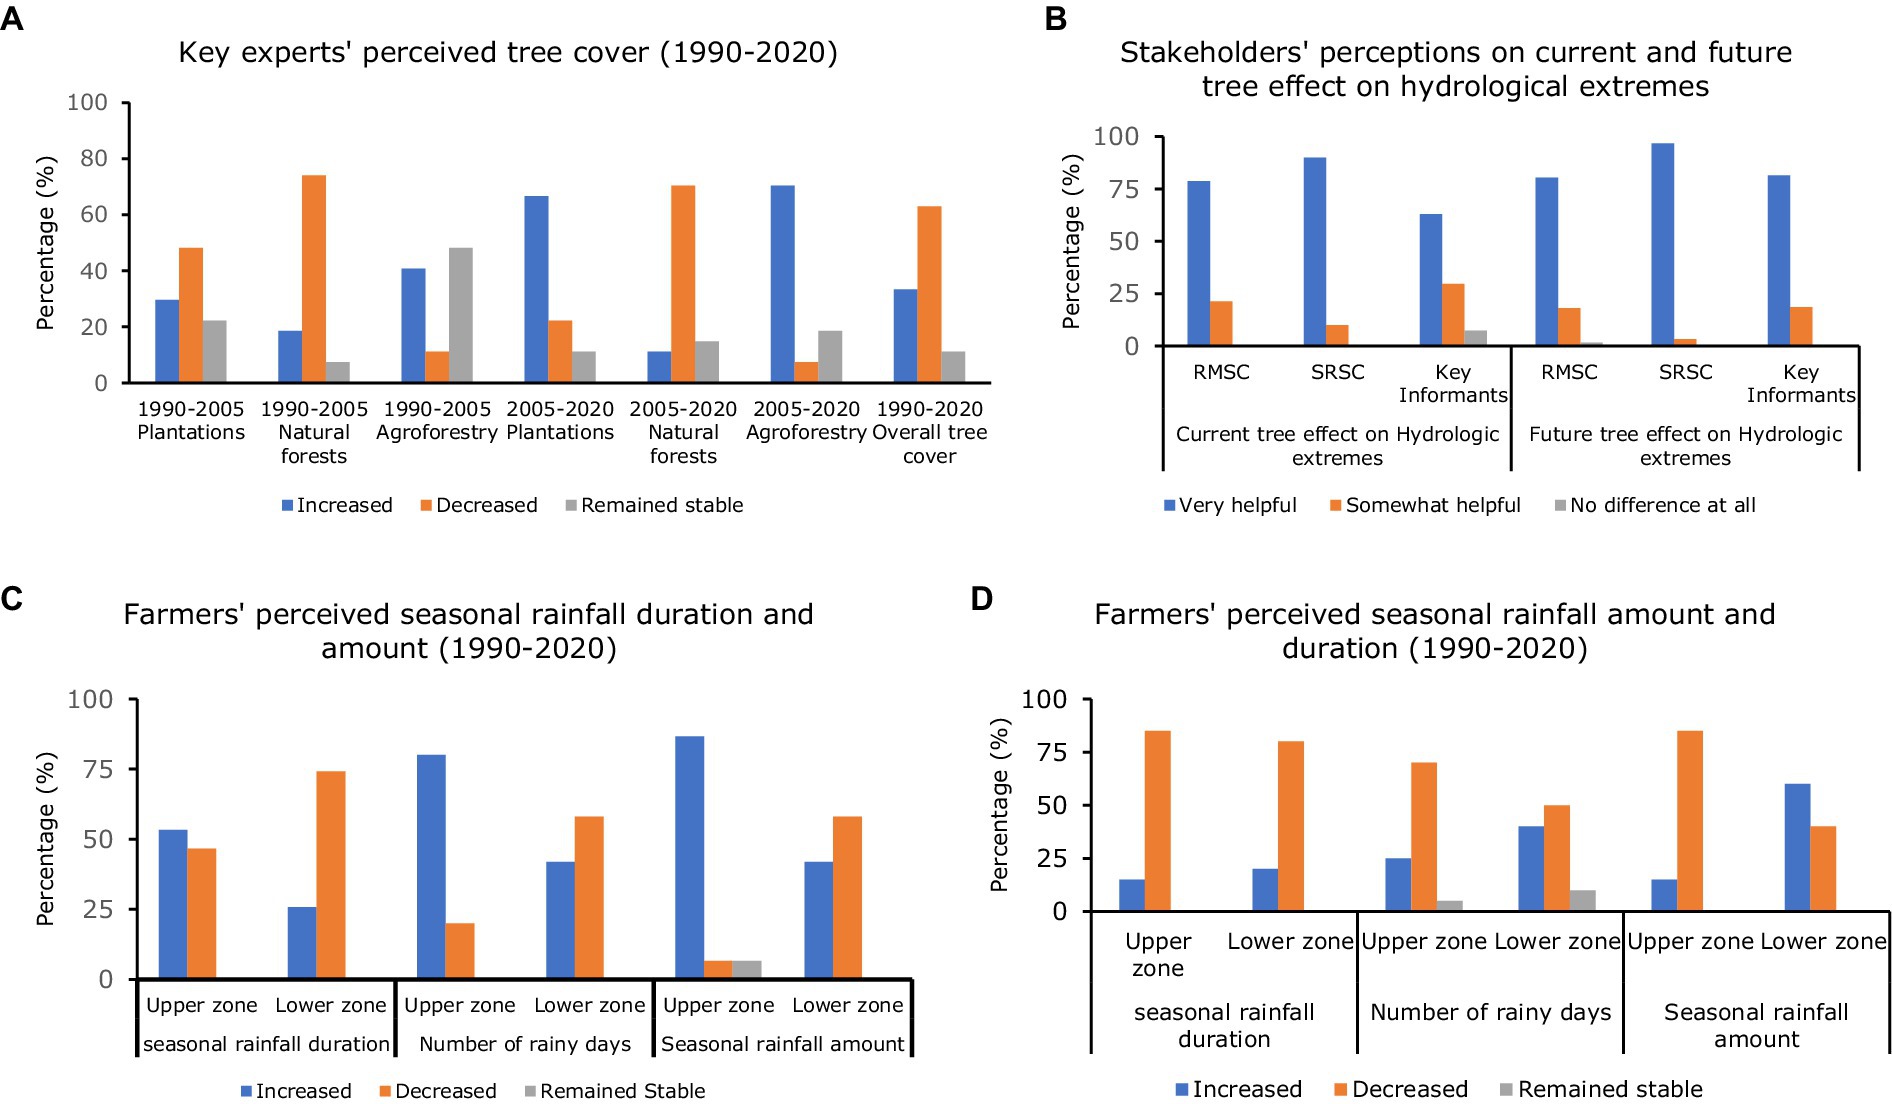
Figure 5. Percent key experts perceptions on tree cover (A) current and future tree cover effect on hydrological extremes (B); and seasonal rainfall duration, no. of rainy days and rainfall amount for River Manafwa Sub-Catchment (C) and Sipi River Sub-Catchment (D).
3.2 Perception of spatial and temporal variation in water availability across Elgon
There was variation in water availability as reported by respondents of the household survey across all the nine sub counties. Farmers were asked to share their perceptions on whether and how the 1990–2005 and 2006–2020 tree cover trends had consequently affected water availability in their sub counties. Similarly, key experts were asked to share whether the sub counties that had undergone high levels of tree cover loss, had as a result, experienced water related challenges. For RMSC, there was high variation in water availability perception during 1990–2005. For instance, 60% respondents in upper perceived water around them either decreased or remained stable yet 55% respondents in the lower zone perceived decreased water availability during the same period (Figure 6A). Overall, 75% respondents selected from RMSC perceived an increase in sub-catchment’s water availability during 2006–2020. Despite 77% farmers in RMSC reporting that their daily household water use was enough (Figure 6A), more households (over 90%) would increase their water usage in case they could get more water. More households (69%) would specifically increase water for drinking for livestock and washing. This corresponded to water use/availability challenges and the most affected water uses due to water scarcity reported during the FGDs and by the key experts.
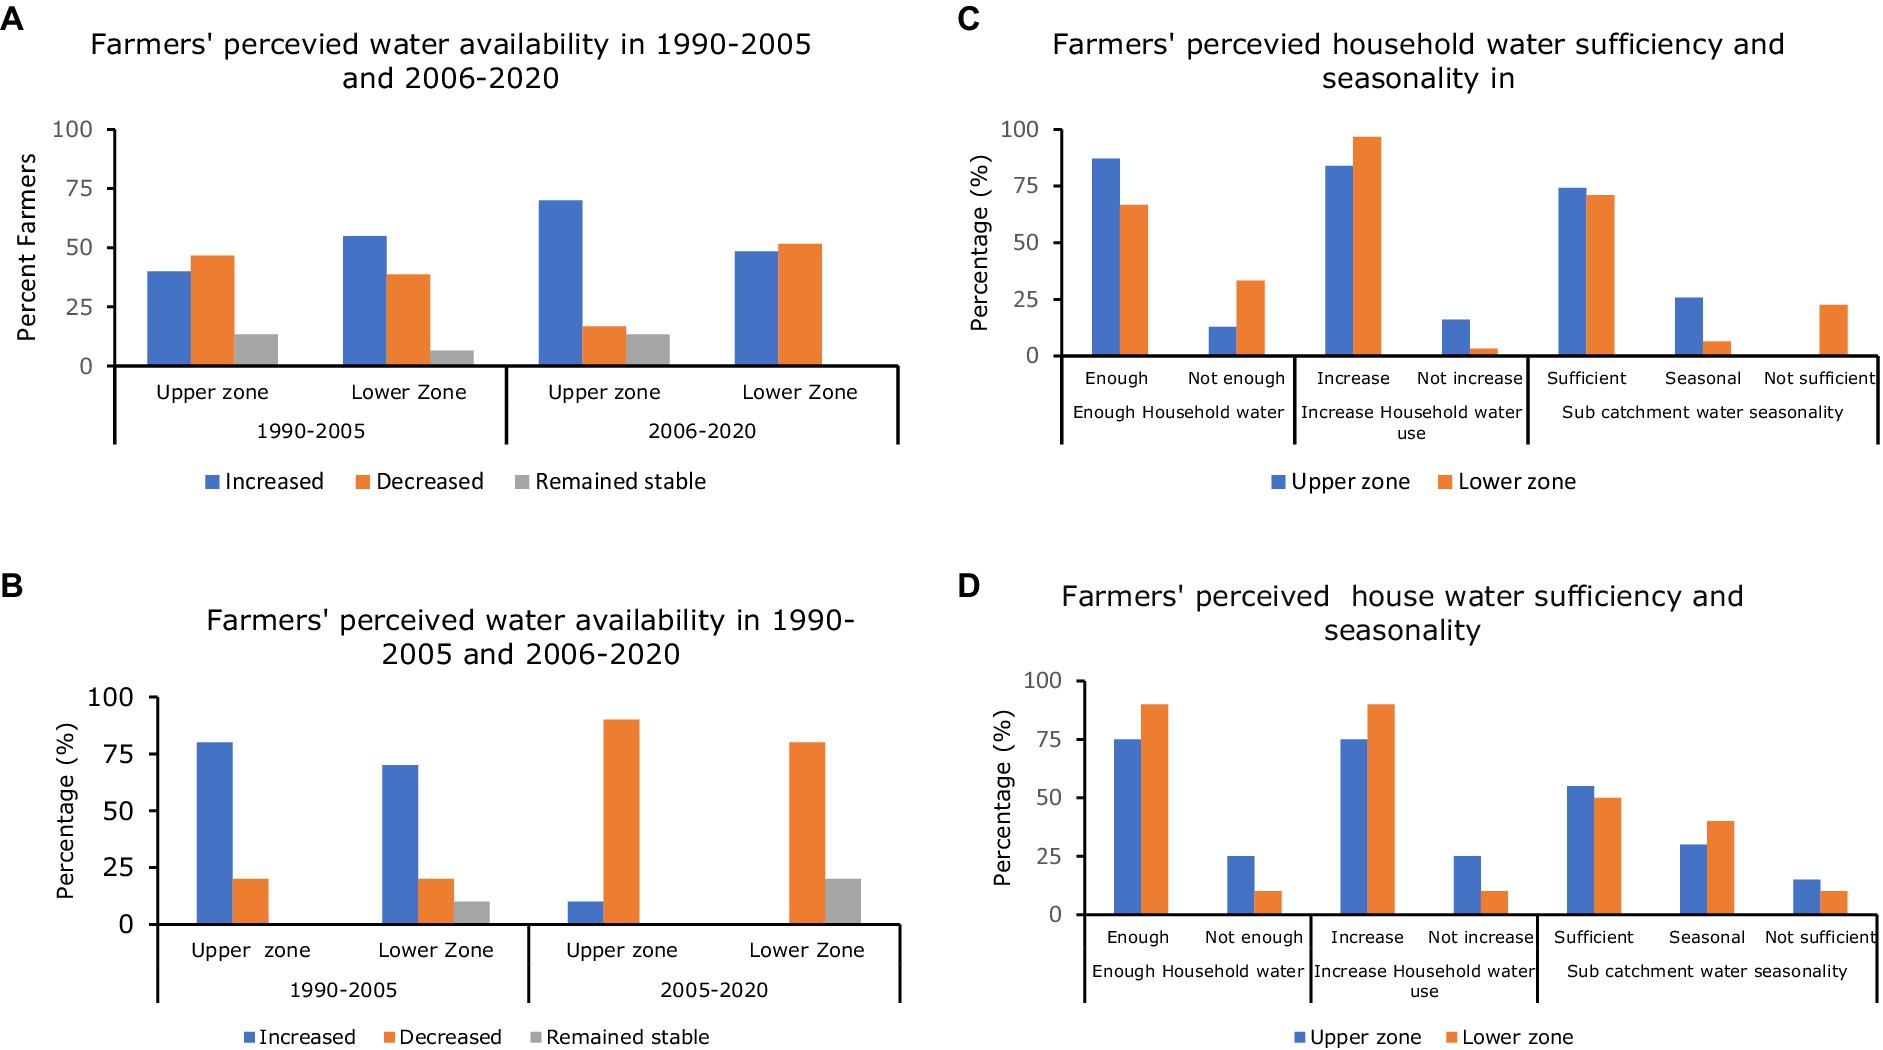
Figure 6. 1990–2005 and 2006–2020 household perceptions on water availability in River Manafwa Sub-Catchment (A) and Sipi River Sub-Catchment (B); perception household on water sufficiency and seasonality in River Manafwa Sub-Catchment (C) and Sipi River Sub-Catchment (D).
Overall, households surveyed in all SRSC’s sub counties perceived water availability to have decreased in 2006–2020 relative to 1990–2005 (Figure 6B). A higher proportion of households in the upper zone (90%) reported decreased water availability than in the lower zone (80%) (Figure 6B). Besides, 87% of participating farmers in the lower SRSC perceived enough household water. However, almost the same farmers (84%) indicated that they would as well increase household water use (Figure 6C). Overall, farmers in SRSC perceived that the household water was enough and that the sub-catchment’s water seasonality was sufficient. Over half of respondents in SRSC’s sub counties perceived sufficient water availability at sub-catchment level and 83% reported that their daily household water use was enough (Figure 6D). However, it was evident that the same number of respondents would increase their household water usage in case they could get more water. As such, households spent more time to reach and to queue up before they got their turn to fetch water. More than a half households spent more time queueing up for water compared to the time they spent to reach the water source from their households. For SRSC, most household preferred to increase water use for irrigation and washing. Similarly, their preferred purpose to increase water use corresponded with water use/availability challenges and water uses most affected by water scarcity reported during the FGDs and by the key experts.
It was evident that 89% key experts reported that tree cover loss correspondingly resulted in reduction in water availability in their districts. Figure 4F presents household perception of the effect of tree cover on stream water level and flooding. Also, Figure 5B presents current and future effect of tree cover on hydrological extremes including floods, droughts, land/mudslides as perceived by both farmerss and key experts. Over three quarters households reported that trees were very helpful in controlling current hydrological extremes (Figure 5B). Sixty three percent key experts (Figure 5B) perceived that trees play an important role in controlling current hydrological extremes citing however, that the current tree cover was low to have a significant effect on hydrological extremes within the sub-catchments. A high percentage of both key experts and households perceived that trees are very helpful in minimizing future hydrological extremes. Besides, most sub counties that were noted by farmers to be prone to flooding had undergone deforestation as cited by key experts. The study results show variations in tree cover and water availability perceived by farmers across all the two zones. Nearly three quarters of farmers in lower zone of RMSC perceived a decrease in seasonal rainfall duration compared to more than half of the farmers in upper RMSC that instead perceived an increase in seasonal rainfall duration (Figure 5C). Similarly, more farmers in upper RMSC perceived an increase in seasonal rainfall amount and number of rainy days compared to those in the lower zone. Correspondingly, majority of the participating farmers in upper and lower SRSC perceived a decrease in both seasonal rainfall duration and number of rainy days (Figure 5D). Correspondingly, 60% of the farmers in the lower zone of SRSC perceived an increase in rainfall amount (Figure 5D).
3.3 Perception of spatial and temporal variation in precipitation distribution across Elgon
Precipitation distribution has varied both spatially and over time as reported by FGD participants across all the nine sub counties. During the seasonal calendar exercise, participants were asked to share their experience of the 1990–2005 and 2006–2020 average monthly precipitation. Figure 7 presents the 1990–2005 and 2006–2020 average monthly CHIRPS precipitation data for the two sub-catchments in MEWT that was compared with precipitation perception of FGD participants’ across the two zones. From the CHIRPS rainfall data (1990–2020) for both sub-catchment, the maximum monthly rainfall was 250 mm. Therefore, each zero-symbol was multiplied by a rainfall factor of 50 mm to convert the monthly perceived rainfall into monthly amount. Basing on CHIRPS precipitation data, it was evident that except for January, average monthly precipitation was higher during 2006–2020 than 1990–2005 period in RMSC. Similarly, in SRSC, average monthly precipitation (November–March) was higher during 2006–2020 than 1990–2005 period. The reverse is true for April–October months in SRSC (Figure 7). For both zones in the RMSC and SRSC considered for FGD and seasonal calendar exercise across the region, precipitation variation was generally satisfactory. Overall, from analysis of CHIRPS precipitation, there is an increase and decrease in the 2006–2020 average monthly precipitation for RMSC and SRSC, respectively. These results correspond with the findings of the FGD exercise (Figure 7). For instance, in RMSC, participants generally perceived higher average monthly precipitation with clear trends more pronounced in the lower zone (Figure 7D). Generally, a lower average monthly precipitation with clear trends more noticeable in the lower zone (Figure 7F) was reported in SRSC.
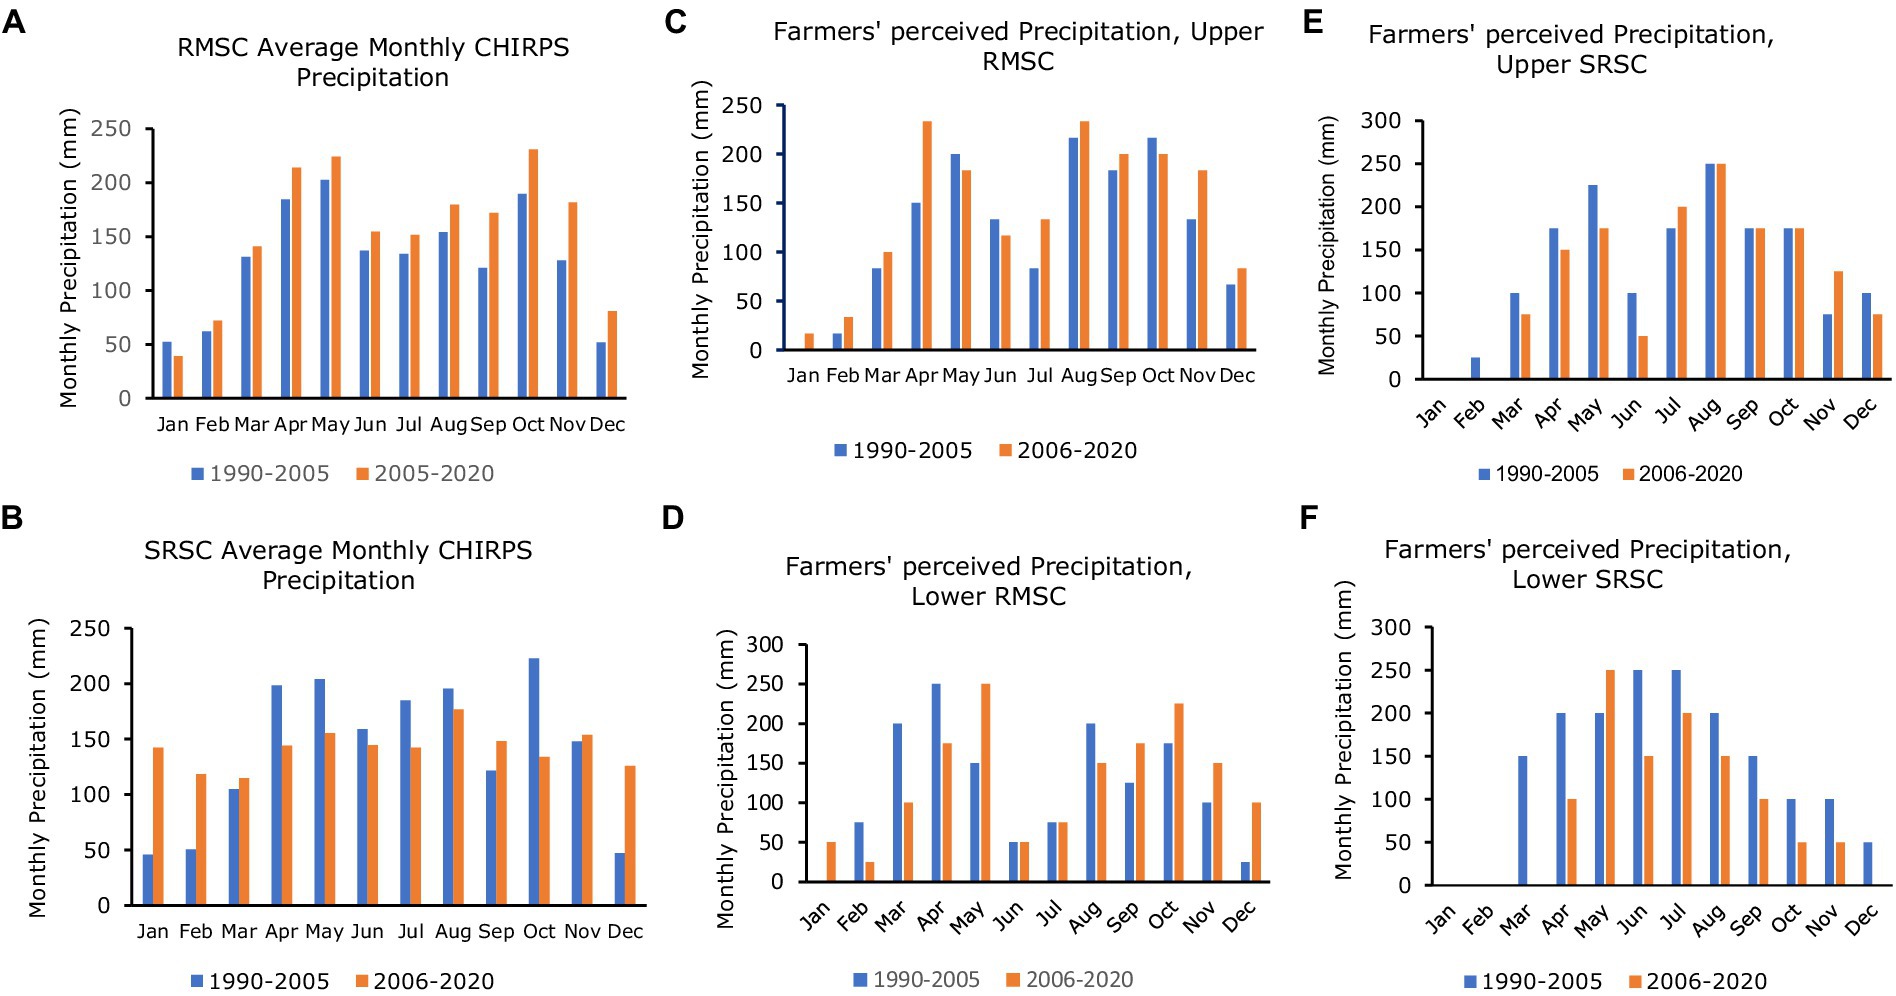
Figure 7. Average Monthly CHIRPS Precipitation in River Manafwa Sub-Catchment (A) and in Sipi River Sub-Catchment (B); 1990–2005 and 2006–2020 Farmers’ Perception on Monthly Precipitation of upper and lower zones in River Manafwa Sub-Catchment (C,D) and in Sipi River Sub-Catchment (E,F).
3.4 1990–2020 hydrological extreme events across MEWT
In both sub-catchments, participants experienced more events in the recent years (2006–2021) compared to the past (1990–2005). Also, more events were experienced by farmers in RMSC compared to SRSC. Most extreme events were experienced in 1997 and 2012 for RMSC and SRSC, respectively. Throughout the 1990–2021 period, extreme flood events generally occurred in the upper zone of RMSC. For both sub-catchments, extreme drought events were generally experienced by farmers in the lower zones. Also the effect of extreme flood events were experienced by farmers in the lower zone compared to those in the upper zone (Tables 2, 3).
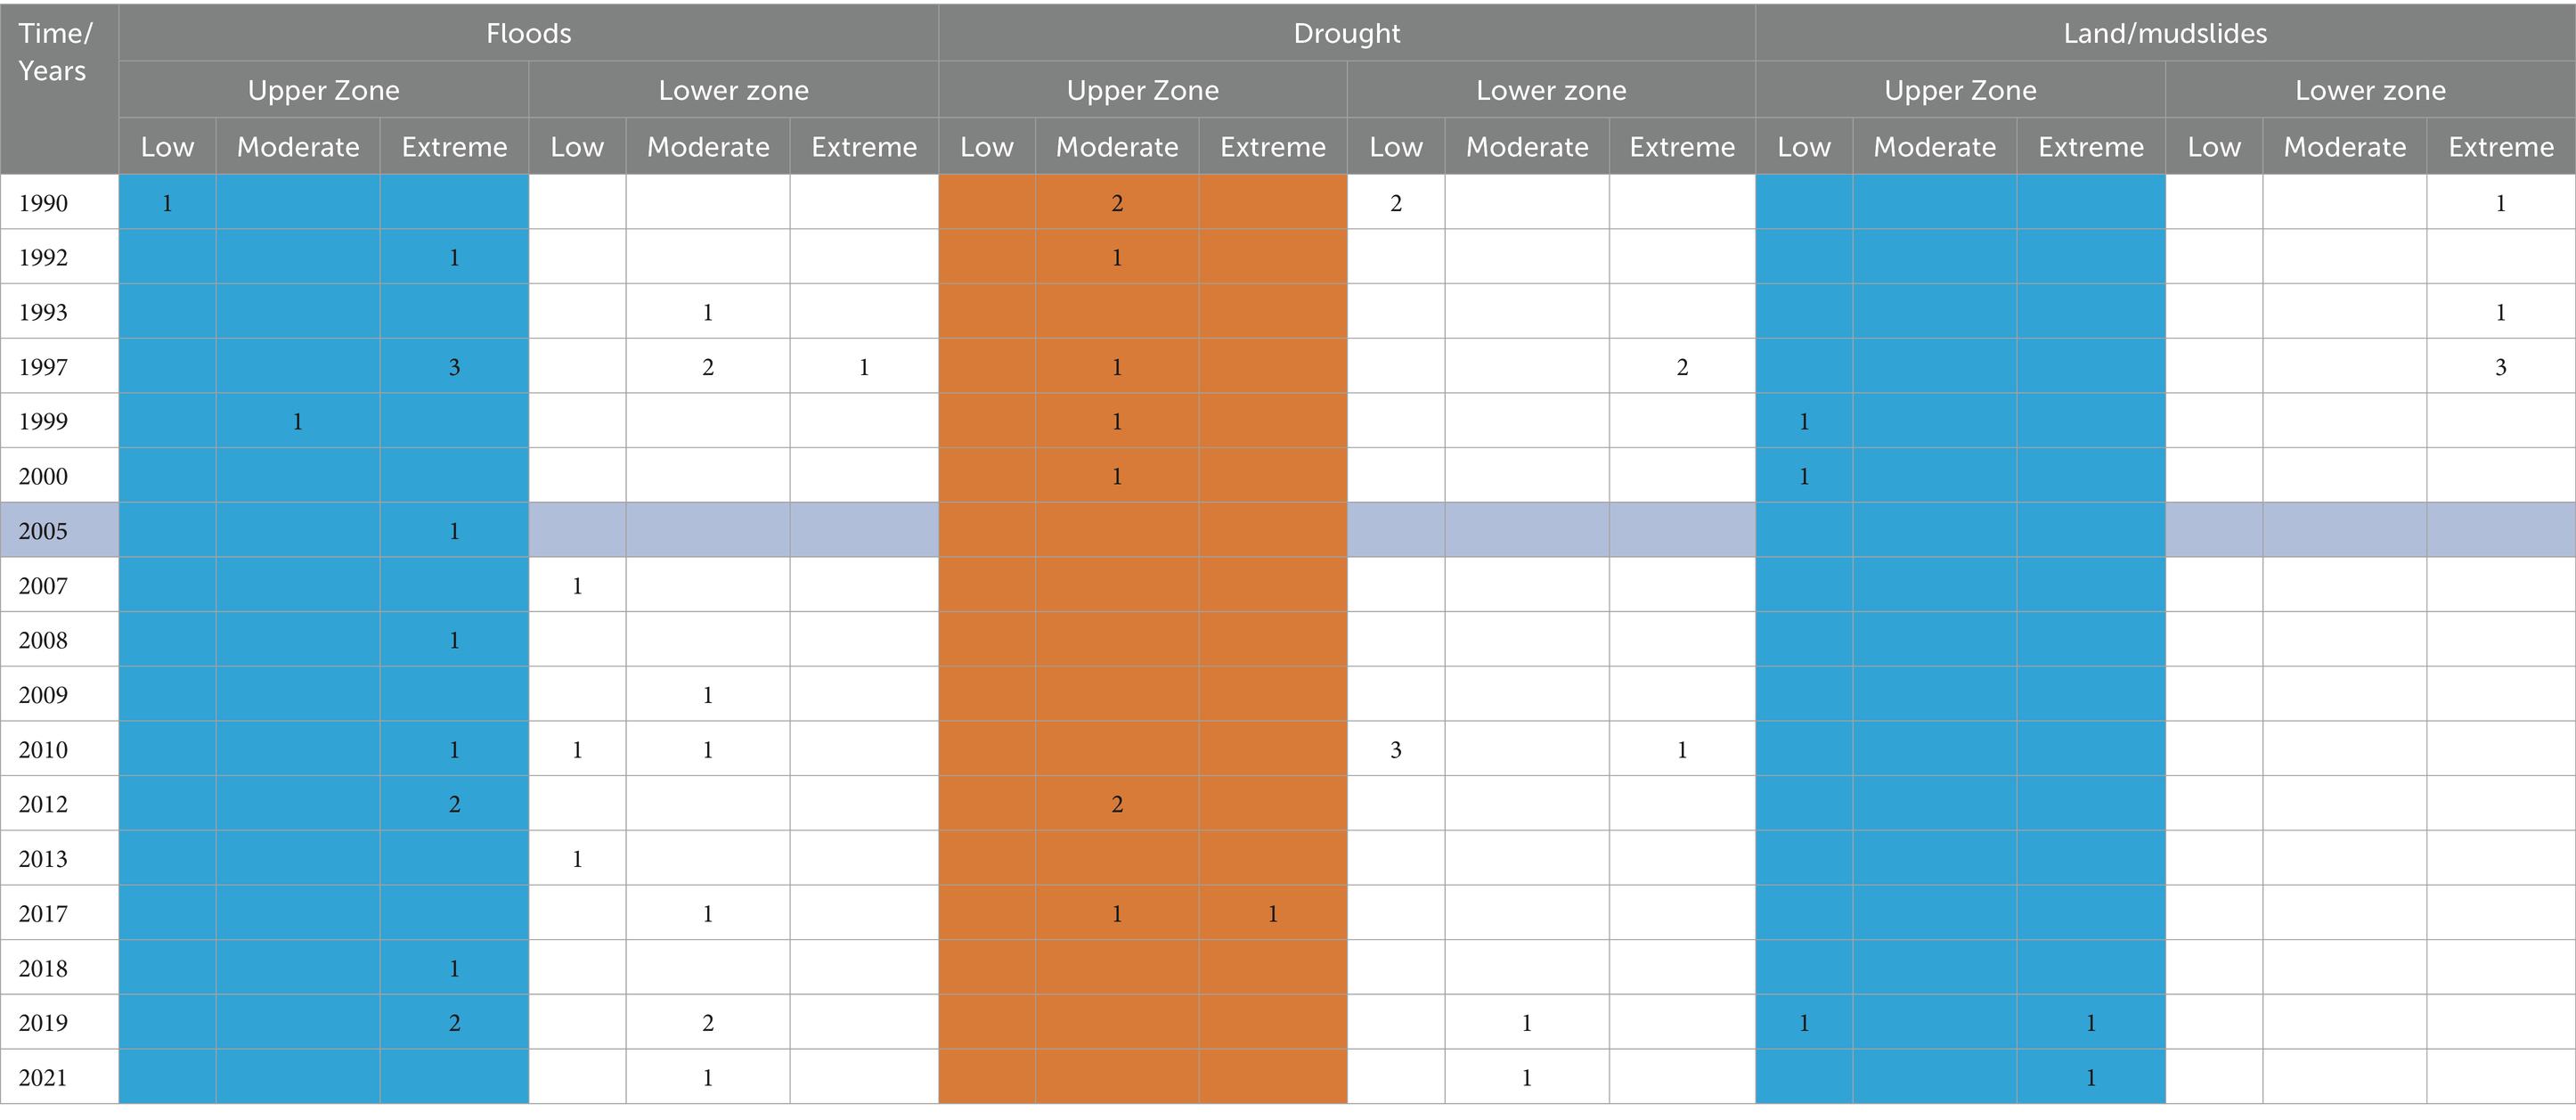
Table 2. RMSC timeline of events.
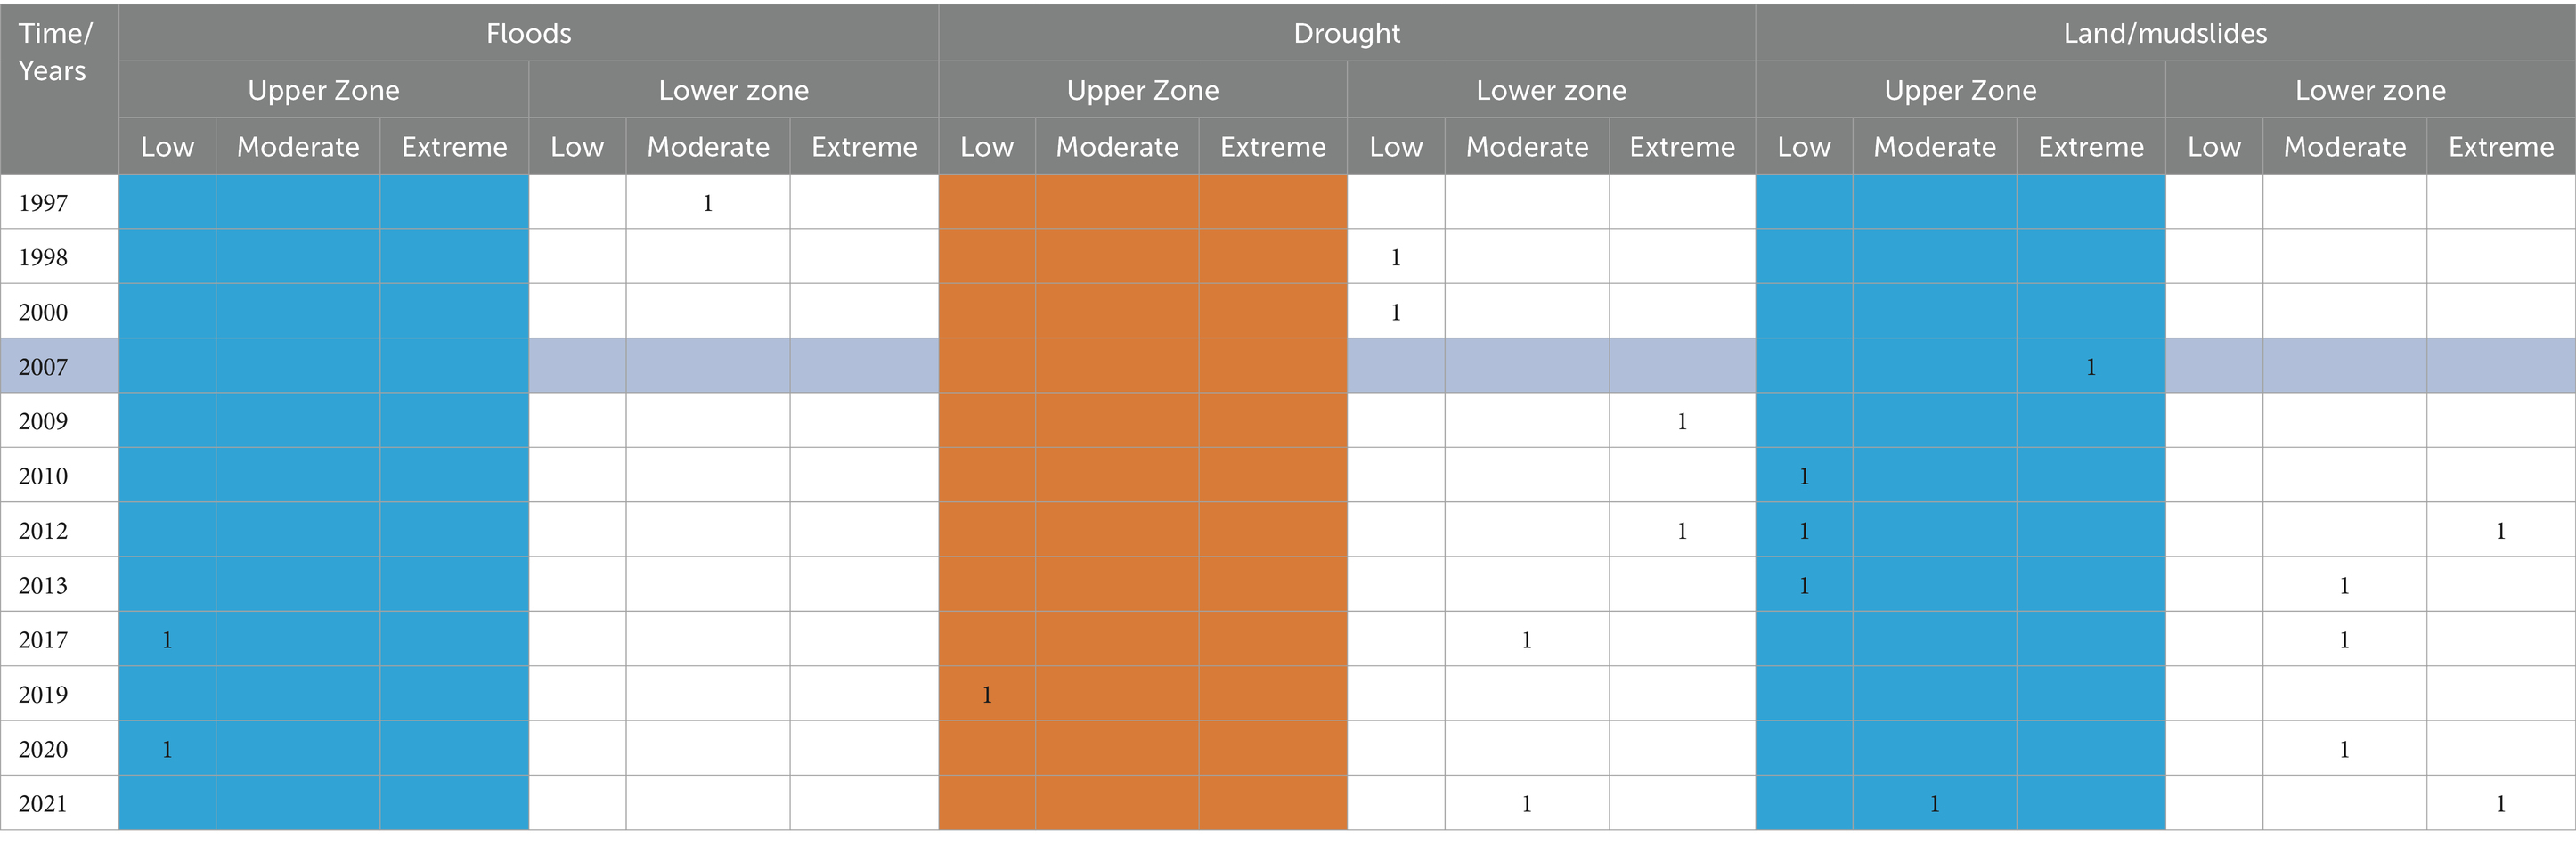
Table 3. SRSC timeline of events.
3.5 Transect walks
Results from the transect walk were summarized as past and current tree species and water sources that existed in selected areas. These results are indicators of tree cover and water changes across the high hillside, mid-hillside and valley; ownership (access to) trees and water and observations about trees and water. The dominant tree cover types as perceived by farmers in both MRSC and SRSC (Table 1) were confirmed from the transect walks along the zones of selected hills. As emphasized during the FGD, various indicators of tree cover and water changes were observed during the transect walks. For instance, remains of dominant indigenous tree species with bushes that promoted free and selective firewood collection. Besides, it was evident that most people settled downhill encouraging establishment of indigenous trees uphill. Also, human activities such as charcoal burning and timber logging for exportation to major cities and towns was realized during the transect walks. For the case of water availability, some (current) water sources used by households were observed besides historical water sites previously used by same households. The variation in trees grown by farmers as well as the difference in water resources used by households across the upper and lower zones of RMSC and SRSC in Mt. Elgon was confirmed. This also gave insights on farmers’ perceptions regards water availability. Considering ownership of tree and water resources, all the eight hills where transect walks was conducted were communally owned with every person allocated a plot of land and thus Individual (customary) land ownership including resources on land. In the lower zone of SRSC, at least 50 m from top of each selected hill was left uncultivated and thus reserved to minimize the effects of hydrological extremes. Other key observations noted during the transect walks across the zones of MEWT included increased adoption of eucalyptus trees; zero-grazing livestock systems; uprooting of tree stamps for firewood; cutting indigenous trees and adopting fast growing eucalyptus, unhealthy agroforestry coffee systems besides sites where rampart floods and mud/landslides had lately occurred (see Supplementary Table S1).
4 Discussion
The present study was designed to explore and understand spatial and temporal variation of tree-cover changes and water availability in Mt. Elgon Region, Uganda. The study findings can provide insight into the system changes over the past decades in MEWT with respect to changes in tree cover (gain/loss) and in water availability. Major changes in tree cover and variation in surface water availability examined here are based on diverse scientific literature (Marchant et al., 2018; Kilama Luwa et al., 2020; Bunyangha et al., 2021) and recent developments and policies concerning use of land, forest and water resources (Petursson et al., 2013; Russell et al., 2017) within the Mt. Elgon Region.
4.1 Changes in tree cover and water availability in MEWT
This study highlights views by PRA participants of the changes in tree cover and water availability across different zones in MEWT. Overall, changes in tree cover follow different patterns across the two zones in both RMSC and SRSC. Farmers across the two zones perceived tree cover gain and loss differently. For 1990–2020 period, there was a reported overall gain and loss in SRSC and RMSC, respectively. Also, key experts perceived an overall decrease in tree cover during 1990–2020. Generally, farmers and key experts perceived that the plantations and natural forest cover increased during 1990–2005 and decreased during 2006–2020. Other studies conducted across larger spatial levels have showed similar trends in tree cover. For instance, the national assessment (Mwanjalolo et al., 2018; Kilama Luwa et al., 2020) and studies by Mugagga et al. (2012), Sassen (2014), and Russell et al. (2017) reported a decline in tree cover especially outside the Mt. Elgon national forest park.
The tree cover change (gain and loss) presented in this study unmask a general decline in MEWT’s tree cover that can be partly attributed to population pressures such as demand for forest products and need for settlement and agricultural land extension/expansion among other factors. Local stakeholders’ (farmers and key experts) perceptions on historical tree cover and water availability complemented the existing data gaps in explaining the changes in tree cover and water availability. There was notable contradictions in perceptions on tree cover changes among farmers and key experts. For instance, the 1990–2005 decreasing natural forest cover trend in MEWT perceived by key experts was contrary to farmers’ perception that revealed a gain in forest cover during the same period. In particular, key experts viewed that natural forest and overall tree cover had declined since 1990 despite tree planting and conservation efforts especially in government’s natural forest park and reserves besides tree plantations on private lands. However, key experts backed up their perceptions with detailed explanations. Arguably, farmers’ perceptions on changes in tree cover and water availability was based on and limited to their local experiences (observations) regards use of the forest and water resources. It implied for instance that farmers living in sub-counties where agroforestry and private tree plantations was highly practiced perceived an increase in tree cover compared to those staying in sub counties where massive deforestation took place. The key experts’ reporting on sub counties that experienced deforestation, restoration and conservation corresponded with farmers’ perceptions on tree cover changes in most selected sub counties considered for this study.
Findings from this study to a large extent show variations in perceived changes in water availability. Key experts perceived that overall tree cover loss since 1990 correspondingly resulted in reduction in water availability in both SRSC and RMSC. 57% of all surveyed household respondents reported an increasing water availability during 1990–2005 while 52% of all surveyed household respondents perceived decreasing water availability during 2006–2020. Generally, 89% key experts perceived a decrease in water availability across the MEWT districts from 1990 to 2020. Declining trends of natural tree cover especially outside the Mt. Elgon national forest park pose great threat to water resources originating from these forests. According to farmers and key experts, this has led to drying of some water sources (streams and springs) especially during dry-season leading to increased long distances trekked and more time spent in search for water especially in the lower zones. Our study results are similar to findings of Ellison et al. (2012) and Creed et al. (2019) that also report drying of water resources due to tree cover loss.
While assessing the impacts of climate change and land-use change on hydrological extremes in the Jinsha River Basin, China, Chen et al. (2020) concluded that there is relatively little impact from LULCC on runoff extremes with climate change dominantly contributing to changes in hydrological extremes for over half a century period of time. Despite a significant positive correlation between LULC changes and flood peaks at sub-catchment level, Sanyal et al. (2014) argue that catchment characteristics such as shape and slope may play an important role in causal relationship between LULCC and flood peak flows at the basin outlet.
Tree cover loss is often accompanied with changes in water availability (Creed and van Noordwijk, 2016; Ellison et al., 2017; Ellison, 2018; Staal et al., 2020). For MEWT, as perceived by PRA participants, there was variation in tree cover and water availability changes across all zones. Though farmers in SRSC perceived an overall increase in tree cover, they also experienced a decrease in water availability from 2006 to 2020. Also, a higher proportion of households in upper zone of SRSC experienced a higher decline in water availability in their locality compared with household in the lower zone that perceived the highest levels of tree cover in their locality. PRA participants were highly concerned about tree cover changes across all zones of MEWT. Particularly, more concern was about the loss of natural tree cover that was perceived to negatively affect the surface water sources. Changes in tree cover change and water availability can be partly explained by the tree species grown. In SRSC, and upper zone of RMSC, where eucalyptus is the dominant tree species (Table 1), has experienced water scarcity in the recent decades. Most farmers most farmers grow eucalyptus despite being aware of its detrimental effect on water resources. One farmer reported ‘…in case one farmer plants eucalyptus trees, its effect on soil water consumption and crop yield will be felt on the neighboring farm, forcing the neighboring farmer to plant eucalyptus as well….” Similar studies such as Selamyihun (2004), Alemie (2009), and Mugunga (2016) conducted across east-Africa, highlighting the effect of eucalyptus on soil and water conservation recommend that: farmers with very small land should avoid eucalyptus woodlots to minimize significant yield losses; eucalyptus planting and (small) woodlots should be outside riparian zones; a holistic and integrated planning and management that sustains agricultural production, environmental conservation and ecosystem protection should be considered.
Unlike the upper zone’s water sources that mainly originate from the Mt. Elgon national forest park, most water sources in the lower zones are developed on private land. As such, lower zones’ water catchment areas are often degraded thus affecting quantity and quality of most water sources. Also, gravity flow scheme water supply coverage was low besides reduction in protected spring flows during dry season. Based on literature (GoU and UNFPA, 2010; Ministry of Water and Environment, 2018), household surveys, focus face-to-face interviews with key experts, focus group discussions and transect walk across Mt. Elgon region, it was noted that increasing population growth, customary land tenure system and tree cover gain/loss influences the quantity and quality of most water resources. As such, this economically impacts on the productivity and performance of several water supply infrastructure facilities such as the water treatment plants and major irrigation schemes, besides flooding, landslides and drying up of some river streams.
According to Van Loon and Laaha (2015), water availability at catchment level can be partly explained by variation in precipitation seasonality, duration and amount. Comparison of 1990–2005 and 2006–2020 CHIRPS precipitation data indicates a general increase and decline in the average monthly precipitation in RMSC and SRSC, respectively, in the last decade. The spatial and temporal variation in precipitation distribution as perceived by FGD participants can be partly explained by the zonal altitude differences. Generally, local communities in upper (higher altitude) zones experience favorable climate compared to those in lower zones. Also, FGD participants’ perceptions of 1990–2005 and 2006–2020 precipitation were in agreement with trends in CHIRPS precipitation data (Figure 7). However, there was variation in perceptions across the zones of the region. The seasonal calendar exercise demonstrated that local stakeholders’ perceptions can provide localized context of variation in precipitation (and thus water availability) especially in areas where meteorological stations are lacking (Bomuhangi et al., 2016). The main drivers of the sub-catchments’ streamflow are precipitation, tree cover and actual evapotranspiration. Variability in available water in MEWT can therefore be best explained by changes in the region’s hydrological system rather than consumption (abstraction) by the growing human population. Understanding the relationship between tree cover change and patterns hydrology and feedbacks (van Noordwijk et al., 2020) at landscape/catchment level is paramount for contested landscapes such as the MEWT as it can facilitate a dialogue between resources actors (stakeholders) to reach consensus. Variation in perceptions among stakeholders on tree cover changes and water availability can be explained by: 1-experience (years spent in the area); 2-direct interaction/benefits from trees and water availability; 3- adequate knowledge on scientific literature forests/trees and water availability and; 4- information about existing water and forests/trees related policies among other factors. In this aspect, participatory approaches that involve scenario evaluation such as Q-methodology, fuzzy cognitive mapping and serious gaming that can include local cultural perspectives in assessment of water availability in agroforested landscapes and water towers maybe appropriate.
4.2 Data uncertainty
The average age of 56 and 54 years for interview respondents and FGD participants is considered appropriate given the study period of 1990–2020. However, the capability of the memory of participants and respondents to remember the data for the past 30 years could not be guaranteed. Besides, the ambiguity of some terms used in the study could have compromised the study. For instance, some participants took long to understand the difference between the three tree cover categories used in the study. Specifically, perception on 1990–2005 changes in tree plantations and agroforestry was often mixed up by some participants. Also, given that the study was conducted in more than one language, some information could have been misinterpreted by either the field staff or the participants/respondents. These uncertainties could have affected accuracy and effectiveness of participants’ perception data. As such, statistics from the study results can be treated by various decision-makers with some level of certainty.
There was limitation of some tools. For instance, given the topography of the study sites, it was increasingly challenging especially for field staff to reach the highest points of the selected hills during the transect walks. This was because during the morning time preferred for transect walks, most participants were working on their farms/fields. Besides, generating a collective diagram during/after the transect walk was difficult due to abrupt rainfall in the study area and most participants were impatient after transect walks. Data recording using audio and devices was useful for further interpretation however, this meant more time spent during data analysis (McMullin, 2021). In their study, “Conducting in-depth interviews with and without voice recorders: a comparative analysis,” Rutakumwa et al. (2020) observed that using the audio recorder can influence the nature of data produced by respondents yet its absence can be perceived as a threat to validity and credibility of collected data by the research community. Highlighting the major national/regional events that took place during 1990–2005 was useful in refreshing memories of the PRA respondents however, this sometimes resulted in diversion of participants from the study topic and thus time wastage. Mixing male and female participants during FGDs was useful in generating collective perceptions but could lead to intimidation of females in some study sites. In a few cases, there was tendency of local leaders to dominate the FGDs (Mukherjee, 2018). In case, community members have had bad experiences related to land acquisition, etc. with ‘outsiders’ visiting their community, study participants are likely to respond negatively, hesitate and fear to talk openly. This was experienced by the research team in the lower zone of RMSC where communities were experiencing land tenure insecurities. Farmers thought that the research team was from Uganda’s central government with an interest to acquire land near River Manafwa to set up water reservoirs. Consequently, the transect walk activity in one of the study site was halted since it created more anxiety, alarming the community.
Thus, basing on experience, one has to be careful and sensitive while choosing the PRA tools/techniques to be used in a particular study. Preparatory activities prior PRA field work may involve good knowledge of the community, acquisition of reliable contacts and the entire process requires adequate time (Chambers, 1994a; Stadler, 1995; Avitabile et al., 2012). Besides, there is need to assess the local knowledge’s limitations and constraints to prevailing community systems. Also, stakeholders’ perceptions and knowledge can be broadened, deepened and complemented with other resources, etc.
4.3 Key lessons learned
Experience and lessons learned concerning understanding changes in tree cover and water availability using the PRA approach is presented. Testing the data collection instruments (questionnaires) on few selected participants provided insightful feedback that helped in improving the survey and thus became clear to implement. Mixing farmers from different villages during the FDGs led to a broad view and clarity among household perceptions on changes in tree cover and water availability. Some participants especially in the upper zone were not confident and less literate thus needed further guidance and encouragement to speak throughout the discussion. The seasonal calendar and timeline of event exercises were very interesting to all participants as they involved backing their responses with evidence besides seeking for consensus during the entire process. Since the study area was an agricultural landscape, the research teams conducted transect walks before the FGD in all the study sites to reduce on the waiting time for participants. Due to COVID-19, there was several burials in addition to routine introduction ceremonies and wedding celebrations in most villages. This led to interruptions in the planned participatory field activities besides impatience of some participants. In most of the FGDs, more than the planned number of participants joined the discussions thus encouraging ‘small groups’ discussions. Given the limited number of invited FGD participants and following the community’s culture and tradition, most local leaders wanted to always be part of the FGD. Besides, male household representatives invited preferred to have the women left out of the discussions especially when there was more than the required number of participants. Even after explaining the importance of gender balance, the men intended to dominate the discussion rendering the women less active in addition to women isolating themselves from men.
Notably, most male participants did not want to sit with their female counterparts and thus the research team adjusted protocol during the FGDs. Also, including multiple choice options on questionnaire was faster than manual data entry. Besides, the need to be ready to adjust fieldwork plans was noted. For instance, land security concerns in one of the study sites were brought to attention leading us to changing one of the study locations in the lower zone of RMSC and postponing the FGD and the household survey. In the end, research team proceeded with the study as planned. The research team ensured that FDG and household interviews in this particular study site were conducted from the sub county headquarter so as to ensure safety of both the field staff and participants. In case study meetings were held at sub-county headquarters, there was some interruption by local government extension staff. Also, rainfall disrupted field activities especially in the upper zones of the study area thus delaying and prolonging FGDs. One participant said “…whenever it clocks mid-day (12:00 noon), be ready to expect rainfall in our village and the surrounding areas….” Besides, during all the FGDs, there was a lot of sensitivity regards tree-cutting activities with some respondents heard trying to direct colleagues on what answers to give. In some zones of the study area, due to land related conflicts, there was need to involve local government leaders at all levels. Also, during some transect walks, community members who wanted to join the exercise with the aim of understanding the objectives the exercise were met.
4.4 Policy implication
The stakeholders’ perceptions and knowledge on tree cover changes and water availability is a useful indicator of increasing population and land use pressure in the MEWT. This can be a source of practical information useful to decision makers in land use planning, environmental management, water resources management and thus sustaining the management of agroforested landscapes (Bunyangha et al., 2021). The findings of this study also have implications regarding the way trees and water resources are currently managed with particular reference to promotion of agroforestry and tree plantations on private land besides water catchment protection. There is need to systematically assess privately owned tree plantations so as to understand changes in tree species, their management and involved stakeholders at both local and regional levels. Incentives should be provided where possible to private land owners to plant and retain indigenous trees on their land for sustainability. Research promoting tree planting/agroforestry should be participatory to respond to community needs and encourage easy adoption. Scientists need to help local people understand tree-water relations. However, organizations that are promoting tree growing and water resources management should be aware that there is a discrepancy between the local people perceptions and the science perceptions of the role of trees in relation to water availability. Also, research findings need to be sustainably disseminated and linked to policy and decision making regarding land-use planning, forest and water management. Trees are useful in regulating water quantity and quality. Despite enormous scientific research on forest-water research, predicting and quantifying the effect of forests/trees on water availability still remains challenging. Policy makers in Uganda have taken some measures designed to promote tree planting and protect rivers and streams from drying up. However, these efforts are not jointly planned and funded and have thus not always realized the desired outcome. To address the key management issues in the study area and in Uganda at large, there is need to prioritize and thus significantly fund other natural resources departments at local government other than water. This calls for sustainable agroforested landscape management and adaptive management strategies of forest and water resources.
5 Conclusion
By applying five PRA tools, the current study explored local socio-ecological knowledge and its contribution to an improved understanding of the Forest-Water-People nexus. The case study was Mt. Elgon water tower, a contested agroforested landscape located in eastern Uganda. PRA tools can give insights on changes in tree-cover and water availability in a data poor region like Mt. Elgon, Uganda. Basing on stakeholders’ perceptions, there was noticeable similarities and differences in tree cover and water availability across the two sub-catchments. The study results reveal that stakeholders perceived a decrease in water availability and a decrease in overall tree cover for the period 1990–2020. More farmers in Sipi River Sub-catchment perceived a decrease in water availability during 2006–2020 compared to 1990–2005 period. Tree cover change follows different patterns across the two altitudinal zones in both River Manafwa and Sipi River sub-catchments. Key experts perceived a decrease in overall tree cover and in natural forest cover during the 1990–2020 period. According to farmers, water availability during 2006–2020 period increased and decreased in River Manafwa and Sipi River sub-catchments. Differences between two zones for 2006–2020 water availability were noticeable in both River Manafwa and Sipi River sub-catchments. Since 2006, average monthly precipitation has increased and decreased in River Manafwa and Sipi River sub-catchments, respectively, corresponding with FGD exercise findings.
Structured interviews were useful for comparing household perceptions on changes in tree-cover and water availability across the MEWT. The FGDs were useful in highlighting and comparing the indicators of changes in tree-cover and water availability and thus collective perceptions about the changes. The seasonal calendar was particularly useful in comparing perceived rainfall- a clear indicator of water availability with CHIRPS rainfall data across the study area for 1990–2005 and 2006–2020. The timeline was suitable for highlighting participants experience with tree-cover and water related events and their extreme levels across the zones of sub-catchments. The transect walks by direct observations of the field staff was useful for validating the datasets collected from the four other PRA tools. Specifically, the transect walks were useful in validating and comparing various indicators of tree cover and water availability changes across the zones. PRA tools were helpful for documenting the perceptions of local people. This cannot replace reliable data resulting from large-scale efforts for monitoring changes and variations in tree-cover and water availability. This is underlined by the variations in the perceptions of different people in different areas. Overall, this study gives insights regards 1990–2020 changes in tree cover and water availability across the Mt. Elgon region based on multilevel stakeholders’ perceptions. Based on the results of this study it cannot be concluded that PRA tools are helpful in improving our understanding on the relationship between tree-cover and water availability. Therefore, results of the PRA analysis should be interpreted with care and merely suggest that there is a considerable variation in changes in tree cover (gain or loss) and water availability patterns in MEWT. The primary results of this study shed light on general understanding that can further inform detail hydrological studies related to Forest-Water-people nexus.
Data availability statement
The original contributions presented in the study are included in the article/Supplementary material, further inquiries can be directed to the corresponding author.
Ethics statement
Written informed consent was obtained from the individual(s) for the publication of any potentially identifiable images or data included in this article.
Author contributions
GK: Conceptualization, Data curation, Formal analysis, Methodology, Visualization, Writing – original draft, Writing – review & editing. JB: Formal analysis, Visualization, Writing – review & editing. JG: Formal analysis, Supervision, Writing – review & editing. CM: Conceptualization, Formal analysis, Supervision, Writing – review & editing.
Funding
The author(s) declare financial support was received for the research, authorship, and/or publication of this article. This research was funded by the Wageningen University through the Scenario Evaluation for Sustainable Agroforestry Management (SESAM) project that was funded by its Interdisciplinary Research and Education Fund (INREF). The article processing fee was funded by the Enabling Dialogue Project [ARSF3-ECR-026-Uganda] at the National Forestry Resources Research Institute (NaFORRI) of NARO.
Conflict of interest
The authors declare that the research was conducted in the absence of any commercial or financial relationships that could be construed as a potential conflict of interest.
Publisher’s note
All claims expressed in this article are solely those of the authors and do not necessarily represent those of their affiliated organizations, or those of the publisher, the editors and the reviewers. Any product that may be evaluated in this article, or claim that may be made by its manufacturer, is not guaranteed or endorsed by the publisher.
Supplementary material
The Supplementary material for this article can be found online at: https://www.frontiersin.org/articles/10.3389/frwa.2024.1283574/full#supplementary-material
References
Ahammad, R., Stacey, N., Eddy, I. M. S., Tomscha, S. A., and Sunderland, T. C. H. (2019). Recent trends of forest cover change and ecosystem services in eastern upland region of Bangladesh. Sci. Total Environ. 647, 379–389. doi: 10.1016/j.scitotenv.2018.07.406
Alemie, T. C., The effect of Eucalyptus on crop productivity, and soil properties in the Koga watershed, Western Amhara Region, Ethiopia. (2009).
Avitabile, V., Baccini, A., Friedl, M. A., and Schmullius, C. (2012). Capabilities and limitations of Landsat and land cover data for aboveground woody biomass estimation of Uganda. Remote Sens. Environ. 117, 366–380. doi: 10.1016/j.rse.2011.10.012
Bar-on, A. A., and Prinsen, G. (1999). Planning, communities and empowerment: an introduction to participatory rural appraisal. Int. Soc. Work. 42, 277–294. doi: 10.1177/002087289904200303
Bennett, B. M., and Barton, G. A. (2018). The enduring link between forest cover and rainfall: a historical perspective on science and policy discussions. For. Ecosyst. 5. doi: 10.1186/s40663-017-0124-9
Bomuhangi, A., Nabanoga, G., Namaalwa, J. J., Jacobson, M. G., and Abwoli, B. (2016). Local communities’ perceptions of climate variability in the Mt. Elgon region, eastern Uganda. Cogent Environ. Sci. 2. doi: 10.1080/23311843.2016.1168276
Bonell, M., and Bruijnzeel, L. A., Forests, water and people in the humid tropics: past, present and future hydrological research for integrated land and water management. Cambridge: Cambridge University Press (2005).
Bruijnzeel, L. A. (2004). Hydrological functions of tropical forests: not seeing the soil for the trees? Agric. Ecosyst. Environ. 104, 228–185. doi: 10.1016/j.agee.2004.01.015
Bunyangha, J., Majaliwa, M. J. G., Muthumbi, A. W., Gichuki, N. N., and Egeru, A. (2021). The Egyptian journal of remote sensing and space sciences past and future land use/land cover changes from multi-temporal Landsat imagery in Mpologoma catchment, eastern Uganda. Egypt. J. Remote Sens. Sp. Sci. 24, 675–685. doi: 10.1016/j.ejrs.2021.02.003
Carey, M. A., and Smith, M. W. (1994). Capturing the group effect in focus groups: a special concern in analysis. Qualit. Health Res. 4, 123–128. doi: 10.1177/104973239400400108
Cavanagh, C. J., Protected area governance, carbon offset forestry, and environmental (in)justice at mount Elgon, Uganda, (2015). Available at: https://www.uea.ac.uk/documents/6347571/6549421/RRP+13/08441b9c-4138-4b8d-a13b-7c18e0cdbdb9
Chambers, R. (1994b). Participatory rural appraisal (PRA): analysis of experience. World Dev. 22, 1253–1268. doi: 10.1016/0305-750X(94)90003-5
Charmaz, K., Constructing grounded theory: a practical guide through qualitative analysis. London, Thousand Oaks (Calif.): Sage Publications (2006).
Chen, Q., Chen, H., Zhang, J., Hou, Y., Shen, M., Chen, J., et al. (2020). Impacts of climate change and LULC change on runoff in the Jinsha River basin. J. Geogr. Sci. 30, 85–102. doi: 10.1007/s11442-020-1716-9
Creed, I. F., Jones, J. A., Archer, E., Claassen, M., Ellison, D., McNulty, S. G., et al. (2019). Managing forests for both downstream and downwind water. Front. For. Glob. Chang. 2, 1–8. doi: 10.3389/ffgc.2019.00064
Creed, I. F., and van Noordwijk, M. IUFRO world series volume 10 - Forest and water in a changing planet, vulnerability, adapptation and governance opprtunities. International Union of Forest Research Organizations (IUFRO) (2016).
David, E., IUFRO world series volume 38 Forest and water on a changing planet: vulnerability, ADA forecast. International Union of Forest Research Organizations (IUFRO) (2018).
Derdouri, A., Wang, R., Murayama, Y., and Osaragi, T. (2021). Understanding the links between LULC changes and SUHI in cities: insights from two-decadal studies (2001–2020). Remote Sens. 13. doi: 10.3390/rs13183654
Dibaba, W. T., Demissie, T. A., and Miegel, K. (2020). Watershed hydrological response to combined land use/land cover and climate change in highland, Ethiopia: finchaa catchment. Water 12:1801. doi: 10.3390/w12061801
EAC, UNEP, and GRID-Arendal. Sustainable mountain development in East Africa in a changing climate 2. United Nations Environment Programme East African Community. (2016).
Ellison, D., Background analytical study 2 forests and water background study prepared for. United Nations Forum on Forests. (2018).
Ellison, D., Futter, M. N., and Bishop, K. (2012). On the forest cover-water yield debate: from demand- to supply-side thinking. Glob. Chang. Biol. 18, 806–820. doi: 10.1111/j.1365-2486.2011.02589.x
Ellison, D., Morris, C. E., Locatelli, B., Sheil, D., Cohen, J., Murdiyarso, D., et al. (2017). Trees, forests and water: cool insights for a hot world. Glob. Environ. Chang. 43, 51–61. doi: 10.1016/j.gloenvcha.2017.01.002
Garcia, C. A., Savilaakso, S., Verburg, R. W., Gutierrez, V., Wilson, S. J., Krug, C. B., et al. (2020). The global Forest transition as a human affair. One Earth 2, 417–428. doi: 10.1016/j.oneear.2020.05.002
Geussens, K., Van den Broeck, G., Vanderhaegen, K., Verbist, B., and Maertens, M. (2019). Farmers’ perspectives on payments for ecosystem services in Uganda. Land Use Policy 84, 316–327. doi: 10.1016/j.landusepol.2019.03.020
GoU and UNFPA. The State of Uganda Population Report 2010. (2010). Available at: http://www.popsec.org/publications_3_1868272171.pdf
Govender, T., Dube, T., and Shoko, C. (2022). Remote sensing of land use-land cover change and climate variability on hydrological processes in sub-Saharan Africa: key scientific strides and challenges. Geocarto Int. 37, 10925–10949. doi: 10.1080/10106049.2022.2043451
Gunderman, R. B., and Saravanan, A. (2010). From conflict to collaboration. J. Am. Coll. Radiol. 7, 831–834. doi: 10.1016/j.jacr.2010.08.003
Guzha, A. C., Rufino, M. C., Okoth, S., Jacobs, S., and Nóbrega, R. L. B. (2018). Impacts of land use and land cover change on surface runoff, discharge and low flows: evidence from East Africa. J. Hydrol. Reg. Stud 15, 49–67. doi: 10.1016/j.ejrh.2017.11.005
JICA, Technical manual on participatory approach: technical manual series on the feasibility study on the Forest management plan in the Central Highland in Socialist Republic of Viet Nam, Tokyo, Japan: Japan International Cooperation Agency. (2002).
Kilama Luwa, J., Bamutaze, Y., Majaliwa Mwanjalolo, J. G., Waiswa, D., Pilesjö, P., and Mukengere, E. B. (2020). Impacts of land use and land cover change in response to different driving forces in Uganda: evidence from a review. Afr. Geogr. Rev 40, 378–394. doi: 10.1080/19376812.2020.1832547
Krueger, R. A., and Casey, M. A. focus groups: a practical guide for applied research. SAGE Publications, Inc. (2015).
Lacombe, G., Ribolzi, O., de Rouw, A., Pierret, A., Latsachak, K., Silvera, N., et al. (2016). Contradictory hydrological impacts of afforestation in the humid tropics evidenced by long-term field monitoring and simulation modelling. Hydrol. Earth Syst. Sci. 20, 2691–2704. doi: 10.5194/hess-20-2691-2016
Lang, C., and Byakola, T., A funny place to store carbon: UWA-FACE Foundation’s tree planting project in mount Elgon National Park, Uganda. World Rainforest Movement. (2006).
Loader, R., and Amartya, L. (1999). Participatory rural appraisal: extending the research methods base. Agric. Syst. 62, 73–85. doi: 10.1016/S0308-521X(99)00056-6
Luwa, J. K., Majaliwa, J.-G. M., Bamutaze, Y., Kabenge, I., Pilesjo, P., and Oriangi, G. (2021). Variabilities and trends of rainfall, temperature, and river flow in Sipi Sub-Catchment on the slopes of Mt. Elgon, Uganda. Water 13:1834. doi: 10.3390/w13131834
Mango, L. M., Melesse, A. M., Mcclain, M. E., Gann, D., and Setegn, S. G. (2011). Land use and climate change impacts on the hydrology of the upper Mara River basin, Kenya: results of a modeling study to support better resource management. Hydrol. Earth Syst. Sci. 15, 2245–2258. doi: 10.5194/hess-15-2245-2011
Marchant, R., Richer, S., Boles, O., Capitani, C., Courtney-Mustaphi, C. J., Lane, P., et al. (2018). Drivers and trajectories of land cover change in East Africa: human and environmental interactions from 6000 years ago to present. Earth Sci. Rev. 178, 322–378. doi: 10.1016/j.earscirev.2017.12.010
Masiga, M., Analysis of adaptation and mitigation options: territorial approach to climate change in the Mbale region of Uganda project (shortened version of full report). United Nations Development Programme. (2013).
Mather, A. S. (1992). The forest transition. R. Geogr. Soc. 24, 367–379. doi: 10.1057/978-1-349-95943-3_742
Maviza, A., and Ahmed, F. (2021). Climate change/variability and hydrological modelling studies in Zimbabwe: a review of progress and knowledge gaps. SN Appl. Sci. 3, 1–28. doi: 10.1007/s42452-021-04512-9
McMullin, C. (2021). Transription and qualitative methods: implications for third sector research. Int. Soc. Third-Sector Res. 34, 140–153. doi: 10.1007/s11266-021-00400-3
MEMR, Masterplan for the conservation and sustainable management of water catchment areas in Kenya. Nairobi, Kenya: Ministry of Environment and Mineral Resources. (2012).
Ministry of Water and Environment, Uganda water and environment sector performance report 2018, Kampala (2018). Available at: http://journals.sagepub.com/doi/10.1177/1120700020921110%0Ahttps://doi.org/10.1016/j.reuma.2018.06.001%0Ahttps://doi.org/10.1016/j.arth.2018.03.044%0Ahttps://reader.elsevier.com/reader/sd/pii/S1063458420300078?token=C039B8B13922A2079230DC9AF11A333E295FCD8
Morgan, D. L. (1995). Why things (sometimes) go wrong in focus groups. Sage J 5, 516–523. doi: 10.1177/104973239500500411
Morgan, D., Focus groups as qualitative research. Thousand Oaks, CA: SAGE Publications, Inc. (1997).
Mugagga, F. (2015). The effect of land use on carbon stocks and implications for climate variability on the slopes of mount Elgon, eastern Uganda. Int. J. Reg. Dev. 2:58. doi: 10.5296/ijrd.v2i1.7537
Mugagga, F., Kakembo, V., and Buyinza, M. (2012). Land use changes on the slopes of mount Elgon and the implications for the occurrence of landslides. Catena 90, 39–46. doi: 10.1016/j.catena.2011.11.004
Mugunga, C. P., The use of Eucalyptus in agroforestry systems of southern Rwanda: to integrate or segregate. (2016). Available at: http://library.wur.nl/WebQuery/wurpubs/fulltext/375484
Mukherjee, N., The use of focus group discussion methodology: insighta from two decades of application in conservation. (2018).
Mwanjalolo, M. G. J., Bernard, B., Paul, M., Joshua, W., Sophie, K., Cotilda, N., et al. (2018). Assessing the extent of historical, current, and future land use systems in Uganda. Land 7, 1–17. doi: 10.3390/land7040132
Norgrove, L., and Hulme, D. (2006). Confronting conservation at mount Elgon, Uganda. Dev. Change 37, 1093–1116. doi: 10.1111/j.1467-7660.2006.00514.x
Nyumba, T. O., Wilson, K., Derrick, C. J., and Mukherjee, N. (2018). The use of focus group discussion methodology: insights from two decades of application in conservation. Methods Ecol. Evol. 9, 20–32. doi: 10.1111/2041-210X.12860
Onyutha, C., Asiimwe, A., Muhwezi, L., and Mubialiwo, A. (2021). Water availability trends across water management zones in Uganda. Atmos. Sci. Lett. 22, 1–14. doi: 10.1002/asl.1059
Onyutha, C., Turyahabwe, C., and Kaweesa, P. (2021). Impacts of climate variability and changing land use/land cover on river Mpanga flows in Uganda, East Africa. Environ. Challenges 5:100273. doi: 10.1016/j.envc.2021.100273
Petursson, J. G., Vedeld, P., and Sassen, M. (2013). An institutional analysis of deforestation processes in protected areas: the case of the transboundary Mt. Elgon, Uganda and Kenya. Forest Policy Econ. 26, 22–33. doi: 10.1016/j.forpol.2012.09.012
Petursson, J. G., Vedeld, P., and Vatn, A. (2013). Going transboundary? An institutional analysis of transboundary protected area management challenges at Mt Elgon, East Africa. Ecol. Soc. 18. doi: 10.5751/ES-05729-180428
Qazi, N. Q., Bruijnzeel, L. A., Rai, S. P., and Ghimire, C. P. (2017). Impact of forest degradation on streamflow regime and runoff response to rainfall in the Garhwal Himalaya, Northwest India. Hydrol. Sci. J. 62, 1114–1130. doi: 10.1080/02626667.2017.1308637
Rabiee, F. (2004). Focus-group interview and data analysis. Proc. Nutr. Soc. 63, 655–660. doi: 10.1079/pns2004399
Rudel, T. K., Schneider, L., and Uriarte, M. (2010). Forest transitions: an introduction. Land Use Policy 27, 95–97. doi: 10.1016/j.landusepol.2009.09.021
Russell, A., Waiswa, D., Owuor, B., Ongugo, P., Bomuhangi, A., Banana, A. Y., et al., (2017). Trends in forest conditions and implications for resilience to climate change under differing forest governance regimes: the case of Mount Elgon, East Africa. (Vol. 225). Indonesia: Center for International Forestry Research (CIFOR).
Rutakumwa, R., Mugisha, J. O., Bernays, S., Kabunga, E., Tumwekwase, G., Mbonye, M., et al. (2020). Conducting in-depth interviews with and without voice recorders: a comparative analysis. Quant. Res. 20, 565–581. doi: 10.1177/1468794119884806
Sanyal, J., Densmore, A. L., and Carbonneau, P. (2014). Catena analysing the effect of land-use/cover changes at sub-catchment levels on downstream flood peaks: a semi-distributed modelling approach with sparse data. Catena 118, 28–40. doi: 10.1016/j.catena.2014.01.015
Sassen, M. (2014). Conservation in a crowded place: forest and people on mount Elgon Uganda. Wageningen, Netherlands: Wageningen University.
Sassen, M., Sheil, D., Giller, K. E., and ter Braak, C. J. F. (2013). Complex contexts and dynamic drivers: understanding four decades of forest loss and recovery in an east African protected area. Biol. Conserv. 159, 257–268. doi: 10.1016/j.biocon.2012.12.003
Schilling, K. E., et al. (2014). The potential for agricultural land use change to reduce flood risk in a large watershed. Hydrol. Process. 28, 3314–3325. doi: 10.1002/hyp.9865
Selamyihun, K., Using eucalyptus for soil & water conservation on the highland vertisols of Ethiopia. (2004). Available at: http://search.ebscohost.com/login.aspx?direct=true&db=lah&AN=20043040461&site=ehost-live
Staal, A., Flores, B. M., Aguiar, A. P. D., Bosmans, J. H. C., Fetzer, I., and Tuinenburg, O. A. (2020). Feedback between drought and deforestation in the Amazon. Environ. Res. Lett. 15:044024. doi: 10.1088/1748-9326/ab738e
Stadler, J. (1995). Development, research and participation: towards a critique of participatory rural appraisal methods. Dev. South. Afr. 12, 805–814. doi: 10.1080/03768359508439858
Sunderland, T., Abdoulaye, R., Ahammad, R., Asaha, S., Baudron, F., Deakin, E., et al. (2017). A methodological approach for assessing cross-site landscape change: understanding socio-ecological systems. Forest Policy Econ. 84, 83–91. doi: 10.1016/j.forpol.2017.04.013
Uganda Bureau of Statistics (2016). The national population and housing census 2014 main report. Kampala, Uganda: Uganda Bureau of Statistics (UBOS).
Van Loon, A. F., and Laaha, G. (2015). Hydrological drought severity explained by climate and catchment characteristics. J. Hydrol. 526, 3–14. doi: 10.1016/j.jhydrol.2014.10.059
Van Noordwijk, M. (2020). Agroforestry as nexus of sustainable development goals. IOP Conf. Ser. Earth Environ. Sci 449. doi: 10.1088/1755-1315/449/1/012001
van Noordwijk, M., Theories of place, change and induced change for tree-crop- based agroforestry. Bogor, Indonesia: World Agroforestry (ICRAF). (2021).
van Noordwijk, M., Speelman, E., Hofstede, G. J., Farida, A., Abdurrahim, A. Y., Miccolis, A., et al. (2020). Sustainable agroforestry landscape management: changing the game. Land 9, 1–38. doi: 10.3390/LAND9080243
Vedeld, P., Cavanagh, C., Petursson, J. G., Nakakaawa, C., Moll, R., and Sjaastad, E. (2016). The political economy of conservation at mount Elgon, Uganda: between local deprivation, regional sustainability, and global public goods. Conserv. Soc. 14, 183–194. doi: 10.4103/0972-4923.191155
Viviroli, D., and Weingartner, R., ‘Water towers’—a global view of the hydrological importance of mountains, BT - mountains: sources of water, sources of knowledge, Wiegandt, E., ed. Dordrecht: Springer Netherlands, (2008), 15–20.
Wamucii, C. N., Van Oel, P. R., Ligtenberg, A., Gathenya, J. M., and Adriaan, J. (2021). Land-use and climate change effects on water yield from east African forested water towers. Hydrol. Earth Syst. Sci. 25, 5641–5665. doi: 10.5194/hess-25-5641-2021
Wasonga, D. V., and Opiyo, J. (2018). Biodiversity status of Mount Elgon forest ecosystem. Nairobi: Kenya Forestry Research Institute. Available at: http://kefriwatertowers.org/PDF/Biodiversitystatusreport_MtElgonFF.pdf
Keywords: Participatory Rural Appraisal, land-use and land cover, Forest-Water-People nexus, tree-water relationships, Sipi River sub-catchment, River Manafwa sub-catchment
Citation: Kimbowa G, Buyinza J, Gathenya JM and Muthuri C (2024) Learning from local knowledge on changes in tree-cover and water availability: the case of the contested agroforested landscape of the Mt. Elgon Water Tower, Uganda. Front. Water. 6:1283574. doi: 10.3389/frwa.2024.1283574
Edited by:
Akhouri Pramod Krishna, Birla Institute of Technology, Mesra, IndiaReviewed by:
Nana Agyemang Prempeh, University of Energy and Natural Resources, GhanaRamanathan Alagappan, Jawaharlal Nehru University, India
Linda Kay Silka, University of Maine, United States
Copyright © 2024 Kimbowa, Buyinza, Gathenya and Muthuri. This is an open-access article distributed under the terms of the Creative Commons Attribution License (CC BY). The use, distribution or reproduction in other forums is permitted, provided the original author(s) and the copyright owner(s) are credited and that the original publication in this journal is cited, in accordance with accepted academic practice. No use, distribution or reproduction is permitted which does not comply with these terms.
*Correspondence: George Kimbowa, Z2Vvcmcua2ltYkBnbWFpbC5jb20=
†ORCID: Joel Buyinza, https://orcid.org/0000-0003-3844-4347