 Jiaxin Zhao
 Mingyao Wang1
 Kun Xu
- 1College of Life Sciences, Hubei Normal University, Huangshi, Hubei, China
- 2Department of Human Resources and Social Security of Hubei Province, Center for Public Employment and Entrepreneurship Guidance and Information Service, Wuhan, Hubei, China
Introduction: Clean drinking water is a necessity for maintaining public health and livelihoods. Hard water containing excessive calcium and magnesium threatens urinary health with elevated risks of kidney stones at rural villages with tap water shortages. After entitled poverty alleviation in 2019, residents of Yangxin county of Hubei Province in central China unexpected suffered shortage of tap water and additional cost of water softening. However, the impact of lack of tap water on risks of kidney stones was not yet quantified for residents at rural villages in Yangxin.
Methods: We conducted a cross-sectional analysis by testing 216 water samples from 114 families at four villages and surveying urinary health and living conditions of each householder.
Results: Lab tests showed that mean total hardness of well and tap water at each village was above 355 mg/L CaCO3, except tap water from the village with government support for industrial development. Mean softening depth was 309.3 mg/L at the families paying for filters or bottle water, and mean annual cost of water was 1,915 CNY (1 CNY = 0.14 USD) equivalent to 5.8% of mean annual household income. Mean tap water availability was only 34%, and the prevalence of kidney stones among the four villages was 33.9%, 25.0% higher than the rate of kidney stones in Hubei Province. About 60% of the families showed strong willingness to accept annual government compensation of 3,324 CNY for clean water supply, whereas only 2.6% of the families wanted to pay government for water treatment. Using logistic and random forest regression models, we identify factors associated with the prevalence of kidney stones as gender (males have 3.78 times the risks of females), age (2.42 times greater risks if 10 years older), body mass index (higher risks if overweight or obese), total hardness of drinking water (2.59 times for a 100 mg/L increase in total hardness), and tap water availability (2.42 times higher among those without tap water supply compared to those with constant supply).
Discussion: Old and obese males are more likely to be diagnosed with kidney stones, but tap water shortages and high total hardness of drinking water increase the risks for all residents. To improve urinary health and meet support needs of residents, tap water supply of soft water is urgently needed at the rural villages in Yangxin.
1 Introduction
Drinking wate1 safety is a global challenge for public health and economic development, especially in developing countries where freshwater resources are prioritized for industrial use and water quality worsens due to pollution (Sobsey, 2006; Liu and Yang, 2012; Li and Wu, 2019). Water softening is a common practice to reduce total hardness of water for life and production purposes (Godskesen et al., 2012; Wasana et al., 2017; Sulaiman et al., 2020). Total hardness is the sum of concentration of alkaline earth ions, namely calcium (Ca) and magnesium (Mg) ions, in water, commonly expressed as the concentration of calcium carbonate (CaCO3; mg/L) (Ansell, 2005). Total hardness and the calcium:magnesium ratio were found associated with health conditions of water users, especially cardiovascular and urinary health (Yang et al., 2016; Wasana et al., 2017; Sulaiman et al., 2020; Peng et al., 2023). Developed countries, such as Germany, Canada, and Japan, defined drinking water as “hard” if its total hardness is >93, 200, and 300 mg/L CaCO3, respectively (Sayre, 1988; Hori et al., 2021; Hintz et al., 2022). Regarding hardness in drinking water, the World Health Organization (WHO) recommended that the concentration of CaCO3 in drinking water should be below 180 mg/L (World Health Organization, 2010). On the contrary, limited by economic development, water resource availability, and public health awareness, developing countries set loose standards for total hardness of drinking water, e.g., >1,000 mg/L CaCO3 in Ethiopia (Werkneh et al., 2015), or even no standard (Wasana et al., 2017). In China, the current national standards for drinking water quality (GB 5749-2022) require that total hardness of drinking water should be ≤ 450 mg/L CaCO3, which apply to groundwater, tap water, centralized water (water supplied by a centralized station at the village for residential use of water), bottled water, and other types of drinking water (Standards Press of China, 2022). A recent nationwide study on water safety showed that the average concentration of calcium and magnesium ions in public drinking water was 40.4 and 12.4 mg/L, respectively, equivalent to total hardness of 144.4 mg/L CaCO3 (Peng et al., 2023). However, a large variation in total hardness of drinking water was identified across China, ranging from 7.0 to 674.4 mg/L CaCO3, with higher total hardness of water in rural than neighboring urban regions (Yang et al., 2016; Peng et al., 2023). This variation might largely be due to the variation of calcium concentrations in water shaped by the spatial distribution of carbonate rocks and karst springs in China (Zhou et al., 2013; Yang et al., 2016; Sun et al., 2020). In addition, coal mining activities altered chemical characteristics and increased total hardness of water (Zhou et al., 2013; Zhang et al., 2014). Water samples with total hardness >450 mg/L CaCO3 from lakes and groundwater were frequently detected in rural areas of central China where pollution from coal mining industries persisted (Zhang et al., 2014; Li and Wu, 2019; Qiu et al., 2023). The positive association between total hardness of drinking water and the prevalence of non-communicable cardiovascular and urinary diseases, e.g., kidney stones, implied that lack of soft drinking water threatened public health, especially at rural villages (i.e., villages administered by townships outside prefectural cities in China) (Monarca et al., 2006; Yang et al., 2016; Peng et al., 2023).
Kidney stones threatened urinary health and livelihoods of the public (Monarca et al., 2006; Frassetto and Kohlstadt, 2011), and the prevalence of kidney stones increased globally (Edvardsson et al., 2013; Sorokin et al., 2017; Thongprayoon et al., 2020). The patients suffered long-lasting pain that might not be relieved unless treatment was received upon diagnosis by ultrasound or computed tomography (CT) examination (Frassetto and Kohlstadt, 2011; Thongprayoon et al., 2020). Despite short-term relief of the pain, the high recurrence rate of kidney stones increased cost of healthcare and loss of labor globally (Hyams and Matlaga, 2014; Khan et al., 2016), especially among adult males in China (Wang et al., 2017; Zeng et al., 2017; Tan et al., 2024) and India (Guha et al., 2019), two of the most populated countries in the world. Many factors, including age, gender, obesity, and genetic background, were found associated with the prevalence of kidney stones (Khan et al., 2016; Sorokin et al., 2017; Wang et al., 2017; Zeng et al., 2017; Liu et al., 2018; Tan et al., 2024), of which body mass index (BMI) was a common indicator for this disease (Semins et al., 2010; Zeng et al., 2017). The prevalence of kidney stones was positively associated with age for various reasons, including changes in living habits, lifestyles, and metabolic levels due to aging (Zeng et al., 2017). Diseases such as diabetes, hypertension, and urinary infections that were more common among the elderly were associated with kidney stones (Wang et al., 2017). In terms of gender difference, higher intake of animal protein and salt, more stressful work, and less healthy lifestyle of males than females might contribute to the higher prevalence of kidney stones in Chinese males (Wang et al., 2017; Tan et al., 2024). Metals taken in from diets were also related to the prevalence of kidney stones, among which daily intake of hard water and water with high calcium:magnesium ratio were two contributors to the disease (Serio and Fraioli, 1999; Guha et al., 2019; Sulaiman et al., 2020; Siener, 2021). WHO recommends daily intake of calcium <2,500 mg to reduce the incidence of kidney stones to reflect the global prevalence of kidney stones, which affects the quality of life of the patients (World Health Organization, 2010; Khan et al., 2016). The prevalence of kidney stones in western countries was reported between 5 and 14% of the population (Sorokin et al., 2017), with 8.8% in the US (Scales Jr et al., 2012) and 14.0% in Iceland (Edvardsson et al., 2013). It was even more varied in Asia, ranging from 1% to 19.1% (Sorokin et al., 2017; Liu et al., 2018), with 12.0% in India (Guha et al., 2019), 17.5% in Thailand (Ingsathit et al., 2010), and 19.1% in Saudi Arabia (Ahmad et al., 2015). A relatively low prevalence of kidney stones was reported in China, i.e., 6.4% in 2014 (Zeng et al., 2017), though it kept increasing at the rate of 2.8% net increase per decade (Wang et al., 2017). Among the over 4 billion populations in Asia, the number of patients with kidney stones is expected to be substantially higher than 0.3 billion (calculation based on the reported rate of kidney stones in China and India and their populations in 2023 according to the World Bank; Wang et al., 2017; Guha et al., 2019), considering patients undiagnosed due to limited access to medical examination in rural areas (Khan et al., 2016; Thongprayoon et al., 2020). There is a need to study the actual prevalence of kidney stones among the residents at rural villages to update understanding of this disease in the wide range of populations in developing countries (Sorokin et al., 2017; Liu et al., 2018).
Among provinces of China, its prevalence in Hubei Province (8.9%), one with the highest gross domestic production (GDP) per capita in central China, was 1.39 times the national prevalence (6.4%) (Tan et al., 2024). Within Hubei Province, soil and water pollution correlated with a high prevalence of kidney stones in rural areas, especially at the villages relying on farming (Leng et al., 2023) and mining (Zhou et al., 2013), where use of calcium–magnesium phosphate fertilizer (Zhou et al., 2013; Leng et al., 2023) and mining activities (Li et al., 2013; Zhou et al., 2013) increased total hardness of water. According to the National Energy Administration (2014), 87.5% of large coal mineral deposits (coal stock >1.2 million tons) were located outside the 12 prefectural cities across 30 counties in Hubei Province. In addition, considering farming as the major way of living for residents in nearly 30,000 villages in the province (National Bureau of Statistics of China, 2024), the prevalence of kidney stones was expected to be higher in rural villages than the provincial average rate. Located in eastern Hubei Province, Yangxin county used to be a community-oriented agriculture and farming hub but transformed to develop a secondary industry, including processing raw mines and manufacturing industrial materials, a decade ago (Hubei Provincial Government, 2019). With a rapid increase in GDP, it was entitled to exit the list of national poverty-stricken counties of China in April 2019 (Hubei Provincial Government, 2019). During the poverty alleviation progress, it was reported that the economy and infrastructure in Yangxin county had been improved (People's Government of Yangxin County, 2021), during which ensuring drinking water safety was a priority (Department of Water Resources of Hubei Province, 2020). By the end of 2019, the rate of supply of centralized water and that of tap water increased to over 94 and 91%, respectively, according to the Department of Water Resources of Hubei Province (2020). However, due to high demand for clean water in secondary industries and due to water shortage in the surrounding reservoir, available tap water supply was limited and sometimes suspended at rural villages in Yangxin county to support water use for mining, manufacturing, and logistics (People's Government of Yangxin County, 2022). Under pressure of tap water shortages, local government suggested that residents should use the abundant resources of groundwater, i.e., well water, in case of suspension in tap water supply for agriculture, food preparation, and drinking (People's Government of Yangxin County, 2022). This suggestion was risky given the fact that groundwater in central China contained high concentrations of calcium and magnesium (Yang et al., 2016; Xi et al., 2021; Leng et al., 2023). Moreover, despite high total hardness of groundwater, Yangxin county invested little on green agriculture and environmental pollution control (People's Government of Yangxin County, 2021). Government acts on water issues might be perceived as lack of care and support by the residents suffering tap water shortages. Water issues drove a group of residents of rural villages in Yangxin to install water filters or purchase bottle water from local water purification stations at their own costs. For the residents unable to afford filtered or bottle water, they had to rely on well water at the cost of taking in excessive calcium, magnesium, and heavy metals (Xi et al., 2021). If such water issues last longer, the prevalence of kidney stones would increase, damaging public health and livelihoods, as lessons from India (Guha et al., 2019), Indonesia (Bakker et al., 2008), Malaysia (Loi et al., 2022), Tanzania (Jiménez and Pérez-Foguet, 2010), and Thailand (Ingsathit et al., 2010). However, how total hardness of drinking water and tap water availability were associated with the prevalence of kidney stones was not yet tested at rural villages in Yangxin. To quantify the impacts of lack of tap water on urinary health for residents of the rural villages, we conducted a cross-sectional analysis on the prevalence of kidney stones in 114 families at four rural villages. Our findings emphasize the needs for stable tap water supply of soft water to improve urinary health and livelihoods at rural villages in Yangxin.
2 Materials and methods
2.1 Study area
The four villages, Luoyuqiu (LYQ), Wubian (WB), Yaozhi (YZ), and Zuojiapu (ZJP), administered by Yangxin county are located along the highway S315 in eastern Hubei Province of China (30°4′16.4634″N 115°11′58.4514″E-−30°5′11.112″N 115°12′52.4514″E; Figure 1). Within the northern subtropical monsoon climate zone, mean annual temperature of Yangxin is 16.8°C with mean annual precipitation of 1389.6 mm (Chen et al., 2022). The villages are located in the hilly area at the northern foot of the Mufu Mountain Range, where over 40 mineral deposits are proven in the county (Chen et al., 2022). The lithological unit of the soil is quaternary (Xi et al., 2021), which is rich in carbonates and gypsum and often saline (Alaily, 1995). The groundwater there is categorized as not suitable for drinking even after treatment due to excessive heavy metals (Xi et al., 2021), but well water has been a common source of water for residents at rural villages in the county (People's Government of Yangxin County, 2022). In terms of surface water, a large heavy metal-contaminated lake, Daye Lake, is 5 km northwest to ZJP (Zhang et al., 2014), and a smaller fertilizer-polluted lake, Haikou Lake, is 3 km southeast to LYQ (Qiu et al., 2023) (Figure 1).
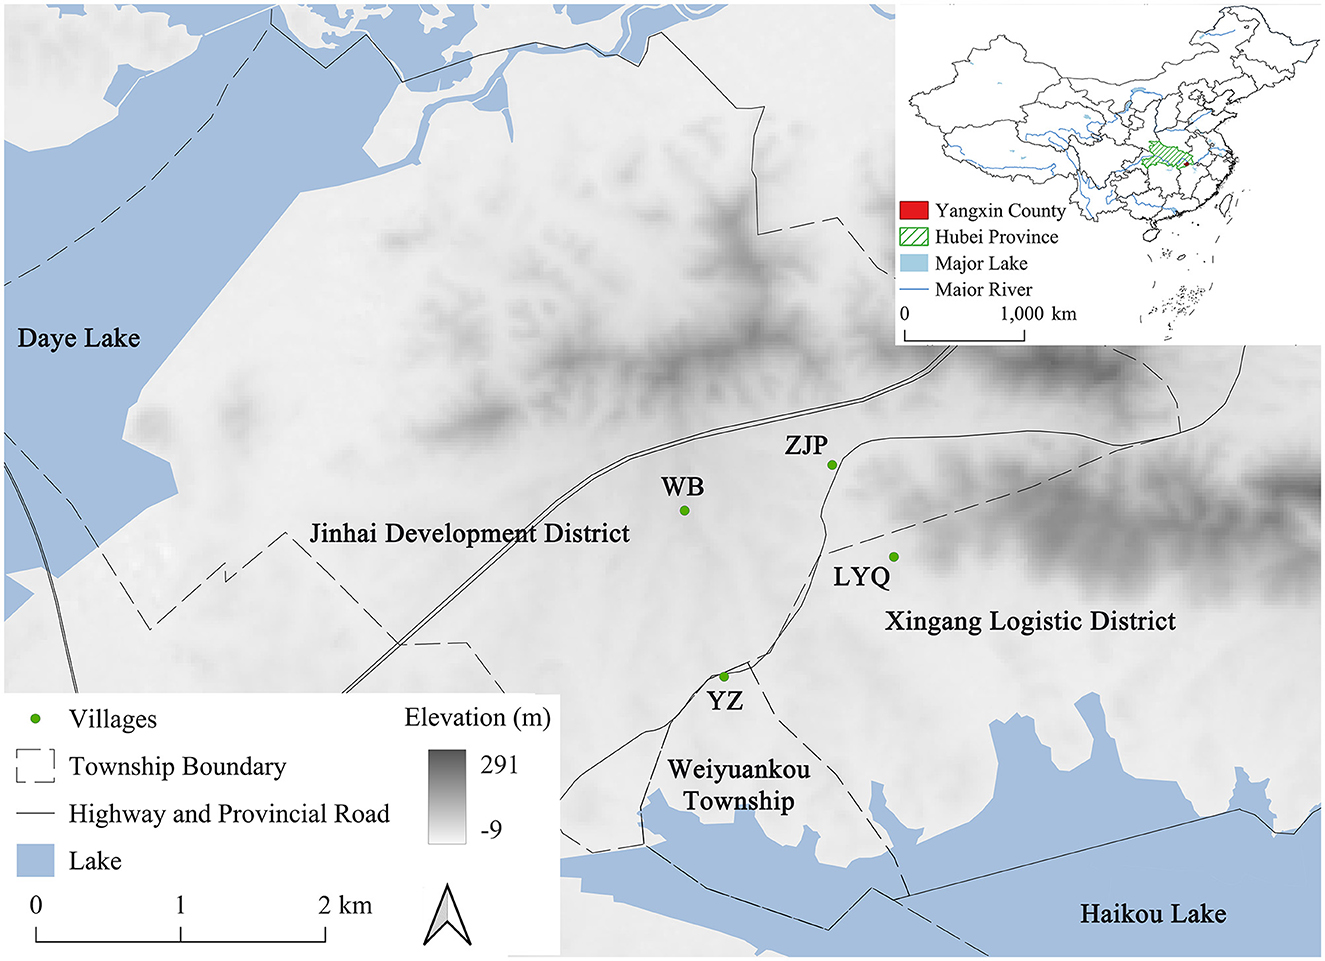
Figure 1. Map of the four villages in Yangxin county of Hubei province in central China. The base map shows elevation (m) derived from a 30 m spatial resolution Digital Surface Model (Tadono et al., 2016). The four village centers are marked by green dots, the boundary of townships are in dashed lines, and roads are in solid lines. A part of Daye Lake is in the northeast, and a part of Haikou Lake is in the southwest of the map. Location of Yangxin county is identified in red in the top right panel of the figure. The coordinates of the four villages are LYQ: 30°4′47.388″N 115°12′52.4514″E, ZJP: 30°5′11.112″N 115°12′36.5394″E, WB: 30°4′59.3394″N 115°11′58.4514″E, and YZ: 30°4′16.4634″N 115°12′8.6394″E.
The four villages have been administered under different socioeconomic development plans for agriculture, mining, logistics, and manufacturing during the past three decades (People's Government of Yangxin County, 2019, 2021). Specifically, YZ has been a traditional agriculture-oriented village with emphasis on farming, breeding, and transportation of agricultural produce (People's Government of Yangxin County, 2019). Mining and coal production have been the primary industries for ZJP and WB since 1988, which contributed to the total coal production of 3 × 10⁵ tons per year in Yangxin county (National Energy Administration, 2014). LYQ received policy and financial support from the government in 2013 for its fast transformation to a modern logistics industry district (People's Government of Yangxin County, 2021). The mean GDP per capita of the four villages was 3.13 × 10⁴ CNY (4.41 × 10³ USD) in 2020 (Bureau of Statistics of Huangshi, 2022). Availability of tap water supply varied from stable, temporary to no supply at these villages depending on whether industrial use of tap water was fulfilled and on levels of support for socioeconomic development provided by the local administration (People's Government of Yangxin County, 2022).
2.2 Field survey
There were 87–143 families at each village according to the registration records, and the population density ranged between 290 and 358 per km2 in 2020 (Chen et al., 2020). Before field survey, we generated random numbers to sample approximately one-third of registered families at each village as our target groups (29, 37, 58, and 33 for LYQ, ZJP, WB, and YZ, respectively). During the 6th−13th of July 2023, we managed to visit 114 families willing to provide responses and water samples for our study (21 at LYQ, 27 ZJP, 42 WB, and 24 YZ; covering 25.9% of families). We collected water samples from each family and surveyed householders for demographic, economic, and urinary health conditions, water availability, and perspectives on water safety and government support. Questions were designed for answers of yes/no, multiple choice, and simple filled-in text for statistical analysis (Supplementary Table 1).
Householder of a family is the adult with name in the front page of the family registration book. All householders were informed about the sole academic purpose of the survey. Participation was anonymous and voluntary, and householders could withdraw any time before, during, and after the survey without consequences. Each survey was conducted on adults (aged 18 or over) and was not influenced or manipulated by government-related personnel. Only the researchers had access to the survey data. The procedures followed the provision of the Scientific Research and Academic Ethics Committees of Hubei Normal University (approval no. EWPL202312).
Well and tap water samples, if available, were collected from each family using two clean and pre-labeled 500 ml plastic bottles. In addition, if the family drank another source of water, such as bottle water (small-−500 ml or large-−19 L) purchased from a local water purification station, filtered well, and filtered tap water, these sources of water were also sampled. At 43 families, reverse osmosis water filters were installed at their cost to improve water quality by removing metal ions from hard water (Vingerhoeds et al., 2016), of which 19 installed the filter at the well pump and 24 at the kitchen faucet. Overall, five types of water were sampled, including bottle, tap and filtered tap, and well and filtered well, and the primary type of drinking water was marked corresponding to the survey question (hereafter drinking water). Softening depth was calculated as the decrease in total hardness by filtering well or tap water or by purchasing bottle water, and it was 0 if drinking water was directly utilized from well or tap (Godskesen et al., 2012).
There were three parts of questions in the questionnaire regarding (1) demographic and economic, (2) urinary health, (3) tap water availability, and perspectives on water safety and government support. First, each householder was asked for gender, age, height, weight, annual household income in the last year (negative if expenses exceed receipts), and the number of adult family members. Based on weight (kg) and height (m) of householders, body mass index (; kg/m2) was calculated, and BMI <18.5, 18.5–23.9, 24.0–27.9, and ≥28.0 indicated underweight, normal weight, overweight, and obesity of a Chinese adult, respectively (Zhou, 2002). Based on annual household income and family size, annual per capita household income was calculated by dividing annual household income by the number of adult family members. Second, the prevalence of kidney stones was estimated as the occurrence of householders diagnosed with kidney stones either by ultrasound or computed tomography (Tan et al., 2024) based on the responses of householders. Their diagnoses of kidney stones were based on a free examination for urinary health provided for each adult rural resident after 2019 when Yangxin county exited the list of national poverty-stricken counties as a one-time benefit (People's Government of Yangxin County, 2021). The third part was for tap water availability and perspectives of water safety and government support. Tap water availability at each family was determined as the percentage of days with tap water supply over the past 3 months (90 days) to the best of householders' memory. Tap water supply remained the same after the establishment of tap tubes in 2019, and tap water shortages frequently occurred at families with tap tubes among the four villages (People's Government of Yangxin County, 2022). Householders were then asked for their annual cost of clean source(s) of water for the family in the last year. The cost included well establishment and maintenance, tap establishment and utility, filter device and replacement, and bottle water supply. Lastly, they were asked for their awareness of environmental pollution, awareness of hard water, willingness to accept compensation for water issues (if so, also asked for the amount of compensation willing to accept each year), confidence in receiving government compensation, and willingness to pay government for water treatment. Responses to these questions were checked for completeness before visiting the next family.
2.3 Lab tests
Water samples were tested for turbidity, pH, and total hardness at the lab. First, turbidity was visually examined against the 1 mg/L standard diatomite solution to determine if sample turbidity was above or below 1 Nephelometric Turbidity Unit (NTU) (Downing, 2004). Samples with turbidity <1 NTU, the national limit for turbidity of drinking water (Standards Press of China, 2022), were then tested for pH and concentration of calcium and magnesium. pH was determined using a pH electrode at 25°C, as a supplementary indicator of alkalinity (Shaver, 1993). The concentration of calcium and magnesium ions was determined using the Avio 200 Inductively Coupled Plasma Optical Emission Spectrometer (Zheng et al., 2017).
Total hardness (mg/L) was calculated as sum of concentration of calcium hardness and that of magnesium hardness both as CaCO3 (mg/L):
where c(Ca) and c(Mg) were concentrations of calcium and magnesium ions in the water sample, respectively. The multipliers, 2.497 and 4.118, are divisions of molar mass between CaCO3 and Ca (100.087/40.078) and between CaCO3 and Mg (100.087/24.305), respectively. Calcium:magnesium ratio () was also calculated. A positive relationship between pH and total hardness was expected under the acid–base balance of water samples (Larson et al., 1942) and the geological environment carry capacity of Yangxin (Xi et al., 2021).
2.4 Data analysis
Data analysis consisted of three parts, namely (1) homogeneity tests on demographic and economic conditions of families at the four villages, (2) classification of water types on total hardness, and (3) a cross-sectional analysis of the prevalence of kidney stones. First, a one-way analysis of variance (ANOVA) was used to test if mean age, BMI, annual household income, family size, and annual per capita income were different across the four villages. Then, a two-way ANOVA was conducted on total hardness among the five water types and the four villages. Multiple comparison of total hardness with Tukey method for p-value adjustment by water types and by villages was conducted using the R package emmeans (Lenth, 2022). Ellipses were constructed to classify water types based on the multivariate t-distribution of pH and total hardness using the R package ggplot2 (Wickham, 2011). And the relationship between pH and total hardness was estimated using the ordinary least squares regression.
Third, the prevalence of kidney stones was estimated using two regression methods, namely the logistic regression model with a log link (Menard, 2002) and the random forest regression model for the binary response (Breiman, 2001) using R 4.3.0 (Ihka and Gentlema, 1996). Candidate explanatory variables included five water (total hardness and calcium:magnesium ratio of drinking water, softening depth, availability of tap water, and annual cost of water), four demographic (gender, age, BMI, and BMI2), two economic (annual household income and annual per capita household income), and five perspective variables (awareness of water issues, willingness to accept, willingness to pay, hope government to solve, and trust in government for water treatment; Tables 1, 2). Pearson's correlation coefficient (r) between each pair of explanatory variables was tested <0.8 to prevent multicollinearity from logistic regression models (Menard, 2002). Logistic regression models were estimated using stepwise selection on the 16 candidate explanatory variables for the fitted model with the lowest AIC (Menard, 2002). Log odds ratio [; p as the probability of being diagnosed with kidney stones and 1–p as that of not being diagnosed] for 1 unit increase in a given variable was estimated as the coefficient (β) of that variable in the fitted model given other variables unchanged. Higher the odds ratio the more likely the individual is diagnosed with kidney stones, and β>0 indicates a positive relationship between that variable and the probability of being diagnosed (Szumilas, 2010). The Receiver Operating Characteristic (ROC) curve of the estimated model was produced using the R package pROC (Robin et al., 2011), and the area under the curve (AUC) was calculated to evaluate the prediction performance of the model (Mandrekar, 2010). In order to examine the robustness of the logistic regression model, simulation of modeling with 10% fewer data was conducted for 1,000 times of iteration. In each time of iteration, 10% of data at each village were randomly dropped, and the estimated coefficients of the refitted model were extracted to compare with those by the model built on the complete data, and the number of times p < 0.05 were counted.
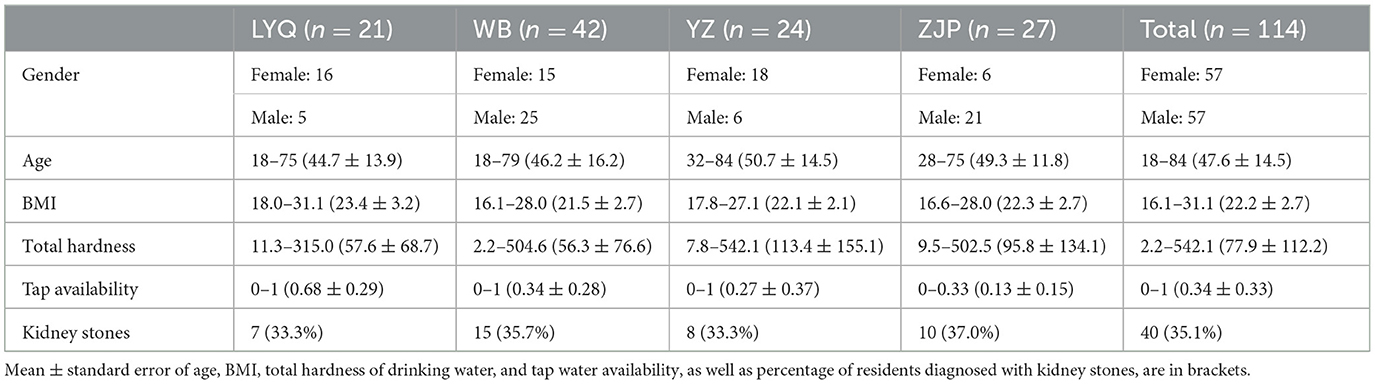
Table 1. Summary of gender, age (years), body mass index (BMI; kg/m2), total hardness of drinking water (mg/L), tap water availability, and the number of residents diagnosed with kidney stones at LYQ, WB, YZ, and ZJP villages in Yangxin county.
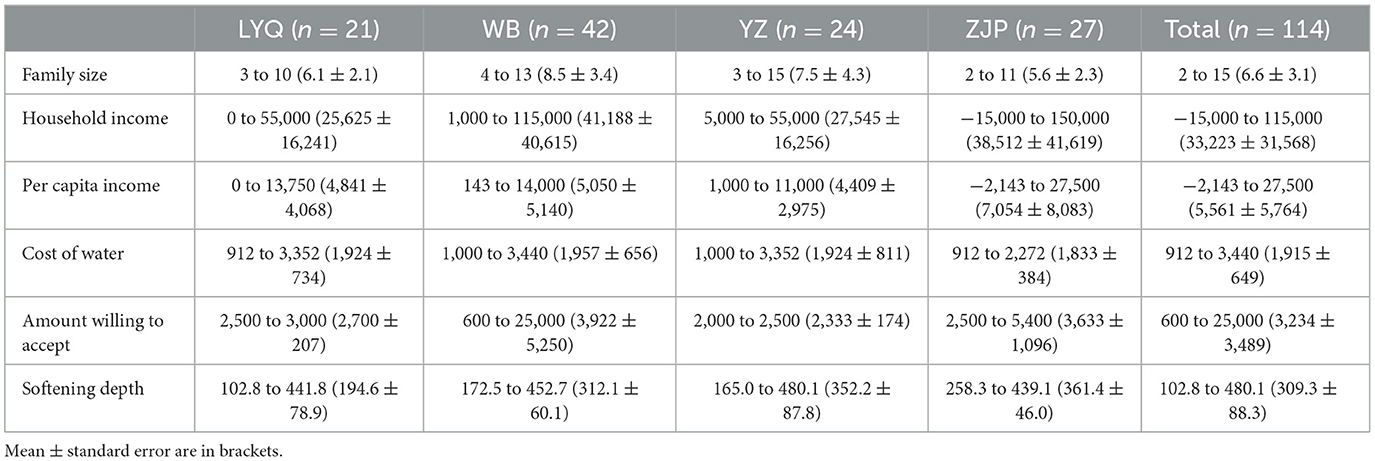
Table 2. Summary of family size (the number of adult members), annual household income (CNY), annual per capita income (CNY), annual cost of clean source(s) of water (CNY), amount of compensation willing to accept (CNY), and softening depth (mg/L) at the four villages in Yangxin county.
In addition to the logistic regression models, random forest regression models were built using the same set of variables in the estimated logistic regression model. After 1,000 times of iteration, the random forest regression model with the lowest classification error rate was built using the R package randomForest (Breiman, 2001). The number of trees was set to 300, and the number of variables tried at each split was 2 for the model. Mean decrease Gini that measures the average gain of purity of nodes and leaves in the resulting random forest by including the variable was calculated (Breiman, 2001). The higher mean decrease in Gini was, the more important the variable was to the model. Partial dependence plots of the prevalence of kidney stones on each of the variables in the model were produced using the R package pdp to visualize how estimated risks of kidney stones were dependent on that variable marginalizing over the other variables (Greenwell, 2017). Estimated effects of the variables in the logistic regression and random forest regression models were compared to reduce bias in this cross-sectional analysis (Kirasich et al., 2018). The R codes for the logistic regression and the random forest regression models are available in Supplementary material.
3 Results
3.1 Total hardness of water
Of the 114 families, 104 established wells (91.2%), but only 19 of the 104 families (18.3%; 12 at WB, 1 YZ, and 6 ZJP) installed well water filters on the pumps. Tap tubes were installed at 20, 29, 11, and 13 families at LYQ, WB, YZ, and ZJP, respectively. Tap water supply was constantly available at only 11 families (9.6%), while it was not at all available at 41 families (36.0%). Mean availability of tap water was 0.34, but it varied across the four villages, with 0.68 at LYQ, 0.34 at WB, 0.27 at YZ, and 0.13 at ZJP. We found that 24 families installed filters at their kitchen faucets, but due to shortage of tap water supply, we were able to collect samples of filtered tap water from 17 of them (6 at LYQ, 6 WB, 4 YZ, and 1 ZJP). For the same reason, we were able to collect water samples directly from tap at 38 families. There were 29 (1 at LYQ, 13 WB, 6 YZ, and 9 ZJP) and 18 (7 at LYQ, 6 WB, 4 YZ, and 1 ZJP) families reporting well and tap water as their primary sources of drinking water, respectively. In addition to these families, there were 67 families (13 at LYQ, 23 WB, 14 YZ, and 17 ZJP) drinking bottle water purchased from the local water purification station.
The average annual cost of water per family is 1,915 CNY with a standard error of 650 CNY, which is not significantly different by villages (p = 0.897). Turbidity tests show that turbidity of 19 well water samples is over 1 NTU and that of other samples is below 1 NTU. In total, 216 water samples (75 well, 19 filtered well, 38 tap, 17 filtered tap, and 67 bottle) are tested for pH and concentration of calcium and magnesium. Concentration of magnesium of tap water (10.5–18.2 with mean 14.5 and standard error 2.1 mg/L) is not significantly different from the national mean, 12.4 mg/L (p = 0.279), but concentration of calcium of tap water (73.6–178.2 with mean 135.9 and standard error 34.1 mg/L) is significantly higher than the national mean, 40.4 mg/L (p = 0.003) (Li and Wu, 2019). Total hardness of well and tap water at each village is significantly higher than the national mean, 144.1 mg/L (Peng et al., 2023), with t-test p-value of the comparison between each village and the national mean <0.001.
In terms of heterogeneity among water types and villages, no difference is found in calcium:magnesium ratio (6.6–14.2 with mean 11.7 and standard error 2.7) by water types (p = 0.539), villages (p = 0.133), or their interaction (p = 0.272). In fact, no difference in the ratio is detected in water samples from the adjacent Jianghan plain (Zhou et al., 2013), which might be due to homogeneous geogenic characteristics of groundwater in central and eastern Hubei Province (Yang et al., 2016). On the contrary, total hardness is highly varied from 2.2 to 542.1 mg/L CaCO3 among the five water types (p < 0.001) and the four villages (p < 0.001), where the interaction between water types and villages is also significant (p = 0.001; Figure 2A). Multiple comparison of total hardness by water types shows no difference in bottle, filtered tap, well, or filtered well water among the four villages (p > 0.05 for each pair), as well as no difference in total hardness of tap water at WB, YZ, and ZJP, but significantly lower total hardness of tap water at LYQ than that at the other three villages (p < 0.001 when comparing LYQ against each of the other three villages; Figure 2A). In addition, no difference in total hardness is found among bottle, filtered tap, and filtered well water at each village (p > 0.05 for each pair). And no difference in total hardness is found between tap and well water at each village (p > 0.05), while significantly higher total hardness is identified in tap or well water than bottle, filtered tap, or filtered well water at every village (p < 0.001 for each pair of comparison; Figure 2A). Under the current national standards for drinking water (GB 5749-2022; Standards Press of China, 2022), there are 32 samples (14.8%) with total hardness >450 mg/L CaCO3, of which five are from tap water and 27 from well water. Total hardness of only four samples from LYQ (one tap water) exceeds the national limit, whereas that of 8 (one tap water), 10 (one tap water), and 10 (two tap water) samples from WB, YZ, and ZJP exceeds 450 mg/L CaCO3, respectively. Ellipses of water types by the multivariate t-distribution of pH and total hardness show that tap and well water samples are clustered apart from bottle, filtered tap, and filtered well (Figure 2B). The fitted ordinary least squares regression of total hardness on pH is Total Hardness = 189.71 pH 970.69, where pH ranges between 4.7 and 7.7 (p < 0.001 for both estimated slope and intercept; R2 = 0.705).
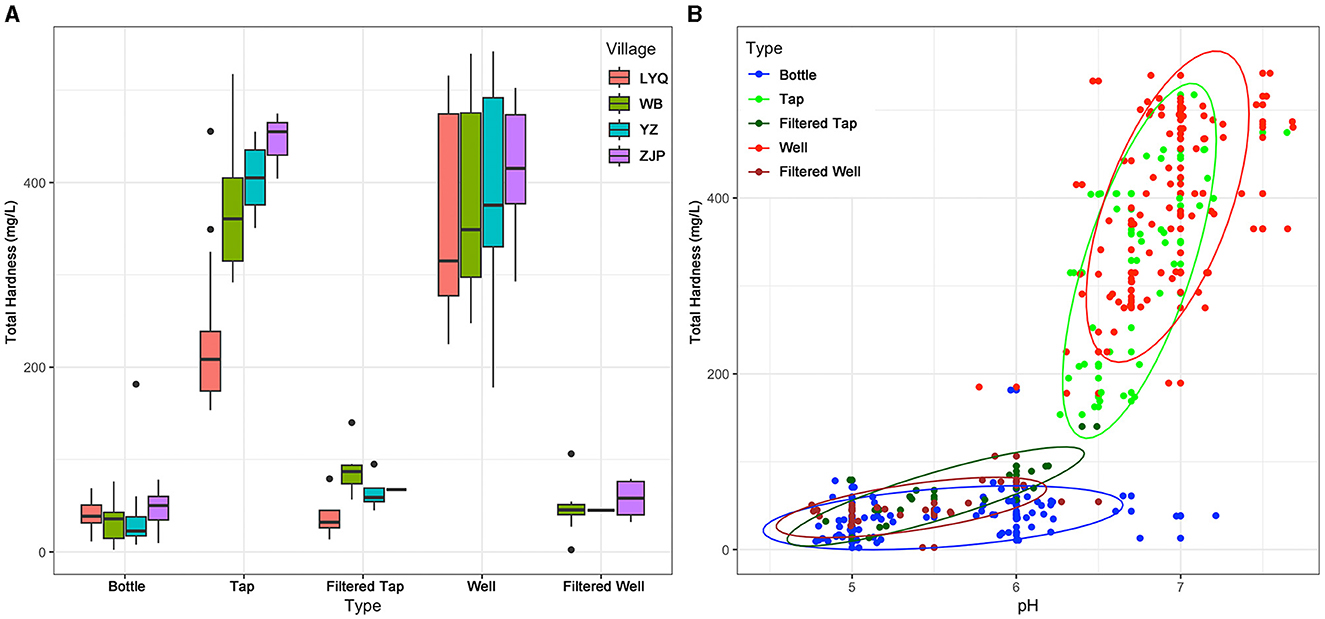
Figure 2. Total hardness of 216 water samples (A) grouped by water type and villages, and (B) classified with pH under water type. (A, B) The five types of water are bottle, tap, filtered tap, well, and filtered well, displayed in different colors shown in the legend. (B) Ellipses are constructed to classify water types based on the multivariate t-distribution of pH and total hardness.
3.2 Demographic and economic conditions
The sex ratio is 1:1 for the 114 householders with mean age of 47.6 years, and their BMI ranges from 16.1 to 31.1 (mean 22.2 and standard error 2.7; Table 1). BMI indicates that 75 householders are in normal weight (66.8%) whereas 11 underweight (9.6%), 25 overweight (21.9%), and three obesity (2.6%). Annual household income ranges from −15,000 to 115,000 CNY with mean of 33,223 and standard error of 31,568 CNY (Table 2). Given family size between 2 and 15 (mean 6.6 adults per family), annual per capita income is from −2,143 to 27,500 CNY (Table 2). One-way ANOVA shows no significant difference in mean age (p = 0.447), BMI (p = 0.068), annual household income (p = 0.362), family size (p = 0.176), or annual per capita income (p = 0.421) across the four villages.
3.3 Perspectives of water issues
Perspectives of water issues are comparable among the four villages (Table 3), which justifies the quality of data from survey. Most householders (87.0%) are aware of water issues (76.2% at LYQ, 90.5% WB, 83.3% YZ, and 92.6% ZJP), and over half (50.9%) report their notice of deterioration in water quality (47.5% at LYQ, 50.0% WB, 37.5% YZ, and 66.7% ZJP; Table 3). Only 10.5% of householders clearly reject government financial support on water issues (9.5% at LYQ, 11.9% WB, 12.5% YZ, and 7.4% ZJP), while 68 out of the 114 householders (59.6%; 61.9% at LYQ, 54.8% WB, 70.8% YZ, and 55.6% ZJP) are willing to accept compensation on water issues, such as tap water shortages and water pollution (Table 3). The mean amount willing to accept is 3,234 CNY per year (Table 2), not correlated with annual cost of clean source(s) of water for the families (p = 0.91). Meanwhile, 58.8% of householders are not willing to pay the government for improving water quality (47.6% at LYQ, 52.4% WB, 70.8% YZ, and 66.7% ZJP; Table 3). On the other hand, 76.3% of householders hope that government could solve the water problems, especially at ZJP (88.9%), despite lack of confidence in government, i.e., only 11 householders (9.6%) believe that government would actually provide compensation for water problems (Table 3).

Table 3. Summary of perspectives of the 114 householders on water issues, including awareness of water issues, notice of deterioration in water quality, willingness to accept government compensation for water issues, willingness to pay government for water treatment, hoping government to solve water issues, and confidence in receiving compensation.
3.4 Prevalence of kidney stones
The overall prevalence of kidney stones is 35.1% with 33.3% at LYQ, 35.7% WB, 33.3% YZ, and 37.0% ZJP (Table 1). The fitted logistic regression model indicates that gender, age, BMI, total hardness of drinking water, and tap water availability, but not others, are significantly associated with the prevalence of kidney stones at these villages (Table 4). The AUC of the ROC curve of our logistic regression model is 0.855 (Supplementary Figure 1), indicating excellent diagnostic accuracy of the model (Mandrekar, 2010). Results for the simulation of the robustness of the logistic regression model for 10% fewer data show that the estimated coefficients are similar between the fitted model (Table 4) and simulated models (Supplementary Table 2). Gender, age, BMI2, total hardness of drinking water, and tap water availability are significant in 92.3%, 100%, 57.4%, 99.7%, and 71.9% times of iteration, respectively (Supplementary Table 2). The logistic regression model shows that log odds of kidney stones are significantly higher in male, older, and overweight householders with limited tap water supply and high total hardness of drinking water (Table 4). Gender male, age, BMI2, and total hardness of drinking water are positively related to log odds of kidney stones, whereas tap water availability is negatively related to it (Table 4). By providing stable tap water for a householder currently without any tap water supply (i.e., increase in tap water availability from 0 to 1), the risk of kidney stones is expected to decrease to 0.11 (e−2.21) times (p = 0.027), given the other four variables unchanged. On the other hand, if total hardness of drinking water decreases by 100 mg/L CaCO3, the risk of kidney stones is expected to decrease to 0.39 (e−100 × 0.00951) times (p = 7.1 × 10⁻³).

Table 4. Summary of the fitted logistic regression model for the prevalence of kidney stones estimated on gender (males against females), age (years), BMI2 (kg/m2), total hardness of drinking water (mg/L), and tap water availability.
The random forest regression model achieves a low classification error rate, i.e., 19.3%. The model performs very well for classifying those not diagnosed with kidney stones, with an error rate of 10.8%. Gender, age, BMI, tap water availability, and total hardness of drinking water are important variables, where total hardness of drinking water is the most and gender the least important variable (Figure 3A). Partial dependence plots of the prevalence of kidney stones on age (Supplementary Figure 2A), BMI (Supplementary Figure 2B), total hardness of drinking water (Supplementary Figure 2C), and tap water availability (Supplementary Figure 2D) show that householders at a young age and within the normal range of BMI (Zhou, 2002) and those with low total hardness of drinking water and high availability of tap water are less likely to be diagnosed with kidney stones. In terms of partial dependence on the combination between age and BMI, householders at the age of 18–30 with BMI between 22.0 and 23.5 are least likely to suffer kidney stones (Figure 3B). Taking marginals of gender, age, and BMI, householders with constant tap water availability and total hardness below 50 mg/L CaCO3 are exposed to the smallest risk of being diagnosed with kidney stones (Figure 3C). The association between the predicted risks of being diagnosed with kidney stones and the explanatory variables shown in the partial dependence plots (Supplementary Figure 2, Figures 3B, C) is in line with the estimated effects of these variables by the fitted logistic regression model (Table 4).
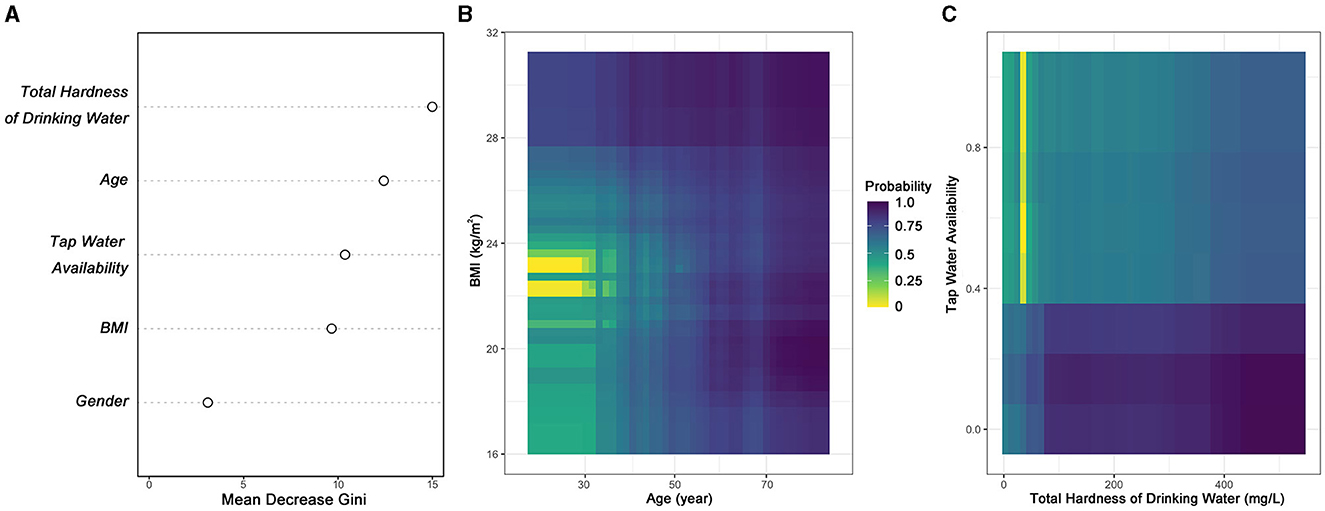
Figure 3. (A) Variance importance measured by decrease in Gini of the five variables in the random forest regression model. Partial dependence of prevalence of kidney stones on (B) age and BMI, and that on (C) total hardness of drinking water and tap water availability. The color gradient represents the range of estimated probability of being diagnosed with kidney stones and is given in the legends of (B, C).
4 Discussion
This study identifies the association between five variables and the prevalence of kidney stones at four villages in Yangxin county (Table 4). Among the five variables, four are commonly identified factors (Semins et al., 2010; Khan et al., 2016; Yang et al., 2016; Zeng et al., 2017; Liu et al., 2018; Tan et al., 2024), but tap water availability has often been ignored because tap water is reported widely available (National Bureau of Statistics of China, 2024) and because previous studies usually focused on groups already having access to tap water (Zeng et al., 2017; Liu et al., 2018; Shu et al., 2019; Tan et al., 2024). Tap water shortages force residents to drink well water or purchase bottle water at extra cost that might not be affordable to many residents at rural villages in Yangxin. Relying on well water likely increases the probability of stone formation due to excessive minerals and harmful geogenic contaminants from groundwater (Yang et al., 2016; Sulaiman et al., 2020). Apart from tap water shortages, higher risks of kidney stones are found associated among males, older population, and underweight or overweight population at the four villages, in agreement with other studies on Chinese populations (Zeng et al., 2017; Liu et al., 2018; Shu et al., 2019; Tan et al., 2024). Gender differences might be due to higher animal protein and salt intake, more stressful workload, and less healthy lifestyle of Chinese males than females (Shu et al., 2019; Duan et al., 2022; Tan et al., 2024). Aging-related changes in physical activities, diets, and metabolic levels as well as aging-related diseases such as diabetes, hypertension, and urinary infections are found related to occurrences of kidney stones in the elderly populations (Wang et al., 2017; Zeng et al., 2017; Duan et al., 2022). Overweight and obese body statuses increase chances of diabetes, heart diseases, and metabolic disorders, which might trigger stone development (Monarca et al., 2006; Wang et al., 2017). Choices of carbohydrate-rich food and sweet soft drinks by overweight and obese populations also contribute to formation of calcium stones in human bodies (Guha et al., 2019; Duan et al., 2022).
Another common risk factor is total hardness of drinking water, which has been found positively related to risks of kidney stones globally (Serio and Fraioli, 1999; Yang et al., 2016; Wasana et al., 2017; Sulaiman et al., 2020). The likelihood of being diagnosed with kidney stones is estimated to increase by 2.59 times for a 100 mg/L rise in total hardness based on our logistic regression model (Table 4). Higher intake of calcium from drinking water is found associated with the occurrence of hypercalciuria, i.e., excess calcium in the urine, which would lead to formation of kidney stones (Sulaiman et al., 2020). At the four villages, total hardness of well water is 2.47–2.91 times the national mean total hardness of groundwater, i.e., 144.1 mg/L (Peng et al., 2023), mostly due to its high concentration of calcium derived from metal-rich groundwater in central China (Zhou et al., 2013; Yang et al., 2016; Xi et al., 2021), especially in areas near Daye Lake (Zhang et al., 2014; Qiu et al., 2023). Mining and fertilization also contribute to high total hardness of well water (Li et al., 2013; Leng et al., 2023). Such a high total hardness of well water makes it risky for residents without well water filters or funds for bottle water to intake more calcium than the WHO recommended amount (<2,500 mg per day) (World Health Organization, 2010). High total hardness of well water might not be that problematic if tap water were soft and its supply were stable. However, total hardness of tap water is as high as that of well water at these villages (Figure 2A), also significantly higher than the national mean total hardness of drinking water (Peng et al., 2023). Total hardness of tap water at LYQ is lower than that at the other three villages (Figure 2A) because tap water supply of soft water has been provided under the local infrastructure reforming program to support development of logistic industry at LYQ (People's Government of Yangxin County, 2021). High total hardness of tap water samples from the other three villages might be due to the simplified water softening procedure followed by the centralized stations at the three villages (Godskesen et al., 2012).
Even if drinking water became softer, limited tap water availability would still put residents in danger of kidney stones (Table 2). Tap water availability at the villages is 56.7% behind the national tap water availability at rural villages, i.e., 90% in 2023 (Center for International Knowledge on Development, 2023). Without tap water supply, one is likely to suffer 9.13 times the risk of kidney stones than those with stable tap water supply. Unfortunately, 5 years after entitled poverty alleviation across the entire Yangxin county, families at rural villages still have limited access to tap water (Table 1; People's Government of Yangxin County, 2022). Lessons from Indonesia (Bakker et al., 2008), Malaysia (Loi et al., 2022), and Tanzania (Jiménez and Pérez-Foguet, 2010) show the importance of sufficient and stable tap water supply to prevent increasing risks of kidney stones and other public health conditions. Soft tap water seems to be the only reliable and economic source of water for these rural villages and is urgently needed to reduce the prevalence of kidney stones at the four villages, which is already 28.7% higher than the national rate (Zeng et al., 2017) and 25.0% higher than the provincial rate (Tan et al., 2024).
Though an average softening depth of 309.3 mg/L CaCO3 is achieved by 103 families installing filters or purchasing bottle water at their own cost (i.e., clusters of filtered and bottle water in Figure 2B), it adds extra financial burden to these families, which is not economically sustainable. According to the National Bureau of Statistics of China (2024), in 2023, the average low-income family's per capita income is 9,215 CNY, 65.7% higher than the average of the four villages. According to our survey, families at the four villages have to pay 3,234 CNY for water each year on average, accounting for 9.7% of their annual household income. Long-term financial burden for water would threaten public health and labor supply at these rural villages (Ingsathit et al., 2010; Hyams and Matlaga, 2014; Zeng et al., 2017; Tan et al., 2024). Residents demonstrate strong willingness to accept government compensation but low confidence in receiving the compensation and no willingness to pay for water treatment. This situation should raise much attention to government to avoid further deterioration in public health and confidence in government (Biswas and Tortajada, 2010; Browne, 2015; Werkneh et al., 2015). The high percentage of householders willing to accept government compensation for water issues (59.6%) with the mean amount of 3,234 CNY indicates a conflict between residents' needs and government support for water supply. Despite the urgent needs, only 9.6% of householders demonstrate confidence in receiving government support, and even fewer (2.6%) are willing to pay government for water treatment. Considering lack of trust in government and long-term financial burden due to water issues, it is not surprising to find that only three householders are willing to pay government for water treatment. However, potential solutions to the high prevalence of kidney stones rely on rebuilding trust in government support, protecting water bodies and surrounding environment, and optimizing allocation of tap water supply at the rural villages. Local government should schedule comprehensive water quality assessments by third-party labs (Loi et al., 2022). Lab test and data analysis reports should be released to the public and kept available for at least 10 years before being archived (Loi et al., 2022). Local government may consider setting dedicated rates within the tap distribution and supply network for tap water supply authority responsible for the villages (Biswas and Tortajada, 2010). It is also necessary for local government to protect reservoirs and limit groundwater pollution, and to regularly replace used well filters for free, which provides additional security in case of temporary tap water shortages (Liu and Yang, 2012). Needs-based allocation of tap water may be helpful to better meet residential demand for clean water (Jiménez and Pérez-Foguet, 2010). This management protocol has been adopted by a number of developed countries to optimize their freshwater resources (Browne, 2015). With lessons from successful cases of rural water supply (Jiménez and Pérez-Foguet, 2010; Liu and Yang, 2012; Loi et al., 2022; Browne, 2015), issues regarding high total hardness of water and the limited tap water availability might be carefully handled and timely solved by government.
The 114 families surveyed in this study represented 25.9% of the families at the four villages. This percentage of coverage can be improved in future studies focusing on rural villages. By extending the study area and increasing the rate of families surveyed, the effects of socioeconomic factors, such as per capita income and GDP (Shu et al., 2019; Duan et al., 2022), on the prevalence of kidney stones may be identified, though they are highly varied and not significant in our models. The prevalence of kidney stones is estimated based on self-reported health conditions, which has been commonly used in other studies (Ingsathit et al., 2010; Semins et al., 2010; Shu et al., 2019; Duan et al., 2022). Tap water availability could be indexed using the method developed by Jeandron et al. (2019) if tap invoices and data of piped water connections are available in Yangxin county. However, without this information, we could only rely on the responses of householders to estimate the percentage of days with tap water during the past 90 days (not the past year to control uncertainty due to memory decay), and use this percentage to account for tap water availability at each family. Because no change of plan was made for tap water supply at the four villages by the government since 2019, and because the free one-time urinary health examination was provided for each adult resident in 2019, tap water availability and the prevalence of kidney stones are responses for the same period, i.e., between April 2019 and July 2023. Though determinant factors of kidney stones remain unclear (Khan et al., 2016), many factors have been identified associated with the disease, including gender, age, body weight status, genetic background, dietary, physical activity, and medication (Semins et al., 2010; Wang et al., 2017; Zeng et al., 2017; Guha et al., 2019; Shu et al., 2019; Sulaiman et al., 2020; Duan et al., 2022; Tan et al., 2024). This study considers five factors, including gender, age, body weight status, total hardness of drinking water, and tap water availability, while controlling genetic background by surveying only the householder at each family and minimizing impacts of physical activity and medication through randomization in family visits. Our logistic regression model has an AUC of 0.855 (Supplementary Figure 1), indicating an 85.5% chance that the model will correctly distinguish those diagnosed with and without kidney stones based on the five variables (Mandrekar, 2010). The error rate of our random forest regression is also low, i.e., 19.3%, and partial dependence of the prevalence of kidney stones on the same set of explanatory variables (Figures 3B, C; Supplementary Figure 2) is in agreement with the estimated effects by the fitted logistic regression model (Table 4) (Kirasich et al., 2018). Based on the two models of the prevalence of kidney stones, our findings indicate urgent needs for tap water supply of soft water and raise attention to the government on providing timely solutions to water issues and supporting residents at rural villages in Yangxin county.
5 Conclusion
The high prevalence of kidney stones, 25.0% higher than the provincial rate, and the low tap water availability (i.e., 34%) should raise public health concerns at the four villages in Yangxin county. In addition to the four common factors, namely gender, age, BMI, and total hardness of drinking water, this study identifies that tap water availability was negatively associated with the prevalence of kidney stones. Although paying extra for water filters and bottle water might reduce total hardness of drinking water, such cost is too much for most families at the rural villages. As residents aging, despite individual effort in controlling body weight within the range of normal BMI, softening drinking water and enhancing supply for tap water are two realistic options for government to reduce the risks of kidney stones, achievable by providing soft tap water for every family. Under the circumstance that most families hoped government to financially support them for drinking water and to solve the water issues, tap water supply of soft water is urgently needed by families at the four rural villages in Yangxin and other families suffering tap water shortages at rural villages in central China. Further studies aiming to raise public and government attention to water-related public health issues in less developed areas may dig deeper into the association between tap water shortages and diseases in other rural villages in China and other developing countries.
Data availability statement
The raw data supporting the conclusions of this article will be made available by the authors, without undue reservation.
Ethics statement
The studies involving humans were approved by Scientific Research and Academic Ethics Committees of Hubei Normal University. The studies were conducted in accordance with the local legislation and institutional requirements. The participants provided their written informed consent to participate in this study.
Author contributions
JZ: Data curation, Formal analysis, Investigation, Visualization, Writing – original draft. MW: Data curation, Investigation, Writing – original draft. TJ: Data curation, Formal analysis, Validation, Writing – original draft. FW: Data curation, Investigation, Validation, Writing – original draft. XS: Validation, Writing – review & editing. YZ: Methodology, Resources, Supervision, Validation, Writing – review & editing. KX: Conceptualization, Formal analysis, Funding acquisition, Methodology, Resources, Visualization, Writing – original draft, Writing – review & editing.
Funding
The author(s) declare financial support was received for the research, authorship, and/or publication of this article. This research was funded by the Hubei Province Young Science and Technology Talent Morning Light Lift Project of the Hubei Association for Science and Technology (No. 202344) and the Open Foundation of Hubei Key Laboratory of Edible Wild Plants Conservation and Utilization (Nos. EWPL202312 and EWPL202411).
Acknowledgments
We acknowledge Liang Zhang, Jie Qin, Meiduo Yang, Ting Mou, Anqi Wang, and Xinwei Li for data collection.
Conflict of interest
The authors declare that the research was conducted in the absence of any commercial or financial relationships that could be construed as a potential conflict of interest.
Publisher's note
All claims expressed in this article are solely those of the authors and do not necessarily represent those of their affiliated organizations, or those of the publisher, the editors and the reviewers. Any product that may be evaluated in this article, or claim that may be made by its manufacturer, is not guaranteed or endorsed by the publisher.
Supplementary material
The Supplementary Material for this article can be found online at: https://www.frontiersin.org/articles/10.3389/frwa.2024.1464783/full#supplementary-material
References
Ahmad, F., Nada, M. O., Farid, A. B., Haleem, M. A., and Razack, S. M. A. (2015). Epidemiology of urolithiasis with emphasis on ultrasound detection: a retrospective analysis of 5371 cases in Saudi Arabia. Saudi J. Kidney Dis. Transpl. 26, 386–391. doi: 10.4103/1319-2442.152557
Alaily, F. (1995). Soil properties of quaternary deposits in the arid part of northeastern Somalia. Arid Land Res. Rehabil. 9, 39–50. doi: 10.1080/15324989509385872
Ansell, R. O. (2005). “Ion-selective electrodes | Water applications”, in Encyclopedia of Analytical Science, 2nd Edn., eds. P. Worsfold, A. Townshend, and C. Poole (Amsterdam: Elsevier), 540–545. doi: 10.1016/B0-12-369397-7/00298-3
Bakker, K., Kooy, M., Shofiani, N. E., and Martijn, E. J. (2008). Governance failure: rethinking the institutional dimensions of urban water supply to poor households. World Dev. 36, 1891–1915. doi: 10.1016/j.worlddev.2007.09.015
Biswas, A. K., and Tortajada, C. (2010). Water supply of Phnom Penh: an example of good governance. Int. J. Water Resour. Dev. 26, 157–172. doi: 10.1080/07900621003768859
Browne, A. L. (2015). Insights from the everyday: implications of reframing the governance of water supply and demand from ‘people' to ‘practice'. WIREs Water 2, 415–424. doi: 10.1002/wat2.1084
Bureau of Statistics of Huangshi and National Bureau of Statistics of China. (2022). Huangshi Statistical Yearbook. Beijing: China Statistics Press, 80–83.
Center for International Knowledge on Development (2023). China's progress report on implementation of the 2030 Agenda for Sustainable Development. Available at: https://www.mfa.gov.cn/eng/topics_665678/2030kcxfzyc/202310/P020231018367257234614.pdf (accessed July 13, 2024).
Chen, W., Zhang, X., Zhang, J., Duan, N., Gong, X., Liu, S., et al. (2022). Characteristics, sources and health risk of heavy metals in road dust in the typical county town, central China. Appl. Sci. 12:12958. doi: 10.3390/app122412958
Chen, Y., Guo, F., Wang, J., Cai, W., Wang, C., Wang, K., et al. (2020). Provincial and gridded population projection for China under shared socioeconomic pathways from 2010 to 2100. Sci. Data 7:83. doi: 10.1038/s41597-020-0421-y
Department of Water Resources of Hubei Province (2020). Prioritize drinking water safety as the number one task of poverty alleviation in the industry. Available at: http://slt.hubei.gov.cn/fbjd/dtyw/202010/t20201016_2958314.shtml (accessed July 14, 2024).
Downing, J. (2004). “Turbidity monitoring,” in Environmental Instrumentation and Analysis Handbook, eds. D. Randy, P. E. Down, and H. Lehr Jay (Hoboken, NJ: John Wiley and Sons), 511–546. doi: 10.1002/0471473332.ch24
Duan, Y., Wu, R., Ji, H., Chen, X., Xu, J., Chen, Y., et al. (2022). Drinking water behavior and willingness to use filters by middle-aged and elderly residents in rural areas: a cross-sectional study in Tengchong, China. Front. Public Health 10:961870. doi: 10.3389/fpubh.2022.961870
Edvardsson, V. O., Indridason, O. S., Haraldsson, G., Kjartansson, O., and Palsson, R. (2013). Temporal trends in the incidence of kidney stone disease. Kidney Int. 83, 146–152. doi: 10.1038/ki.2012.320
Frassetto, L., and Kohlstadt, I. (2011). Treatment and prevention of kidney stones: an update. Am Fam. Phys. 84, 1234–1242.
Godskesen, B., Hauschild, M., Rygaard, M., Zambrano, K., and Albrechtsen, H. J. (2012). Life cycle assessment of central softening of very hard drinking water. J. Environ. Manage. 105, 83–89. doi: 10.1016/j.jenvman.2012.03.030
Greenwell, B. M. (2017). Pdp: an R package for constructing partial dependence plots. R J. 9:421. doi: 10.32614/RJ-2017-016
Guha, M., Banerjee, H., Mitra, P., and Das, M. (2019). The demographic diversity of food intake and prevalence of kidney stone diseases in the Indian continent. Foods 8:37. doi: 10.3390/foods8010037
Hintz, W. D., Arnott, S. E., Symons, C. C., Greco, D. A., McClymont, A., Brentrup, J. A., et al. (2022). Current water quality guidelines across North America and Europe do not protect lakes from salinization. Proc. Natl. Acad. Sci. U.S.A. 119:e2115033119. doi: 10.1073/pnas.2115033119
Hori, M., Shozugawa, K., Sugimori, K., and Watanabe, Y. (2021). A survey of monitoring tap water hardness in Japan and its distribution patterns. Sci. Rep. 11:13546. doi: 10.1038/s41598-021-92949-8
Hubei Provincial Government (2019). The provincial government approved 17 counties including Yangxin to exit poverty-stricken counties in 2019. Available at: http://www.hubei.gov.cn/zwgk/hbyw/hbywqb/201905/t20190501_1391882.shtml (accessed July 15, 2024).
Hyams, E. S., and Matlaga, B. R. (2014). Economic impact of urinary stones. Transl. Androl. Urol. 3:278. doi: 10.3978/j.issn.2223-4683.2014.07.02
Ihka, R., and Gentlema, R. (1996). R: a language for data analysis and graphics. J. Comput. Graph. Stat. 5, 299–314. doi: 10.1080/10618600.1996.10474713
Ingsathit, A., Thakkinstian, A., Chaiprasert, A., Sangthawan, P., Gojaseni, P., Kiattisunthorn, K., et al. (2010). Prevalence and risk factors of chronic kidney disease in the Thai adult population: Thai SEEK study. Nephrol. Dial. Transplant. 25, 1567–1575. doi: 10.1093/ndt/gfp669
Jeandron, A., Cumming, O., Kapepula, L., and Cousens, S. (2019). Predicting quality and quantity of water used by urban households based on tap water service. npj Clean Water 2:23. doi: 10.1038/s41545-019-0047-9
Jiménez, A., and Pérez-Foguet, A. (2010). Challenges for water governance in rural water supply: lessons learned from Tanzania. Int. J. Water Resour. Dev. 26, 235–248. doi: 10.1080/07900621003775763
Khan, S. R., Pearle, M. S., Robertson, W. G., Gambaro, G., Canales, B. K., Doizi, S., et al. (2016). Kidney stones. Nat. Rev. Dis. Primers 2:16008. doi: 10.1038/nrdp.2016.8
Kirasich, K., Smith, T., and Sadler, B. (2018). Random forest vs logistic regression: binary classification for heterogeneous datasets. SMU Data Sci. Rev. 1:9.
Larson, T. E., Buswell, A. M., Ludwig, H. F., and Langelier, W. F. (1942). Calcium carbonate saturation index and alkalinity interpretations [with discussion]. J Am. Water Work Assoc. 34, 1667–1684. doi: 10.1002/j.1551-8833.1942.tb17295.x
Leng, Q., Ren, D., Wang, Z., Zhang, S., Zhang, X., Chen, W., et al. (2023). Assessment of potentially toxic elements pollution and human health risks in polluted farmland soils around distinct mining areas in China—a case study of Chengchao and Tonglushan. Toxics 11:574. doi: 10.3390/toxics11070574
Lenth, R. (2022). emmeans: Estimated marginal means, aka least-squares means. R package version 1.10.3. Available at: https://cran.r-project.org/web/packages/emmeans (accessed July 13, 2024).
Li, P., Qian, H., Wu, J., Zhang, Y., and Zhang, H. (2013). Major ion chemistry of shallow groundwater in the Dongsheng Coalfield, Ordos Basin, China. Mine Water Environ. 32, 195–206. doi: 10.1007/s10230-013-0234-8
Li, P., and Wu, J. (2019). Drinking water quality and public health. Expo. Health 11, 73–79. doi: 10.1007/s12403-019-00299-8
Liu, J., and Yang, W. (2012). Water sustainability for China and beyond. Science 337, 649–650. doi: 10.1126/science.1219471
Liu, Y., Chen, Y., Liao, B., Luo, D., Wang, K., Li, H., et al. (2018). Epidemiology of urolithiasis in Asia. Asian J. Urol. 5, 205–214. doi: 10.1016/j.ajur.2018.08.007
Loi, J. X., Chua, A. S. M., Rabuni, M. F., Tan, C. K., Lai, S. H., Takemura, Y., et al. (2022). Water quality assessment and pollution threat to safe water supply for three river basins in Malaysia. Sci. Total Environ. 832:155067. doi: 10.1016/j.scitotenv.2022.155067
Mandrekar, J. N. (2010). Receiver operating characteristic curve in diagnostic test assessment. J. Thorac. Oncol. 5, 1315–1316. doi: 10.1097/JTO.0b013e3181ec173d
Menard, S. (2002). “Applied logistic regression analysis,” in Quantitative Applications in the Social Sciences, 2nd Edn, ed. S. L. Michael (Thousand Oaks, CA: SAGE Publications), 98.
Monarca, S., Donato, F., Zerbini, I., Calderon, R. L., and Craun, G. F. (2006). Review of epidemiological studies on drinking water hardness and cardiovascular diseases. Eur. J. Prev. Cardiol. 13, 495–506. doi: 10.1097/01.hjr.0000214608.99113.5c
National Bureau of Statistics of China (2024). National economy witnessed momentum of recovery with solid progress in high-quality development in 2023. Available at: https://www.stats.gov.cn/english/PressRelease/202401/t20240117_1946605.html (accessed July 13, 2024).
National Energy Administration (2014). National Coal Production Capacity Inventory (Sixth Batch). Available at: http://zfxxgk.nea.gov.cn/auto85/201410/P020141022472506304780.pdf (accessed July 14, 2024).
Peng, H., Lu, T., Xiong, S., Ferrer, A. S. N., and Wang, Y. (2023). Calcium and magnesium in China's public drinking water and their daily estimated average requirements. Environ. Geochem. Health. 45, 3447–3464. doi: 10.1007/s10653-022-01416-4
People's Government of Yangxin County (2019). Announcement of the overall planning for Weiyuankou Township of Yangixin County (2018-2030). Available at: http://www.yx.gov.cn/xwdt/gsgg/201901/t20190116_499232.html (accessed July 15, 2024).
People's Government of Yangxin County (2021). The reserve list for Yangxin County to consolidate and expand poverty alleviation achievements and rural revitalization projects in 2022-2023. Available at: http://www.yx.gov.cn/zfxxgk/dfbmptlj/zfgzjg/xfpkfbgs/zc_18640/zfwj_11074/202112/t20211229_866213.html (accessed July 15, 2024).
People's Government of Yangxin County (2022). The Municipal Water Resources and Lake Bureau conducted research and provided guidance on drinking water safety in Yangxin county. Available at: http://www.yx.gov.cn/xwdt/bmgz/202208/t20220804_928093.html (accessed January 15, 2024).
Qiu, Z., Liu, Q., Zhang, R., Zhan, C., Liu, S., Zhang, J., et al. (2023). Distribution characteristics and pollution assessment of phosphorus forms, TOC, and TN in the sediments of Daye Lake, Central China. J. Soils Sediments 23, 1023–1036. doi: 10.1007/s11368-022-03398-3
Robin, X., Turck, N., Hainard, A., Tiberti, N., Lisacek, F., Sanchez, J. C., et al. (2011). pROC: an open-source package for R and S+ to analyze and compare ROC curves. BMC Bioinformatics 12, 1–8. doi: 10.1186/1471-2105-12-77
Sayre, I. M. (1988). International standards for drinking water. J. Am. Water Works Assoc. 80, 53–60. doi: 10.1002/j.1551-8833.1988.tb02980.x
Scales Jr, C. D., Smith, A. C., Hanley, J. M., Saigal, C. S., and Urologic Diseases in America Project (2012). Prevalence of kidney stones in the United States. Eur. Urol. 62, 160–165. doi: 10.1016/j.eururo.2012.03.052
Semins, M. J., Shore, A. D., Makary, M. A., Magnuson, T., Johns, R., Matlaga, B. R., et al. (2010). The association of increasing body mass index and kidney stone disease. J. Urol. 183, 571–575. doi: 10.1016/j.juro.2009.09.085
Serio, A., and Fraioli, A. (1999). An observational and longitudinal study on patients with kidney stones treated with Fiuggi mineral water. Clin. Ter. 150, 215–219.
Shaver, R. B. (1993). Field vs. lab alkalinity and pH: effects on ion balance and calcite saturation index. Ground Water Monit. Remediat. 13, 104–112. doi: 10.1111/j.1745-6592.1993.tb00441.x
Shu, X., Cai, H., Xiang, Y. B., Li, H., Lipworth, L., Miller, N. L., et al. (2019). Green tea intake and risk of incident kidney stones: prospective cohort studies in middle-aged and elderly Chinese individuals. Int. J. Urol. 26, 241–246. doi: 10.1111/iju.13849
Sobsey, M. D. (2006). Drinking water and health research: a look to the future in the United States and globally. J. Water Health 4, 17–21. doi: 10.2166/wh.2006.0039
Sorokin, I., Mamoulakis, C., Miyazawa, K., Rodgers, A., Talati, J., Lotan, Y., et al. (2017). Epidemiology of stone disease across the world. World J. Urol. 35, 1301–1320. doi: 10.1007/s00345-017-2008-6
Standards Press of China (2022). Standards for Drinking Water Quality. GB 5749-2022. Beijing: Stand. Press China, 1–12.
Sulaiman, S. K., Enakshee, J., Traxer, O., and Somani, B. K. (2020). Which type of water is recommended for patients with stone disease (hard or soft water, tap or bottled water): evidence from a systematic review over the last 3 decades. Curr. Urol. Rep. 21, 1–8. doi: 10.1007/s11934-020-0968-3
Sun, W., Song, J., Yang, W., Zheng, Y., Li, C., Kuang, D., et al. (2020). Distribution of carbonate rocks and variation analysis of karst water resources in China. Carbonates Evaporites 35:121. doi: 10.1007/s13146-020-00657-7
Tadono, T., Nagai, H., Ishida, H., Oda, F., Naito, S., Minakawa, K., et al. (2016). Generation of the 30 m-mesh global digital surface model by ALOS PRISM. Int. Arch. Photogramm. Remote Sens. Spatial Inf. Sci. XLI-B4, 157–162. doi: 10.5194/isprs-archives-XLI-B4-157-2016
Tan, S., Yuan, D., Su, H., Chen, W., Zhu, S., Yan, B., et al. (2024). Prevalence of urolithiasis in China: a systematic review and meta-analysis. BJU Int. 133, 34–43. doi: 10.1111/bju.16179
Thongprayoon, C., Krambeck, A. E., and Rule, A. D. (2020). Determining the true burden of kidney stone disease. Nat. Rev. Nephr. 16, 736–746. doi: 10.1038/s41581-020-0320-7
Vingerhoeds, M. H. Nijenhuis-de Vries, M.A., Ruepert, N., van der Laan, H., Bredie, W.L., and Kremer, S. (2016). Sensory quality of drinking water produced by reverse osmosis membrane filtration followed by remineralisation. Water Res. 94, 42–51. doi: 10.1016/j.watres.2016.02.043
Wang, W., Fan, J., Huang, G., Li, J., Zhu, X., Tian, Y., et al. (2017). Prevalence of kidney stones in mainland China: a systematic review. Sci. Rep. 7:41630. doi: 10.1038/srep41630
Wasana, H. M., Perera, G. D., Gunawardena, P. D. S., Fernando, P. S., and Bandara, J. (2017). WHO water quality standards vs synergic effect(s) of fluoride, heavy metals and hardness in drinking water on kidney tissues. Sci. Rep. 7:42516. doi: 10.1038/srep42516
Werkneh, A. A., Medhanit, B. Z., Abay, A. K., and Damte, J. Y. (2015). Physico-chemical analysis of drinking water quality at Jigjiga City, Ethiopia. Am. J. Environ. Prot. 4, 29–32. doi: 10.11648/j.ajep.20150401.14
Wickham, H. (2011). Ggplot2. Wiley Interdiscip. Rev. Comput. Stat. 3, 180–185. doi: 10.1002/wics.147
World Health Organization (2010). Hardness in drinking-water: background document for development of WHO guidelines for drinking-water quality (No. WHO/HSE/WSH/10.01/10). Geneva: World Health Organization, 1–19.
Xi, X., Wang, S., Yao, L., Zhang, Y., Niu, R., Zhou, Y., et al. (2021). Evaluation on geological environment carrying capacity of mining city–a case study in Huangshi City, Hubei Province, China. Int. J. Appl. Earth Obs. Geoinf. 102:102410. doi: 10.1016/j.jag.2021.102410
Yang, Y., Deng, Y., and Wang, Y. (2016). Major geogenic factors controlling geographical clustering of urolithiasis in China. Sci. Total Environ. 571, 1164–1171. doi: 10.1016/j.scitotenv.2016.07.117
Zeng, G., Mai, Z., Xia, S., Wang, Z., Zhang, K., Wang, L., et al. (2017). Prevalence of kidney stones in China: an ultrasonography based cross-sectional study. BJU Int. 120, 109–116. doi: 10.1111/bju.13828
Zhang, J., Li, Z. H., Chen, J., Wang, M., Tao, R., Liu, D., et al. (2014). Assessment of heavy metal contamination status in sediments and identification of pollution source in Daye Lake, Central China. Environ. Earth Sci. 72, 1279–1288. doi: 10.1007/s12665-014-3047-6
Zheng, P., Gong, Y., Wang, J., and Zeng, X. (2017). Elemental analysis of mineral water by solution-cathode glow discharge–atomic emission spectrometry. Anal. Lett. 50, 1512–1520. doi: 10.1080/00032719.2016.1233243
Zhou, B. F. (2002). Predictive values of body mass index and waist circumference for risk factors of certain related diseases in Chinese adults-study on optimal cut-off points of body mass index and waist circumference in Chinese adults. BES 15, 83–96.
Keywords: tap water availability, total hardness, kidney stones, livelihoods, cross-sectional analysis, China
Citation: Zhao J, Wang M, Jiang T, Wang F, Shi X, Zhang Y and Xu K (2024) Soft tap water urgently needed for reducing risks of kidney stones at the rural villages in Yangxin, a poverty-alleviated county in central China. Front. Water 6:1464783. doi: 10.3389/frwa.2024.1464783
Received: 15 July 2024; Accepted: 09 September 2024;
Published: 27 September 2024.
Edited by:
Pradeep K. Naik, Central Ground Water Board, IndiaReviewed by:
Saranga Diyabalanage, University of Sri Jayewardenepura, Sri LankaLiang Zhao, Michigan State University, United States
Copyright © 2024 Zhao, Wang, Jiang, Wang, Shi, Zhang and Xu. This is an open-access article distributed under the terms of the Creative Commons Attribution License (CC BY). The use, distribution or reproduction in other forums is permitted, provided the original author(s) and the copyright owner(s) are credited and that the original publication in this journal is cited, in accordance with accepted academic practice. No use, distribution or reproduction is permitted which does not comply with these terms.
*Correspondence: Kun Xu, a3VueHUxQGhibnUuZWR1LmNu