Abstract
Reliance on groundwater during drought cycles is a common cause of overdraft conditions, particularly in regions dominated by irrigated agriculture. Groundwater overdraft is evidenced by declining water table levels, widespread well failure, and land subsidence. Given the severity of these outcomes, natural resource managers are under increasing pressure to create economic and equitable sustainability plans in response to human water demands and climate change impacts. This work describes the development of a novel toolkit (software) designed to support multicriteria decisions centered around restoring groundwater sustainability in overdrafted regions. The toolkit was developed collaboratively with participants in California’s Multibenefit Land Repurposing Program (MLRP), which aims to repurpose irrigated agricultural land to reduce groundwater extraction while providing multiple benefits. The toolkit integrates existing spatial data layers using a Web-based, open-source package (Shiny R) to assess the suitability of land for repurposing. We used fuzzy logic to create six land repurposing suitability indices for (1) enhancing groundwater recharge, (2) minimizing negative impacts to the agricultural economy, (3) increasing renewable energy production, (4) increasing wildlife habitat restoration and conservation, (5) mitigating local flood risk, and (6) reducing environmental health risks in disadvantaged communities. These indices (or subsets) can be combined as weighted averages to create user-specified multibenefit scenarios. The resulting output can be inspected locally to screen prospective land parcels based on their repurposing potential, or holistically to prioritize specific areas in the context of regional land repurposing strategies. We illustrate the development, application, and possible uses of the toolkit in the context of two critically overdrafted groundwater subbasins, Tule and Kaweah, both located in California’s San Joaquin Valley. The methods described are transferable to other overdrafted regions assuming that adequate geospatial data is available. Given its Web-accessibility and user-controlled weighting scheme, the MLRP toolkit can facilitate regional coordination of resource agencies and stakeholders and help to maximize multiple benefits of land repurposing while achieving groundwater sustainability.
1 Introduction
Natural resource managers have many technical and capacity-related challenges in regard to identifying economically feasible and equitable sustainability plans. Effective sustainability planning recognizes the interconnectedness of socio-ecological systems and strives for solutions that achieve multiple economic, sociocultural, and ecological benefits (Biggs et al., 2015). Given these complexities and desire for long-term solutions, this planning can be expensive in terms of time and money. Participatory and collaborative governance approaches offer a framework in which this planning can be effectively developed and implemented (Emerson and Nabatchi, 2015). Research in policy and decision-making demonstrates that processes embracing participatory and collaborative governance are more likely to yield more effective, equitable and implementable outcomes than more hierarchical (particularly top-down) approaches (Heinelt, 2002; Callahan, 2007; Newig et al., 2018). However, an issue with such approaches is that comprehensive participation and authentic collaboration are challenging to achieve for complex socioenvironmental problems (Perrone et al., 2023) and can also be expensive. For this reason, tools that enable the participation of interested actors and facilitate the dialogue about desired objectives and concerns with decision makers are essential.
Public participatory geographical information system (PPGIS) approaches represent one strategy for facilitating participatory decision-making in natural resource management and other complex decision spaces (Schlossberg and Shuford, 2005; Sieber, 2006; Brown and Donovan, 2014; Brown and Kyttä, 2014). It involves the participation of stakeholders from multidisciplinary sectors, including academics, practitioners and community members, in mapping efforts that can inform and shape policy and decision-making outcomes. In this study, we describe the development of a web-based PPGIS-type application for facilitating transparent, participatory land repurposing prioritization and decision-making in the context of achieving groundwater sustainability and multiple benefits. Our software application, known as the Multibenefit Land Repurposing Program (MLRP) toolkit, was developed to support the implementation of MLRP projects in the San Joaquin Valley (SJV), California (DOC, 2022). The SJV is a major agricultural region facing severe water sustainability and climate change challenges (Hanak et al., 2019). Located in a highly variable climate, characterized by hot, dry summers and cool, wet winters, most of the region’s agriculture is supplied by surface water storage (reservoirs and snowmelt) during normal to wet years. During droughts, groundwater is used to fill the gap between supply and demand in many subbasins. In addition, several agriculturally intensive subbasins in the southern part of the Valley lack access to surface water, relying mainly on groundwater or imported water from other subbasins (Harder and Van de Water, 2017; ICF, 2022). Following decades of agricultural expansion, drought intensification, and improving pump technology, the SJV’s once vast aquifer system began to fail, as evidenced by rapid water table declines, thousands of wells going dry (Perrone and Jasechko, 2017; Rodríguez-Flores et al., 2023), increased pumping cost (Medellín-Azuara et al., 2015), decreased groundwater quality (Smith et al., 2018; Levy et al., 2021; Quandt et al., 2023) and severe land subsidence (Faunt et al., 2016).
California’s Sustainable Groundwater Management Act (SGMA 2014) marked the state’s intent to replenish its aquifers and reduce extraction to sustainable levels by 2040. Specific regional and subbasin scale strategies and programs (California Water Commission, 2017; California Department of Conservation, 2023b; Crowfoot et al., 2023; CDFA, 2024) have taken time to develop but are beginning to appear, addressing many of the factors needed to manage supply (e.g., managed aquifer recharge) and demand (e.g., groundwater allocation and land retirement programs) of groundwater. MLRP is an example of a program that addresses one key aspect of SGMA implementation, groundwater use reduction via land repurposing. Launched in 2022, MLRP funds regionally coordinated planning and implementation of projects that achieve groundwater use reduction and enhance aquifer recharge in some critically overdrafted subbasins in the SJV and other parts of the state. An important MLRP requirement is that land repurposing must not only support groundwater sustainability but also result in multiple benefits for ecosystems and communities, particularly under-resourced rural communities that are common in the SJV and that face environmental justice issues, such as lack of clean drinking water and a healthy environment (Flores-Landeros et al., 2022). Substantial changes are expected in relevant subbasins, with some estimates suggesting the need for transitioning 15 to 20% of the irrigated land to less water-intensive uses and enhancing managed aquifer recharge when excess surface water is available, such as during winter storms (Hanak et al., 2019, 2023; Escriva-Bou et al., 2023). Reduction in agricultural production and land idling (or fallowing) may result in job losses, decreased crop revenues, and regional economic impacts in agriculturally related industries (Medellín-Azuara et al., 2015). Idling land, in the absence of active management (e.g., cover cropping), can also lead to undesirable outcomes such as an increase in dust emissions, which increase the risk of spreading valley fever spores found in soil (Ayres et al., 2022a) and spreading of invasive weeds. Therefore, strategic and effective transition planning will be necessary to maximize benefits and minimize the adverse impacts of repurposing agricultural land (Hanak et al., 2019). Particularly, as MLRP requires, through a participatory and collaborative framework that aims to include all the interested actors (e.g., farmers, community members and conservation groups) objectives and concerns.
GIS-based tools that provide multicriteria decision-support for land management are becoming commonplace. Such tools have been used to classify land for restoration and conservation purposes (CDFW, 2018; American Farmland Trust, 2020; Anderson et al., 2023), renewable (photovoltaic) energy (Wu et al., 2019), managed aquifer recharge (O’Geen et al., 2015; Balmagia et al., 2019; Marwaha et al., 2021), and farmland preservation (California Department of Conservation, 2023a). However, the decision space for most of these tools is typically limited to two or three land use options, which may leave some stakeholders feeling excluded from the planning process. In addition, even when GIS-based tools do enable stakeholders to map multiple outcomes, the precalculated, or black box, nature of these outcomes estimated by experts can be perceived as predetermined “top down” outcomes rather than collaboratively developed. Poor implementation can achieve inferior outcomes relative to the top-down approaches by (at least) wasting resources or (at worst) resulting in ill-fated decisions that are less equitable and acceptable for stakeholders and/or detrimental to the environment (Irvin and Stansbury, 2004; Newig et al., 2018). Empirical evidence from more than 100 recently developed groundwater sustainability plans in California supports the value of comprehensive and deep engagement with stakeholders (Perrone et al., 2023; Koebele et al., 2024). However, these researchers also concluded that most of those plans (91%) failed to comprehensively integrate stakeholders. Here, a PPGIS-type application is designed in consultation with key partners and stakeholders and is intended to be accessible to a broad user group, including decision makers (e.g., government agencies), nongovernmental organizations (NGOs), individual landowners, and other community members.
This work describes the development and preliminary testing of a toolkit for facilitating multicriteria decision-making in the context of land repurposing to restore and sustain groundwater resources and provide benefits to communities and ecosystems. The tool integrates multicriteria analysis, GIS, and fuzzy logic. Its features and geospatial data were developed iteratively through a series of meetings and workshops (see Section 2). Multicriteria analysis and fuzzy logic have been integrated into previous GIS-based tools to support land management (Nyeko, 2012; Nguyen et al., 2015; AbdelRahman et al., 2018). These previous tools typically rely on either expert-derived (Yang et al., 2008; Nguyen et al., 2015) or citizen-derived inputs (Garcia et al., 2018), with few incorporating both perspectives and generally generating static output maps (Zhang et al., 2012). The MLRP toolkit addresses these gaps by combining expert and citizen criteria through a fuzzy logic framework, resulting in dynamic maps. This ensures that the potential outcomes of decision-making processes align with the evolving needs, values and preferences of the users. The open-source toolkit is designed to be transferable to other regions, adapting to the evolving local socio-environmental context and groundwater management policies.
The toolkit includes six land repurposing suitability indices, which were agreed upon by the MLRP partners and stakeholders: agricultural productivity, recharge potential, habitat restoration and conservation, renewable energy (solar), environmental health risk mitigation, and flood risk mitigation. It uses fuzzy logic to aggregate existing datasets into categorical maps that describe the suitability of land to being repurposed. We present the development methods and provide illustrative results from the MLRP toolkit for the Kaweah and Tule subbasins, which are two of the most over drafted basins in the SJV, that are actively implementing SGMA and developing strategies to reduce groundwater demand through land repurposing actions. This context makes them ideal sites for developing the toolkit and testing its transferability to other subbasins.
2 Materials, data sources, and participatory design
After a combination of research and consultation with project partners and multiple stakeholder workshops (described below), we selected previously vetted, publicly accessible data from state and federal agencies and NGOs to define decision variables that are key to characterizing land suitability for repurposing into less water-intensive uses. Our decision variables included land use information, particularly agricultural factors, spatial land suitability for managed aquifer recharge, environmental risk mitigation, habitat restoration and conservation, renewable energy projects, and local flood hazard mitigation. The datasets and sources used are detailed in Supplementary Table S1. Using existing spatial products saved time and effort related to creating new products and bypassed the processes needed to vet new products with partners and stakeholders. While there were a few conflicts about the most appropriate products to incorporate, these were typically resolved via discussion among partners. However, in some cases partners felt strongly that locally developed geospatial products were more relevant than state or federal ones. This was true for the habitat restoration and conservation datasets and resulted in different habitat suitability projects being implemented in the toolkit for the two test cases (see Section 3.3.4).
Our participatory design process (Supplementary Figure S2) leveraged the MLRP governance structures (Supplementary Table S2) adopted by the Tule and Kaweah MLRP projects to iteratively develop the form and features of the toolkit. Both MLRP project teams included Groundwater Sustainability Agencies (GSAs), conservation and land trust organizations, disadvantaged community representatives, an educational organization, and academic researchers. All MLRP grants were overseen by the California Department of Conservation, which created a Statewide Support Entity to observe and advise the grantees. The more complex Tule MLRP governance structure included a project manager, initially a conservation organization (The Nature Conservancy) and later a water agency (Lower Tule River Irrigation District), overseeing a Steering Committee, an Implementation Committee, and an Outreach and Engagement Committee. These partner-constituted committees met virtually on a monthly basis during the toolkit development. Two stakeholder committees (General Stakeholders Committee and Agricultural Advisory Committee) were constituted using calls for participation and met on a roughly quarterly basis, with in-person and hybrid meetings organized and facilitated by the Outreach and Engagement Committee. The Kaweah MLRP engaged a consulting firm (Valley Eco) as the project manager, and similar partner types as with the Tule MLRP. Governance was simpler in the Kaweah case, involving a Stakeholder Advisory Committee, general stakeholder meetings, and periodic meetings with the grantee institution (Kaweah Delta Water Conservation District). Kaweah meetings were held on a roughly quarterly basis. Overall, the governance structures and meeting schedules allowed toolkit developers ample opportunities to design, demonstrate, collect feedback, and modify the toolkit versions for the respective subbasins.
To develop the MLRP toolkit we selected Shiny, an R package that is appropriate for creating interactive geospatial web applications. It allows data management and operations to be programmed in the background, using R and python, and does not require users to have specialized software skills beyond those used for web browsing. Additionally, R is an open-source programming language which facilitates low-cost collaborative modification and translations of the application to other regions. All geospatial data shown in the toolkit was preprocessed using ArcGIS pro and then loaded into R for further analysis and processing (see Section 3.3).
3 Methods
3.1 Project setting and general approach
The purpose of the MLRP toolkit is to enable regional coordination groups and key surface water or groundwater decision-makers, to rapidly visualize key spatial data sets in each subbasin that inform the suitability of land for repurposing. It can also communicate and help create consensus in outreach events with NGOs, landowners, and other stakeholders. For example, the MLRP toolkit shows land with high water use crops that would be more suitable for repurposing than land with low water use crops, all else being equal. Suitability values are calculated by combining different existing geospatial datasets (Section 3.3 and Supplementary Table S1) that have been standardized to range from 0 (highly unsuitable) to 1 (highly suitable) for repurposing. The datasets are scaled and combined using fuzzy functions consistent with frequency distribution of the attribute (see Section 3.3 for details). The resulting toolkit products are interactive heat maps that describe the relative MLRP suitability of land parcels across a subbasin.
Given that the MLRP requires partnerships and collaborations among multiple sectors, the tool’s development was characterized by iterative and continuous stakeholder engagement. Regular meetings were held with a diverse group of stakeholders, including government agencies, NGOs, landowners, farmers and community members, to ensure that the tool meets their needs. At each meeting, we presented the latest advancements of the toolkit and solicited verbal feedback on topics such as user interface design, datasets selection, data validation and local knowledge integration into preliminary results, legal and social considerations, and insights on technical parameters such as thresholds for fuzzy membership functions and other quantitative criteria. The intent throughout the process was to keep the toolkit as user-friendly as possible for stakeholders without advanced geospatial software skills while ensuring that the data sets used were meaningful and trusted by all users.
The two case studies connected to this work showcase different participatory entities and processes (as described further in Section 3.2). The key objectives that guided the tool’s design were based on partner and stakeholder input, these include:
Transparency: Ensuring open access to data and processes.
User-friendliness: Accessible to stakeholders without advanced geospatial software skills.
Interactivity: Allowing users to explore different selection criteria or drivers (e.g., conservation versus employment).
Multi-input integration: Combining multiple land attribute maps into a new, unified map.
Inclusion of disadvantaged communities: Ensuring these communities’ needs are prioritized in the decision-making process and that project outcomes aim to benefit their needs.
3.2 Case study areas
We developed the MLRP toolkit simultaneously for the Kaweah and Tule groundwater subbasins, within the greater Tulare Lake basin, in California’s San Joaquin Valley (Figure 1). These subbasins rely on groundwater for 90% of their overall water supply (Groundwater Exchange, 2024a, 2024b). The climate in this region is characterized by mild winters and hot dry summers with 7 to 13 inches (178–330 mm) of precipitation. Both are classified as high priority subbasins by the California Department of Water Resources (DWR), a designation that accounts for population, irrigated acreage, reliance on groundwater, groundwater overdraft, and land subsidence. SGMA requires that these high-priority basins develop and implement a groundwater sustainability plan. The mandated target year for achieving groundwater sustainability by SGMA is 2040. Additionally, these two subbasins were awarded funds through the California Department of Conservation’s Multibenefit Land Repurposing Program (MLRP). These funds provide support for subbasins to plan and pilot land repurposing activities that should also be aligned with their groundwater management plan and strategies to reduce groundwater use. As the name implies, the program’s main objective is to repurpose irrigated agricultural land toward less water intensive land uses. The program requires that the repurposed land create other benefits in the subbasin, especially for underserved rural communities who depend on domestic well water. While the Kaweah and Tule subbasins are adjacent and have similar geological and socioeconomical characteristics, their water budget, water conveyance infrastructure, land use and cropping patterns, as well as their MLRP governance structure is different. These key differences result in different regional priorities and processes, presenting an opportunity to learn from the parallel development and testing of the MLRP toolkit in terms of its perceived usability, usefulness, and transferability between the two subbasins.
Figure 1

Case study site locations and relevant features for land repurposing (unspecified white space is predominantly agriculture and dairy operations).
The Kaweah subbasin is a 441,028-acre (178,478 ha) area with an estimated population of 339,000 people, of which around 40% live in disadvantaged communities as defined by the California Environmental Protection Agency (CalEPA, 2022). Most of the Kaweah subbasin is agricultural, with major crops including walnuts, pistachios, citrus, grain and pasture. The primary surface water source is the Kaweah River, whose main distributary is the St. Johns River. The subbasin also imports surface water via the Friant-Kern Canal of the Central Valley Project. The Kaweah subbasin’s groundwater supply stems from part of the semi-confined Central Valley aquifer system where the west side of the aquifer is divided into an upper and lower aquifer by the extent of the Corcoran Clay, the major confining bed in the Valley, consisting of fine-grained lacustrine deposit (primarily clay; Faunt, 2009). Groundwater flows from northeast to southwest, with natural recharge occurring primarily from seepage from the Kaweah and St. Johns Rivers, intermittent streams, and from irrigation systems, with direct precipitation contributing a small fraction (ICF, 2022). The current average annual groundwater overdraft in Kaweah is estimated to be around 230,700 Acre-feet year−1 (~285 Mm3 year−1; Harder and De Groot, 2024).
The 477,578-acre (193,269 ha) Tule subbasin has a population of 95,000 people with over 60% of the people residing in Porterville, a disadvantaged community in the northeastern part of the subbasin (CalEPA, 2022). A major part of this subbasin (~130,000 ha) is agricultural land, with crops ranging from high revenue cotton to lower revenue alfalfa. The primary surface water sources in this subbasin are the Tule River, Deer Creek and the White River, which historically discharged into the Tulare Lake (DWR, 2004b), but only rarely in recent history. The subbasin also imports water via the Friant-Kern Canal, distributing it to managed aquifer recharge (MAR) basins and farms through a network of unlined canals and pipelines (Harder and Van de Water, 2017). Groundwater flow is generally westward, with an unconfined to semiconfined shallow aquifer (upper 91 m to 137 m of the sediments) through the entire extent of the subbasin, a deep aquifer (to 366 m below ground surface) that spans the entire western and the northeastern portion of the subbasin, and a very deep aquifer (between 366 m and 701 m below ground surface) on the western side that extends past the subbasins boundary (Harder and Van de Water, 2017). As with Kaweah groundwater, the Corcoran Clay is the key confining unit on the west side of the subbasin. The average annual change in aquifer storage in Tule corresponds to an average annual overdraft of approximately 183,000 Acre-feet year−1 (~226 Mm3 year−1; Eastern Tule GSA, 2024).
3.3 Data normalization and aggregation
This section describes the development of the toolkit’s six suitability criteria using publicly available, partner-vetted data products described in Section 2.2. All data were aggregated to the Public Land Surveys System spatial extension; a grid used by the US Bureau of Land Management to divide the western United States into one square mile (~1.6 km) land units. Discussions with stakeholders and partners led to this resolution because it was sufficiently granular to differentiate land characteristics while remaining sufficiently coarse to avoid revealing landowners. This is the resolution of the MLRP toolkit and supporting spatial datasets were up- or downscaled accordingly. Each suitability criteria index was created by combining two or more datasets (Supplementary Table S1). First, each dataset was normalized on a scale from highly unsuitable (0) to highly suitable (1) for repurposing. Normalization was performed using fuzzy logic (Kainz, 2001; Lyimo et al., 2020) and the lfl R package (Burda and Štěpnička, 2022), which assigns a value between 0 and 1 to each data point in the feature layers, indicating its degree of suitability based on predefined rules. These rules are determined by set limits, either based on percentiles of sections’ values or expert criteria, and a defined continuous function that describes the values between these limits. We used either linear or raised cosine functions to describe the behavior of fuzzy values. The choice between these functions depended on the empirical cumulative distribution function (ECDF) of the spatial dataset. Specifically, a dataset with a linear ECDF was normalized using a linear function, while data with a more curved ECDF was normalized using a raised cosine function. The normalized variables were weighted using input from partner experts and some qualitative feedback from community members (during demonstrations) to yield the six suitability criteria. However, the weights have not yet been independently tested on real MLRP cases, and we recognize that they may need to be adjusted after such tests. We describe the underlying datasets and dataset aggregation process for each of the MLRP suitability indices in the following subsections.
Fuzzy logic was selected as it provides a flexible framework for defining suitability values along a spectrum, rather than relying on binary classifications. Fuzzy logic has been widely used in suitability analysis (Lewis et al., 2014; Qiu et al., 2014; Lyimo et al., 2020; Mallik et al., 2021), but there are not many examples of these methods being implemented for complex decision making in the intersection of groundwater management, conservation and public benefits. This methodology facilitates the translation of local stakeholder insights into the data standardization process, allowing for a continuous representation of suitability rather than forcing binary classifications. While our study focused on implementing fuzzy logic, we recognize that alternative standardization methods such as linear scaling, ordinal scaling, and statistical standardization may offer different advantages. These approaches often require more rigid input structures and may not capture the uncertain nature of suitability assessments as effectively as fuzzy logic does when stakeholder feedback is integrated into the decision-making process. Therefore, we prioritized the approach that was not only robust in handling uncertainty and imprecision but also understandable for non-expert stakeholders.
3.3.1 Agricultural socioeconomic factors
To capture potential economic and social impacts, the MLRP toolkit uses datasets that support prioritization of land repurposing, under the suitability framework, using contributions from agricultural revenues, employment, and water consumption. Thus, land parcels highly suitable for repurposing are those that have crops generating low revenue, low employment crops, and higher water consumption crops. Revenue values per acre per crop type (USDA, 2022) were related to crop type and parcel area by using the agricultural land use map from 2022 (Land, 2022) to obtain revenues for each land parcel. Employment rate was estimated using the input–output IMPLAN model (Impact Analysis for Planning; IMPLAN Group, 2019), which associated the number of jobs generated to revenue for each crop type. For water consumption, we used the applied water per acre of each crop type, drawn from the California Department of Water Resources (DWR, 2020) for each agricultural parcel. Values were then aggregated to the 1-mile grid by summing up the revenue, employment, and water consumption of all land parcels within a section. For farm parcels overlapping multiple grid cells, values were distributed to the intersecting grid cells proportionally by area. Overall, we selected sections that had at least 20 acres of irrigated agricultural land and classified the rest as non-irrigated farmland. The latter corresponds to sections mostly occupied by urban zones, protected areas, Concentrated Animal Feeding Operations, and other unclassified land.
The toolkit suitability criterion based on agricultural factors was computed as the weighted average of the normalized revenue, employment, and applied water datasets. Initially, equal weights were assigned to these factors. However, the high correlation between employment rates and revenues caused the suitability value to be overly influenced by these two variables, with applied water having little impact. To address this, the weight for applied water was increased to 0.5, ensuring that areas with high and very high suitability in the agricultural index are characterized by higher water consumption, lower revenues, and lower employment rates. The weights used for each dataset are shown in Table 1, which summarizes the rationale and thresholds used to normalize each dataset along with the respective fuzzy logic functions.
Table 1
| Dataset | Weight | Normalization rationale | Fuzzy function |
|---|---|---|---|
| Ag revenues | 0.25 | The lower the crop revenue the higher the suitability for repurposing (minimize negative economic impacts in the region). Limits selection was based on the 10th and 90th percentile of the data within each basin. Highest suitability (1.0): Tule: < $7,000 year−1 Kaweah: < $491,000 year−1 Lowest suitability (0.0): Tule: > $5,424,000 year−1 Kaweah: > $5,455,000 year−1 |
Linear function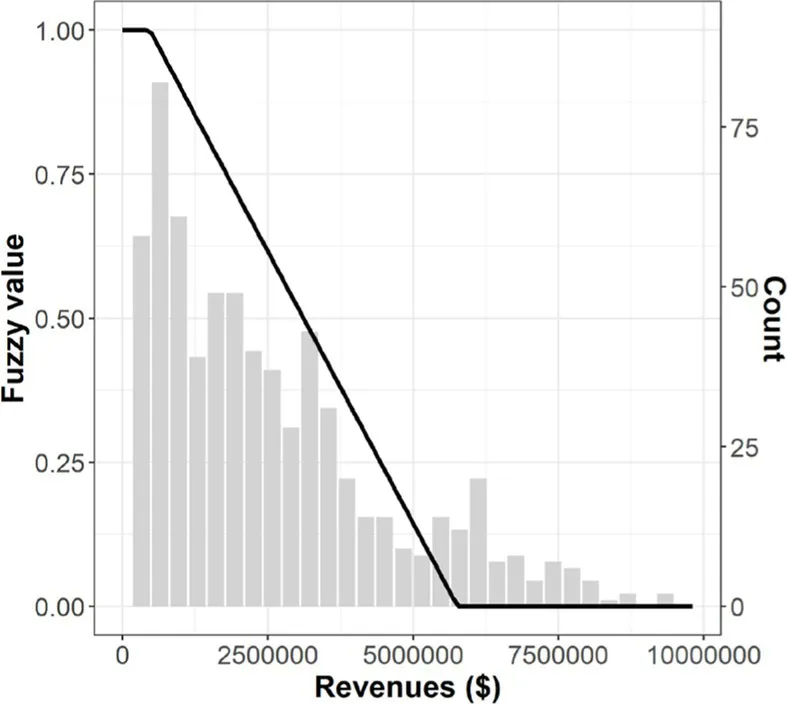 |
| Agricultural employment | 0.25 | The lower the employment rate the higher the suitability for repurposing (reduce job loss from land repurposing). Limits selection was based on the 10th and 90th percentile of the data within each basin. Highest suitability (1.0): Tule: < 0.04 jobs year−1 Kaweah: < 2.0 jobs year−1 Lowest suitability (0.0): Tule: > 30 jobs year−1 Kaweah: > 40 jobs year−1 |
Linear function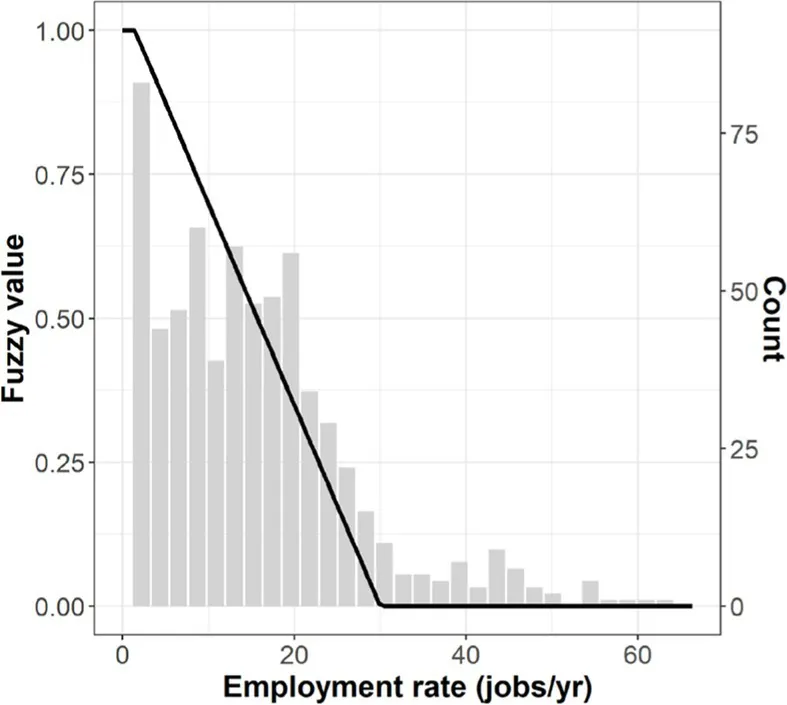 |
| Applied water rate | 0.25 | Cropland with higher applied water rates is more suitable for repurposing, as it would translate into higher water savings. Limits selection was based on the 10th and 90th percentile of the data within each basin. Highest suitability (1.0): Tule: >2,610 AF year−1 Kaweah: > 2,420 AF year−1 Lowest suitability (0.0): Tule: <10 AF year−1 Kaweah: <110 AF year−1 |
Raised cosine function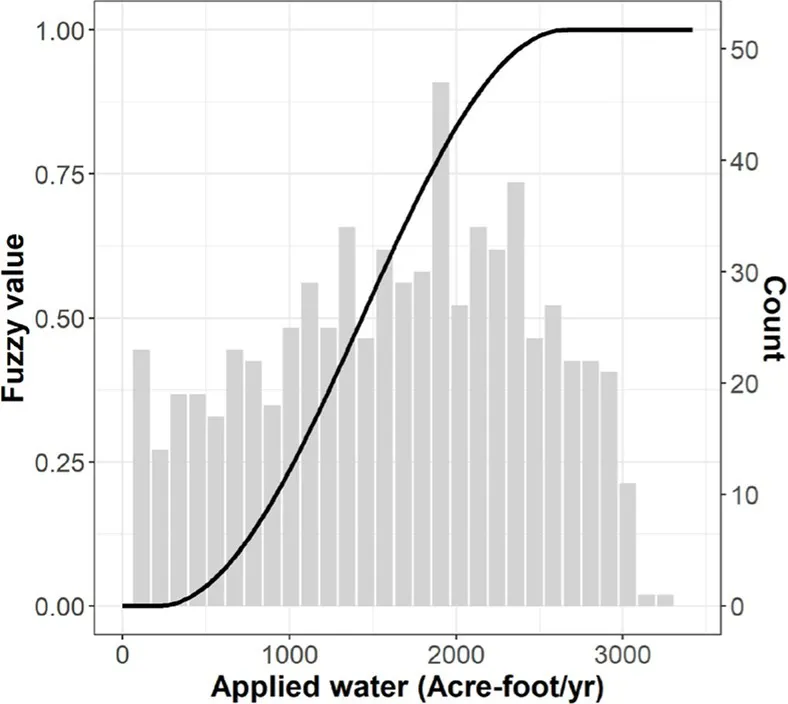 |
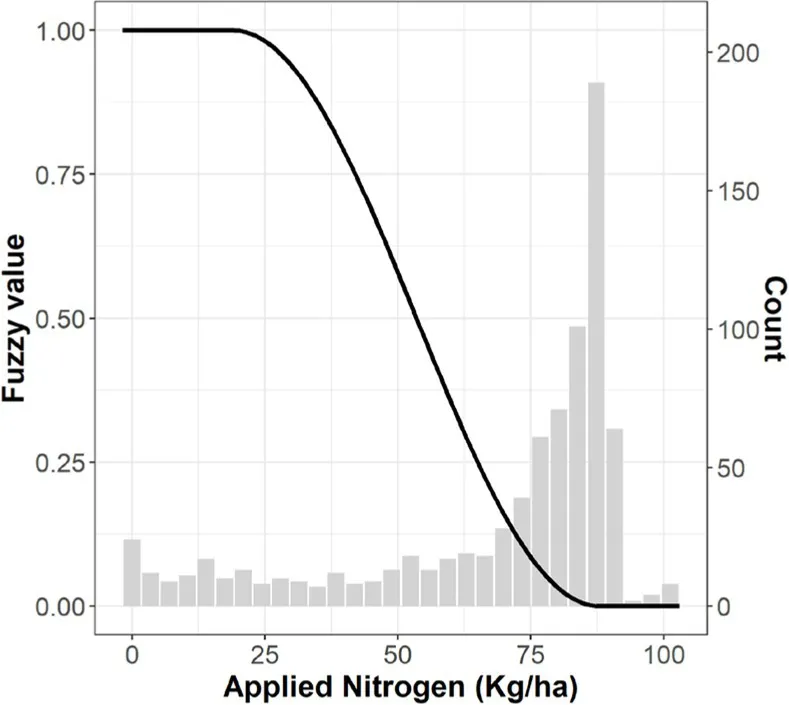
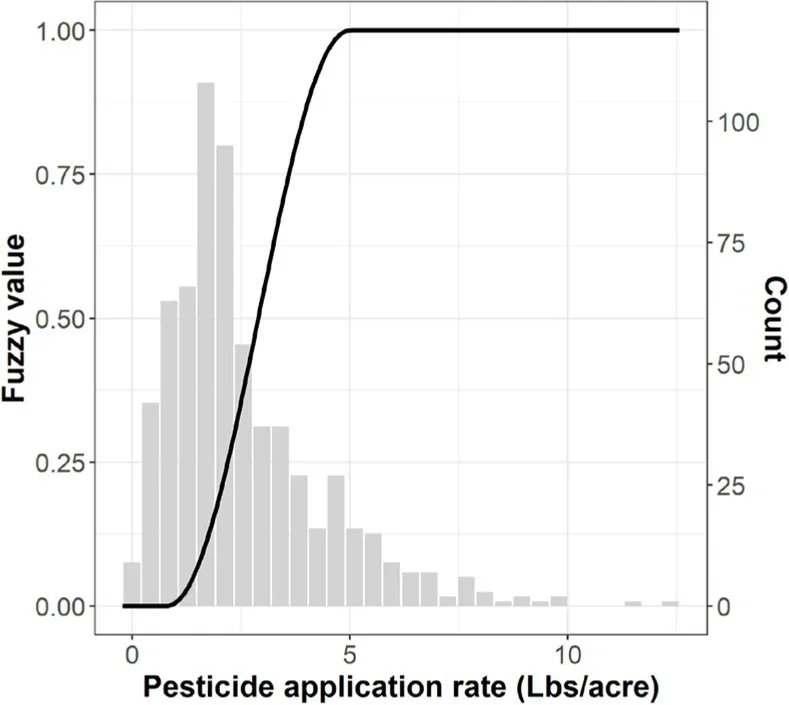
Rationale for dataset normalization and aggregation weights for the agricultural index of the MLRP toolkit.
Fuzzy function figures show the histogram of the data (gray bars) and the variation of the fuzzy value (black line). The figures shown are based on datasets from the Tule subbasin; the fuzzy functions share the same shape for both Kaweah and Tule, with different thresholds.
3.3.2 Managed aquifer recharge (MAR) potential
Managed aquifer recharge (MAR) is a direct SGMA-related benefit needed for expediting restoration of aquifer storage in the region. In the MLRP toolkit, the MAR index represents the suitability (0 low to 1 high) of land for implementing aquifer recharge. Data used to rank MAR potential in the subbasins included: (i) proximity to water conveyance infrastructure, (ii) surficial soil properties (permeability, topography, etc.), (iii) subsurface sediment texture, and (iv) local evidence of severe overdraft, in this case, recent dry well occurrence and land subsidence. The proximity to water conveyance infrastructure was the calculated distance to major streams or canals for each 1-mile squared land section. Major streams were selected as a subset from the DWR streams and canals shapefile (CDFW, 2023), based on the basins hydrological description (DWR, 2004a, 2004b). For surficial soil conditions, we used the existing SAGBI product (Sustainable Agriculture Groundwater Banking Index, O’Geen et al., 2015). SAGBI uses a 6-level scale to rate land suitability for MAR and we employ a numerical version of this scale that varies linearly from 0 to 1.
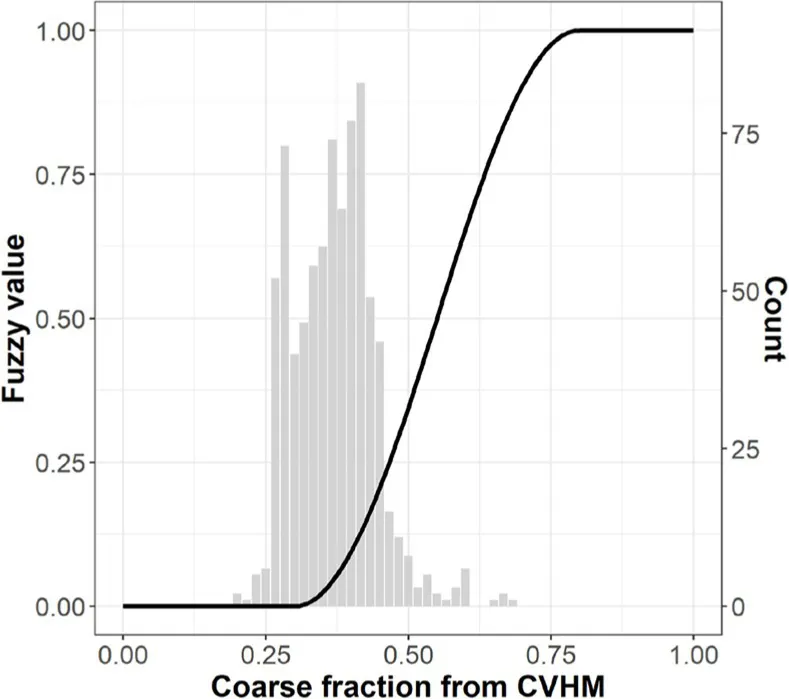
We added deeper subsurface sediment texture properties because the SAGBI product focuses mainly on identifying MAR potential in topsoil and through the root zone of crops. Thus, we included additional datasets to better characterize the deeper subsurface (i.e., vadose zone, groundwater) lithology permeability in terms of suitability for recharge to the underlying aquifers. Specifically, we used the recently available aerial electromagnetic (AEM, DWR, 2024a) survey for California (up to 33 m deep) and the deep layer texture model developed by the US Geological Survey (USGS, 2010) as part of the Central Valley Hydrologic Model (CVHM; up to 38 m deep). Both datasets provide coarse fraction information for the subsurface. We chose to weigh the two components of the subsurface lithology contribution to recharge suitability as 60 and 40% for the AEM and CVHM contributions, respectively. These relative contributions were selected to give more weight to newer, empirical observations while also considering the soil boring and well completion reports from which CVHM lithology was developed. The fuzzy function used to standardize the AEM and CVHM data was a Raised Cosine function that assigned the highest suitability to land with 80% or more coarse fraction, and the lowest suitability to land with less than 30% coarse material. The lower threshold (30% coarse fraction) was informed from Jankowski et al. (2018), who utilized the CVHM coarse faction texture model to augment SAGBI for flood-MAR assessment. This study assigned areas under 28% coarse fraction as non-viable for flood-MAR infiltration capacity. The USDA Soil Survey Manual (USDA, 2018) was used to inform the upper limit of 80% coarse fraction in accordance with coarse material classifications. These limits result in a fuzzy function where intermediate fuzzy values (0.5) are slightly above 50% coarse fraction; the transition point from fine-dominated to coarse-dominated materials (Kang and Knight, 2021). A more detailed description of the AEM and CVHM data processing techniques is provided in Supplementary Information.
We used dry well occurrence (DWR, 2023) and land subsidence (DWR, 2024b) as indicators of areas that should be prioritized for MAR operations. A high density of wells going dry over dry periods is a clear indication of groundwater overdraft in and around the affected area. Groundwater recharge can help to prevent further land subsidence, when accompanied by a reduction in groundwater pumping (Zhang et al., 2015). In both the Kaweah and Tule subbasins, subsidence issues related to the major confining unit (Corcoran Clay) are difficult to address specifically in the toolkit and merit further investigation (see Section 5.2.2). Recharge can also mitigate water table declines connected with well failures. As a measure of dry well occurrence, we determined the density of dry wells (dry wells/km2) reported in a land section since DWR began to collect this data in 2014. We computed dry well density as the number of wells that have gone dry within a 4 km-radius of each section centroid and dividing the result by the area of the 4 km-radius circle.
To map land subsidence, we included measurements of total vertical ground surface displacement between June 2015 and January 2023. Displacement estimates are derived from Interferometric Synthetic Aperture Radar (InSAR) data that are collected by the European Space Agency (ESA) Sentinel-1A satellite (DWR, 2019). DWR provides annual raster files (2.5 km resolution) of total displacement since 2015 (expressed in feet) and subsidence rate. We aggregated these data to the 1-mile grid by computing the average within each grid cell.
Table 2 summarizes the rationale and thresholds used to normalize each dataset using fuzzy logic, as well as the weights used to combine the data into one suitability map for the recharge potential. A higher weight was assigned to the proximity to water conveyance systems, as this is a proxy for water availability and reduction of costs associated with construction and maintenance of longer sections of canals. Then, the rest of the weight was split equally between surficial soil conditions, vadose zone texture properties, dry well occurrence and subsidence. Note that we also give a high importance to the datasets related to local evidence of severe overdraft, as these are the areas where recharge can have higher benefits.
Table 2
| Dataset | Weight | Normalization rationale | Fuzzy function |
|---|---|---|---|
| Proximity to water conveyance | 0.25 | The closer the more suitable for recharge as it would avoid, where possible, the costs of construction of longer sections of canals. Limits selection was based on stakeholder’s feedback. Highest suitability (1.0): < 200 m Lowest suitability (0.0): > 2000 m |
Inverted raised cosine function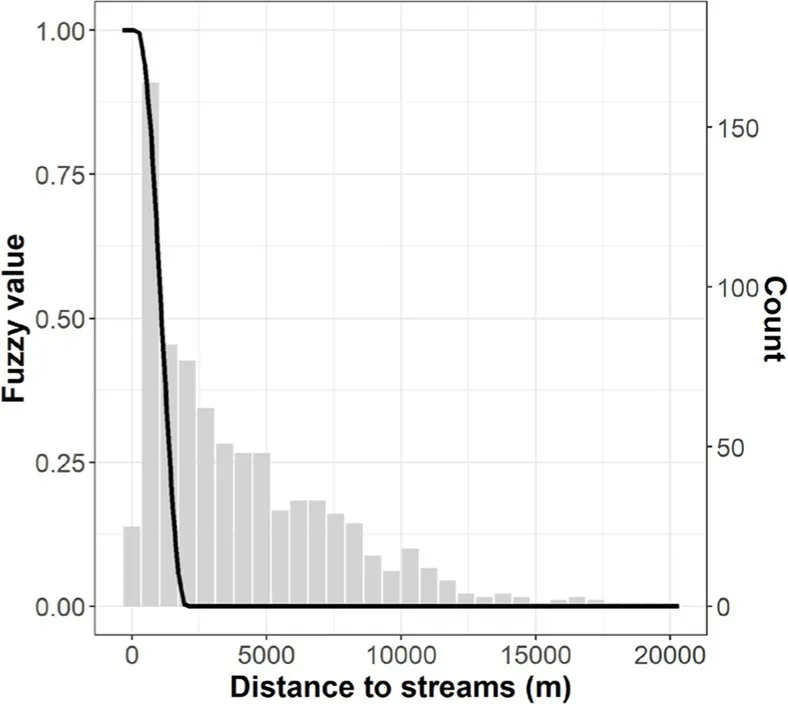 |
| Surficial soil conditions—SAGBI | 0.1875 | The higher the SAGBI value the more suitable for recharge. SAGBI values are unitless and range from 0 to 100. We rescaled them from 0 to 1 to be comparable with the other variables. |
No function |
| Vadose zone sediment texture properties—AEM coarse fraction | 0.1875 × 0.6 | The higher the coarse fraction the better for recharge, as coarser soils generally leading to higher recharge rates (Faunt et al., 2010; Wang et al., 2015; Zomlot et al., 2015). | Raised cosine function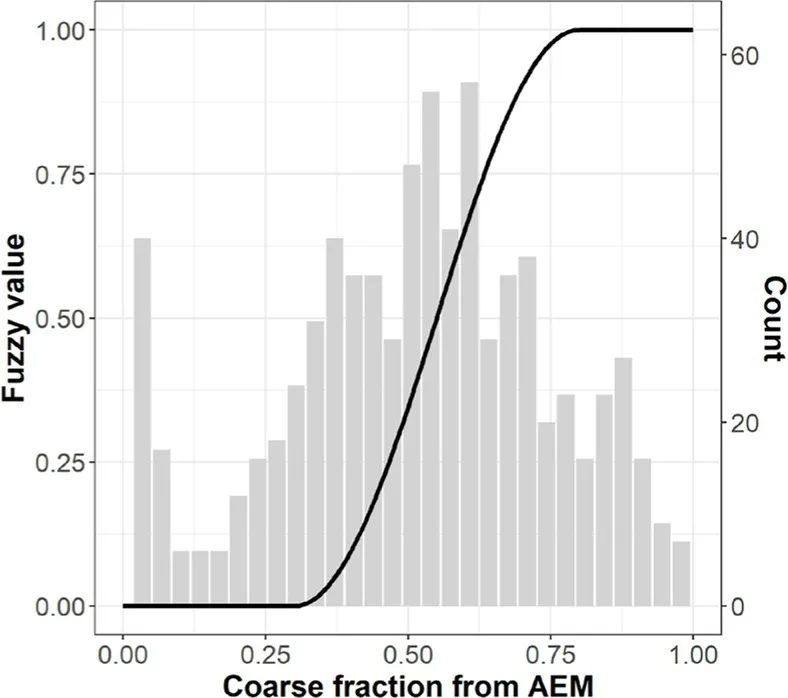 |
| Vadose zone sediment texture properties—CVHM coarse fraction | 0.1875 × 0.4 | Limits were informed by the literature which indicates there is a maximum reduction in hydraulic conductivity when fine particles exceed 30% of the composition (Alakayleh et al., 2018). Highest suitability (1.0): > 0.8 Lowest suitability (0.0): < 0.3 |
|
| Local evidence of severe overdraft—Dry well occurrence | 0.1875 | The higher the density of dried wells around each section, the more suitable for repurposing with recharge projects, as recharge would help to mitigate the overdraft impacts. Limits selection was based on the 10th and 90th percentile of the data within each basin. Highest suitability (1.0): Tule: > 0.5 dry wells/km2 Kaweah: >1 dry wells/km2 Lowest suitability (0.0): Tule: 0 dry wells/km2 Kaweah: 0 dry wells/km2 |
Raised cosine function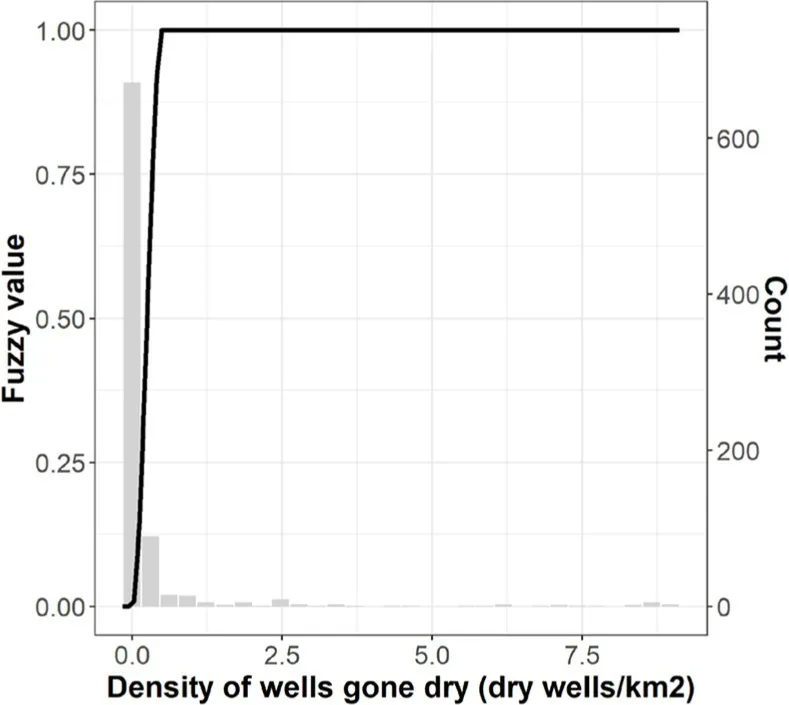 |
| Local evidence of severe overdraft—Subsidence | 0.1875 | Subsidence rates have negative values. Then, the more negative the more suitable for aquifer recharge, in order to help mitigate the impacts on surrounding infrastructure. Limits selection was based on the 10th and 90th percentile of the data within each basin. Highest suitability (1.0): Tule: < −4.5 feet Kaweah: < −5.3 feet Lowest suitability (0.0): Tule: > 0 feet Kaweah: > 0 feet |
Linear function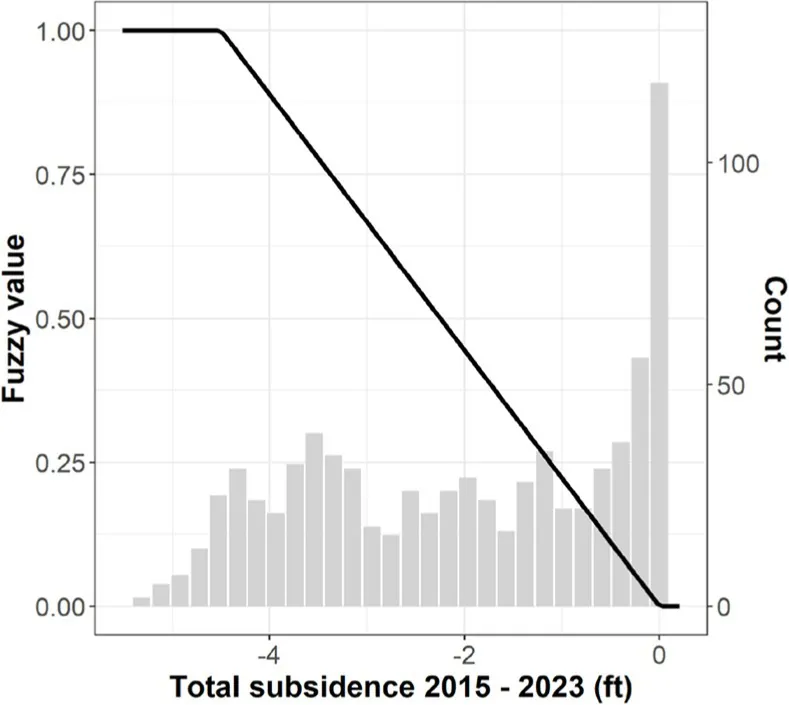 |
Rationale for dataset normalization and aggregation weights for the recharge index.
Fuzzy function figures show the histogram of the data (gray bars) and the variation of the fuzzy value (black line). Figure shown here are examples from the Tule subbasin, but the fuzzy functions share the same shape for both Kaweah and Tule, with different thresholds.
3.3.3 Environmental health risk reduction
The MLRP program seeks to provide benefits to community health by reducing exposure to agricultural chemicals. This toolkit index focuses on identifying suitable land repurposing based on that land’s potential to reduce pollutant exposure in rural, disadvantaged communities. These frontline communities are impacted by inadequate drinking water and poor air quality mostly caused by activities in their surroundings (Hanak et al., 2019; Fernandez-Bou et al., 2021; Flores-Landeros et al., 2022). Repurposing land around disadvantaged communities could help reduce exposure to pesticide drift. The impact would presumably be immediate if spraying was discontinued. We chose pesticides because of the clear connection between application and human exposure, as by spray drift in communities.
To reduce risk from contaminated drinking water, we focused on groundwater. Most of the disadvantaged communities in the San Joaquin Valley use domestic well water and pollutants like nitrate, arsenic, and various pesticides are common in the region. We chose to focus on nitrate land applications because it provides a good indication of farming activity, and because repurposing high application areas in the vicinity of disadvantaged communities could improve groundwater quality. However, the latter potential benefit is less certain and may occur over a relatively long timescale (years to decades). The magnitude and timing of the benefit will depend significantly on the local history of nitrogen application and site-specific soil and groundwater conditions. Additionally, if high nitrate application areas are combined with aquifer recharge, there could be a negative impact on groundwater quality around communities. This potential effect is not well understood or investigated in the region. To avoid unwanted outcomes and due to the lack of scientific information on this matter, we decided to prioritize areas with low nitrogen application as safer areas to start new aquifer recharge operations.
Implementation of the nitrogen and pesticide application datasets (Table 3) places greater weight on the pesticide application (0.6) due to the more direct risk associated with pesticide spray drift. A binary multiplier is then applied to each toolkit cell: 1 if the cell is adjacent (up to 1.6 km away) to a disadvantaged community and 0 if it is not. The 1.6 km buffer was chosen based on the analysis of Fernandez-Bou et al. (2023) and Mayzelle et al. (2015). These studies analyzed the impacts and benefits of multiple buffer distances around disadvantaged communities for the same hydrogeologic conditions as in our work. The more recent study concluded that a mile buffer offered reasonable protection for water quality based on the estimated recharge area of the surrounding agricultural land and community wells, while also providing multiple benefits to communities including improvements in air quality. In addition, other studies show that air quality in communities is impacted by agricultural pesticides drift up to 1 km from crop fields (Dereumeaux et al., 2020). Therefore, a buffer distance of 1.6 km (our toolkit spatial resolution) was reasonable for both groundwater and air quality. Then, Nitrogen application data from Harter et al. (2017) was aggregated to the 1-mile grid by computing the average Nitrogen input for each section. Pesticide application rate was computed by summing the total amount of pesticide, reported by the DPR (2024) for each 1-mile section and divided the result by the reported treated area.
Table 3
| Data set | Weight | Normalization rationale | Fuzzy function |
|---|---|---|---|
| Applied surface nitrogen | 0.4 | The higher the Nitrogen application rate, the less suitable the land is for aquifer recharge, due to the high risk of increasing Nitrate concentration above the maximum contaminant level in drinking wells. Limits selection was based on the 10th and 90th percentile of the data within each basin. Highest suitability (1.0): Tule: < 11 kg ha−1 year−1 Kaweah: < 15 kg ha−1 year−1 Lowest suitability (0.0): Tule: > 225 kg ha−1 year−1 Kaweah: > 255 kg ha−1 year−1 |
|
| Pesticide application | 0.6 | The higher the application rate, the better for repurposing, as this can help reduce the pesticide drift to surrounding communities. Limits selection was based on the 10th and 90th percentile of the data within each basin. Highest suitability (1.0): Tule: > 5 lb. acre −1 year −1 Kaweah: > 5 lb. acre −1 year −1 Lowest suitability (0.0): Tule: < 0.8 lb. acre −1 year −1 Kaweah: < 0.9 lb. acre −1 year −1 |
|
Rationale for dataset normalization and aggregation weights for the environmental health index.
Fuzzy function figures show the histogram of the data (gray bars) and the variation of the fuzzy value (black line). Figures shown are examples from the Tule subbasin, but the fuzzy functions share the same shape for both Kaweah and Tule, with different thresholds.
3.3.4 Habitat restoration and conservation
The MLRP program seeks to identify land suitable for conservation in areas that are likely to provide habitat restoration, enhance connectivity, and create ecosystem benefits. This index of the MLRP toolkit differs for our two study basins, reflecting the preferences and feedback from our partners and stakeholders. For the Tule basin, this index was adapted from an existing regional study by Butterfield et al. (2017) which mapped the San Joaquin Valley with respect to occurrence and habitat suitability for four threatened upland species: the Kit Fox, the Giant Kangaroo Rat, the Blunt-Nosed Leopard Lizard, and the Woolly-thread. Using a map product provided by Tule MLRP partners at The Nature Conservancy, the toolkit ranks land as unsuitable for repurposing in support of restoration and conservation if it is unsuitable for all four species. Otherwise, the land is rated as: suitable (0.7) if it has potential for habitat for one or more target species, highly suitable (0.85) in areas within 5 km of a wetland protected area or a desert protected area, and very highly suitable (1.0) for land within both desert and wetland protected areas. In addition, land within 152 m (500 ft) from riparian areas and zones classified as groundwater dependent ecosystems (Klausmeyer et al. 2018) were also ranked with the highest suitability value (1.0). The resulting map prioritizes potentially suitable habitat for target species, especially those in the vicinity of already stablished protected areas or relevant ecosystems to account for connectivity and facilitate the movement of species to restored land (Butterfield et al., 2017).
For the Kaweah basin we used Areas of Conservation Emphasis (ACE) created by the California Department of Fish and Wildlife (CDFW, 2018), which provides a coarse level view (6.5 km2 hexagonal grid) of relevant information for conservation planning; including a compilation of the best available information on terrestrial species biodiversity in California and an evaluation of terrestrial significant habitats across the landscape. The terrestrial biodiversity dataset can be used to identify areas of highest biodiversity across the state. It combines the native species diversity, rare species diversity and terrestrial irreplaceability which is a measure of endemism. The significant habitat dataset comprises habitats or vegetation types that are the focus of state, national, or locally legislated conservation laws, as well as key habitat areas that are essential to the survival and reproduction of focal wildlife species (CDFW, 2018). These datasets allow for a robust evaluation of key land features supporting biodiversity. Hence, we combined the Terrestrial Biodiversity and the Significant Habitat datasets to determine areas exhibiting the greatest potential for habitat restoration and conservation. Each data set assigns land a statewide normalized value from 0 (lowest value across the state) to 1 (highest value across the state). We normalized these values relative to the minimum and maximum values within the Kaweah basin to identify the best local options. Then, we used a weighted average of the normalized Terrestrial Biodiversity and the normalized Significant Habitat dataset to obtain a spatial layer of land most suitable for habitat restoration based on their biodiversity and vegetation type. The weighted approach aims to maximize the suitability of areas where significant habitats and high biodiversity overlap, with a higher weight to the significant habitat dataset (0.7 weight), reflecting the areas where habitat restoration and preservation are most feasible and impactful.
3.3.5 Renewable energy production
The MLRP program seeks to identify land suitable for repurposing to provide renewable energy for California (Gill et al., 2021), contributing to the energy transition goals of the state, and potentially beyond its boundaries. This MLRP toolkit index focuses on identifying technically and economically suitable areas for solar/photovoltaic energy (PV arrays) and was adapted from an existing product developed in the context of a regional report, published by The Nature Conservancy (Wu et al., 2019). The suitability index here is based on the solar resource potential of a location (typically high), levelness and dryness of the land (i.e., excluding riparian areas), proximity to transmission substations, and exclusion of areas with legal or administrative restrictions. This dataset provides vector polygons of areas classified as suitable for solar energy generation. We aggregated the suitable areas to the 1-mile grid by selecting sections whose centroids fell within suitable areas, and more than half their area was covered by these zones. We assigned to each suitable section the average distance from the centroid to the closest transmission station and rescaled these values from 0.7 to 1 by using fuzzy logic, with 1 being highly suitable areas, as they are closest to transmission stations, and 0.7 areas classified as suitable with the highest distance to transmission stations (Table 4), this as a proxy for difficulty in making connections to the grid. Unsuitable sections were given a value of 0.
Table 4
| Data set | Weight | Normalization rationale | Fuzzy function |
|---|---|---|---|
| Distance to substation within land classified as suitable for solar energy projects | 1 | The closer to substations the better in order to minimize costs of construction of transmission lines. Limits selection was based on the 10th and 90th percentile of the data within each basin. Highest suitability (1.0): Tule: 706 m Kaweah: 568 m Lowest suitability (0.7): Tule: 14,756 m Kaweah: 9238 m |
Raised cosine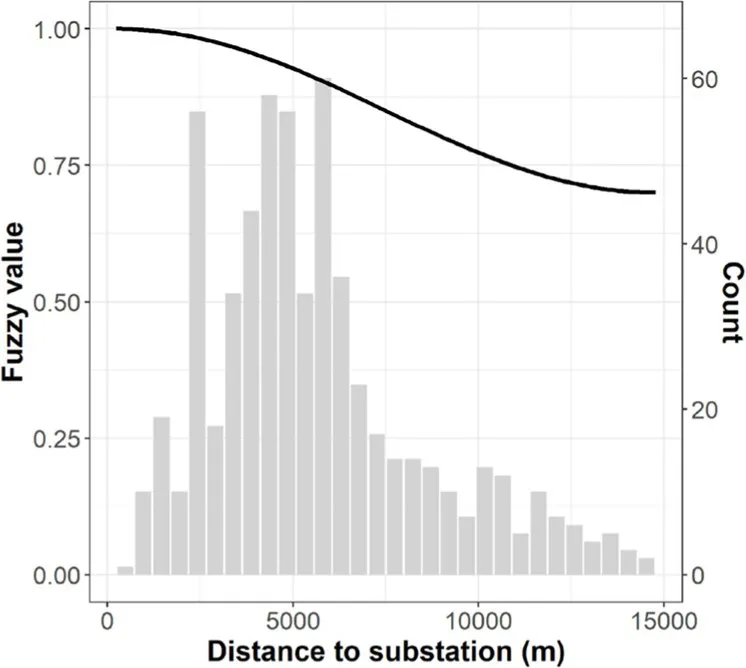 |
Rationale for dataset normalization and aggregation weights for the renewable energy index.
Fuzzy function figures show the histogram of the data (gray bars) and the variation of the fuzzy value (black line). Figures shown are examples from the Tule subbasin, but the fuzzy functions share the same shape for both Kaweah and Tule, with different thresholds.
3.3.6 Local flood risk mitigation
The MLRP program aims to identify land suitable for mitigating flood risk in the basin, particularly around vulnerable communities. Flood mitigation efforts should ideally be focused on areas upstream of zones at risk. Thus, we decided to develop a flood mitigation map prioritizing areas upstream of disadvantaged communities. To create this map, we used the Flood Hazard Areas from the Flood Insurance Rate Map created by the Federal Emergency Management Agency (FEMA). These maps are based on hydrologic and hydraulic analyses and delineate areas with a 1% chance of flooding each year (100-year flood zones). Additionally, we selected a subset of major streams and canals in the basin, which were classified based on their location upstream or downstream relative to any disadvantaged community. Main streams were identified based on the basin’s hydrological description from DWR (2004a, 2004b), and major canals were selected based on visual inspection of satellite imagery. We then created a two-mile buffer around the main streams and a one-mile buffer around major canals, roughly reflecting the respective discharge capacity of these conveyances. These buffers indicate areas where diversion structures and retention basins can be installed for flood management, given their proximity to water conveyance systems capable of moving reasonably large volumes of water.
Prioritization for repurposing was based on the intersection of FEMA floodplains, streams, and canals buffers, and the land section’s location relative to disadvantaged communities. We created a ranking scale from 0.0 (Lowest priority or suitability) to 1.0 (highest). The highest priority was assigned to land within FEMA floodplain boundaries and upstream of a community (1.0), as the former corresponds to places that naturally flood and therefore have a high hydrological and ecological importance (Serra-Llobet et al., 2022). The second tier of the ranking (score of 0.9) included major streams upstream of a community, and the third tier (score of 0.8) was composed of canals upstream of communities. The fourth, fifth, and sixth tiers included areas downstream of the communities that coincided with FEMA boundaries (score of 0.7), stream buffers (score of 0.6) or canal buffers (score of 0.5) buffers. Flood mitigation projects in areas downstream of communities can help mitigate floods for agricultural areas or other places of interest such as roads and water conveyance infrastructure that can be compromised by higher flow rates. Areas outside FEMA and buffer boundaries were given a score of 0.
4 Results
The six land repurposing suitability indices (Figure 2), taken alone or combined as weighted averages, provide geospatial and statistical information about a subbasin’s potential strengths and weaknesses in the context of the MLRP program. We categorized the suitability indices as Very Low (≤0.2), Low (0.2–0.4), Medium (0.4–0.6), High (0.6–0.8) and Very High (> 0.8) suitability. The user interface for the MLRP toolkit was designed to provide user-friendly interactivity, enabling a broad range of users to facilitate self-directed multi-input integration for assessing land repurposing suitability (Supplementary Figure S1). More specifically, users can combine any number and combination of the six suitability index layers as a weighted average. The weights for each layer are equal by default, but users can change them based on their preferences. To provide insight into key subbasin characteristics, the datasets used to build each MLRP suitability index can be displayed alongside the finished heat map in the Web-application. The toolkit does not require any additional software, as it can be used in any Web browser using a laptop or mobile device. In the following subsections, we illustrate the application of the MLRP toolkit in the context of a comparison of the Kaweah and Tule subbasins, first focusing on each of the six suitability indices (4.1) and then examining two multi-criteria scenarios created by prioritizing a subset of the suitability indices (4.2), including a first order estimate of the economic impact of repurposing plans for these two groundwater subbasins.
Figure 2

MLRP toolkit land repurposing suitability maps for the Tule and Kaweah groundwater subbasins based on individual indices: (A) agricultural, (B) managed aquifer recharge, (C) environmental health risk reduction, (D) habitat, (E) solar energy, and (F) flood mitigation. Suitability is presented in five categories, ranging from very low (red) to very high suitability (green).
4.1 Suitability index outcomes
4.1.1 Agricultural socioeconomic factors
The two subbasins are adjacent and share similar landscape and land use characteristics, with irrigated agricultural land being the predominant land use in the region (Kaweah 94% and Tule 89%). The toolkit output is similar in many aspects, but there are also some key differences that suggest different strategies that mitigate groundwater overdraft problems. The associated land areas of the toolkit land sections classified from very low to very high suitability in terms of the agricultural socioeconomic factors provide a more detailed perspective on the subbasins (Figure 3). Note that a very high suitability for repurposing indicates areas with the lowest revenues and employment rates, and the highest applied water (Figure 4). A very low suitability indicates areas with the highest revenues and employment rates, and lower applied water. However, given that most high value crops have moderate to high water demands, some areas classified with low suitability can be in places with relatively high applied water because they are located in areas with high revenue and employment rates (Figure 4).
Figure 3

MLRP toolkit estimated land area (as % of total subbasin and hectares within bars) associated with the suitability classifications for the six MLRP suitability indices.
Figure 4

Statistical summary of agricultural-related suitability index (from left to right: crop revenue, employment, and applied water) for both subbasins. Higher fuzzy values correspond to higher suitability for land repurposing.
For Tule, suitability based on agricultural factors ranged from 0.19 to 0.89 (mean 0.59, standard deviation 0.15, left-skewed distribution). Here, 46% of the basin area (88,645 hectares) was classified as high and very high suitability to repurpose based on the agricultural factors. These suitable areas were mostly located in the northwestern part of the basin. The top 10% of farmland with the highest suitability scores were above 0.79 (Figure 2a). Agricultural suitability values in Kaweah ranged from 0.35 to 0.93, with a mean value of 0.67 (standard deviation 0.17, right-skewed distribution). In this basin, 59% of the irrigated farmland (104,600 hectares) was classified as high and very high suitability for repurposing based on the agricultural factors, with most of that land located on the west side of the basin. The top 10% of farmland with the highest suitability scores were above 0.89, corresponding to scattered sections in the western side of the basin (Figure 2a). Crops within the most suitable areas for both basins were mainly corn, almond, and alfalfa, which are characterized as being in the low end of revenues and/or employment, and at the high end of applied water for both subbasins.
4.1.2 Managed aquifer recharge (MAR) potential
The MAR potential analysis resulted in suitability values ranging from 0.01 to 0.69 for Tule, and from 0.01 to 0.79 for Kaweah, with average values of 0.3 (standard deviation 0.15, right-skewed distribution) and 0.37 (standard deviation 0.13, left-skewed distribution) for Tule and Kaweah, respectively.
In the Tule basin only 3.6% of the land was classified as having high MAR suitability (Figures 2b, 3), while the majority (74.1%) had low and very low suitability. The top 10% of sections had suitability values above 0.52 and were primarily located in areas with almond crops and non-farmland. Within that top 10, 12% corresponded to urban regions, and 1.3% to concentrated animal feeding operations. Other significant crops in this top 10% included corn, pistachios, and grapes. The Kaweah basin followed a similar pattern, but with significantly more land classified as having medium MAR suitability (39.8% compared to 22.4% for Tule, Figure 3). Only 3.2% of the land resulted in high MAR suitability classification (Figures 2b, 3), while 57% of the basin classified as having low and very low MAR suitability. The top 10% of sections had suitability values above 0.55, coinciding primarily with walnut and corn. Within this top 10, 35% corresponded to non-farmland, including 13% urban areas and 2% confined animal agriculture. Both basins also had some protected areas within the top 10% sections, though these were all located in urban zones.
Notably, there were no areas classified as having very high MAR suitability. As recharge potential is determined by several factors, there is no land that simultaneously has a high fuzzy scoring for all of them. In many cases, sections with high suitability are located near conveyance systems and in areas with high SAGBI scores, high dry wells density and high AEM coarse fraction. However, trade-offs exist, particularly with subsidence, as these high-suitability areas may have low subsidence. Trade-offs between components are more evident for sections with medium MAR suitability where points are distributed through the whole range of variation of all components (Figure 5). Very low and low suitability values indicate sections with low scoring in most components.
Figure 5

Distribution of recharge suitability index classifications for subbasins. Higher fuzzy values indicate higher suitability related to each dataset as defined in Table 2. Black points indicate outliers of the boxplots, while gray transparent points are a display of all data in each category.
4.1.3 Environmental health risk reduction
The Environmental health risk reduction analysis resulted in suitability values ranging from 0 to 1 in both subbasins. With average values of 0.10 (standard deviation 0.26) and 0.13 (standard deviation 0.27) for Tule and Kaweah, respectively, these values were strongly skewed toward lower values (Figure 3) due to the constraint requiring proximity to community boundaries (Figure 2c). The highest suitability values were in the eastern portion of both basins, around communities. In the Tule region, the top 10% of sections had suitability values exceeding 0.58. The predominant land uses within these sections were subtropical crops, grapes, and almonds, which accounted for 31.2% of the total area. Urban land use made up an additional 18% of this area, while 4% overlapped with protected areas. In the Kaweah region, the top 10% of sections had suitability values exceeding 0.67. Subtropical crops, grain, and walnuts were the major land uses, covering 49% of this high-suitability area. Urban land use comprised 21% of the area, and 0.7% overlapped with protected areas.
4.1.4 Habitat restoration and conservation
The habitat restoration and conservation analysis for the Tule subbasin resulted in suitability values ranging from 0.0 to 1.0, with a mean value of 0.73 (standard deviation 0.31). The Kaweah subbasin suitability values ranged from 0.0 to 0.85, with a much lower mean value of 0.26 (standard deviation 0.22). The Tule had a higher portion of its area classified within high and very high suitability (89.6%), while Kaweah had a much lower area classified in these same categories (6.8%; Figure 3). However, for this index, suitability values are not comparable between subbasins, as these were developed using different sublayers.
The highest habitat suitability indices for the Tule basin were identified on the west side of the basin (Figure 2d), where pistachios and corn are the predominant crops. However, about half of these high-suitability areas are non-irrigated agricultural parcels. This includes 18% of the area overlapping with protected zones and 2% with confined animal agriculture areas. The upper tenth percentile of sections in the Kaweah basin had habitat suitability values above 0.58 and were primarily located in the northern part of the basin (Figure 2d). Major crops within these high-suitability areas included subtropical crops, corn, and walnuts. Additionally, 2.3% of these areas overlapped with protected zones, 2.5% with confined animal agriculture and 4.8% with urban zones.
4.1.5 Renewable energy production
The photovoltaic energy production analysis Tule resulted in land repurposing suitability indices ranging from 0.0 to 1.0, with a mean value of 0.65 (Standard deviation 0.08, left-skewed distribution). Kaweah suitability indices also ranged from 0.0 to 1.0, with a mean value of 0.50 (Standard deviation 0.4, left-skewed distribution). Figure 2 shows the area portions of the basins ranked from very low to very high suitability related to the solar energy index.
Both basins resulted in high photovoltaic energy production suitability throughout their area, with 77 and 65% classified with high and very high suitability in Tule and Kaweah, respectively (Figure 2e). Most of the very low values were associated with urban and protected areas. The top 10% of sections in both basins had suitability values above 0.96. For Tule, these sections were mostly in the central part of the basin, where major crops include almonds, grapes, and pistachios. Kaweah’s top 10% sections were spread over the basin, with major crops including corn, subtropical crops, and almonds.
4.1.6 Local flood risk mitigation
Flood mitigation analysis resulted in suitability indices ranging from 0 to 1 in both basins. The Tule subbasin had a mean suitability value of 0.44 (standard deviation 0.3, left-skewed distribution), while the Kaweah subbasin had a mean value of 0.38 (standard deviation 0.3, right-skewed distribution). Figure 3 shows the proportion of each basin area categorized from very low to very high suitability based on flood mitigation potential.
In the Tule Basin, 44% of the area was classified as having high or very high suitability for flood mitigation, with the most suitable regions concentrated in the eastern part of the basin (Figure 2f). The top 10% of sections in this basin had suitability values exceeding 0.88, where major crops include almonds, pistachios, and grapes. Urban and protected areas corresponded to 6.4 and 2.2% of the highest 10% sections in Tule, respectively. For the Kaweah Basin, 35% of the area was classified as having high or very high suitability, primarily in the northeastern region (Figure 2f). The top 10% of sections in Kaweah had suitability values greater than 0.84, where major crops include subtropical fruits, walnuts, and grains. Urban and protected areas corresponded to 9.6 and 2.6% of the highest 10% sections in Kaweah, respectively.
4.2 Multibenefit scenarios
A key function of the MLRP toolkit is to screen for land purposing suitability based multiple criteria. The weighted average of a subset of the suitability indices will result in heatmaps reflecting the most suitable areas based on the user selected preferences. These heatmaps can be used to screen for areas with promising land or to choose between proposed MLRP sites in a transparent manner. Two examples of multibenefit repurposing scenarios are presented in the following sections. The first scenario balances agriculture (water use, jobs, and revenue) and aquifer recharge index. The second scenario looks at three indices: agriculture, habitat restoration/conservation, and environmental health risk reduction.
4.2.1 Multibenefit scenario 1: prioritizing agriculture and recharge
For the first scenario, we placed equal weight on the agricultural and recharge suitability indices. The primary benefits for this scenario are reduced water consumption and enhanced aquifer recharge. The specific selection of land parcels for reduced irrigation and/or enhanced aquifer recharge will determine how quickly the subbasin is able to achieve a sustainable regional water balance and restore a substantial fraction of depleted groundwater storage. The recharge benefit also depends on access to surface water or flood flows diversions, as observed in 2023 (Newson, 2023). For purposes of illustration, Scenario 1 assumes that the land parcels are selected for repurposing strictly in order of their weighted suitability index value.
For the Tule basin, Scenario 1 results in 12% (22,138 ha) of the land being classified as highly suitable (Figure 6a), with high-suitability sections concentrated in the central and northern parts of the basin. Under this scenario, repurposing about 18,000 ha of the high-suitability farmland (9.3% of the basin area) could prevent the basin’s groundwater overdraft from growing worse, based on the water savings in applied water from retiring farmland. The required area to negate the average annual overdraft could be reduced if recharge projects are implemented, depending on their size and location. In the absence of more profitable land repurposing choices, idling this land is associated with a potential loss of $154 M in revenue (about 9.0% of the subbasin’s total annual revenue) and 991 jobs (10% of the subbasin’s total agricultural employment). It is important to note that this estimate ignores potential economic responses by industries dependent on the idled crops, effectively assuming they find other customers or suppliers.
Figure 6

Multibenefit suitability maps resulting from (a) Scenario 1, an equally weighted combination of the agricultural and recharge indices of the MLRP toolkit and (b) Scenario 2, after combining the habitat, environmental health risk and the agricultural indices of MLRP.
In the Kaweah basin, 33% of the area (58,909 ha) was categorized as highly suitable (Figure 6a), with the highest suitability values found in the central and western parts of the subbasin. Under this scenario, repurposing the most suitable 23,648 ha (13.3% of the basin area) of the irrigated agricultural land within these high-suitability sections could negate the basin’s groundwater overdraft. As with Tule, the required area for repurposing would decrease if recharge projects were developed and flood flows were available on a reasonably regular schedule. If the land is idled without alternative profitable land use, it could lead to a loss of about $159 million in revenue (10.1% of the basin’s total revenue) and 1,082 jobs (10.1% of the basin’s total agricultural employment).
In addition to ranking the MLRP suitability of individual land tracts, the toolkit output can be used as a regional MLRP planning tool. For example, in our current scenario (Figure 6a), we may wish to identify enough irrigated land to repurpose in order to eliminate the average subbasin overdraft. Using the toolkit, we can compare various selection strategies, including (1) selecting the highest suitability indices provided by the toolkit (balancing revenue loss with recharge potential), (2) selecting land with the greatest water use (minimize repurposed land area), (3) selecting land with the lowest crop values (minimize revenue loss). For these three selection strategies and the current scenario, tradeoffs develop (Figure 7). Land selection based on the water application amount reduces the total area needed to negate the subbasin overdraft but increases job and revenue loss. Similarly, selecting land to repurpose based on the lowest revenues results in the highest amount of area needed to negate overdraft while minimizing the amount of lost revenues and jobs in each subbasin. Selecting land with the highest suitability values results in a compromise between the area needed to address the regional overdraft and the revenues and jobs lost.
Figure 7

Scenario 1 outcomes (repurposed farmland area, lost revenue, lost jobs) sensitivity to land selection process and landowner cooperation: (A–C) Tule subbasin; (D–F) Kaweah subbasin. Land was selected by (i) highest overall suitability for the scenario, (ii) the highest water application cropland, and (iii) the lowest crop revenue, with landowner cooperation at 100% (blue) and 33% (orange). Black bands depict the range of overall suitability values required for each selection process. Farmland area percentages are based on the total area of each basin.
Given that the MLRP program is voluntary, we can also include the possibility of landowner refusing to repurpose their land if selected. This possibility requires one to progress to the next most suitable land each time a landowner refuses to participate (Figure 7, orange bars). For example, assuming that only one of every three landowners is involved, suitable land area (Suitability >0.6) is insufficient to negate the groundwater overdraft via water savings. Therefore, selections must extend to larger areas with lower suitability values. Because of its relatively lower amount of highly suitable land in Scenario 1, the Tule subbasin is more sensitive than the Kaweah to the selection details and probability of landowner involvement. To avoid severely suboptimal results, policies are likely to be needed which constrain the selection process and/or incentivize landowner involvement.
4.2.2 Scenario 2: prioritizing agriculture, habitat restoration, and environmental health risk reduction
Prioritizing agricultural land repurposing around disadvantaged communities offers multiple potential benefits, including enhancing biodiversity, creating recreational spaces, and reducing dust and pesticide exposure from nearby agricultural activities (Fernandez-Bou et al., 2023). In this scenario, we evaluated land repurposing suitability by combining the agricultural socioeconomic factors, habitat restoration and conservation potential, and environmental health risk reduction. We assigned equal weights to these three indices to generate a heat map (Figure 6b), illustrating the suitability of land for repurposing around disadvantage communities.
In the Tule basin, 12.6% of the area (24,308 ha) was classified as having high to very high suitability (suitability > 0.6, Figure 6b). Under this scenario, repurposing the most suitable 17,828 ha (10.4% of the basin) of farmland would address the basin’s overdraft. However, the reduced emphasis on economics in this scenario resulted in a 15.8% reduction in revenue ($272 million) and a loss of 17.0% of agricultural jobs in the basin. This finding suggests that it may be feasible and economically attractive to address the Tule subbasin overdraft while simultaneously enhancing the quality of life in the subbasin communities.
In contrast, for the Kaweah subbasin in Scenario 2, only 2.8% (4,931 ha) of the land area was rated as having high to very high suitability. This outcome is directly related to the different schemes used for classifying habitat restoration and conservation in the two subbasins, with the Tule scheme including more land in the higher suitability categories. For Kaweah, repurposing this 2.8% would result in water savings of about 27,000 Acre-feet year−1 (33Mm3 year−1), or only about 12% of the subbasin’s overdraft. The remaining overdraft could be mitigated by repurposing the next highest tier of land classified within the medium suitability category, resulting in 23,683 ha of repurposed farmland (bringing the total to 13.3% of the basin area), and resulting in a revenue loss of $293 million (18.7% of the subbasin’s total crop revenue) and an estimated loss of 2047 jobs or 19.2% of the subbasin’s agricultural employment.
Compared with Scenario 1, selecting land with the highest suitability in Scenario 2 resulted in a greater loss of revenue and jobs, though the later favors land with lower revenues or higher water applications (Figure 8). This outcome is associated with more suitable places for habitat restoration and environmental health risk reduction located to the east of the basins where higher value agricultural areas are located. This scenario highlights the trade-offs between the benefits provided by the project (not monetized here for environmental health risk or habitats) and the implementation cost and water balance impacts of repurposing the land. When only 33% of landowners are willing to participate, selecting land based on water application or revenue results in the same area, revenue loss, and job loss as in scenario 1 (Figure 7). This is because suitability ranking was not accounted for, as the available suitable land was insufficient to meet the groundwater overdraft in water savings. However, this scenario shows that even though selecting less suitable land can result in lower losses of revenues and jobs (Figures 8b,c,e,f), it sacrifices potential environmental and social benefits.
Figure 8

Scenario 2 outcomes (repurposed farmland area, lost revenue, lost jobs) sensitivity to land selection process and landowner involvement: (A–C) Tule subbasin; (D–F) Kaweah subbasin. Land was selected by (i) highest overall suitability for the scenario, (ii) the highest water application cropland, and (iii) the lowest crop revenue, with landowner cooperation at 100% (blue) and 33% (orange). Black bands depict the range of overall suitability values required for each selection process. Farmland area percentages are based on the total area of each basin.
This shows that selecting land for repurposing must be done carefully to balance the benefits with the regional impacts. Particularly when not every landowner is interested in repurposing their land, basin wide coordination is needed to invest in the projects with the highest benefits (highest suitability) that match the aquifer overdraft in water savings and recharge. For instance, as all high-suitability areas in Kaweah for scenario 2 are not enough to match aquifer overdraft, these can be complemented with efforts towards projects within the highest suitability areas in scenario 1, which would potentially result in high benefits and moderate socioeconomic impacts.
5 Discussion
The MLRP toolkit is a Web-based interactive geospatial application developed to enable users, with varying levels of expertise, to rapidly formulate and explore results for complex multi-criteria scenarios of land repurposing. While feedback on recent demonstrations of the toolkit has generally been positive, it has yet to be independently tested. The intent of this paper is to describe the development process, resulting features and functionality, and illustrative outcomes. The toolkit consists of six indices: agricultural suitability, groundwater recharge potential, environmental health risk mitigation, habitat restoration and conservation, solar energy production, and local flood risk mitigation. These indices were created using publicly available data and the process was guided by an iterative participatory approach. Users can select these indices to generate customized suitability maps that inform the siting of land repurposing projects. The toolkit output enables a “top-down” approach (i.e., decision-makers study heat maps and select the most suitable regions to seek repurposing projects based on their priorities). It also allows a “bottom-up” approach whereby landowners can compare their land parcel to others in the subbasin, gathering support for their proposed repurposing project. By harnessing insights from all levels and a wide range of involved stakeholders, the MLRP toolkit fosters collaboration and strategic regional planning, to achieve SGMA and MLRP goals of balancing water sustainability with local economic and socioenvironmental needs. It supports a more informed and inclusive decision-making process, that can contribute to reducing the environmental justice gaps for vulnerable population and to the maximization of benefits of repurposing.
5.1 Agriculture-related repurposing suitability
Our analysis revealed high suitability for repurposing based on agricultural factors, indicating that many crops in the area have low-revenue, low-employment rates, and/or high-water-use. These findings are particularly true on the western side of both subbasins and align with a recent report (American Farmland Trust, 2018) emphasizing that high quality land is found mostly on the east side of the valley, and that crops there are subject to high levels of water stress.
5.2 MAR repurposing suitability
Overall MAR suitability was relatively low for both basins, with few locations satisfying all the conditions related to this index. Therefore, MAR repurposing suitability is subject to the needs and preferences of the user (stakeholder), where trade-offs need to be made to identify sufficiently suitable location. For instance, sections classified with low MAR suitability may still be located in areas with favorable surface and subsurface properties for recharge but score low on other factors, such as proximity to conveyance systems. If this is the case, then significant groundwater recharge rates could be achieved by extending the basin’s conveyance structures (Hanak et al., 2023). It is also worth noting that, for both subbasins, a significant portion of the highest MAR suitability sections were identified in, or near, urban areas. This finding suggests that land repurposing within and/or around urbanized areas, as with seasonal recreational space, can help to alleviate some of the need to idle farmland.
Coarse fraction data from AEM and CVHM work as a proxy for the subsurface geologic configuration, which is essential to characterize MAR feasibility (Maples et al., 2020; Perzan et al., 2022), however due to the complexity of the hydrogeology of the aquifer and the preferential pathways of water, true recharge potential cannot be fully captured with this metric. Therefore, results presented here should be used with caution and further site-specific evaluations of recharge potential are needed.
5.2.1 MAR and groundwater quality
Combining MAR suitability and the environmental health risk could help to identify areas with the greatest potential for improving groundwater quality around communities dependent on domestic well water. MAR operations in the vicinity of these communities could provide some dilution benefits (Bastani and Harter, 2019; Castaldo et al., 2021; Marwaha et al., 2021; Levintal et al., 2023). However, improvements in groundwater quality are dependent on site-specific characteristics such as soil properties, hydrogeology, biogeochemical processes within the vadose zone, legacy contaminants in the unsaturated zone, and project location relative to drinking water wells and their capture zone (Marwaha et al., 2021; Shi et al., 2021; Levintal et al., 2023). Nitrate contamination is one of the most common problems in these subbasins. Recharge operation practices, such as magnitude and frequency of flooding events (Bastani and Harter, 2019; Murphy et al., 2021; Levintal et al., 2023) and recharged water quality (Waterhouse et al., 2020; Castaldo et al., 2021) will influence the leaching and dilution (Waterhouse et al., 2021; Levintal et al., 2023). For instance, an increase in nitrate concentration would be expected initially after MAR project implementation on farmland (Murphy et al., 2021; Levintal et al., 2023), with the subsequent time required to stabilize or reduce nitrate levels ranging from several years to decades depending on MAR management practices (Bastani and Harter, 2019).
Variation of nitrate and other contaminant concentrations in drinking water wells after recharge depend on factors that are not addressed in detail by the current toolkit. The environmental health risk index in the MLRP toolkit prioritizes areas with low nitrate concentrations to avoid the negative impacts of recharging on high nitrate loading areas around the communities. We elected to use this approach based on stakeholders’ concern about MAR operations exacerbating groundwater contamination locally by leaching more chemicals from the soil column and into the aquifer. Prioritizing repurposing around communities could improve groundwater quality, under the assumption that reduced nitrate and pesticide loading, coupled with seasonal recharge, will eventually lead to improved groundwater quality (Bastani and Harter, 2019). However, in the absence of active recharge basins, quality improvement would likely be at a slower rate. With any approach aimed at improving groundwater quality, it will be important to implement long-term programs to avoid unintended consequences from MAR and restore community confidence in their water supply.
5.2.2 MAR and subsidence
Mitigating subsidence can be approached through both recharge and reduction in groundwater extraction (Land Subsidence Task Committee, 2022). However, the effectiveness of recharge in addressing subsidence depends on hydrogeological conditions, including the location and magnitude of extraction. Reducing groundwater extraction is the most effective method for reducing subsidence rates (Khajehali et al., 2023), particularly when implemented over large areas with well-coordinated efforts. In our test subbasins, much of the compaction that is causing severe subsidence occurs due to groundwater extraction from the lower aquifer beneath the Corcoran Clay (Lees et al., 2022). Aquifer recharge cannot reverse subsidence of this type. However, repurposing decisions which reduce deep groundwater extraction in these regions can reduce further subsidence. Aquifer recharge is essential for restoring groundwater levels, particularly in areas with a high number of dry wells. This could also help to alleviate the water demand in the lower aquifer by increasing water availability in the unconfined part of the system (Lees et al., 2022).
While our tool assumes that groundwater recharge benefits subsidence mitigation, further hydrogeological analyses are necessary to determine site-specific suitability, especially in regions where most subsidence originates from the lower aquifer. Future enhancements to the tool could include layers identifying areas with deep wells tied to land use, allowing prioritization of land repurposing for subsidence mitigation. It is important to note that neither recharge nor reductions in groundwater extraction guarantee the restoration of lost groundwater storage caused by subsidence (Faunt et al., 2016; Chaussard and Farr, 2019). However, these strategies can prevent further storage losses and reduce damage to structures (Faunt, 2009; Zhang et al., 2015).
5.3 Flood mitigation suitability
The highest suitability areas for flood mitigation were located on the east side of both basins (Figure 4f), coinciding with suitable areas for environmental health risk mitigation, and with high and medium MAR suitability sections. The combination of these three indices spotlights areas commensurate with potentially high environmental and social benefits for the region, but which may also conflict with some of the higher quality agricultural land (Figure 4a) in the subbasins. These areas could be suitable places for Ag-MAR where agricultural activities are not retired, and the crops can tolerate inundation. Most common crops in these suitable areas are perennials (almonds, walnuts, pistachios, and grapes) that have a moderate tolerance to winter flood before breaking dormancy (Ganot and Dahlke, 2021) and therefore could be used for Ag-MAR with adequate management practices (O’Geen et al., 2015; Ganot and Dahlke, 2021).
It is worth mentioning that upstream and downstream area selections were limited by the availability of information on local canals infrastructure and their flow direction. While the flow direction is apparent for most major streams, surface water flow is highly modified with canals and underground structures, particularly in the western part of the basin. In these relatively flat areas, the flow direction is difficult to assess from imagery and Digital Elevation Models. Given this problem, sites deemed suitable for local flood mitigation in these parts of the subbasin may require local input and/or site investigation. Moreover, flood benefits are subject to conveyance systems’ capacity to move water to a designated location and the project’s capacity to retain excess flood water. A comprehensive hydrological analysis is required to accurately assess the avoided flooding and the volume of water that can be retained.
5.4 Habitat restoration suitability
The habitat restoration aspect of the toolkit illustrates how partnerships can affect the design and outcome of the program. Different partners in Tule and Kaweah led to different data product recommendations. This resulted in relatively low suitability values for Kaweah and high values for Tule. In this case, the two subbasins are not comparable. However, within each subbasin, the relative ranking can be used to identify the most suitable places for habitat restoration.
The combination of the habitat product with other MLRP indices should be done strategically (Kelsey et al., 2018). For instance, this index could be combined with the flood suitability to identify suitable areas to restore riparian habitats that can also function as retention basins during winter and mitigate flooding in downstream areas. Additionally, habitat restoration can also be combined with the environmental health risks index to identify places with high habitat suitability that can serve as recreational spaces for the community and simultaneously reduce nitrogen and pesticides applications from the retired agricultural activity. As shown in Scenario 2 (Figures 6b, 8), strategic regional planning can be implemented to address groundwater overdraft, benefit the communities and increase biodiversity, by simultaneously minimizing the socioeconomic impacts of retiring agriculture (Kelsey et al., 2018).
5.5 Solar energy potential
In general, California has excellent solar resources, therefore most of the area in both subbasins was classified as high and very high suitability for photovoltaic energy production. Unsuitable areas are mostly based on the exclusion of areas with legal or administrative restrictions such as protected and urban areas (Wu et al., 2019, 2022). It is worth noting that the current capacity of the transmission substations and future energy storage facilities are not accounted for in this suitability index because this data is subject to change and not readily accessible. However, based on communications with stakeholders in the community-scale solar energy sector, these firms can evaluate land suitability for solar arrays rapidly using up-to-date storage and transmission information.
Photovoltaic projects can be a sustainable option for retired agricultural land that is not suitable for recharge, habitat restoration, or any other MLRP objective (Kelsey et al., 2018; Buckley Biggs et al., 2022). The western sides of both basins coincide with high photovoltaic suitability, low agricultural value, and low MAR suitability (Figures 4a,b,e). The high solar resource potential combined with land availability could provide economic returns, ecological advantages and reduce water consumption from agricultural activities (Ayres et al., 2022b). However, transmission constraints need to be addressed to support the increasing trend in solar energy production and electricity demand (Gorman et al., 2019; Brockway et al., 2021; Ayres et al., 2022b). The combination of solar panels with grazing, habitat, or less water intensive crops needs to be considered to reduce undesired impacts like increase dust emissions (Hernandez et al., 2014; Sturchio and Knapp, 2023). Agrivoltaic systems, which combine solar energy production with agriculture, offers a promising solution with the potential to reduce water demand while reducing economic impacts in the region by providing a local energy supply (Proctor et al., 2020; Fernandez-Bou et al., 2024). Ultimately, landowners will be the principal determinant of the implementation of these types of innovative agricultural practices, as financial viability remains a major concern (Proctor et al., 2020; Buckley Biggs et al., 2022; Cuppari et al., 2024).
5.6 Land repurposing benefits for environmental health risk reduction
Besides potential improvements in groundwater quality associated with MAR operations, repurposing around disadvantaged communities can also have improvements on air quality by reducing dust, pesticide applications, and fertilizer applications from agricultural activities, particularly in communities in proximity to agricultural lands (Harnly et al., 2009; Lee et al., 2011; Almaraz et al., 2018; Fernandez-Bou et al., 2023). Pesticide drift exposure is dependent on complex site-specific conditions such as crop characteristics, and local weather conditions, in addition to the chemical properties of pesticides and application methods (Dereumeaux et al., 2020; Larbi et al., 2022). Previous studies have observed pesticide drift reaching further than 1 km (Deziel et al., 2017). Thus, the implementation of a 1.6 km range of dust and spray exposure in communities is a relatively conservative approach in terms of air quality, if sprayers comply with all pesticide applications regulations. While the 1.6 km buffer represents an estimation for preventing communities’ wells drawdown from contiguous agricultural wells, domestic well capture zones are highly variable and can extend up to 6 km upgradient of wells (Marwaha et al., 2021) depending on multiple factors not accounted for in this study. As there are no other studies approaching the environmental risk-related outcomes of different buffer distances around communities in the region, this aspect of the toolkit requires further development as water and air quality data sets become more refined.
At this stage of the MLRP toolkit development, pesticide and nitrogen fertilizer applications are the only components contributing to the Environmental Health benefit. We continue to investigate several groundwater contamination products, such as the California Water Resources Control Board’s Aquifer Risk Maps for nitrate, arsenic, and 1,2,3-trichloropropane (a high toxicity pesticide additive). As noted above, land repurposing toward MAR operations near communities could provide dilution benefits in areas affected by contaminants. However, site history and hydrogeology could either enhance or limit the extent and timing of this benefit depending on the contaminant properties. We strongly support continued development and testing of the environmental health risk reduction aspect of the MLRP toolkit.
5.7 Final thoughts and next steps for the MLRP toolkit
The Multibenefit Land Repurposing Program (MLRP) toolkit focuses on the goal of mitigating regional groundwater overdraft while providing co-benefits. This toolkit necessarily emphasizes managing water demand in irrigated agriculture to address groundwater sustainability issues in California. It could, however, be adapted for use in any multicriteria socioenvironmental resource management problem, assuming that adequate geospatial data are available. The participatory approach is key, in which stakeholders in different sectors (e.g., conservation, renewable energy, communities, etc.) identify the most useful and generally accepted data sets and provide iterative feedback on data set integration to yield suitability indices maps. For broader applications in socioenvironmental resource management, an initial assessment of the primary challenges and potential solutions should be conducted in close collaboration with stakeholders, ensuring that the tool meets their expectations and needs. Additionally, relevant geospatial data must be identified and structured for integration into suitability mapping. The data processing approach presented in this study, where we combined statistical distribution analysis with expert criteria and local input, can be used to standardize and combine the geospatial data.
The MLRP toolkit is currently undergoing testing in two critically water-stressed groundwater basins in California as a means for (1) identifying promising land for reducing consumptive use while achieving multiple benefits for the environment and communities, and (2) support prioritization among MLRP project proposals. While participants in stakeholder meetings found this tool more user-friendly and understandable than other geospatial tools (e.g., ArcGIS), the toolkit has not yet undergone independent testing. A recent pilot was launched in the Kaweah subbasin where users are testing its functionality and ease of use in the context of MLRP decision-making.
As evidenced in Section 4.2, MLRP outcomes will depend on landowner participation. While the toolkit identifies biophysically and contextually suitable areas, landowner decisions will depend on the incentives offered within the repurposing program and individual preferences for the use of their land. The latter may or may not align with the suitability scores generated by the toolkit, highlighting the importance of inclusive outreach and engagement strategies. A key limitation of the toolkit is its spatial resolution (1 mi2 or 2.59 km2), which is relatively large compared to agricultural and grazing land blocks being proposed for repurposing. Given this, it is important to consider toolkit outcomes as screening-level results, that can support regional coordinators and decision makers in facilitating communication among interested actors and target outreach. The final suitability of the land for specific repurposing options requires more detailed investigation and characterization of site-specific conditions at the local level. As higher resolution datasets become available, the granularity of the toolkit can be increased.
Another limitation of the current version is the relatively limited selection of land repurposing options. These were based on partner and stakeholder input. As noted, some of the repurposing criteria that were implemented are directly related to the problem and easy to quantify (e.g., crop revenue, applied water), others are directly related but more challenging to estimate and often constrained by limited geospatial data types and quality (e.g., environmental health risk reduction). The latter index should be reassessed and updated as better approaches and data become available. In addition, as the MLRP process plays out, it is likely that additional repurposing options will become more common and can be implemented into the toolkit. For example, private investment aimed at repurposing suitable parcels as commercial or industrial complexes could be incentivized to provide new centers of economic activity in the region.
In addition to improving the land repurposing suitability aspects of the MLRP toolkit, new capabilities are planned for implementation and testing. First, we are incorporating a cost calculator to help landowners to estimate the cost of repurposing their land (e.g., irrigated farmland to photovoltaic array). Next, we expect to implement a benefit estimating module to assess the socioeconomical benefits associated with repurposing actions included in the tool. More work needs to be done to economically characterize these benefits and include them in the Tool. Future work can include the estimation of direct and regional economic impacts for specific land repurposing scenarios, which allows decision-makers to analyze how land repurposing may impact regionally to other sectors, employment and overall economic activities. Additionally, reliable local data on farm level economics and potential economic benefits of land repurposing actions, which require further research, should be included.
The feedback received from our MLRP partners has been valuable in ensuring that our products meet the needs of their respective planning process. By implementing these additional features, we aim to further enhance the tool’s utility, support the MLRP planning process, and potentially scale it as a region-wide tool for the San Joaquin Valley.
Statements
Data availability statement
The raw data supporting the conclusions of this article will be made available by the authors, without undue reservation.
Author contributions
YN-B: Data curation, Formal analysis, Investigation, Methodology, Software, Visualization, Writing – original draft. HF-L: Conceptualization, Data curation, Formal analysis, Investigation, Methodology, Software, Writing – original draft, Writing – review & editing. JR-F: Conceptualization, Data curation, Investigation, Software, Writing – review & editing. AF-B: Conceptualization, Investigation, Writing – review & editing. JM-A: Methodology, Supervision, Writing – review & editing. TH: Conceptualization, Funding acquisition, Investigation, Methodology, Project administration, Supervision, Writing – original draft, Writing – review & editing.
Funding
The author(s) declare that financial support was received for the research and/or publication of this article. Financial support was provided by the California Department of Conservation (DOC) Multibenefit Land Repurposing Program (MLRP), through the Pixley Irrigation District Groundwater Sustainability Agency, the Kaweah Delta Water Conservation District, and the Greater Kaweah Groundwater Sustainability Agency, and from the University of California Multicampus Research Initiative Program grant M21PR3417 Labor & Automation in California Agriculture. JR-F was supported through a gift to the Environmental Defense Fund from the Laural Foundation.
Acknowledgments
The authors would like to thank our partners from the Nature Conservancy, Audubon, ValleyEco, SocioEnvironmental & Education Network, Sustainable Conservation (Suscon), Sequoia Riverlands Trust, Tule Basin Land & Water Conservation Trust, Tulare Basin Watershed Partnership Network, Ag Innovations, and Geosyntec Consultants for continuous their recommendations and feedback, as well as their coordination of meetings with stakeholders of Tule and Kaweah, which helped in the development of this toolkit. We would also like to thank MLRP Statewide Support Entity, including DOC personnel, Environmental Defense Fund, and Self-Help Enterprises for facilitating communication and coordinating activities among MLRP block grantees.
Conflict of interest
The authors declare that the research was conducted in the absence of any commercial or financial relationships that could be construed as a potential conflict of interest.
Generative AI statement
The author(s) declare that no Generative AI was used in the creation of this manuscript.
Publisher’s note
All claims expressed in this article are solely those of the authors and do not necessarily represent those of their affiliated organizations, or those of the publisher, the editors and the reviewers. Any product that may be evaluated in this article, or claim that may be made by its manufacturer, is not guaranteed or endorsed by the publisher.
Supplementary material
The Supplementary material for this article can be found online at: https://www.frontiersin.org/articles/10.3389/frwa.2025.1539834/full#supplementary-material
Abbreviations
GSA, Groundwater Sustainability Agency; SAGBI, Soil Agricultural Groundwater Banking Index; SGMA, Sustainable Groundwater Management Act; SJV, San Joaquin Valley; MLRP, Multibenefit Land Repurposing Program; MAR, Managed Aquifer Recharge.
References
1
AbdelRahman M. A. E. Shalaby A. Essa E. F. (2018). Quantitative land evaluation based on fuzzy-multi-criteria spatial model for sustainable land-use planning. Model. Earth Syst. Environ.4, 1341–1353. doi: 10.1007/s40808-018-0478-1
2
Alakayleh Z. Clement T. Fang X. (2018). Understanding the changes in hydraulic conductivity values of coarse- and fine-grained porous media mixtures. Water10:313. doi: 10.3390/w10030313
3
Almaraz M. Bai E. Wang C. Trousdell J. Conley S. Faloona I. et al . (2018). ‘Agriculture is a major source of NO x pollution in California. Sci. Adv.4:eaao3477. doi: 10.1126/sciadv.aao3477
4
American Farmland Trust (2018). ‘San Joaquin Land and Water strategy: Exploring the intersection of Agricultural Land & Water Resources in California’s San Joaquin Valley’. Available online at: https://farmlandinfo.org/wp-content/uploads/sites/2/2020/10/2018_AFT-SJVLW_B-web.pdf (Accessed August 22, 2024).
5
American Farmland Trust (2020). ‘San Joaquin Valley project prioritization tool’. Available online at: https://sjvp.databasin.org/galleries/4b7684cdfc714babb1c883432022297a/ (Accessed September 12, 2024).
6
Anderson M. G. Clark M. Olivero A. P. Barnett A. R. Hall K. R. Cornett M. W. et al . (2023). A resilient and connected network of sites to sustain biodiversity under a changing climate. Proc. Natl. Acad. Sci.120:e2204434119. doi: 10.1073/pnas.2204434119
7
Ayres A. Kwon J. Collins J. Gonzales E. Joaquín Z. et al . (2022a). ‘Land transitions and dust in the San Joaquin Valley’. (Accessed September 3, 2024)
8
Ayres A. Rosser A. Hanak E. Escriva-Bou E. Wheeles R. et al . (2022b). ‘Solar energy and groundwater in the San Joaquin Valley’. Available online at: https://www.ppic.org/publication/solar-energy-and-groundwater-in-the-san-joaquin-valley/ (Accessed September 3, 2024).
9
Balmagia J. Gibbons B. Madden C. Perez Welter A. . (2019). ‘Strategically siting groundwater recharge projects to benefit communities and ecosystems’. Available online at: https://waterresilience.wixsite.com/waterresilienceca (Accessed September 12, 2024).
10
Bastani M. Harter T. (2019). Source area management practices as remediation tool to address groundwater nitrate pollution in drinking supply wells. J. Contam. Hydrol.226:103521. doi: 10.1016/j.jconhyd.2019.103521
11
Biggs R. Schlüter M. Schoon M. L. (2015). Principles for building resilience: Sustaining ecosystem services in social-ecological systems. United Kingdom: Cambridge University Press.
12
Brockway A. M. Conde J. Callaway D. (2021). Inequitable access to distributed energy resources due to grid infrastructure limits in California. Nat. Energy6, 892–903. doi: 10.1038/s41560-021-00887-6
13
Brown G. Donovan S. (2014). Measuring change in place values for environmental and natural resource planning using public participation GIS (PPGIS): results and challenges for longitudinal research. Soc. Nat. Resour.27, 36–54. doi: 10.1080/08941920.2013.840023
14
Brown G. Kyttä M. (2014). Key issues and research priorities for public participation GIS (PPGIS): a synthesis based on empirical research. Appl. Geogr.46, 122–136. doi: 10.1016/j.apgeog.2013.11.004
15
Buckley Biggs N. Shivaram R. Acuña Lacarieri E. Varkey K. Hagan D. Young H. et al . (2022). Landowner decisions regarding utility-scale solar energy on working lands: a qualitative case study in California. Environ. Res. Commun.4:055010. doi: 10.1088/2515-7620/ac6fbf
16
Burda M. Štěpnička M. (2022). Lfl: an R package for linguistic fuzzy logic. Fuzzy Sets Syst.431, 1–38. doi: 10.1016/j.fss.2021.07.007
17
Butterfield H. S. Kelsey R. Hart A. Biswas T. Kramer M. Cameron D. et al . (2017). Identification of potentially suitable habitat for strategic land retirement and restoration in the San Joaquin Desert. The Nature Conservancy, San Francisco: California, 25.
18
CalEPA (2022). California climate investments to benefit disadvantaged communities. Available online at: https://calepa.ca.gov/envjustice/ghginvest/ (Accessed October 7, 2024).
19
California Department of Conservation (2023a). California important farmland finder. Available online at: https://maps.conservation.ca.gov/dlrp/ciff/app/ (Accessed September 12, 2024).
20
California Department of Conservation (2023b). Multibenefit Land Repurposing Program (MLRP). Available online at: https://www.conservation.ca.gov/dlrp/grant-programs/Pages/Multibenefit-Land-Repurposing-Program.aspx (Accessed January 30, 2025).
21
California Water Commission (2017). Water storage investment program project review portal. Available online at: https://cwc.ca.gov/Water-Storage/WSIP-Project-Review-Portal (Accessed January 30, 2025).
22
Callahan K. (2007). Citizen participation: models and methods. Int. J. Public Adm.30, 1179–1196. doi: 10.1080/01900690701225366
23
Castaldo G. Visser A. Fogg G. E. Harter T. (2021). Effect of groundwater age and recharge source on nitrate concentrations in domestic Wells in the San Joaquin Valley. Environ. Sci. Technol.55, 2265–2275. doi: 10.1021/acs.est.0c03071
24
CDFA (2024). State Water Efficiency & Enhancement Program, California Department of Food and Agriculture. Available online at: https://www.cdfa.ca.gov/oefi/sweep/ (Accessed January 30, 2025).
25
CDFW (2018). Areas of conservation emphasis (ACE). Available online at: https://wildlife.ca.gov/Data/Analysis/ACE (Accessed July 24, 2024).
26
CDFW (2023). ‘California streams’. Available online at: https://data-cdfw.opendata.arcgis.com/datasets/CDFW::california-streams-1/about (Accessed October 22, 2024).
27
Eastern Tule GSA . (2024). “Groundwater sustainability plan.” Available online at: https://easterntulegsa.com/gsp/ (Accessed March 12, 2024).
28
Chaussard E. Farr T. G. (2019). A new method for isolating elastic from inelastic deformation in aquifer systems: application to the San Joaquin Valley, CA. Geophys. Res. Lett.46, 10800–10809. doi: 10.1029/2019GL084418
29
Crowfoot W. Gomez S. Nemeth K. Messer C. Andrew J. Craddock T. et al . (2023). ‘California Water plan update 2023’.
30
Cuppari R. I. Fernandez-Bou A. S. Characklis G. W. Ramirez M. Nocco M. A. Abou-Najm M. (2024). Drivers of agrivoltaic perception in California and North Carolina. Environ. Res. Food Syst.1:021003. doi: 10.1088/2976-601X/ad5449
31
Dereumeaux C. Fillol C. Quenel P. Denys S. (2020). Pesticide exposures for residents living close to agricultural lands: a review. Environ. Int.134:105210. doi: 10.1016/j.envint.2019.105210
32
Deziel N. C. Freeman L. E. B. Graubard B. I. Jones R. R. Hoppin J. A. Thomas K. et al . (2017). Relative contributions of agricultural drift, Para-occupational, and residential use exposure pathways to house dust pesticide concentrations: Meta-regression of published data. Environ. Health Perspect.125, 296–305. doi: 10.1289/EHP426
33
DOC (2022). Round 1 Land Repurposing Program Guidelines. California Department of Conservation. Available at: https://www.conservation.ca.gov/dlrp/grant-programs/Documents/grant/000_Land%20Repurposing%20Program%20Guidelines_FINAL_combined.pdf
34
DPR (2024). ‘Pesticide Use Reporting (PUR)’. Available online at: https://www.cdpr.ca.gov/docs/pur/purmain.htm (Accessed July 23, 2024).
35
DWR (2004a). ‘DWR California’s ground water bulleting 118 - San Joaquin Valley Groundwater Basin Kaweah Subbasin’. (Accessed October 22, 2024).
36
DWR (2004b). ‘DWR California’s ground water bulleting 118 - San Joaquin Valley Groundwater Basin Tule subbasin’.
37
DWR (2019). TRE ALTAMIRA InSAR subsidence data - GIS image Services of Vertical Displacement Rasters - California Natural Resources Agency open data. Available online at: https://data.cnra.ca.gov/dataset/tre-altamira-insar-subsidence/resource/78ec5fc8-8ec4-48cf-91fa-1d5f22ff5d75 (Accessed January 22, 2024).
38
DWR (2020). Land & Water use 2011–2015 - California Natural Resources Agency open data. Available online at: https://data.cnra.ca.gov/dataset/land-water-use-by-2011-2015 (Accessed January 22, 2024).
39
DWR (2023). Dry well reporting system data - California open data. Available online at: https://data.ca.gov/dataset/dry-well-reporting-system-data (Accessed January 22, 2024).
40
DWR (2024a). DWR airborne electromagnetic (AEM) surveys data - California Natural Resources Agency open data. Available online at: https://data.cnra.ca.gov/dataset/aem (Accessed January 22, 2024).
41
DWR (2024b). ‘GIS image Services of Vertical Displacement Rasters’. Available online at: https://data.cnra.ca.gov/dataset/tre-altamira-insar-subsidence/resource/78ec5fc8-8ec4-48cf-91fa-1d5f22ff5d75 (Accessed October 22, 2024).
42
Emerson K. Nabatchi T. (2015). Collaborative Governance Regimes. Georgetown: University Press.
43
Escriva-Bou A. Hanak E. Cole S. Medellín-Azuara J. . (2023). The future of agriculture in the San Joaquin Valley, Technical Appendix. PPIC. Available online at: https://www.ppic.org/wp-content/uploads/0223aeb-appendix.pdf (Accessed November 12, 2024).
44
Faunt C. C. (2009). Groundwater availability of the Central Valley aquifer. Professional Paper: California.
45
Faunt C. C. Sneed M. Traum J. Brandt J. T. (2016). Water availability and land subsidence in the Central Valley, California, USA. Hydrogeol. J.24, 675–684. doi: 10.1007/s10040-015-1339-x
46
Faunt C. C. Belitz K. Hanson R. T. (2010). Development of a three-dimensional model of sedimentary texture in valley-fill deposits of Central Valley, California, USA. Hydrogeol. J.18, 625–649. doi: 10.1007/s10040-009-0539-7
47
Fernandez-Bou A. S. Ortiz-Partida J. P. Dobbin K. B. Flores-Landeros H. Bernacchi L. A. Medellín-Azuara J. (2021). Underrepresented, understudied, underserved: gaps and opportunities for advancing justice in disadvantaged communities. Environ. Sci. Pol.122, 92–100. doi: 10.1016/j.envsci.2021.04.014
48
Fernandez-Bou A. S. Rodríguez-Flores J. M. Guzman A. Ortiz-Partida J. P. Classen-Rodriguez L. M. Sánchez-Pérez P. A. et al . (2023). Water, environment, and socioeconomic justice in California: a multi-benefit cropland repurposing framework. Sci. Total Environ.858:159963. doi: 10.1016/j.scitotenv.2022.159963
49
Fernandez-Bou A.S. Isabella Cuppari R. Rodriguez-Flores J. M. Yang V. . (2024). ‘Agrivoltaics and Ecovoltaics: How solar power can deliver Water savings, farm success, and a healthier environment’. Union of Concerned Scientist. Available online at: https://www.ucsusa.org/resources/agrivoltaics-and-ecovoltaics#ucs-report-downloads (Accessed September 3, 2024).
50
Flores-Landeros H. Pells C. Campos-Martinez M. S. Fernandez-Bou A. S. Ortiz-Partida J. P. Medellín-Azuara J. (2022). Community perspectives and environmental justice in California’s San Joaquin Valley. Environ. Justice15, 337–345. doi: 10.1089/env.2021.0005
51
Ganot Y. Dahlke H. E. (2021). A model for estimating ag-MAR flooding duration based on crop tolerance, root depth, and soil texture data. Agric. Water Manag.255:107031. doi: 10.1016/j.agwat.2021.107031
52
Garcia X. Benages-Albert M. Vall-Casas P. (2018). Landscape conflict assessment based on a mixed methods analysis of qualitative PPGIS data. Ecosyst. Serv.32, 112–124. doi: 10.1016/j.ecoser.2018.07.003
53
Gill L. Gutierrez A. Weeks T. (2021). SB 100 joint agency report - achieving 100 percent clean Electricity in California: an initial assessment. Available online at: https://www.energy.ca.gov/publications/2021/2021-sb-100-joint-agency-report-achieving-100-percent-clean-electricity (Accessed November 12, 2024).
54
Gorman W. Mills A. Wiser R. (2019). Improving estimates of transmission capital costs for utility-scale wind and solar projects to inform renewable energy policy. Energy Policy135:110994. doi: 10.1016/j.enpol.2019.110994
55
Groundwater Exchange (2024a) San Joaquin Valley – Kaweah. Available online at: https://groundwaterexchange.org/basin/san-joaquin-valley-kaweah-5-022-11/ (Accessed November 14, 2024).
56
Groundwater Exchange (2024b). San Joaquin Valley – Tule. Available online at: https://groundwaterexchange.org/basin/san-joaquin-valley-tule-5-022-13/ (Accessed November 14, 2024).
57
Hanak E. Escriva-Bou A. Gray B. Green B. Harter T. Jezdimirovic J. et al . (2019). ‘Water and the future of the San Joaquin Valley: Overview’.
58
Hanak E. Ayres A. Peterson C. Escriva-Bou A. Cole S. et al . (2023). Managing Water and farmland transitions in the San Joaquin Valley.
59
Harder Thomas De Groot David . (2024). “Greater Kaweah - groundwater sustainability plan amended 2024.” Available online at: https://greaterkaweahgsa.org/uploads/01J4HWSC5NWJJ3TQMJWN9BGPX2.pdf (Accessed March 12, 2025).
60
Harder T. Van de Water J. (2017) Hydrogeological Conceptual Model and Water Budget of the Tule Subbasin Vol 1.
61
Harnly M. E. Bradman A. Nishioka M. McKone T. E. Smith D. McLaughlin R. et al . (2009). Pesticides in dust from homes in an agricultural area. Environ. Sci. Technol.43, 8767–8774. doi: 10.1021/es9020958
62
Harter T. Dzurella K. Kourakos G. Hollander A. Bell A. M. et al . (2017). Nitrogen fertilizer loading to groundwater in the Central Valley. California Department of Food and Agriculture and University of California Davis. p. 333. Available online at: http://groundwaternitrate.ucdavis.edu (Accessed August 18, 2024).
63
Heinelt H. (2002). “Achieving sustainable and innovative policies through participatory governance in a multi-level context” in Participatory governance in multi-level context: Concepts and experience. eds. HeineltH.et al. (Wiesbaden: VS Verlag für Sozialwissenschaften), 17–32.
64
Hernandez R. R. Easter S. B. Murphy-Mariscal M. L. Maestre F. T. Tavassoli M. Allen E. B. et al . (2014). Environmental impacts of utility-scale solar energy. Renew. Sust. Energ. Rev.29, 766–779. doi: 10.1016/j.rser.2013.08.041
65
ICF (2022). ‘Kaweah groundwater subbasin regional conservation investment strategy (RCIS)’.
66
IMPLAN Group (2019) ‘IMPLAN’. Available online at: https://implan.com/ (Accessed October 7, 2024).
67
Irvin R. A. Stansbury J. (2004). Citizen participation in decision making: is it worth the effort?Public Adm. Rev.64, 55–65. doi: 10.1111/j.1540-6210.2004.00346.x
68
Jankowski S. Faunt C.C. Phillips S. (2018). ‘Optimal managed aquifer recharge to address Land subsidence within California’s Central Valley’, In. Merican geophysical union fall meeting (H34I-14), Washington, D.C.: AGU. Available online at: https://agu.confex.com/agu/fm18/meetingapp.cgi/Paper/468557 (Accessed September 11, 2024).
69
Kainz W. (2001). ‘Fuzzy logic and GIS’, in. Austria: University of Vienna, 1–21.
70
Kang S. Knight R. (2021). Application of a multipoint statistics method to assess potential recharge areas in San Luis Obispo County, California, U.S.A. Available online at: https://www.slocounty.ca.gov/departments/groundwater-sustainability/forms-documents/paso-robles-groundwater-basin/paso-basin-aerial-groundwater-mapping-pilot-study/multipoint-statistical-report (Accessed September 11, 2024).
71
Kelsey R. Hart A. Butterfield H. S. Vink D. (2018). Groundwater sustainability in the San Joaquin Valley: multiple benefits if agricultural lands are retired and restored strategically. Calif. Agric.72, 151–154. doi: 10.3733/ca.2018a0029
72
Khajehali M. Safavi H. R. Iran Pour S. (2023). Evaluation of management scenarios for land subsidence reduction and groundwater rehabilitation in Damane-Daran plain, Iran. Groundw. Sustain. Dev.23:100995. doi: 10.1016/j.gsd.2023.100995
73
Klausmeyer K. J. Howard T. Keeler-Wolf K. Davis-Fadtke R. Hull Lyons A. (2018). “Mapping Indicators of Groundwater Dependent Ecosystems in California.” Available at:https://data.cnra.ca.gov/dataset/natural-communities-commonly-associated-with-groundwater
74
Koebele E. A. Méndez-Barrientos L. E. Nadeau N. Gerlak A. K. (2024). Beyond engagement: enhancing equity in collaborative water governance. WIREs Water11:e1687. doi: 10.1002/wat2.1687
75
Land IQ (2022). Statewide Land use mapping. Available online at: https://www.landiq.com/land-use-mapping (Accessed July 22, 2024).
76
Land Subsidence Task Committee (2022). Investigation of Land subsidence due to fluid withdrawal. Reston, VA: American Society of Civil Engineers.
77
Larbi P.A. Culumber M. Zhuang G. Douhan G. Thistle H. Willett M. et al . (2022). ‘Evaluation of downwind spray drift from Airblast spray applications in almond, Citrus, and grape’, in 2022 ASABE annual international meeting, July 17-20, 2022. 2022 ASABE annual international meeting, July 17-20, 2022, American Society of Agricultural and Biological Engineers.
78
Lee S.-J. Mehler L. Beckman J. Diebolt-Brown B. Prado J. Lackovic M. et al . (2011). Acute pesticide illnesses associated with off-target pesticide drift from agricultural applications: 11 states, 1998–2006. Environ. Health Perspect.119, 1162–1169. doi: 10.1289/ehp.1002843
79
Lees M. Knight R. Smith R. (2022). Development and application of a 1D compaction model to understand 65 years of subsidence in the San Joaquin Valley. Water Resour. Res.58:e2021WR031390. doi: 10.1029/2021WR031390
80
Levintal E. Kniffin M. L. Ganot Y. Marwaha N. Murphy N. P. Dahlke H. E. (2023). Agricultural managed aquifer recharge (ag-MAR)—a method for sustainable groundwater management: a review. Crit. Rev. Environ. Sci. Technol.53, 291–314. doi: 10.1080/10643389.2022.2050160
81
Levintal E. Huang L. Prieto García C. Coyotl A. Fidelibus M. W. Horwath W. R. et al . (2023). Nitrogen fate during agricultural managed aquifer recharge: linking plant response, hydrologic, and geochemical processes. Sci. Total Environ.864:161206. doi: 10.1016/j.scitotenv.2022.161206
82
Levy Z. F. Jurgens B. C. Burow K. R. Voss S. A. Faulkner K. E. Arroyo-Lopez J. A. et al . (2021). Critical aquifer overdraft accelerates degradation of groundwater quality in California’s Central Valley during drought. Geophys. Res. Lett.48:e2021GL094398. doi: 10.1029/2021GL094398
83
Lewis S. M. Fitts G. Kelly M. Dale L. (2014). A fuzzy logic-based spatial suitability model for drought-tolerant switchgrass in the United States. Comput. Electron. Agric.103, 39–47. doi: 10.1016/j.compag.2014.02.006
84
Lyimo N. N. Shao Z. Ally A. M. Twumasi N. Y. D. Altan O. Sanga C. A. (2020). A fuzzy logic-based approach for modelling uncertainty in open geospatial data on landfill suitability analysis. ISPRS Int. J. Geo Inf.9:737. doi: 10.3390/ijgi9120737
85
Mallik S. Mishra U. Paul N. (2021). Groundwater suitability analysis for drinking using GIS based fuzzy logic. Ecol. Indic.121:107179. doi: 10.1016/j.ecolind.2020.107179
86
Maples S. R. Foglia L. Fogg G. E. Maxwell R. M. (2020). Sensitivity of hydrologic and geologic parameters on recharge processes in a highly heterogeneous, semi-confined aquifer system. Hydrol. Earth Syst. Sci.24, 2437–2456. doi: 10.5194/hess-24-2437-2020
87
Marwaha N. Kourakos G. Levintal E. Dahlke H. E. (2021). Identifying agricultural managed aquifer recharge locations to benefit drinking Water supply in rural communities. Water Resour. Res.57:e2020WR028811. doi: 10.1029/2020WR028811
88
Mayzelle M. M. Viers J. H. Medellín-Azuara J. Harter T. . (2015). Economic feasibility of irrigated agricultural Land use buffers to reduce groundwater nitrate in rural drinking water sources. Water7, 12–37. doi: 10.3390/w7010012
89
Medellín-Azuara J. MacEwan D. Howitt R. E. Koruakos G. Dogrul E. C. Brush C. F. et al . (2015). Hydro-economic analysis of groundwater pumping for irrigated agriculture in California’s Central Valley, USA. Hydrogeol. J.23, 1205–1216. doi: 10.1007/s10040-015-1283-9
90
Murphy N. P. Waterhouse H. Dahlke H. E. (2021). Influence of agricultural managed aquifer recharge on nitrate transport: the role of soil texture and flooding frequency. Vadose Zone J.20:e20150. doi: 10.1002/vzj2.20150
91
Newig J. Challies E. Jager N. W. Kochskaemper E. Adzersen A. (2018). The environmental performance of participatory and collaborative governance: a framework of causal mechanisms. Policy Stud. J.46, 269–297. doi: 10.1111/psj.12209
92
Newson G . (2023). Executive order N-4-23. Available online at: https://www.gov.ca.gov/wp-content/uploads/2023/03/3.10.23-Ground-Water-Recharge.pdf (Accessed November 18, 2024).
93
Nguyen T. T. Verdoodt A. van Y T. Delbecque N. Tran T. C. van Ranst E. (2015). Design of a GIS and multi-criteria based land evaluation procedure for sustainable land-use planning at the regional level. Agric. Ecosyst. Environ.200, 1–11. doi: 10.1016/j.agee.2014.10.015
94
Nyeko M. (2012). GIS and multi-criteria decision analysis for Land use resource planning. J. Geogr. Inf. Syst.4, 341–348. doi: 10.4236/jgis.2012.44039
95
O’Geen A. T. Saal M. Dahlke H. Doll D. Elkins R. Fulton A. et al . (2015). Soil suitability index identifies potential areas for groundwater banking on agricultural lands. Calif. Agric.69, 75–84. doi: 10.3733/ca.v069n02p75
96
Perrone D. Rohde M. M. Hammond Wagner C. Anderson R. Arthur S. Atume N. et al . (2023). Stakeholder integration predicts better outcomes from groundwater sustainability policy. Nat. Commun.14:3793. doi: 10.1038/s41467-023-39363-y
97
Perrone D. Jasechko S. (2017). Dry groundwater wells in the western United States. Environ. Res. Lett.12:104002. doi: 10.1088/1748-9326/aa8ac0
98
Perzan Z. Osterman G. Maher K. (2022). ‘Controls on managed aquifer recharge through a heterogeneous vadose zone: hydrologic modeling at a site characterized with surface geophysics’.
99
Proctor K. Murthy G. Higgins C. (2020). Agrivoltaics align with green new Deal goals while supporting investment in the US Rural Economy. Sustainability13:137. doi: 10.3390/su13010137
100
Qiu F. Chastain B. Zhou Y. Zhang C. Sridharan H. (2014). Modeling land suitability/capability using fuzzy evaluation. GeoJournal79, 167–182. doi: 10.1007/s10708-013-9503-0
101
Quandt A. Larsen A. E. Bartel G. Okamura K. Sousa D. (2023). Sustainable groundwater management and its implications for agricultural land repurposing. Reg. Environ. Chang.23:120. doi: 10.1007/s10113-023-02114-2
102
Rodríguez-Flores J. M. Fernandez-Bou A. S. Ortiz-Partida J. P. Medellín-Azuara J. (2023). Drivers of domestic wells vulnerability during droughts in California’s Central Valley. Environ. Res. Lett.19:014003. doi: 10.1088/1748-9326/ad0d39
103
Schlossberg M. Shuford E. (2005). ‘Delineating “public” and “participation” in PPGIS.’ 16(2).
104
Serra-Llobet A. Jähnig S. C. Geist J. Kondolf G. M. Damm C. Scholz M. et al . (2022). Restoring Rivers and floodplains for habitat and flood risk reduction: experiences in multi-benefit floodplain management from California and Germany. Front. Environ. Sci.9:778568. doi: 10.3389/fenvs.2021.778568
105
Shi G. Ma P. Hu X. Huang B. Lin H. (2021). Surface response and subsurface features during the restriction of groundwater exploitation in Suzhou (China) inferred from decadal SAR interferometry. Remote Sens. Environ.256:112327. doi: 10.1016/j.rse.2021.112327
106
Sieber R. (2006). Public participation geographic information systems: a literature review and framework. Ann. Assoc. Am. Geogr.96, 491–507. doi: 10.1111/j.1467-8306.2006.00702.x
107
Smith R. Knight R. Fendorf S. (2018). Overpumping leads to California groundwater arsenic threat. Nat. Commun.9:2089. doi: 10.1038/s41467-018-04475-3
108
Sturchio M. A. Knapp A. K. (2023). Ecovoltaic principles for a more sustainable, ecologically informed solar energy future. Nat. Ecol. Evol.7, 1746–1749. doi: 10.1038/s41559-023-02174-x
109
USDA (2018). ‘Soil survey manual’. Available online at: https://www.nrcs.usda.gov/sites/default/files/2022-09/The-Soil-Survey-Manual.pdf (Accessed September 11, 2024).
110
USDA (2022). USDA - National Agricultural Statistics Service - California - county ag commissioners’ data listing. Available online at: https://www.nass.usda.gov/Statistics_by_State/California/Publications/AgComm/index.php (Accessed January 22, 2024).
111
USGS (2010). ‘Central Valley Hydrologic Model: Texture Model’. Available online at: https://ca.water.usgs.gov/projects/central-valley/cvhm-texture-model.html (Accessed October 22, 2024).
112
Wang T. Franz T. E. Zlotnik V. A. (2015). Controls of soil hydraulic characteristics on modeling groundwater recharge under different climatic conditions. J. Hydrol.521, 470–481. doi: 10.1016/j.jhydrol.2014.12.040
113
Waterhouse H. Bachand S. Mountjoy D. Choperena J. Bachand P. Dahlke H. E. et al . (2020). Agricultural managed aquifer recharge — water quality factors to consider. Calif. Agric.74, 144–154. doi: 10.3733/ca.2020a0020
114
Waterhouse H. Arora B. Spycher N. F. Nico P. S. Ulrich C. Dahlke H. E. et al . (2021). Influence of agricultural managed aquifer recharge (AgMAR) and stratigraphic heterogeneities on nitrate reduction in the deep subsurface. Water Resour. Res.57:e2020WR029148. doi: 10.1029/2020WR029148
115
Wu G.C. Leslie E. Allen D. Sawyerr O. Richard D. Brand E. et al . (2019). ‘Power of place - Land conservation and clean energy pathways for California’.
116
Wu G.C. Jones R. A. Leslie E. Williams J. H. Pascale A. Brand E. et al . (2022). ‘Minimizing habitat conflicts in meeting net-zero energy targets in the western United States’. Zenodo.
117
Yang F. Zeng G. du C. Tang L. Zhou J. Li Z. (2008). Spatial analyzing system for urban land-use management based on GIS and multi-criteria assessment modeling. Prog. Nat. Sci.18, 1279–1284. doi: 10.1016/j.pnsc.2008.05.007
118
Zhang Y. Wu J. Xue Y. Wang Z. Yao Y. Yan X. et al . (2015). Land subsidence and uplift due to long-term groundwater extraction and artificial recharge in Shanghai, China. Hydrogeol. J.23, 1851–1866. doi: 10.1007/s10040-015-1302-x
119
Zhang Y. J. Li A. J. Fung T. (2012). Using GIS and multi-criteria decision analysis for conflict resolution in Land use planning. Procedia Environ. Sci.13, 2264–2273. doi: 10.1016/j.proenv.2012.01.215
120
Zomlot Z. Verbeiren B. Huysmans M. Batelaan O. (2015). Spatial distribution of groundwater recharge and base flow: assessment of controlling factors. J. Hydrol. Reg. Stud.4, 349–368. doi: 10.1016/j.ejrh.2015.07.005
Summary
Keywords
multibenefit, land repurposing, decision-making, groundwater, sustainability
Citation
Nuñez-Bolaño Y, Flores-Landeros H, Rodríguez-Flores JM, Fernandez-Bou AS, Medellín-Azuara J and Harmon TC (2025) A participatory approach for developing a geospatial toolkit for mapping the suitability of California’s Multibenefit Land Repurposing Program (MLRP) in support of groundwater sustainability. Front. Water 7:1539834. doi: 10.3389/frwa.2025.1539834
Received
04 December 2024
Accepted
23 April 2025
Published
09 May 2025
Volume
7 - 2025
Edited by
Nevil Wyndham Quinn, University of the West of England, United Kingdom
Reviewed by
Amy Quandt, San Diego State University, United States
Muhammad Yousuf Jat Baloch, Shandong University, China
Anam Nigar, Changchun University of Science and Technology, China
Updates
Copyright
© 2025 Nuñez-Bolaño, Flores-Landeros, Rodríguez-Flores, Fernandez-Bou, Medellín-Azuara and Harmon.
This is an open-access article distributed under the terms of the Creative Commons Attribution License (CC BY). The use, distribution or reproduction in other forums is permitted, provided the original author(s) and the copyright owner(s) are credited and that the original publication in this journal is cited, in accordance with accepted academic practice. No use, distribution or reproduction is permitted which does not comply with these terms.
*Correspondence: Yelenka Nuñez-Bolaño, ynunezbolano@ucmerced.edu
Disclaimer
All claims expressed in this article are solely those of the authors and do not necessarily represent those of their affiliated organizations, or those of the publisher, the editors and the reviewers. Any product that may be evaluated in this article or claim that may be made by its manufacturer is not guaranteed or endorsed by the publisher.