 Youssef Hamou-Ali1
 Nourlhouda Karmouda1
 Ismail Mohsine1
 Tarik Bouramtane1*
 Ilias Kacimi1
 Sarah Tweed1,2
 Mounia Tahiri1Nadia Kassou1
 Ali El Bilali3Omar Chafki3Mohamed Abdellah Ezzaouini4Siham Laraichi5Abdelaaziz Zerouali5
 Marc Leblanc1,2,6
- 1Geosciences, Water and Environment Laboratory, Faculty of Sciences, Mohammed V University of Rabat, Rabat, Morocco
- 2Institut de Recherche Pour le Développement (IRD), UMR Geau, Montpellier, France
- 3River Basin Agency of Bouregreg and Chaouia, Chaouia, Morocco
- 4River Basin Agency of Loukkos, Tétouan, Morocco
- 5Research and Water Planning Direction, Rabat, Morocco
- 6Hydrogeology Laboratory, UMR EMMAH, University of Avignon, Avignon, France
The application of GRACE satellite-derived Total Water Storage (TWS) data for local water management is constrained by its coarse spatial resolution (100-300 km). To address this limitation, a Random Forest-based model was employed to downscale GRACE TWS data from 100 km to 1 km resolution over Morocco, a drought-prone region, covering the period from 2002 to 2022. The input datasets included precipitation (GPM, 10 km), NDVI (MODIS, 1 km), land surface temperature (LST, MODIS, 1 km), evapotranspiration (MODIS, 500 m), elevation (SRTM, 30 m), and the Normalised Difference Snow Index (NDSI, MODIS, 500 m). While downscaling improves the spatial resolution of GRACE data, validating these higher-resolution outputs presents challenges. In this study, the downscaled data were validated using three complementary approaches: statistical validation, groundwater level in-situ data validation, and validation against known aquifer dynamics. Statistical validation demonstrated strong model performance, with a Nash-Sutcliffe Efficiency (NSE) of 0.80, a low RMSE of 0.82 cm, and MAE of 0.57 cm, along with an R² of 0.80 between original and downscaled data. Cross-validation confirmed the model’s consistency, yielding mean, median, and maximum R² values of 0.56, 0.64, and 0.89 respectively. Error metrics remained consistently low throughout the study period, with MAE values ranging from 0.36 cm to 0.6 cm and RMSE values between 0.5 cm and 0.8 cm. Comparison with in-situ groundwater levels showed significant improvements, with correlation coefficients increasing for 63% of the 139 analysed wells. The 1 km TWS data revealed localised variations and clearer trends across different aquifers, with aquifer systems within the same structural domain exhibiting similar TWS patterns. These findings highlight the potential of the downscaling model to enhance local water management by capturing finer hydrological variations. The proposed approach effectively overcomes GRACE’s spatial resolution limitations, as demonstrated through comprehensive validation. This methodology shows particular promise for water resource monitoring in drought-vulnerable regions such as Morocco, providing decision-makers with higher-resolution data for improved water management strategies.
1 Introduction
The growing effects of climate change, coupled with the increasing recurrence of droughts and overexploitation, have put enormous pressure on water resources worldwide (García-Ruiz et al., 2011; Jain et al., 2024). In this context, accurate and reliable information on the availability and quantity of water resources has become essential to ensure an effective planning and management, particularly during periods of drought (Kang et al., 2004; Scanlon et al., 2023; Sabale et al., 2023; Sherif et al., 2023). This need is even more critical in arid and semi-arid regions, where water scarcity profoundly affects agriculture, ecosystems and human livelihoods, underlining the importance of informed decision-making for the sustainable management of water resources (García-Ruiz et al., 2011; Sherif et al., 2023). In this context, the Gravity Recovery and Climate Experiment (GRACE) satellites have played a key role since 2000 in providing crucial data on total water storage (TWS), which includes the combined contributions of groundwater storage (GWS), surface water bodies (SWB), snow water equivalent (SWE), soil moisture (SM) and canopy water (Ca) (Shen et al., 2015; Ouatiki et al., 2022).
Through its ability to track water mass variations in aquifers, In many studies, GRACE has provided valuable insights into groundwater depletion across numerous regions worldwide (Alghafli et al., 2023; Melati et al., 2023; Gautam et al., 2024; Satizábal-Alarcón et al., 2024). Additionally, it has been instrumental in monitoring changes in the water mass of major lakes and reservoirs, delivering essential data to support efficient water management strategies (Jeffcoat et al., 2009; Longuevergne et al., 2013; Wang et al., 2018; Wang et al., 2019; Carabajal and Boy, 2021). Furthermore, GRACE plays a crucial role in understanding the impact of climate change on the global hydrological cycle by tracking water mass variations over time (Wouters et al., 2014; Tapley et al., 2019; Zhou et al., 2022). These data are essential for calibrating and improving hydrological models, leading to more accurate forecasts of water resources (Bai et al., 2018; Soltani et al., 2021).
Research on TWS using GRACE data is only meaningful when conducted on a regional or large scale due to the low resolution of GRACE satellite data, which ranges between 100 km and 300 km depending on the GRACE solutions used. The low spatial resolution of GRACE poses a major limitation in arid and semi-arid regions, which are marked by significant climatic, topographic, and socio-economic diversity. In such areas, the 100–300 km resolution of GRACE is often inadequate for detecting many hydrological changes (Longuevergne et al., 2010; Loomis et al., 2021; Xu et al., 2023). Such environments require a detailed understanding of water mass variations at a fine scale to effectively manage water resources for supply and irrigation (Wheater, 2002; Loomis et al., 2021; Bouizrou et al., 2023).
In arid and semi-arid regions, GRACE data is often downscaled, a process that involves reducing the resolution from a coarse spatial scale to a finer one for more detailed analysis (Miro and Famiglietti, 2018; Wang et al., 2024). Downscaling GRACE data is typically categorized into two approaches: dynamic and statistical (Lee and Jeong, 2014; Sahour et al., 2020; Pellet et al., 2024). Dynamic downscaling uses large-scale boundary conditions and external data to accurately simulate regional characteristics. This method often incorporates regional hydrological models that rely on input data from global hydrological models or coarse-scale satellite observations, such as GRACE data (Herrera et al., 2006; Sun et al., 2023a; Pellet et al., 2024). The primary advantage of dynamic downscaling lies in its ability to capture complex physical processes and interactions within the hydrological cycle at a higher spatial resolution (Xue et al., 2014). This method proves particularly valuable in regions characterized by complex topography or diverse hydrological conditions, where accurate modeling is crucial. By using detailed physical equations, dynamic downscaling simulates the behavior of the hydrological system at a finer scale, starting with coarse-resolution data from global models. This enables more precise and localized representations of hydrological phenomena, enhancing the overall accuracy of predictions (Gemitzi et al., 2021; Gao et al., 2022).
Statistical downscaling involves identifying statistical relationships between coarse-resolution hydrological variables (predictors) and fine-resolution hydrological variables (predictands) (Yin et al., 2018; Sahour et al., 2020). Compared to dynamic downscaling, it is less computationally intensive and can be more easily applied across different regions and variables (Vishwakarma et al., 2021; Wang et al., 2024). Frequently used in hydrological studies, statistical downscaling helps generate high-resolution datas and assess the potential impacts on local water resources. It is especially useful in regions where dynamic downscaling is impractical due to limited computational resources (Khorrami, 2023; Zhang et al., 2021; Zuo et al., 2021).
Statistical downscaling ML methods vary in approach and applicability (Tyralis et al., 2019). Random Forest (RF) enhances predictive accuracy by aggregating multiple decision trees, effectively capturing complex, non-linear relationships (Wang et al., 2024; Jyolsna et al., 2021). Support Vector Machine (SVM) determines optimal hyperplanes for classification and regression (Yazdian et al., 2023). Extreme Gradient Boosting (XG-Boost) sequentially refines weak models, improving performance in large datasets (Ali et al., 2023). Multi-Layer Perceptron (MLP), a neural network-based approach, models intricate data interactions, making it suitable for downscaling applications (Sahour et al., 2020).
Based on the following studies (Chen et al., 2019; Zuo et al., 2021; Zhang et al., 2021), a commonly adopted methodology for downscaling GRACE data emerges. This approach relies on establishing a machine learning (ML) relationship between the original GRACE product and resampled features such as precipitation and temperature. The methodology involves extracting residuals from the ML relationship between the upsampled features and the original GRACE data. These residuals are then incorporated into the prediction process to apply a correction, ultimately producing the downscaled GRACE product.
Downscaling GRACE data increases spatial resolution, but without proper validation, it may introduce noise rather than improving accuracy (Pascal et al., 2022). Validation ensures that the downscaled data reflect real-world hydrological variations (Vishwakarma et al., 2021) by comparing them with independent, reliable sources to assess their accuracy and effectiveness (Zhang et al., 2017).
The validation of GRACE data downscaling methods, therefore, relies on a range of approaches, each offering distinct strengths and limitations. A widely used technique involves comparing the downscaled data with the original GRACE observations. This comparison helps assess how accurately the downscaling methods capture the spatial and temporal variations inherent in the raw data, offering critical insights into their effectiveness (He et al., 2021; Milewski et al., 2019; Ali et al., 2021). Furthermore, validation can be achieved by comparing downscaled results with outputs from hydrological or climatic models, providing a reference for assessing accuracy (Zhong et al., 2021a; Gemitzi et al., 2021; Gou and Soja, 2024). Additionally, in situ groundwater level data from wells and boreholes offer another widely used method for validating downscaling models (Foroumandi et al., 2023; Seyoum et al., 2019; Zhong et al., 2021a). This approach relies on the understanding that groundwater is a major component of the water budget, meaning variations in TWS detected by GRACE in arid areas largely correspond to changes in groundwater levels recorded through field measurements (Hu et al., 2019; Melati et al., 2019). Each validation approach offers distinct strengths and limitations, with their effectiveness varying based on the study context and data availability. The novelty of our method lies in the application of these three complementary validation methods to ensure robust and reliable downscaling results. Consequently, combining multiple methods often provides a more comprehensive and reliable assessment of downscaling model performance. The optimal choice of validation method ultimately depends on the study’s objectives, as well as the available resources and data (Chen et al., 2021).
In this study, we develop a statistical downscaling model based on the Random Forest (RF) method to refine GRACE Total Water Storage (TWS) data from a coarse resolution of 100 km to a finer resolution of 1 km. The model integrates multiple remote sensing datasets, including precipitation (GPM, 10 km), the Normalized Difference Vegetation Index (NDVI, MODIS, 1 km), Land Surface Temperature (LST, MODIS, 1 km), Actual Evapotranspiration (AET, MODIS, 500 m), the Digital Elevation Model (DEM, SRTM, 30 m), and the Normalized Difference Snow Index (NDSI, MODIS, 500 m). This downscaling approach was applied to the northern regions of Morocco, which include major watersheds and aquifers responsible for storing most of the country’s water resources (Hssaisoune et al., 2020). Over the past two decades, these areas have experienced recurring and increasingly severe droughts, with the current drought lasting for six consecutive years (Hadri et al., 2021; Gumus et al., 2024). While these regions have a semi-arid climate, recent trends show a clear progression toward more arid conditions (Brahim et al., 2017; Ouhamdouch and Bahir, 2017). This growing vulnerability highlights the importance of accurate water resource monitoring and management in these critical areas. In contrast, the southern regions of Morocco, primarily encompassing the Sahara Desert, were excluded from detailed analysis and calculations. This exclusion is due to the region’s stable and extremely arid climatic conditions, which contribute to minimal hydrological variability (Seo et al., 2006; Ferreira et al., 2023; Zhong et al., 2023; Guo et al., 2024). In fact, the total water storage trends in this vast desert area is expected to be very low to nearly zero, as seasonal and inter-annual fluctuations in water storage are negligible (Gischler, 1976; Armon et al., 2024).
A thorough validation of the downscaling results was carried out through a three-round approach. The first method involved a statistical comparison between the original GRACE data and the downscaled data to assess the model’s performance. The second method used groundwater level measurements to verify if the downscaled data accurately reflected observed declines and hydrodynamic trends in Morocco. The third method evaluated the model’s ability to capture the behavior of key aquifers by comparing the downscaled results with known groundwater dynamics, particularly in the context of recurrent drought and overexploitation.
2 Materials and methods
2.1 Study area
Morocco’s coastline along the Atlantic Ocean and the Mediterranean Sea spans approximately 3,000 km. Its diverse geography includes extensive plains, high mountain ranges such as the Rif and Atlas, and vast Saharan deserts, covering an area of 710,850 km2 from the Strait of Gibraltar to the southern edges of the Sahara (Bouramtane et al., 2020a; Driouech, 2010) (Figures 1a,b). The geology of Morocco is characterized by a diverse stratigraphic history. The Precambrian and Paleozoic eras correspond to ancient basement rocks, including crystalline, metamorphic, and magmatic formations in the Anti-Atlas and Reguibat Shield (Bouramtane et al., 2020b). The Mesozoic period is marked by extensive sedimentary formations, including carbonate and red sandstone deposits in the High Atlas and Rif. The Cenozoic and Quaternary periods feature sedimentary basins, volcanic formations in the Middle Atlas, and recent alluvial and aeolian deposits in river valleys and the Sahara (Figure 1c) (Bouramtane et al., 2020c). The study area, located in the northern part of Morocco just north of the Saharan Desert, features a climate shaped by the Atlantic Ocean to the west, dry currents from the south and east, and Mediterranean influences from the north (Milewski et al., 2015). Positioned between temperate and tropical climatic zones, this region predominantly experiences semi-arid and arid conditions (Figures 1d,e). Recent climatic data, however, reveal a northward shift of the semi-arid zone, indicating an expansion of drier conditions in this part of Morocco (Ouhamdouch et al., 2018; Bennouna, 2020; Hammoudy et al., 2022).
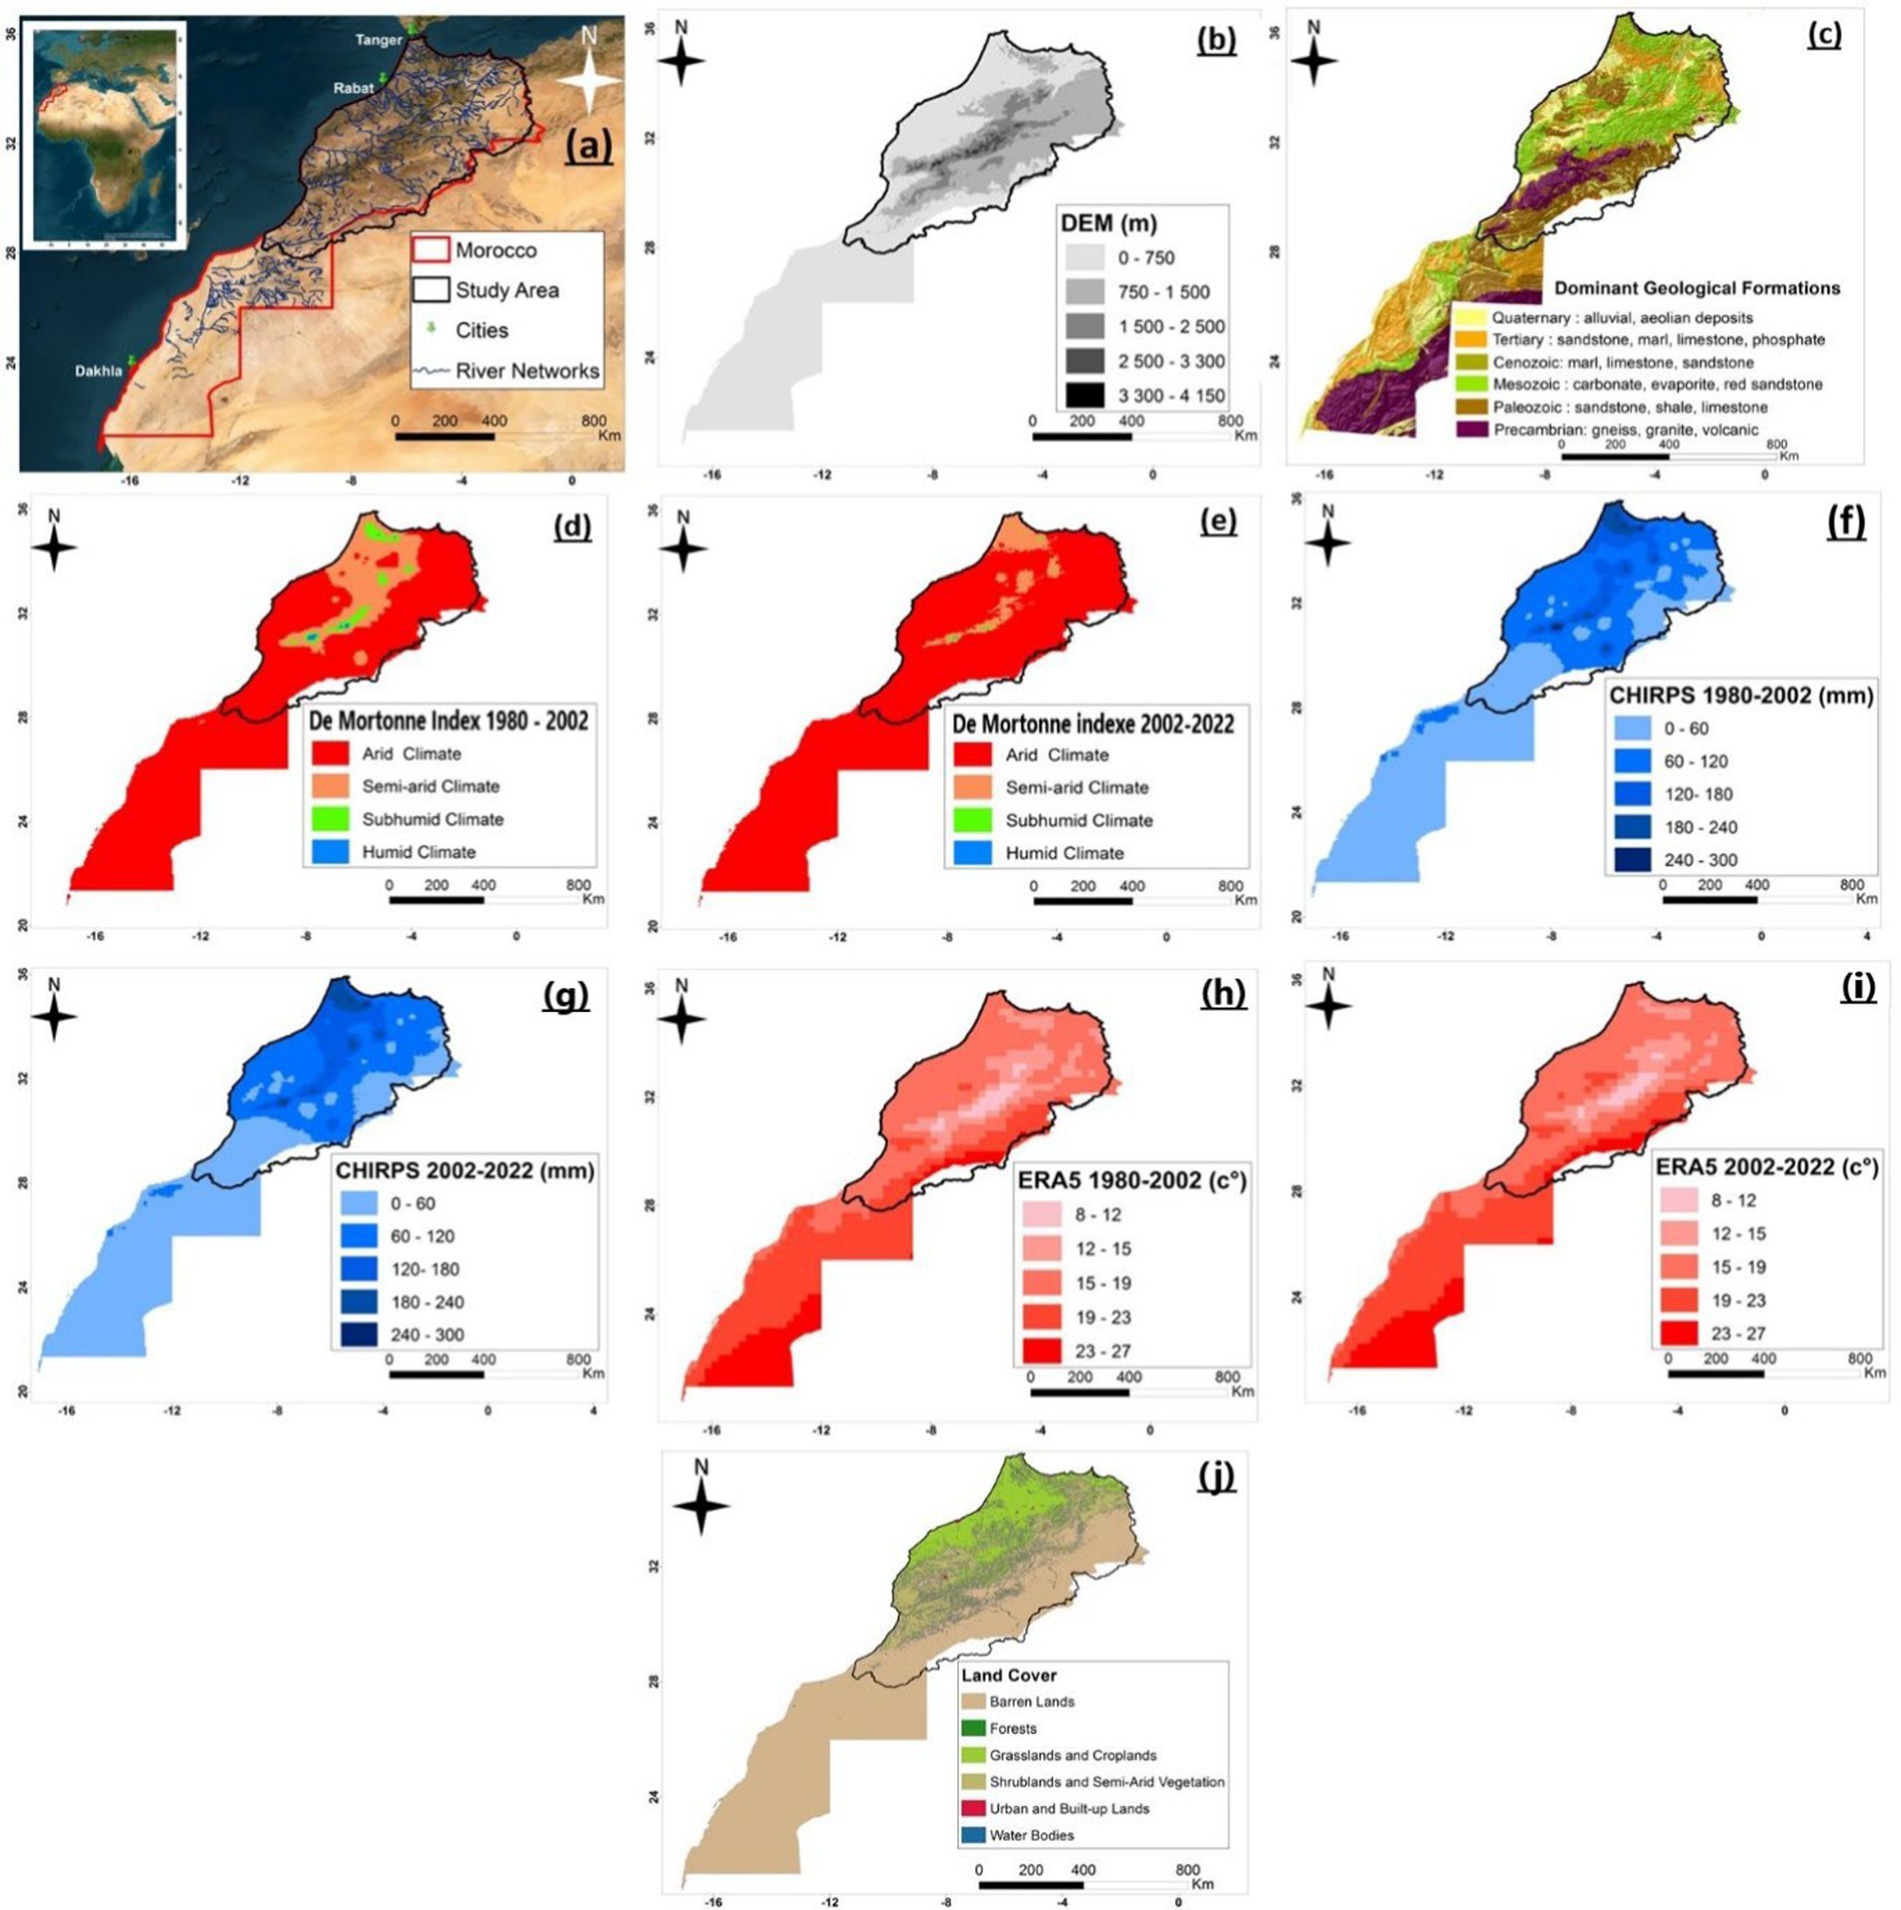
Figure 1. (a) Location of the study area; (b) Digital elevation model (SRTM); (c) Dominant geological formations from United States geological survey data; (d) and (e) Martonne index for 1980–2002 and 2002–2022, respectively; (f,g) Average rainfall (CHIRPS, ERA5) for 1980–2002 and 2002–2022, respectively; (h,i) Average temperature (ERA5) for 1980–2002 and 2002–2022, respectively; (j) 2024 MODIS average land cover.
Since the early 2000s, Morocco has witnessed a decrease in annual precipitation variability (Figures 1f,g) and increase in temperature (Figures 1h,i), signaling a trend toward increasing drought conditions from 1980 to 2015 (El Ajhar et al., 2018; Direction Générale de l’Hydraulique, 2023; Hamdi, 2023; Belahsen et al., 2016; Benassi, 2008; Driouech, 2010; Ahmed et al., 2021). This has resulted in a more dynamic climate system prone to extreme events, such as more frequent and severe droughts and floods (García-Ruiz et al., 2011). Climate change projections indicate a potential decrease in North African precipitation by up to 20% and a temperature increase of up to 3°C by 2050, which could have profound effects on Morocco’s water resources and agriculture (Lachgar et al., 2022; Khalki et al., 2021; Schilling et al., 2012). Currently, Morocco is entering its sixth year of drought (Mahdaoui et al., 2024). The arid to semi-arid regions are experiencing poor rainfall, reduced run-off from major catchment areas, a decline in dam volumes, and a sharp drop in groundwater levels, leading to difficulties in supplying drinking water and meeting agricultural demands (Direction Générale de l’Hydraulique, 2023; Ouhamdouch et al., 2018; Ahmed et al., 2021).
The De Martonne Aridity Index (I), which classifies climate based on precipitation and temperature highlights Morocco’s increasing aridity from 1969–2002 to 2002–2022, with arid zones expanding and humid areas shrinking. This trend, likely driven by climate change, indicates reduced precipitation, rising temperatures, and growing water stress. Land cover patterns in Morocco, derived primarily from MODIS data, reflect this increasing aridity (Figure 1j). Vegetation cover, including forests and croplands, is concentrated in the Rif, Middle Atlas, and Atlantic plains, while vast areas of steppe and barren land dominate the plateaus and eastern regions. The expansion of desert and semi-arid zones, particularly in the southern and eastern parts of the country, aligns with the observed climatic trends. This shift highlights the vulnerability of Morocco’s ecosystems and agricultural zones to ongoing climate change and water scarcity.
In addition to these climatic challenges, irrigated agriculture in Morocco consumes approximately 80% of the country’s freshwater. Furthermore, the agricultural sector contributes 15–20% to the national GDP and employs 44% of the workforce (Schilling et al., 2012; Schyns and Hoekstra, 2014). These factors place immense pressure on water resources, particularly groundwater. Moreover, the increasing demand for irrigation highlights the urgent need for effective water management strategies. Hence, given Morocco’s diverse geography, climatic variability, and the critical pressures on groundwater resources, the region offers an ideal setting for applying GRACE data downscaling techniques (Figure 2).
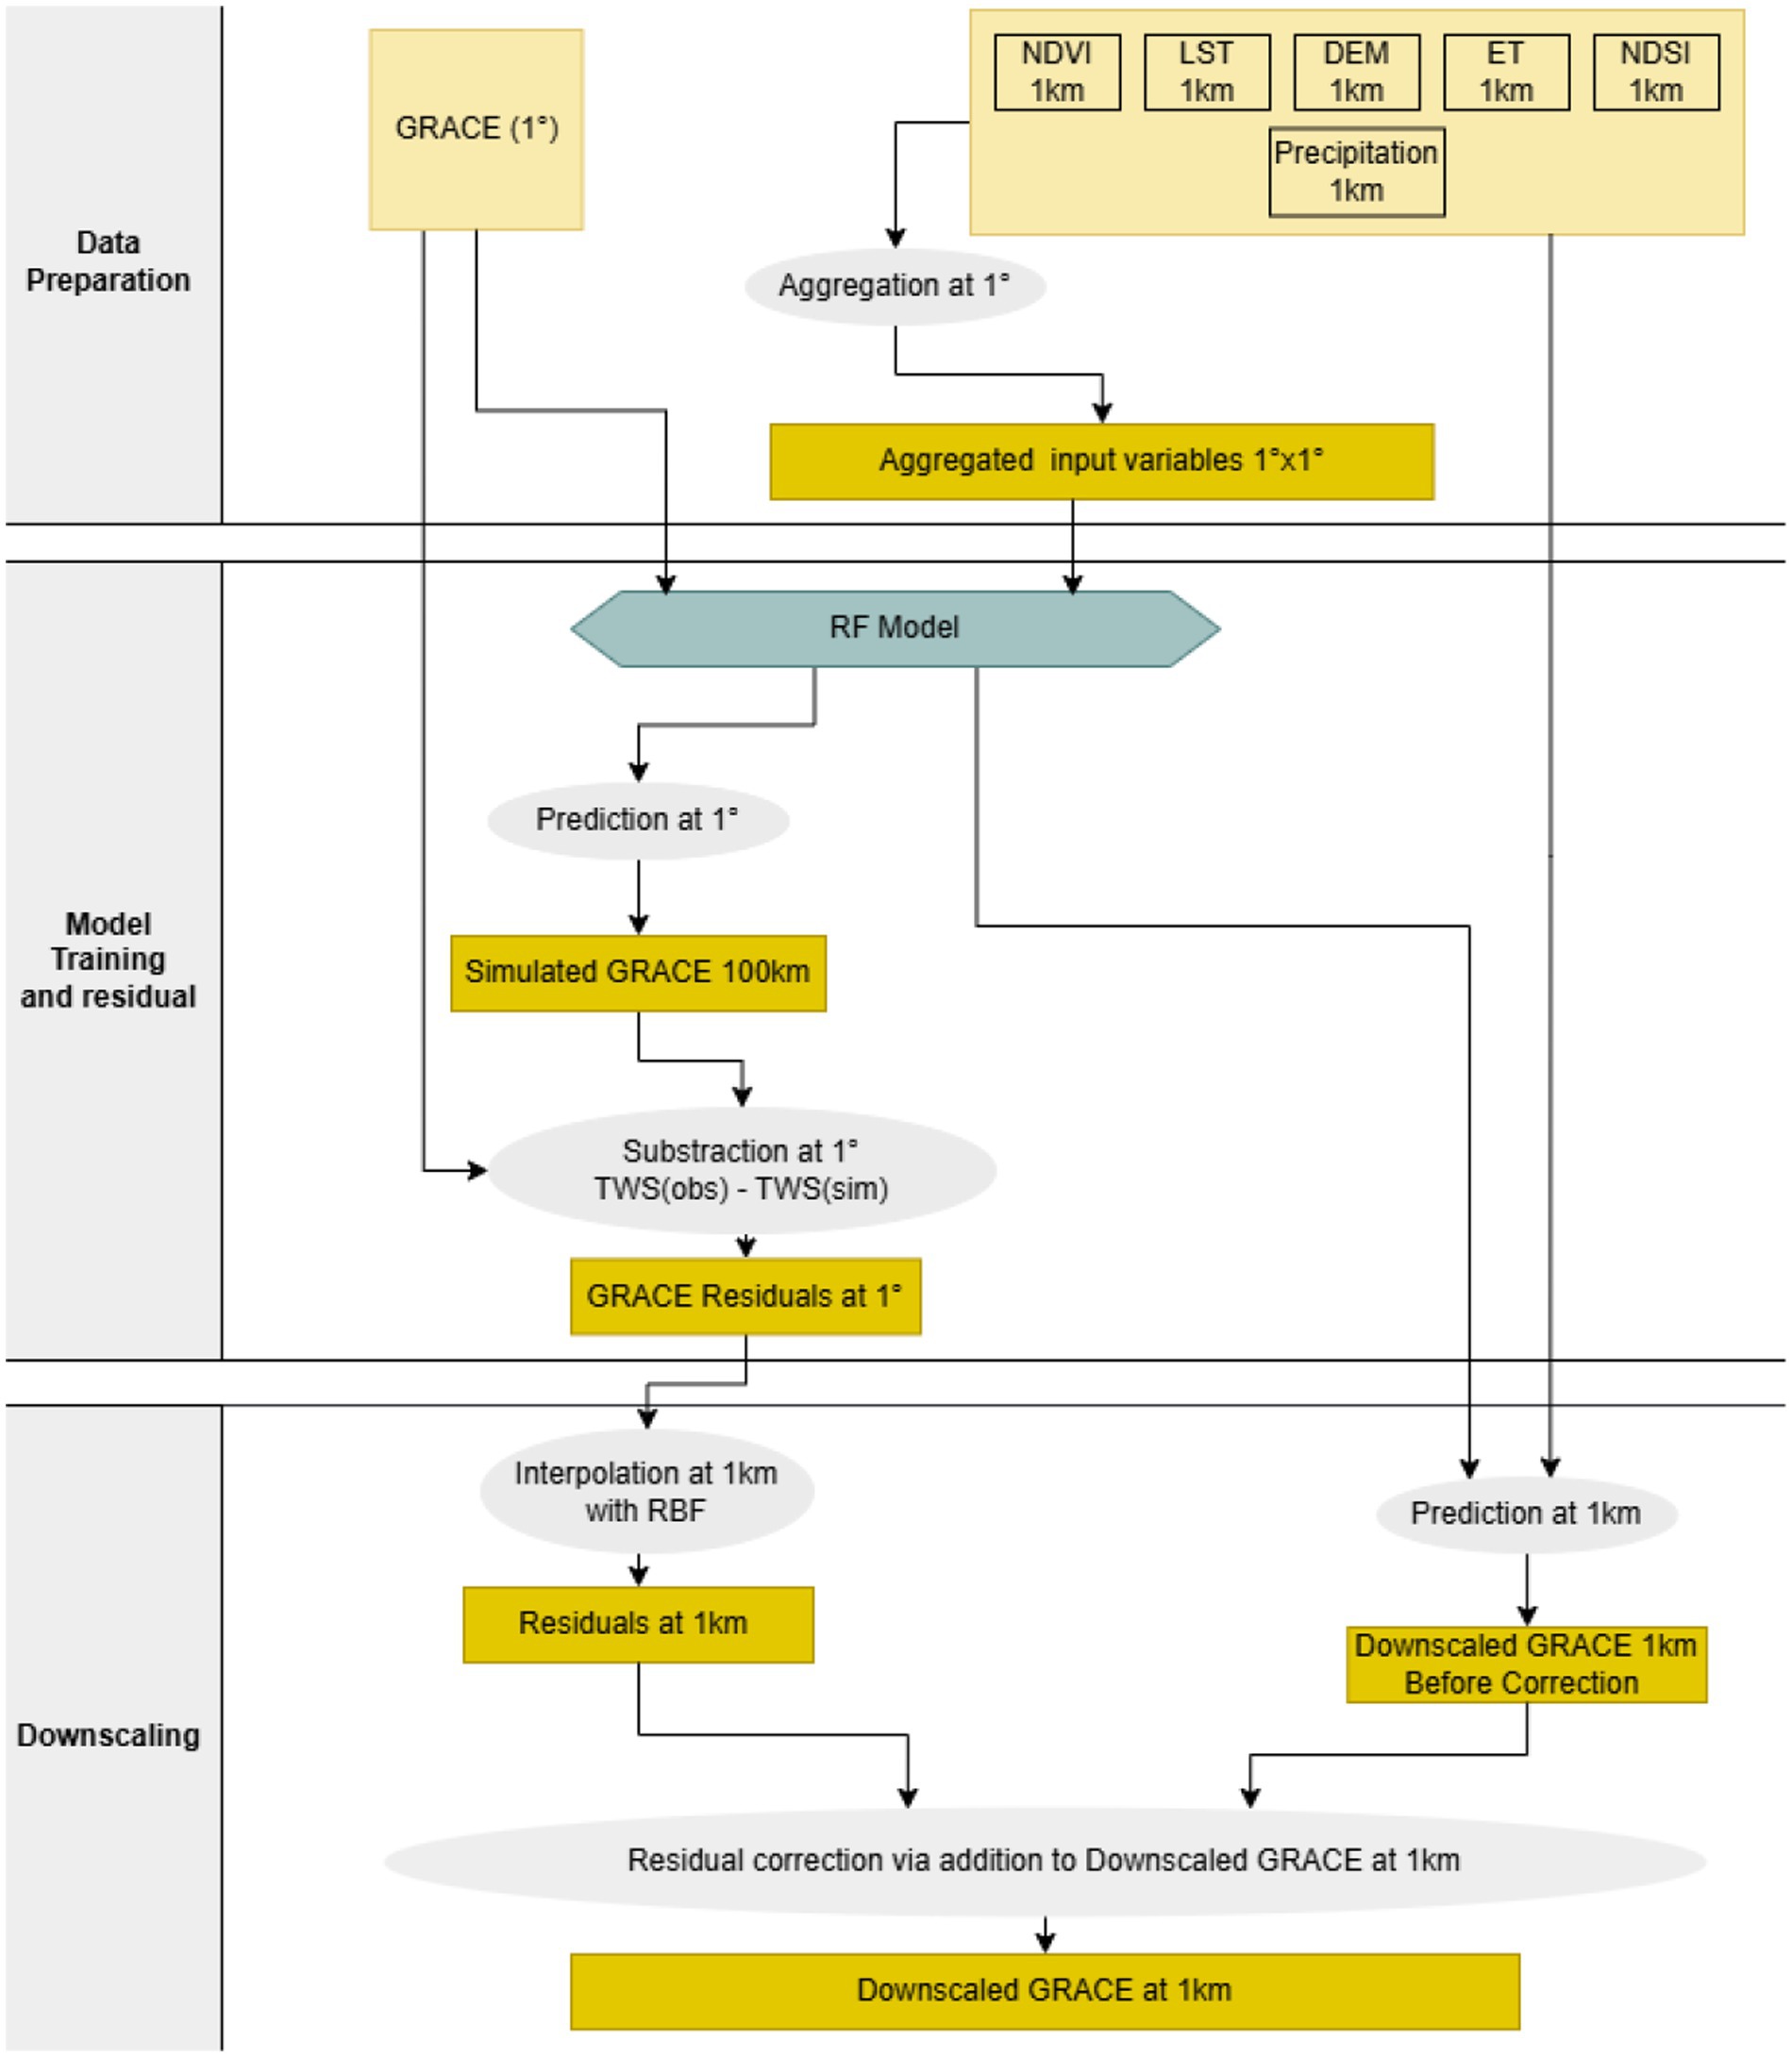
Figure 2. Flowchart of the downscaling method.
2.2 Satellite data
This Downscaling study leverages multiple remote sensing datasets to examine environmental parameters across varying spatial resolutions. These datasets include:
• GRACE Data.
• Precipitation from the Global Precipitation Measurement (GPM) sensor at 10 km resolution.
• Normalized Difference Vegetation Index (NDVI) from MODIS at 1 km resolution.
• Soil Surface Temperature (LST) from MODIS at 1 km resolution.
• Evapotranspiration (ET) from MODIS at 500 m resolution.
• Digital Elevation Model (DEM) from SRTM at 30 m resolution.
• Normalized Difference Snow Index (NDSI) from MODIS at 500 m resolution.
Notably, the MODIS-derived products (NDVI, NDSI, and ET) are generated directly from MODIS images, offering global coverage and benefiting from rigorous quality control. While these processed datasets provide standardized, quality-assured information, our study primarily emphasizes the extraction of primary satellite signals from directly acquired remote sensing data. This approach minimizes processing-induced alterations and enhances data fidelity, accuracy, temporal consistency, and reproducibility.
2.2.1 GRACE data
In this study, the GRACE dataset defined by the Center for Space Research (CSR) Monthly GRACE Level-3 Surface Water Density Equivalent Mass-Anomaly Dataset version 6.0 was used (https://podaac.jpl.nasa.gov/dataset/TELLUS_GRAC_L3_CSR_RL06_LND_v03). The GRACE data are based on the CSR RL06 spherical harmonics (CSR-SH) and have a resolution of 1°. The monthly terrestrial TWS anomalies from the CSR GRACE mascon solutions are used in this study for the period from 2002 to 2022. Using the mass balance approach, the monthly TWS anomalies are the sum of the masses of water contained in various terrestrial reservoirs (Ouatiki et al., 2022; Shen et al., 2015) as follows:
Where:
• TWS – Total water storage.
• SWB – Surface water (rivers, lakes, reservoirs).
• SWE – Snow water equivalent.
• SM – Soil moisture.
• Ca – Canopy water storage.
• GWS – Groundwater storage.
In semi-arid or arid regions, we can consider that changes in TWS are close to changes GWS (Zhong et al., 2021b):
2.2.2 Precipitation (GPM 10 km)
Global Precipitation Measurement (GPM) is an international mission providing rain and snow observations every three hours. The Integrated Multi-satellite Retrievals for GPM (IMERG) algorithm combines data from all passive microwave sensors using the 2017 Goddard Profiling Algorithm, with estimates gridded at 0.1° × 0.1° (~10 × 10 km). Adjustments against the GPM Combined Ku Radar-Radiometer Algorithm (CORRA) and the GPCP Satellite-Gauge product correct known biases. The final product offers half-hourly and monthly precipitation estimates and is available at https://disc.gsfc.nasa.gov/datasets/GPM_3IMERGM_06/summary.
2.2.3 Normalized difference vegetation index NDVI (MODIS 1 km)
The Terra MODIS Vegetation Indices 16-Day (MOD13A2) Version 6.1 product provides NDVI at 1 km resolution (Yin et al., 2020). Serving as a continuity index with NOAA-AVHRR derived NDVI (Ma et al., 2022), it selects the best pixel from each 16-day period based on low cloud cover, optimal view angles, and maximum NDVI values. This dataset is accessible at https://developers.google.com/earth-engine/datasets/catalog/MODIS_006_MOD13A2.
2.2.4 Soil surface temperature LST (MODIS 1 km)
The Terra MODIS Land Surface Temperature/Emissivity 8-Day (MOD11A2) Version 6.1 product provides average LST and emissivity over 8-day periods at 1 km resolution (Rousta et al., 2021; Kafy et al., 2021; Tariq and Shu, 2020). Each pixel represents an average of MOD11A1 LST values, with accompanying quality control metrics and observation details. Annual and monthly averages are derived once all data are acquired, and the product is available at https://developers.google.com/earth-engine/datasets/catalog/MODIS_006_MOD11A2.
2.2.5 Evapotranspiration ET (MODIS 500 m)
The MOD16A2 Version 6.1 product offers evapotranspiration and latent heat flux data over 8-day periods at 500 m resolution. Based on the Penman-Monteith equation, it integrates daily reanalysis meteorological data with MODIS sensor observations (Guerschman et al., 2022; Chao et al., 2021). ET and potential ET represent the eight-day sum, while latent heat flux is averaged; note that the final period of each year may cover only 5–6 days (Knipper et al., 2017; Kim, 2009). Data are available at https://developers.google.com/earth-engine/datasets/catalog/MODIS_061_MOD16A2.
2.2.6 Digital elevation model DEM (SRTM 30 m)
The digital elevation data from the Shuttle Radar Topography Mission (Farr et al., 2007) is the result of an international research effort that produced nearly global elevation models. This SRTM V3 (SRTM Plus) product is provided by NASA JPL with a resolution of 1 arc second (approximately 30 m) (Magruder et al., 2021).
This dataset underwent a void-filling process using open-source data (ASTER GDEM2, GMTED2010, and NED), unlike other versions that contain voids or were filled with commercial sources (Mudd, 2020). This product was accessed from: https://developers.google.com/earth-engine/datasets/catalog/USGS_SRTMGL1_003.
2.2.7 Normalized difference snow index NDSI (MODIS 500 m)
The MOD10A1 V6.1 Snow Cover Daily Global product provides daily snow cover, albedo, fractional cover, and quality assessments at 500 m resolution. It utilizes the Normalized Difference Snow Index (NDSI) along with additional criteria (Wang et al., 2020) and is key for disaggregating GRACE data by detecting snow patterns (Singh et al., 2022). Although snow impact is minimal in this study due to limited snow-covered areas (Winkler et al., 2021; Dong and Menzel, 2020), integrating NDSI can enhance model accuracy in targeted regions. The product is available at https://developers.google.com/earth-engine/datasets/catalog/MODIS_061_MOD10A1.
3 Downscaling method using random forest
Statistical downscaling, particularly employing the Random Forest (RF) algorithm, has emerged as a widely preferred technique for downscaling GRACE data due to its computational efficiency, simplicity, and broad applicability (Mohtaram and Shafizadeh-Moghadam, 2025; Kalu et al., 2024; Agarwal et al., 2024; Shi et al., 2024; Arshad et al., 2024; Tian et al., 2024; Cui et al., 2024; Zhong et al., 2025). The RF algorithm (Breiman, 2001) operates by constructing multiple decision trees, where each tree is trained on a bootstrapped sample of the original dataset, introducing randomness through both sample selection and feature subset optimization at each split. These individual trees function independently, making predictions based on their unique subset of training data and features, while the final prediction is determined through majority voting for classification tasks or averaging for regression problems. The ensemble nature of Random Forest, combined with its bootstrapping mechanism and random feature selection, effectively mitigates overfitting and enhances model generalization, making it particularly robust for handling complex, nonlinear relationships in geospatial data. Moreover, its robustness and effectiveness in capturing complex nonlinear relationships make it the preferred method for regional-scale GRACE downscaling applications (Wang et al., 2024).
The downscaling methodology employed in this study, consists of several sequential steps. Initially, six hydrological variables covering the period from 2006 to 2022 are resampled to 1° spatial resolution. This involves aggregating the 1 km resolution data of NDVI (MODIS), NDSI (MODIS), mean land surface temperature (MODIS), elevation (SRTM), and precipitation (GPM) through pixel averaging. Given the arid environmental conditions of the study area, we make the assumption that total water storage (TWS) is approximately equal to groundwater storage (GWS), as other water storage components are minimal in such environments (Figure 2).
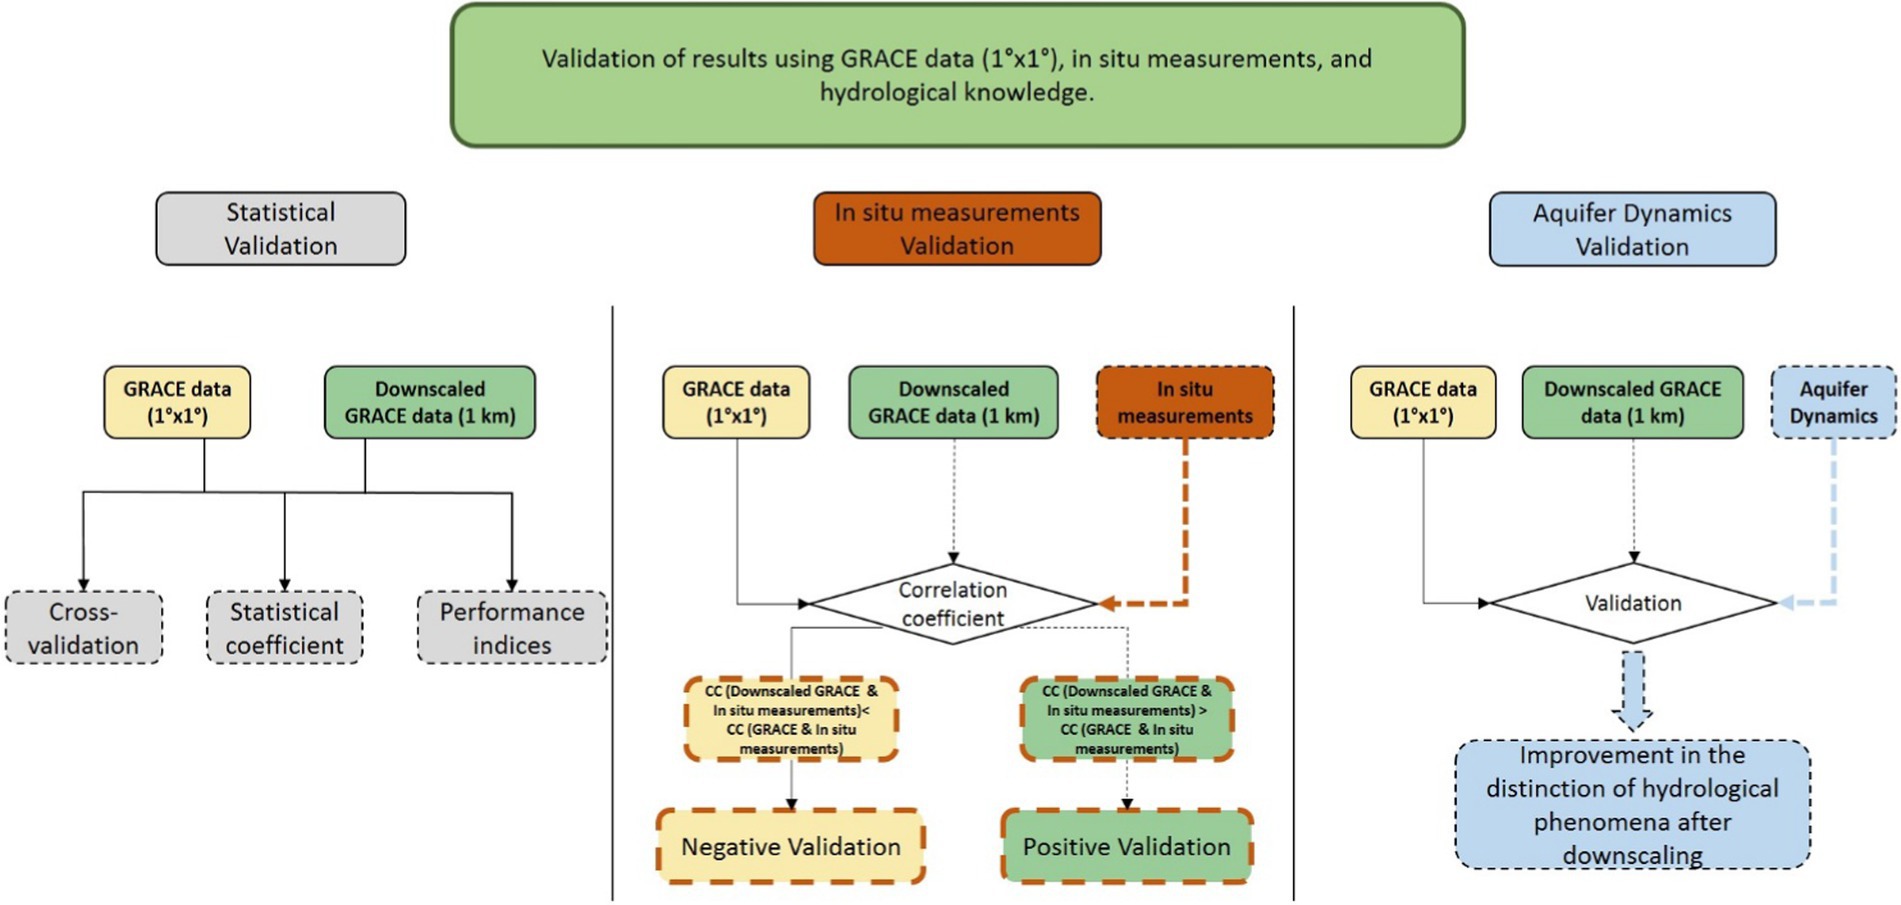
Figure 3. Flowchart of the validation method.
Following the initial resampling, a random forest model is established to capture the relationship between TWS and the five environmental variables at 1° spatial resolution. The next step involves calculating the residual distribution of TWS at 1° resolution by subtracting the random forest model simulated TWS from the GRACE-derived TWS data. These residuals are then interpolated to 1 km resolution using a radial basis function interpolation method, which is particularly well-suited for smooth interpolation of scattered data points.
The third phase applies the established random forest model with a total number of estimators set at 100 to the environmental variables at their original 1 km resolution to obtain estimated TWS at this finer scale. The downscaled TWS estimates are then refined by adding the previously interpolated residuals at 1 km resolution, resulting in the final monthly TWS dataset with 1 km spatial resolution. This residual correction step helps preserve the mass conservation property of the original GRACE observations while incorporating the spatial details captured by the higher-resolution environmental variables. As previously mentioned, due to the arid nature of the study region and the assumption that TWS approximately equals GWS, the final 1 km resolution GWS estimates are obtained directly from the downscaled TWS values. These results are then validated against measured water level data to assess the accuracy of the downscaling procedure.
4 Validation method
4.1 Statistical validation
The statistical validation methodology combines direct statistical comparison between original and disaggregated GRACE data (Zhang et al., 2021; Pulla et al., 2023) with rigorous 5-fold cross-validation. The first approach employs performance indices (RMSE, MAE, NSE) to quantify discrepancies between GRACE observations (100 km) and downscaled outputs (1 km) (Chen et al., 2019; Gonçalvès et al., 2021), while correlation coefficients (CC) and determination coefficients (R2) assess dynamic consistency in trends and fluctuations (Karunakalage et al., 2021a; Ning et al., 2014). To enhance robustness, we implemented comprehensive 5-fold cross-validation where the dataset was partitioned into five subsets, with the model trained on four folds (80%) and tested on the remaining fold (20%) across all pixels and time steps. This process was repeated five times with rotationally assigned test folds, generating monthly performance metrics (R2, MAE, RMSE) that collectively evaluate the model’s temporal stability and spatial generalization capability. The validation framework additionally incorporates statistical significance tests (Student’s t-test, Fisher’s F-test) (Rafik et al., 2023; Yin et al., 2018; Abbaspour, 2013) and the Nash-Sutcliffe efficiency coefficient (NSE) to provide a multi-dimensional assessment of downscaling performance, ensuring both methodological rigor and physical consistency with original GRACE data dynamics.
The correlation coefficient indicates the degree of linear relationship between two variables. The value of CC measures the extent of correlation between different datasets. The higher the value of CC, the stronger the degree of correlation.
Where Xi and Yi represent two independent datasets with the mean values of X and Y. Xi represents the total input water storage, Yi represents the simulated value from the RF model, and N is the total number of samples.
The coefficient of determination, often denoted as R2, is a crucial statistical measure used to evaluate the quality of a model’s fit to observed data. In the context of statistical downscaling of GRACE data, it plays a fundamental role in validating the models developed to estimate spatial and temporal variations in gravity data. Several articles highlight the importance of this coefficient in assessing the accuracy of downscaling models, particularly when applied to complex, high-resolution spatial data such as that from GRACE. By using the coefficient of determination, researchers can quantify the extent to which the models are capable of reproducing the variability observed in GRACE data, thereby providing critical validation for the accuracy and reliability of downscaling results.
The Mean Absolute Error (MAE) is the average absolute deviation of all simulated values from the arithmetic mean, which helps avoid the issue of cancelation of errors and accurately reflects the actual prediction error.
The Root Mean Squared Error (RMSE), also known as the standard error, is the difference between the actual value and the model’s predicted value. The smaller the RMSE, the closer the predicted value is to the actual value, indicating higher model accuracy.
The Nash-Sutcliffe Efficiency (NSE) coefficient is a measure of the predictive quality of a hydrological model. It is used to assess the model’s ability to reproduce observed downstream flow values. Specifically, the NSE measures the similarity between observed and predicted flow values, normalized by the variance of the observations. The closer the NSE is to 1, the better the model’s predictions are.
The formula to calculate the Nash-Sutcliffe Efficiency (NSE) is as follows:
It is important to note that the Nash-Sutcliffe Efficiency (NSE) does not account for modeling errors or systematic biases in the model’s input data. Therefore, it should not be used alone to evaluate a model’s quality. However, it can be used in conjunction with other performance measures to provide a more comprehensive assessment of a model’s predictive accuracy.
The t-test is commonly used to evaluate the significance of the correlation between two datasets. The process begins by formulating the hypothesis and calculating the correlation coefficient (R) for the time series. Next, the degrees of freedom (v) are calculated using the formula v=n − 2, where n is the total number of data points in the time series. Afterward, the critical value is obtained from a t-distribution table based on the degrees of freedom. The significance level α is typically set at either 0.05 (5%) or 0.01 (1%). The final step involves comparing the calculated correlation coefficient with the critical value. If ∣R∣ is less than R0.05, it indicates that the correlation is not significant. If R0.05 ≤ ∣R∣ < R0.01, the correlation is considered significant at the 0.05 level. Finally, if ∣R∣ is greater than or equal to R0.01, the correlation is deemed significant at the 0.01 level. This method helps assess whether the observed correlation is statistically significant at different confidence levels (Sahour et al., 2020).
The F-test is used to compare the variances of two or more datasets to determine if they differ significantly (Sahour et al., 2020). First, the test hypothesis is constructed, and the F statistic is calculated based on the variances of the groups being compared. Next, the degrees of freedom (df) for both the numerator and the denominator are determined, with df1 = n1-1 for the first group and df2 = n2-1 for the second group, where n1 and n2 are the number of observations in each group. Once the degrees of freedom are established, the F critical values are obtained from the F distribution table, typically using a significance level of 0.05 (5%) or 0.01 (1%). Finally, the F statistic is compared to the F critical value, yielding three possible outcomes: if the calculated F statistic is less than the F critical value, the variances are not significantly different; if the calculated F statistic is between the critical values at different significance levels, the variances are significantly different; and if the F statistic exceeds the F critical value, the variances are significantly different at the specified level.
4.2 Validation using in situ groundwater level data
Validation can also rely on field data, particularly piezometric data (Chen et al., 2019; Gonçalvès et al., 2021): Field data validation, considered the second part of the validation process, is crucial (Miro and Famiglietti, 2018; Pascal, 2022; Karunakalage et al., 2021a; Karunakalage et al., 2021b). Its significance lies in its ability to assess how closely the downscaling aligns with reality (Zhang et al., 2021). Indeed, piezometric data represent ground reality (Foroumandi et al., 2023; Chen et al., 2019). Several articles use this method as an essential validation step (Jyolsna et al., 2021; Seyoum et al., 2019). The usual procedure involves comparing statistical coefficients before and after the downscaling of GRACE data, such as correlation and the coefficient of determination (Zhang et al., 2021; Ning et al., 2014). A validation is considered positive if these coefficients increase after downscaling, indicating a better approximation of reality (Zhang et al., 2021; Ning et al., 2014).
In this study, the downscaling of GRACE TWS were validated using groundwater level data, a method that has already been successfully employed in arid and semi-arid regions such as Morocco (Rafik et al., 2023; Arshad et al., 2022; Zhong et al., 2021b; Agarwal et al., 2023). Since TWS primarily comprises GWS (Equations 1, 2) (groundwater storage) and Morocco is a semi-arid and arid area, other components like soil moisture, surface water, and snow can be disregarded, thus focusing mainly on GWS [Ouatiki et al. (2022); Ahmed et al. (2021); Rafik et al. (2023)]. Groundwater level data are therefore suitable for this field validation. A network of 139 wells distributed across the central semi-arid and arid areas regions of Morocco were used (Table 1).
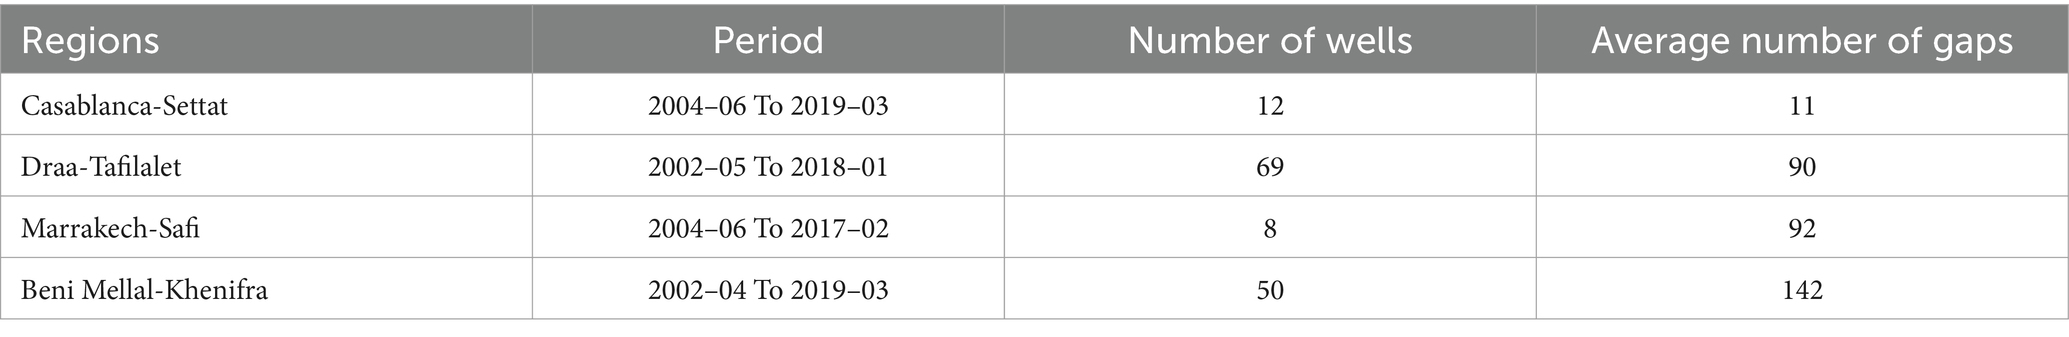
Table 1. Number of wells and measurement periods by region, with average data gaps per well.
Before calculating correlation and determination coefficients, it was essential to preprocess the data. Outliers using the Z-Score method were initially identified and corrected, which detects data points significantly deviating from the mean. This step is crucial for maintaining data integrity (Oussou et al., 2022; Hamdi, 2023; Dembélé, 2020). Once the outliers were addressed, a linear interpolation was applied to estimate missing values based on available data. This method, also used by Gonçalvès et al. (2021) and Zuo et al. (2021) smooths time series and enhances data continuity, which is vital for accurate analyses. In situ groundwater level data were also adjusted by standardizing them to ensure consistency across different measurement sites and time periods, minimizing any local biases or discrepancies. This standardization process improved the comparability of the data and enhanced the robustness of the analysis. Additionally, the impact of these adjustments was evaluated to ensure that the integrity of the original data was maintained while enabling more accurate interpretation of spatial and temporal groundwater trends (Ouatiki et al., 2022; Ahmed et al., 2021).
4.3 Validation using known aquifer dynamics
Validation based on the identification of known aquifer dynamics plays a crucial role in ensuring that the downscaled data reflect real-world conditions accurately (Sahour et al., 2020; Vishwakarma et al., 2021). At the coarse resolution of 100 km, many localized groundwater trends are difficult to detect. Downscaling to 1 km enhances the representation of these trends, particularly in regions experiencing recurrent drought and overexploitation. Therefore, the validation approach focused on assessing whether the downscaled GRACE data captured the dynamics of key aquifers accurately. This was achieved by analyzing trends in 66 aquifers across Morocco from 2002 to 2022, using their spatial delineation to isolate the variations in both the original and downscaled GRACE TWS data. The validation focused on assessing whether the downscaled GRACE TWS data captured the well-documented patterns of water resources decline and response to drought conditions observed in previous studies (Hssaisoune et al., 2020). Successful validation was determined by the model’s ability to reflect these known trends, thereby providing a clearer understanding of water resources dynamics at the local scale—something not possible with the original 100 km GRACE data, as many aquifers are smaller than a single coarse-resolution pixel.
5 Results and discussion
5.1 GRACE data downscaling results
Figure 4 shows the original GRACE TWS data at 100 km resolution and GRACE data at 1 km after downscaling in September 2002, September 2012, and September 2021; dates that correspond to the beginning of the wet season in Morocco (Knippertz et al., 2003). After downscaling, it is now possible to distinguish an East–West gradient, in addition to variations between different areas of Morocco. The downscaling results on the three dates have enabled us to identify distinct hydrological and geological features across the country. The northern limestone ridge has been differentiated from the rest of the Rif relief. The Middle Atlas (MA), High Atlas (HA), and Anti-Atlas (AA) mountain ranges are now distinguishable from each other. The Western Meseta (WM) is clearly distinct from the Eastern Meseta (EM) and the plains to the east of the Atlas mountain ranges.
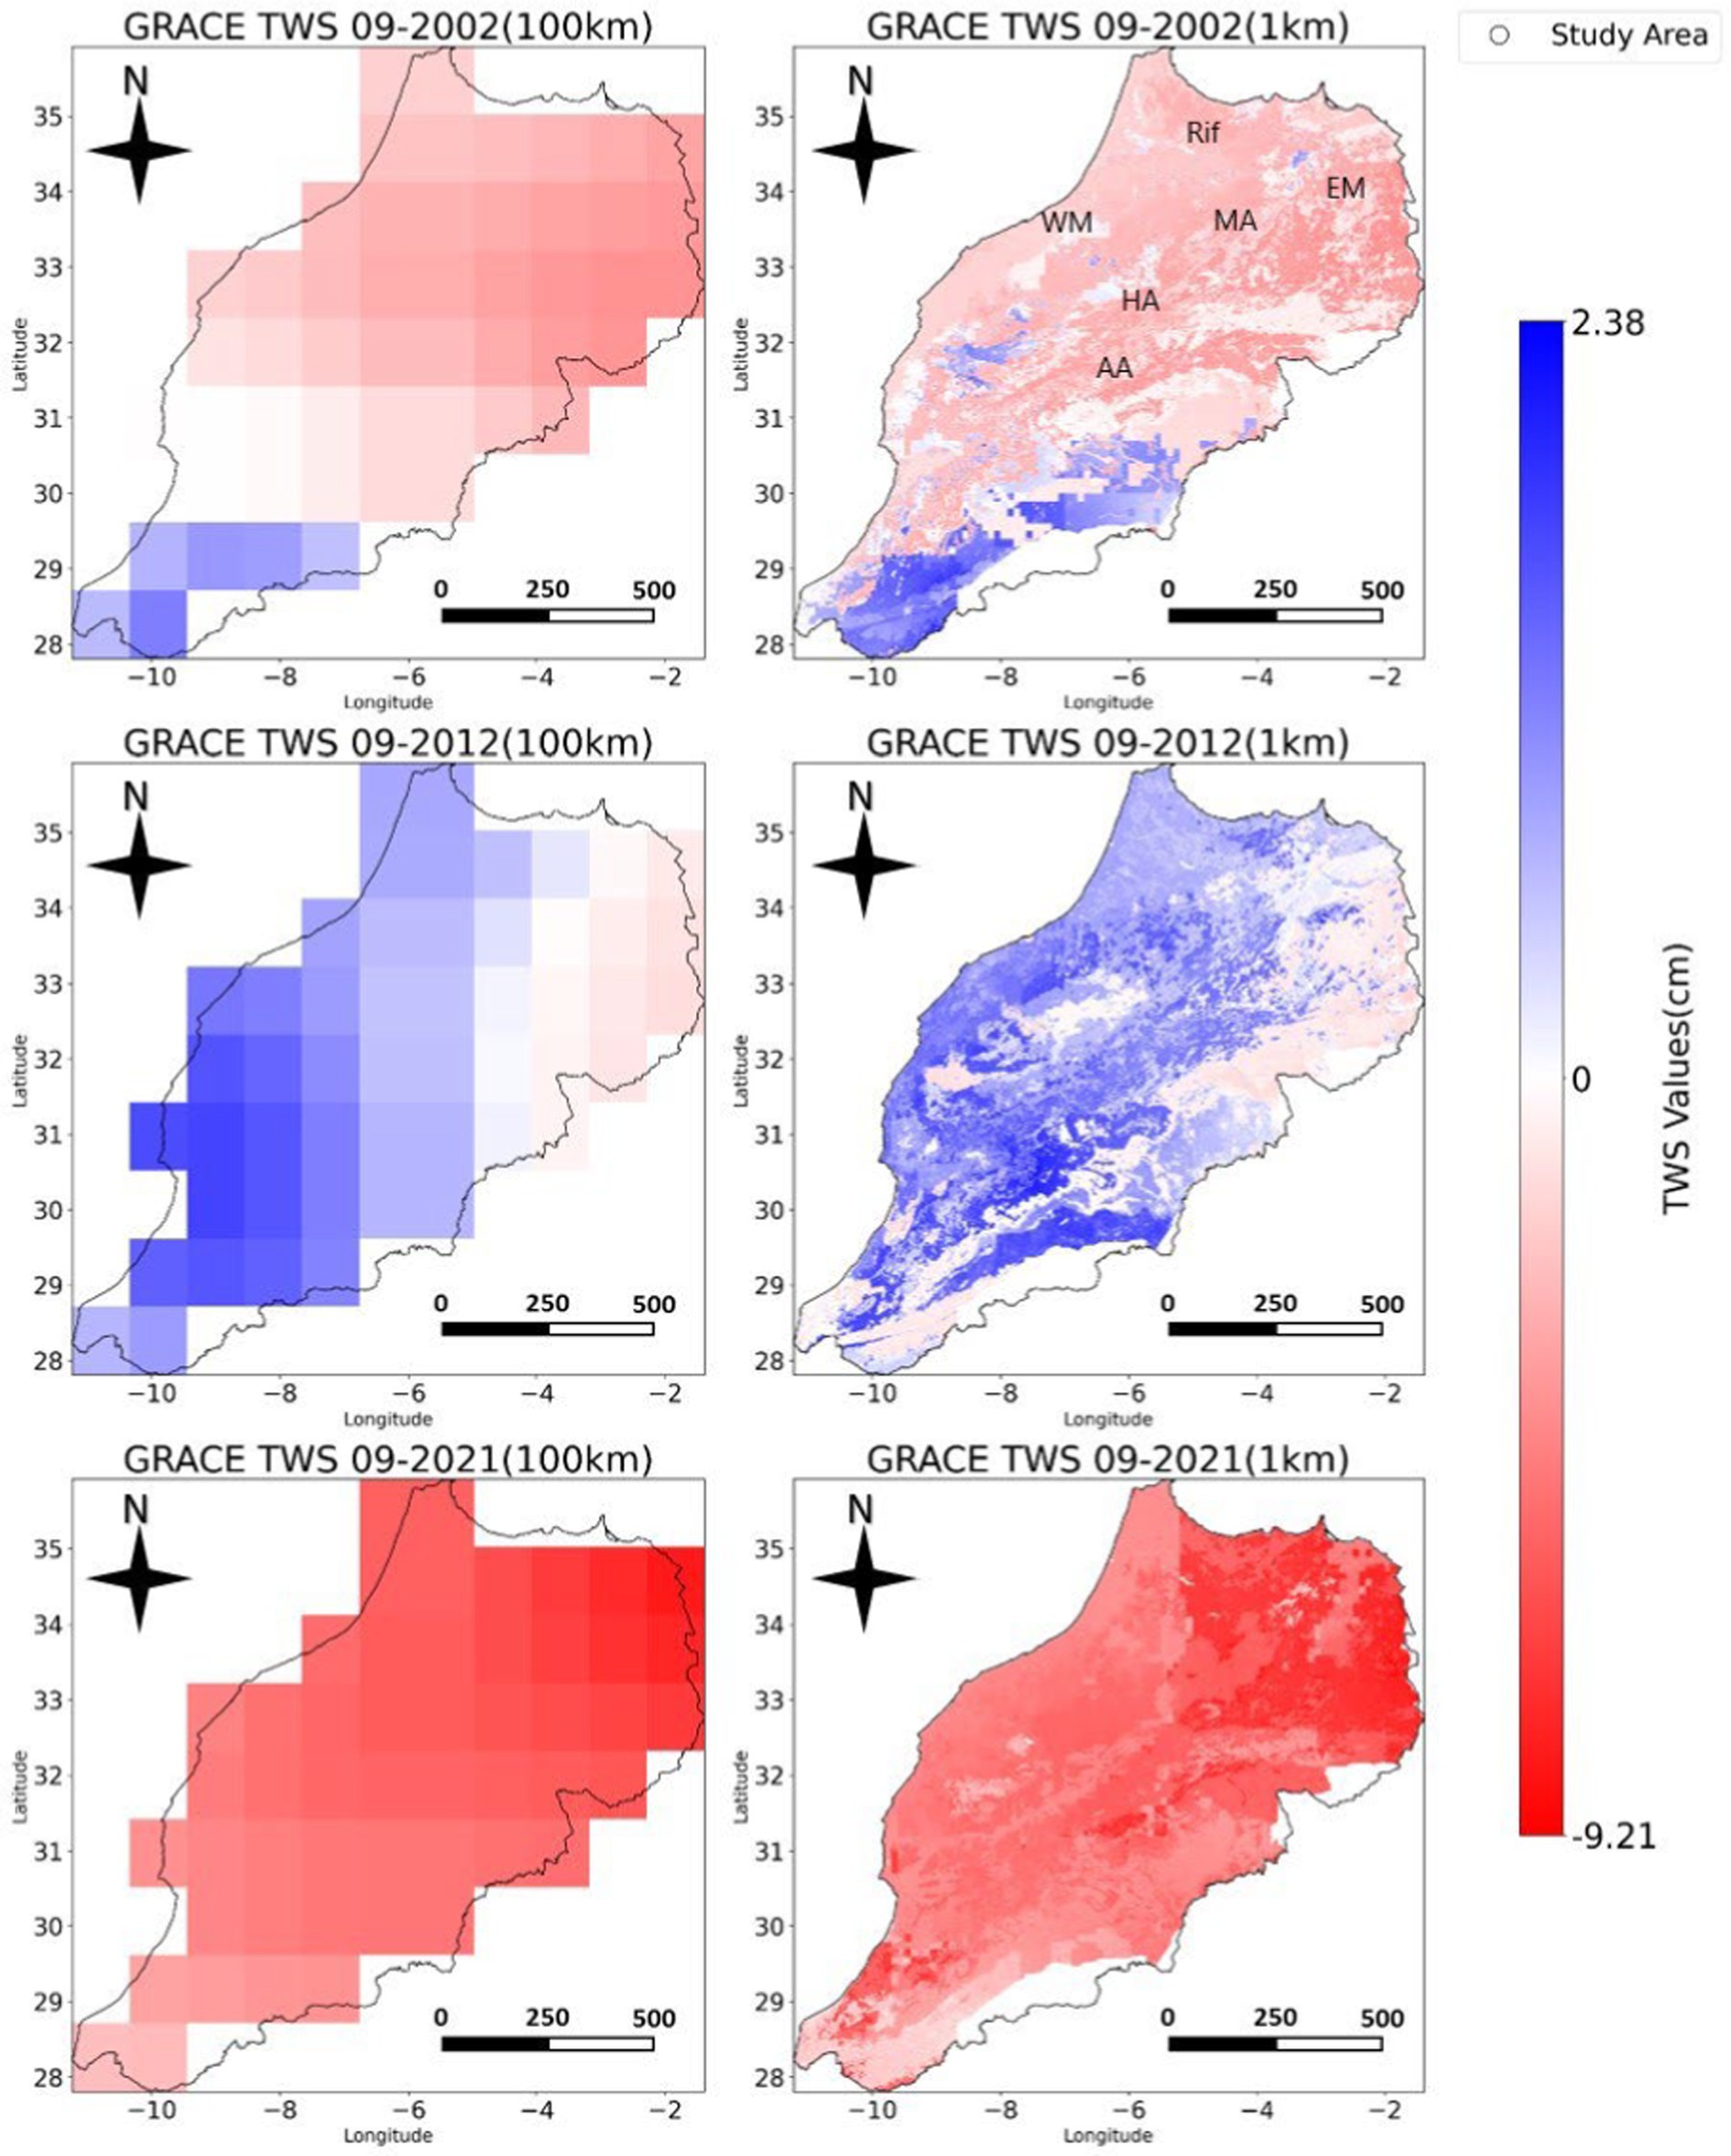
Figure 4. Examples of GRACE TWS anomalies data and Their Downscaling over northern Morocco (09–2002, 09–2012, 09–2021). With MA, HA, AA, WM and EM, representing, respectively, Middle Atlas, High Atlas, Anti Atlas, Western Meseta and Eastern Meseta.
In September 2002, the downscaled GRACE data at 1 km resolution reveals significant distinctions that are not visible in the original 100 km data. This enhanced resolution allows for a more detailed detection of spatial variations (Figure 4a). Notably, positive TWS anomalies emerge in areas that previously appeared uniformly negative in the coarser GRACE images. These positive anomalies are particularly evident in the southwest of the High Atlas, the south of the Middle Atlas, and parts of the eastern Rif Mountains. These variations reflect greater precipitation in these regions during this period (Driouech, 2010; Ouhamdouch et al., 2018).
In September 2012, the 100 km GRACE data predominantly shows positive TWS values, with the exception of the Eastern Meseta (Figure 4b). However, the downscaled data reveals more detailed spatial variation in these positive anomalies. Positive TWS values extend further eastward, particularly over the reliefs of the Atlas Mountains intersecting the Eastern Meseta. The positive anomalies over the Middle Atlas and High Atlas are even more pronounced, with extreme positive values precisely identified in the southern High Atlas, the central Anti-Atlas, and their southern foothills. These positive TWS anomalies are likely attributed to the rainy period Morocco experienced between 2008 and 2015, which significantly contributed to the recharge of aquifers and reservoirs (Ahmed et al., 2021; Jasechko et al., 2024).
By September 2021, Morocco’s drought had reached its peak (Hamid et al., 2024), a situation reflected in the predominance of negative TWS values in both the 100 km and downscaled GRACE data (Figure 4c). However, the downscaled data provides clearer spatial variations in these negative anomalies, highlighting areas with more severe depletion. In particular, the eastern regions of the Rif, the Eastern Meseta, and the Anti-Atlas Mountains show the most negative TWS values. These regions have already been identified as among the hardest hit by drought and water resource scarcity in Morocco (Touchan et al., 2011; Zkhiri et al., 2019; Gouahi et al., 2023; Hachem et al., 2023; El-Yazidi et al., 2024).
Therefore, downscaling GRACE data enables the identification of regions most affected by drought and total water storage depletion. This approach also captures the multi-annual progression of drought impacts. The downscaled data from 2002 reveal early signs of drought onset, while the 2012 data reflect a transitional period influenced by intermittent rainy years. By 2021, the data show a marked decline in water storage, highlighting the severe consequences of the prolonged drought. These insights emphasize the importance of high-resolution analysis for understanding and managing Morocco’s water resources under increasing climatic stress.
Figure 5 shows the trend in total water storage (TWS) in Morocco from 2002 to 2022, analyzed using the Theil-Sen method at 100 km and 1 km resolutions. The 100 km GRACE data (Figure 5a) and the downscaled 1 km GRACE data (Figure 5b) show a predominance of negative trends in TWS. However, the 1 km resolution data provides a more detailed view, revealing finer spatial variations and highlighting regional differences in trends in water storage changes (Figure 5b). The most significant negative trends, ranging from −0.23 cm/year to −0.17 cm/year, are concentrated in the extreme northeast, particularly to the east of the Eastern Meseta and its surrounding regions (Figure 5b). Trends between −0.17 cm/year and −0.11 cm/year are primarily observed in the Rif Mountains and the higher elevations of the Middle Atlas, High Atlas, and Anti-Atlas (Figure 5b). Negative trends ranging from −0.11 cm/year to −0.05 cm/year dominate the low-relief areas, the coastal Atlantic regions, and the plains in the eastern parts of the study area (Figure 5b).
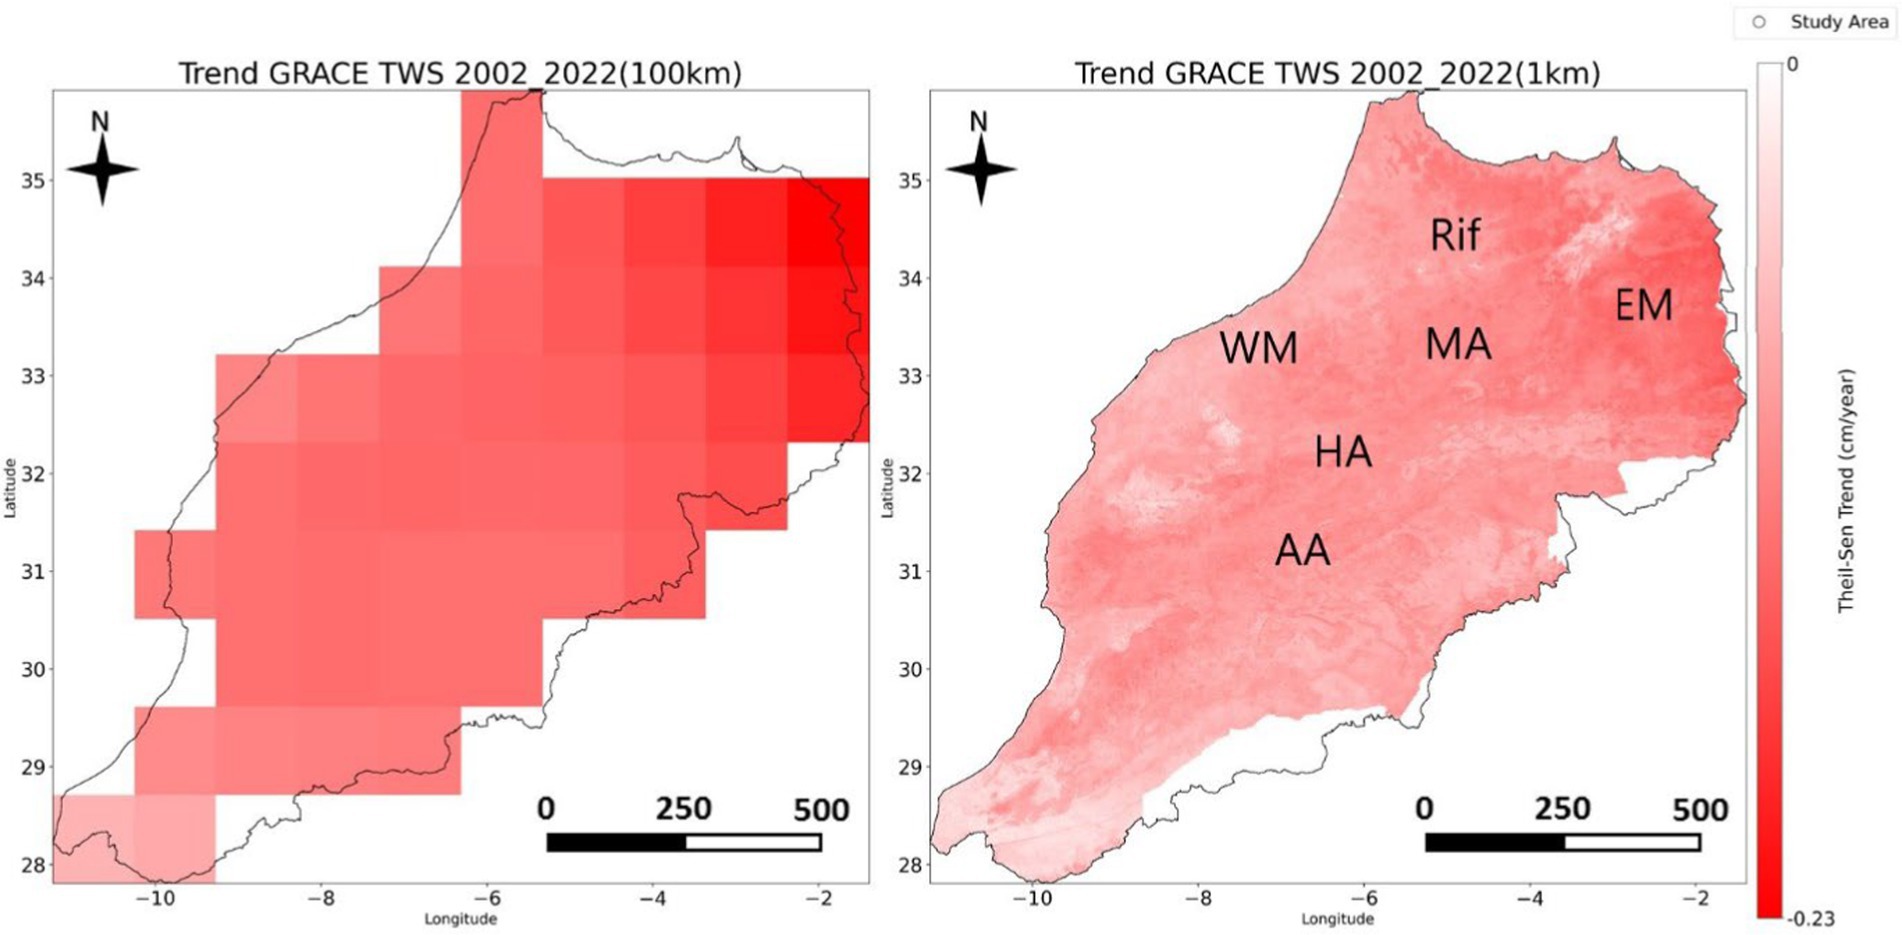
Figure 5. Trend of GRACE TWS anomalies data and their downscaling in northern Morocco from 2002 to 2022 using the Theil-Sen Method.
The negative trends in Total Water Storage (TWS) observed in the GRACE data underscore the critical state of water resources in Morocco, particularly in the study area, which supports the majority of the country’s agricultural, industrial, and economic activities. These negative trends highlight the profound impact of climate change, drought, and over-exploitation on the country’s water reserves, a situation that has been widely observed and documented in recent studies (Gouahi et al., 2023; Hamid et al., 2024; El-Yazidi et al., 2024).
The feature importance results (Figure 6), derived from Gini index, highlight key drivers influencing the downscaling of GRACE TWS data from 100 km to 1 km in Morocco (Al-Abadi et al., 2024). NDVI (0.29) emerged as the most important variable for TWS downscaling, effectively capturing groundwater dynamics in Morocco’s arid/semi-arid context where vegetation serves as a sensitive indicator of water availability, particularly in groundwater-dependent agricultural areas (Ndehedehe et al., 2019; Xie et al., 2019). Precipitation (0.22) ranked second, reflecting its crucial role as the primary recharge source, with declining rainfall since 2018 exacerbating water stress and groundwater dependence (Ait Dhmane et al., 2024). The equal importance of temperature and elevation (both at 0.19) reflects their combined control on water availability. In Morocco, temperature varies with altitude, with documented increases in both minimum and maximum temperatures depending on elevation (Qadem and Tayfur, 2024). Higher temperatures—particularly at lower elevations—amplify evapotranspiration and agricultural water demand, directly depleting surface and groundwater reserves and reducing TWS. The model appropriately assigned lower weights to evapotranspiration (0.09) and NDSI (0.02), consistent with Morocco’s rainfall-dominated hydrology and limited snowmelt contributions. These, feature importance results demonstrate that the Random Forest model successfully captured Morocco’s key hydrological constraints (Drought, irrigation, overexploitation) when downscaling GRACE TWS data from 100 km to 1 km resolution.
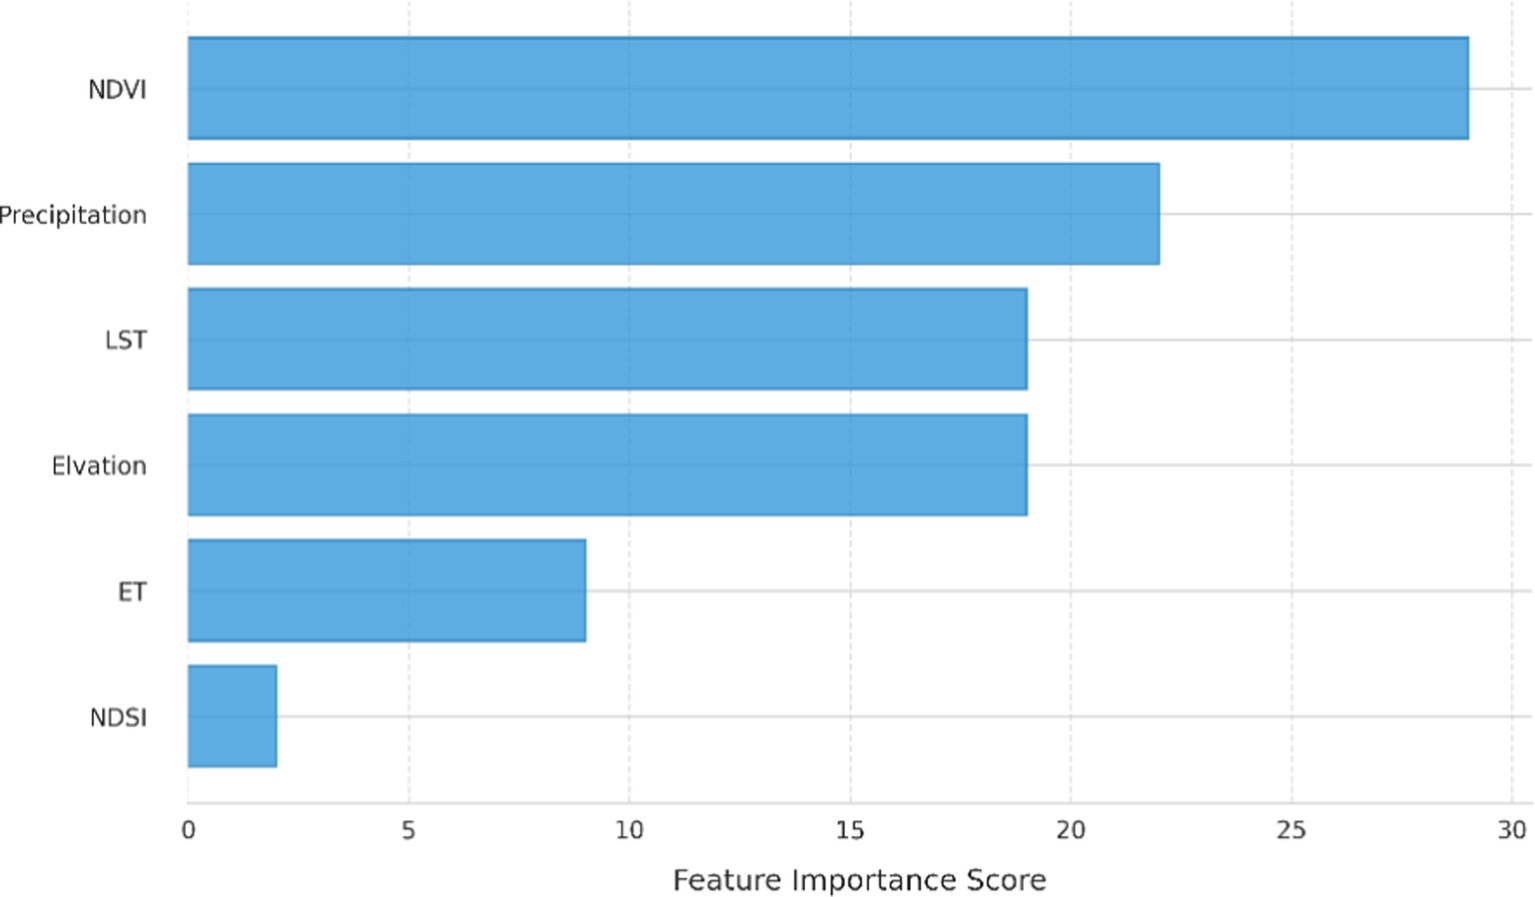
Figure 6. Variable importance ranking from the random forest downscaling model (Gini index).
5.2 Validation of GRACE downscaling
5.2.1 Statistical validation
Figure 7 presents a scatter plot comparing GRACE data at 100 km and 1 km resolutions across the study area, with a linear regression line illustrating their alignment (Figure 7b). To further assess the relationship between GRACE data at both resolutions on a watershed scale and validate the downscaling within more localized hydrological systems, similar scatter plots were created for the Loukkos (Figure 7c) and Bouregreg (Figure 7d) basins. This allows for a closer examination of regional water storage dynamics and the effectiveness of the downscaling approach. The scatter plot of the study area shows a strong alignment of points along the diagonal regression line, indicating a high correlation between TWS data at both resolutions. A similar trend is observed for the Loukkos and Bouregreg basins, though the alignment is less pronounced compared to the entire study area.
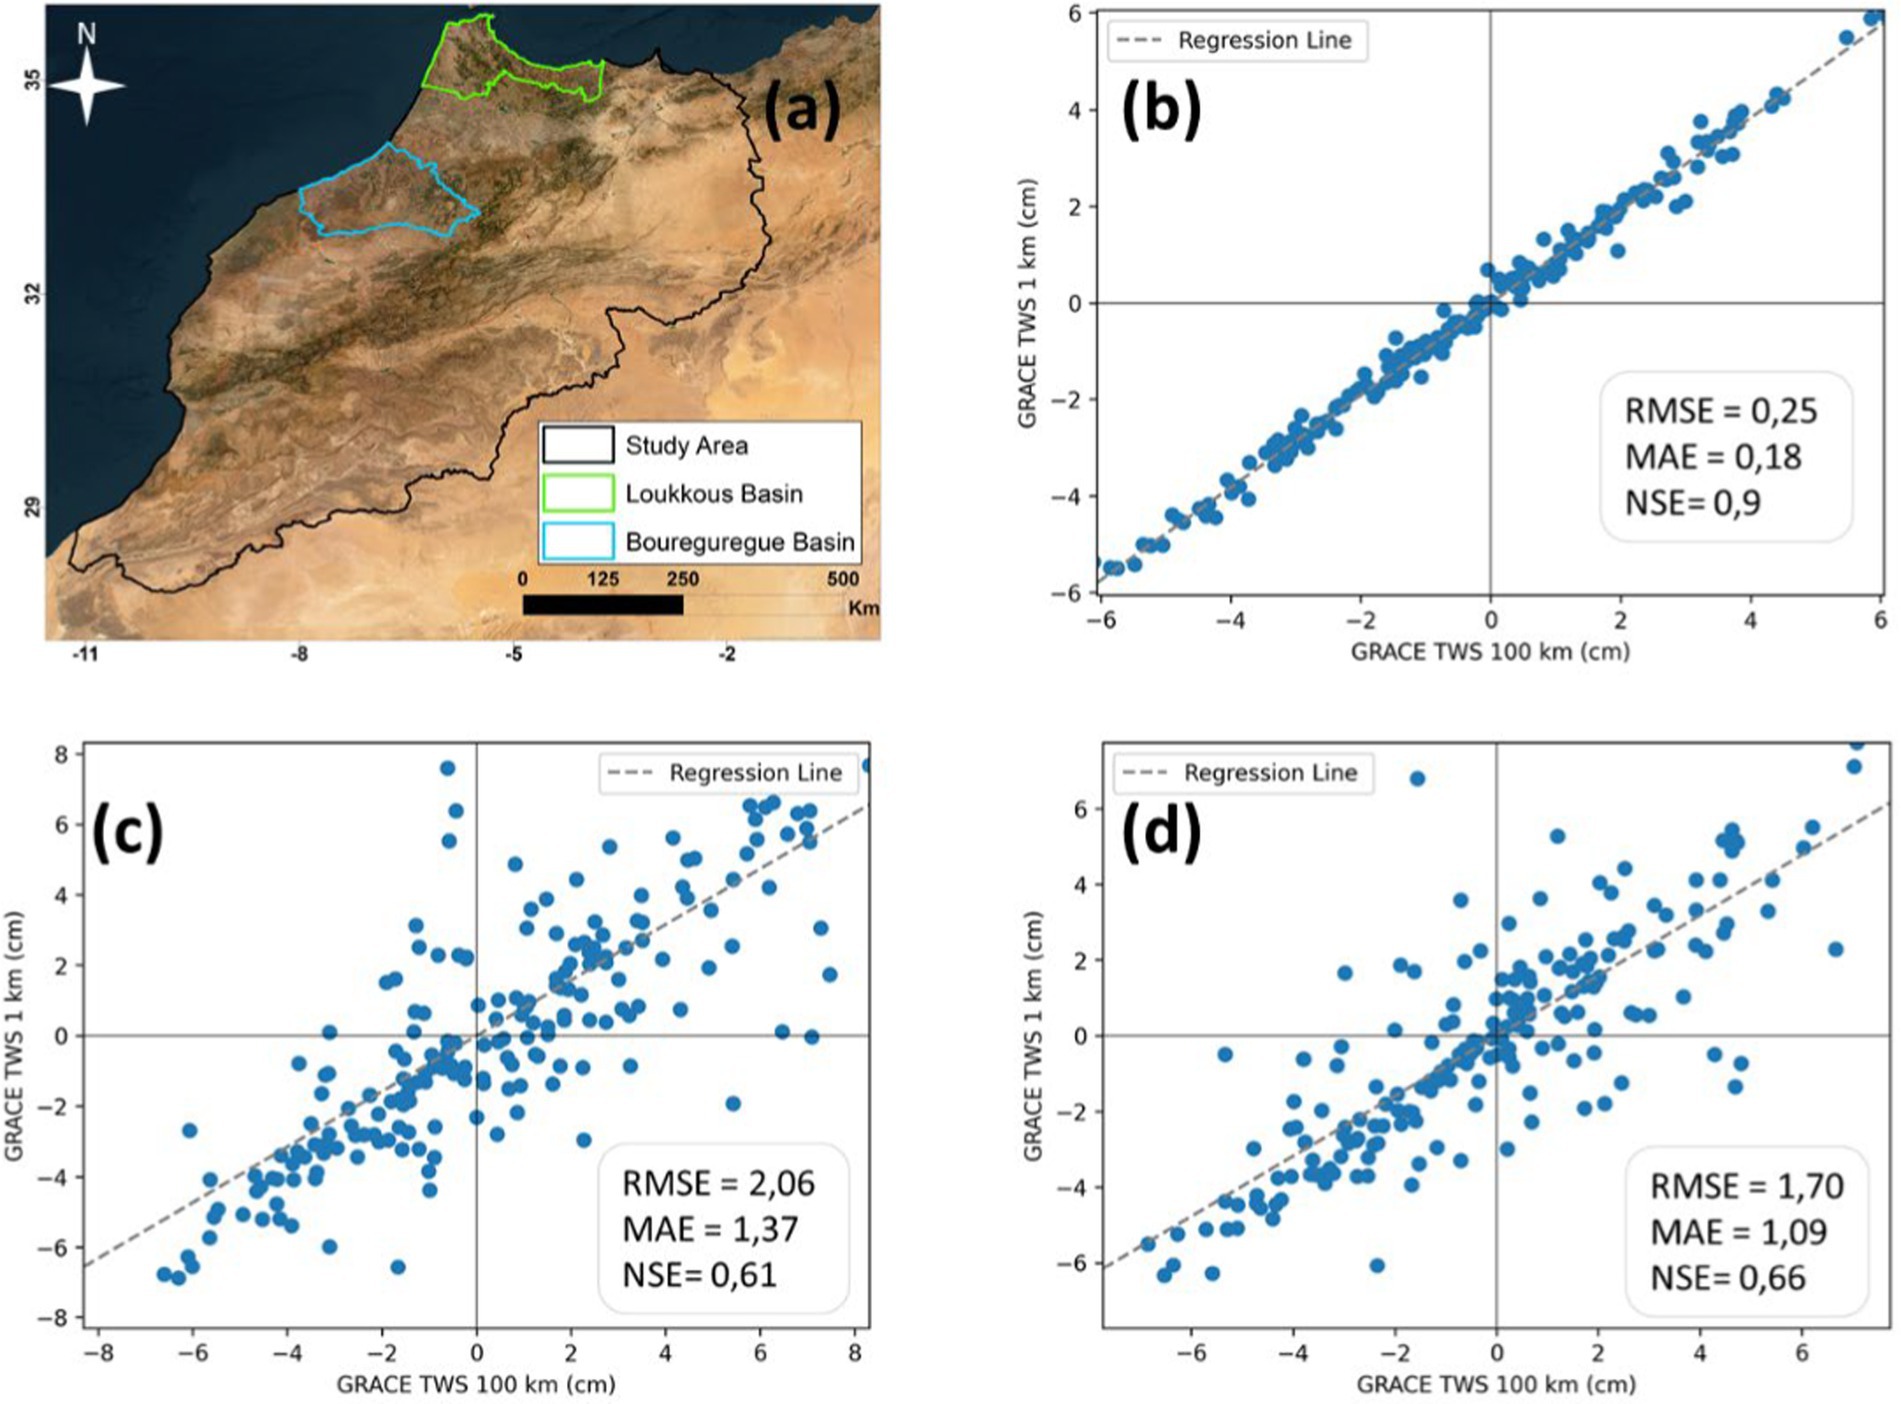
Figure 7. Scatter Plot of GRACE TWS Anomalies at 100 km and 1 km Resolutions: (a) Map of the study area with the delimitation of the Loukkos and Bouregreg basins; (b) Scatter plot of the study areas; (c) Scatter plot of Loukkos basin; (d) Scatter plot of Bouregreg basin.
The Nash-Sutcliffe Efficiency (NSE) index is commonly used to assess model performance, with a value above 0.5 generally indicating good performance (Seyoum et al., 2019; Jyolsna et al., 2021; Miro and Famiglietti, 2018). In this study, the NSE index for the overall study area is 0.90, which reflects a strong correlation and demonstrates that the downscaling model accurately reproduces TWS variations at finer scales (Figure 7). For the Loukkos and Bouregreg basins, the NSE values are 0.61 and 0.66, respectively, both exceeding the 0.5 threshold and confirming that the model performs satisfactorily in these localized hydrological systems as well (Figure 7).
The performance indices for the study area, with an RMSE of 0.25 cm and an MAE of 0.18 cm, validate the model’s good accuracy, as they fall within the acceptable error range of less than 10% of the mean actual values from GRACE 100 km data (Zhang et al., 2021; Zuo et al., 2021; He et al., 2021). In this study, the 10% threshold translates to RMSE and MAE limits of 0.28 cm and 0.21 cm, respectively. For the Loukkos basin, the RMSE is 2.06 cm and the MAE is 1.37 cm, while for the Bouregreg basin, the RMSE is 1.70 cm and the MAE is 1.09 cm. The corresponding 10% limits for these basins are RMSE = 2.12 cm and MAE = 1.39 cm for Loukkos, and RMSE = 2.00 cm and MAE = 1.12 cm for Bouregreg.
Th cross-validation results are presented in Figure 8. For each month, 5-fold cross-validation was employed by splitting the data into five folds. In each iteration, one fold was reserved for testing while the other four were used for training. The resulting performance metrics were then averaged to assess the downscaling. The R2 distribution, with an interquartile range (IQR) of 0.5 to 0.7, a mean value of 0.56 and a median of 0.64, indicates that the downscaled data generally maintain a strong correlation with the original dataset. While some months exhibit near-perfect alignment (maximum R2 = 0.89), a few outliers (minimum R2 = −0.67) suggest localized inconsistencies (Figure 8a). The MAE values, mostly ranging between 0.36 cm and 0.6 cm, with a mean value of 0.49 cm and a median of 0.46 cm, indicate that discrepancies between the downscaled and original GRACE-TWS data remain small (Figure 8b). Similarly, the RMSE values, with an IQR of 0.5 cm to 0.8 cm and a mean value of 0.74 cm a median of 0.69 cm, confirm the overall accuracy of the downscaling process (Figure 8c). Although some higher errors appear (outliers at 1.5 cm for MAE and 3 cm for RMSE), they are relatively rare, suggesting that the model effectively preserves temporal trends while improving spatial resolution.
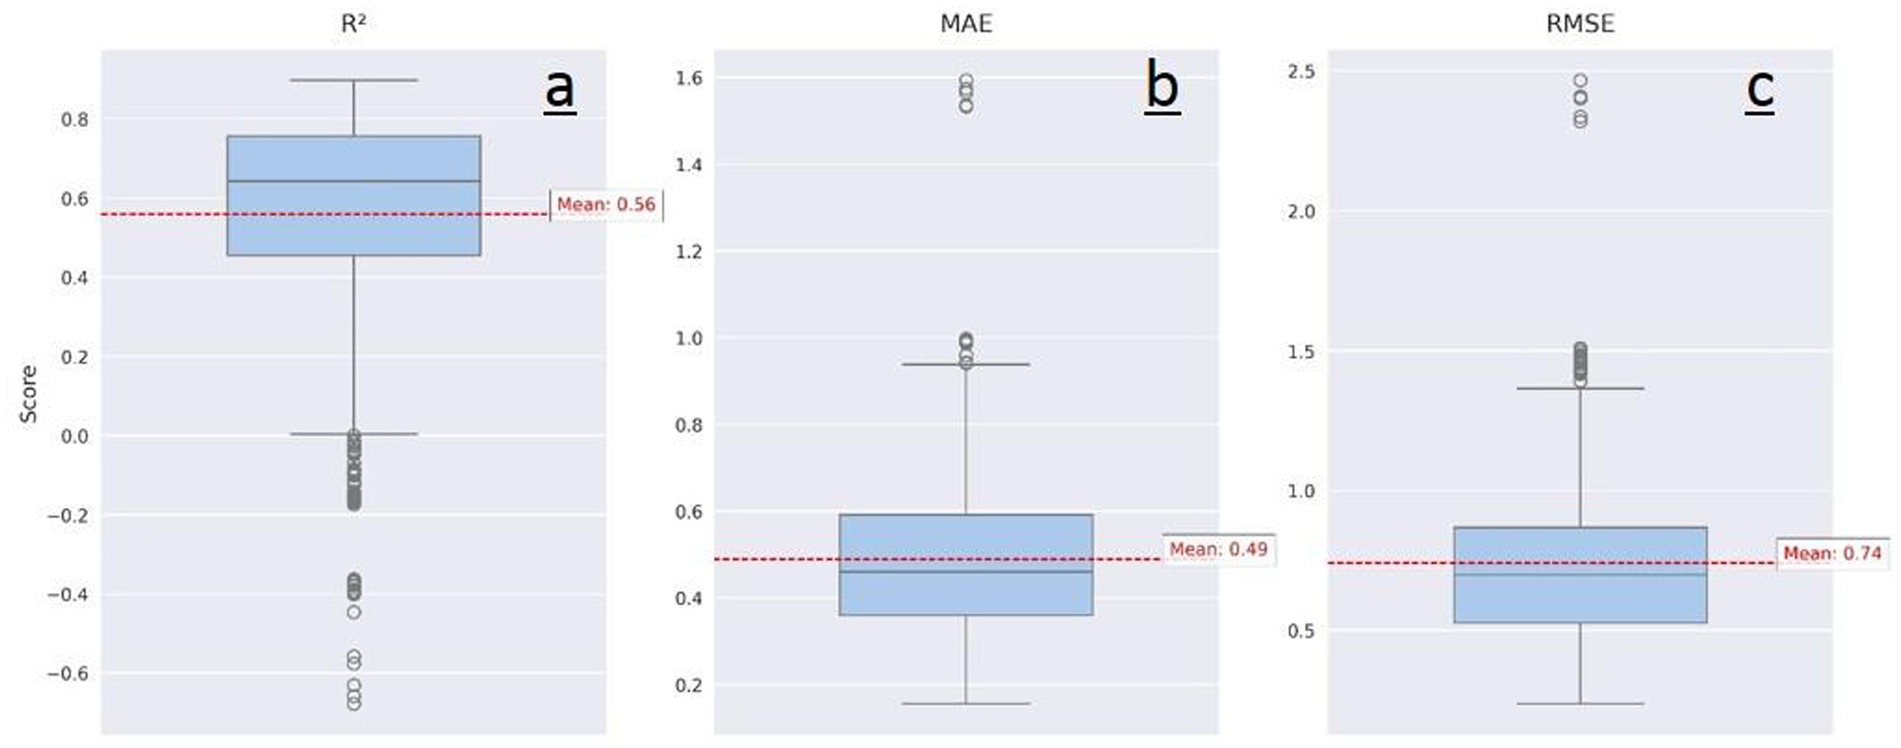
Figure 8. Box plots of cross-validation performance for GRACE-TWS downscaling, (a) R2, (b) MAE and (c) RMSE.
Overall, the model demonstrates reliable accuracy at both regional and local scales, with all performance indices falling within acceptable thresholds, further supporting the robustness of the downscaling approach. The scatter plots and performance indices further confirm the model’s ability to preserve temporal trends and spatial consistency when transitioning from 100 km to 1 km resolution (Ali et al., 2021; Ning et al., 2014; Chen et al., 2019; Zhang et al., 2021; Zuo et al., 2021). The cross-validation results reinforce this reliability, as the R2 values indicate a strong correlation between the downscaled and original GRACE-TWS data, while MAE and RMSE values remain low, suggesting minimal reconstruction errors. However, despite these promising results, the presence of outliers and localized discrepancies highlights areas for improvement, suggesting that further refinement of the downscaling methodology could enhance accuracy in regions with complex hydrological variability.
Figure 9 presents the time series of GRACE TWS data at 100 km and 1 km resolutions, along with their respective trends, for the study areas the Loukkos basin, and the Bouregreg basin. The correlation coefficient (CC), determination coefficient (R2), and p-value are shown to evaluate the statistical significance of the correlations, with significance indicated when the p-value is less than the α-value of 0.05. Additionally, results from Student’s t-test and Fisher’s F-test are provided to assess whether there are significant differences in the means and variances between the two datasets, respectively.
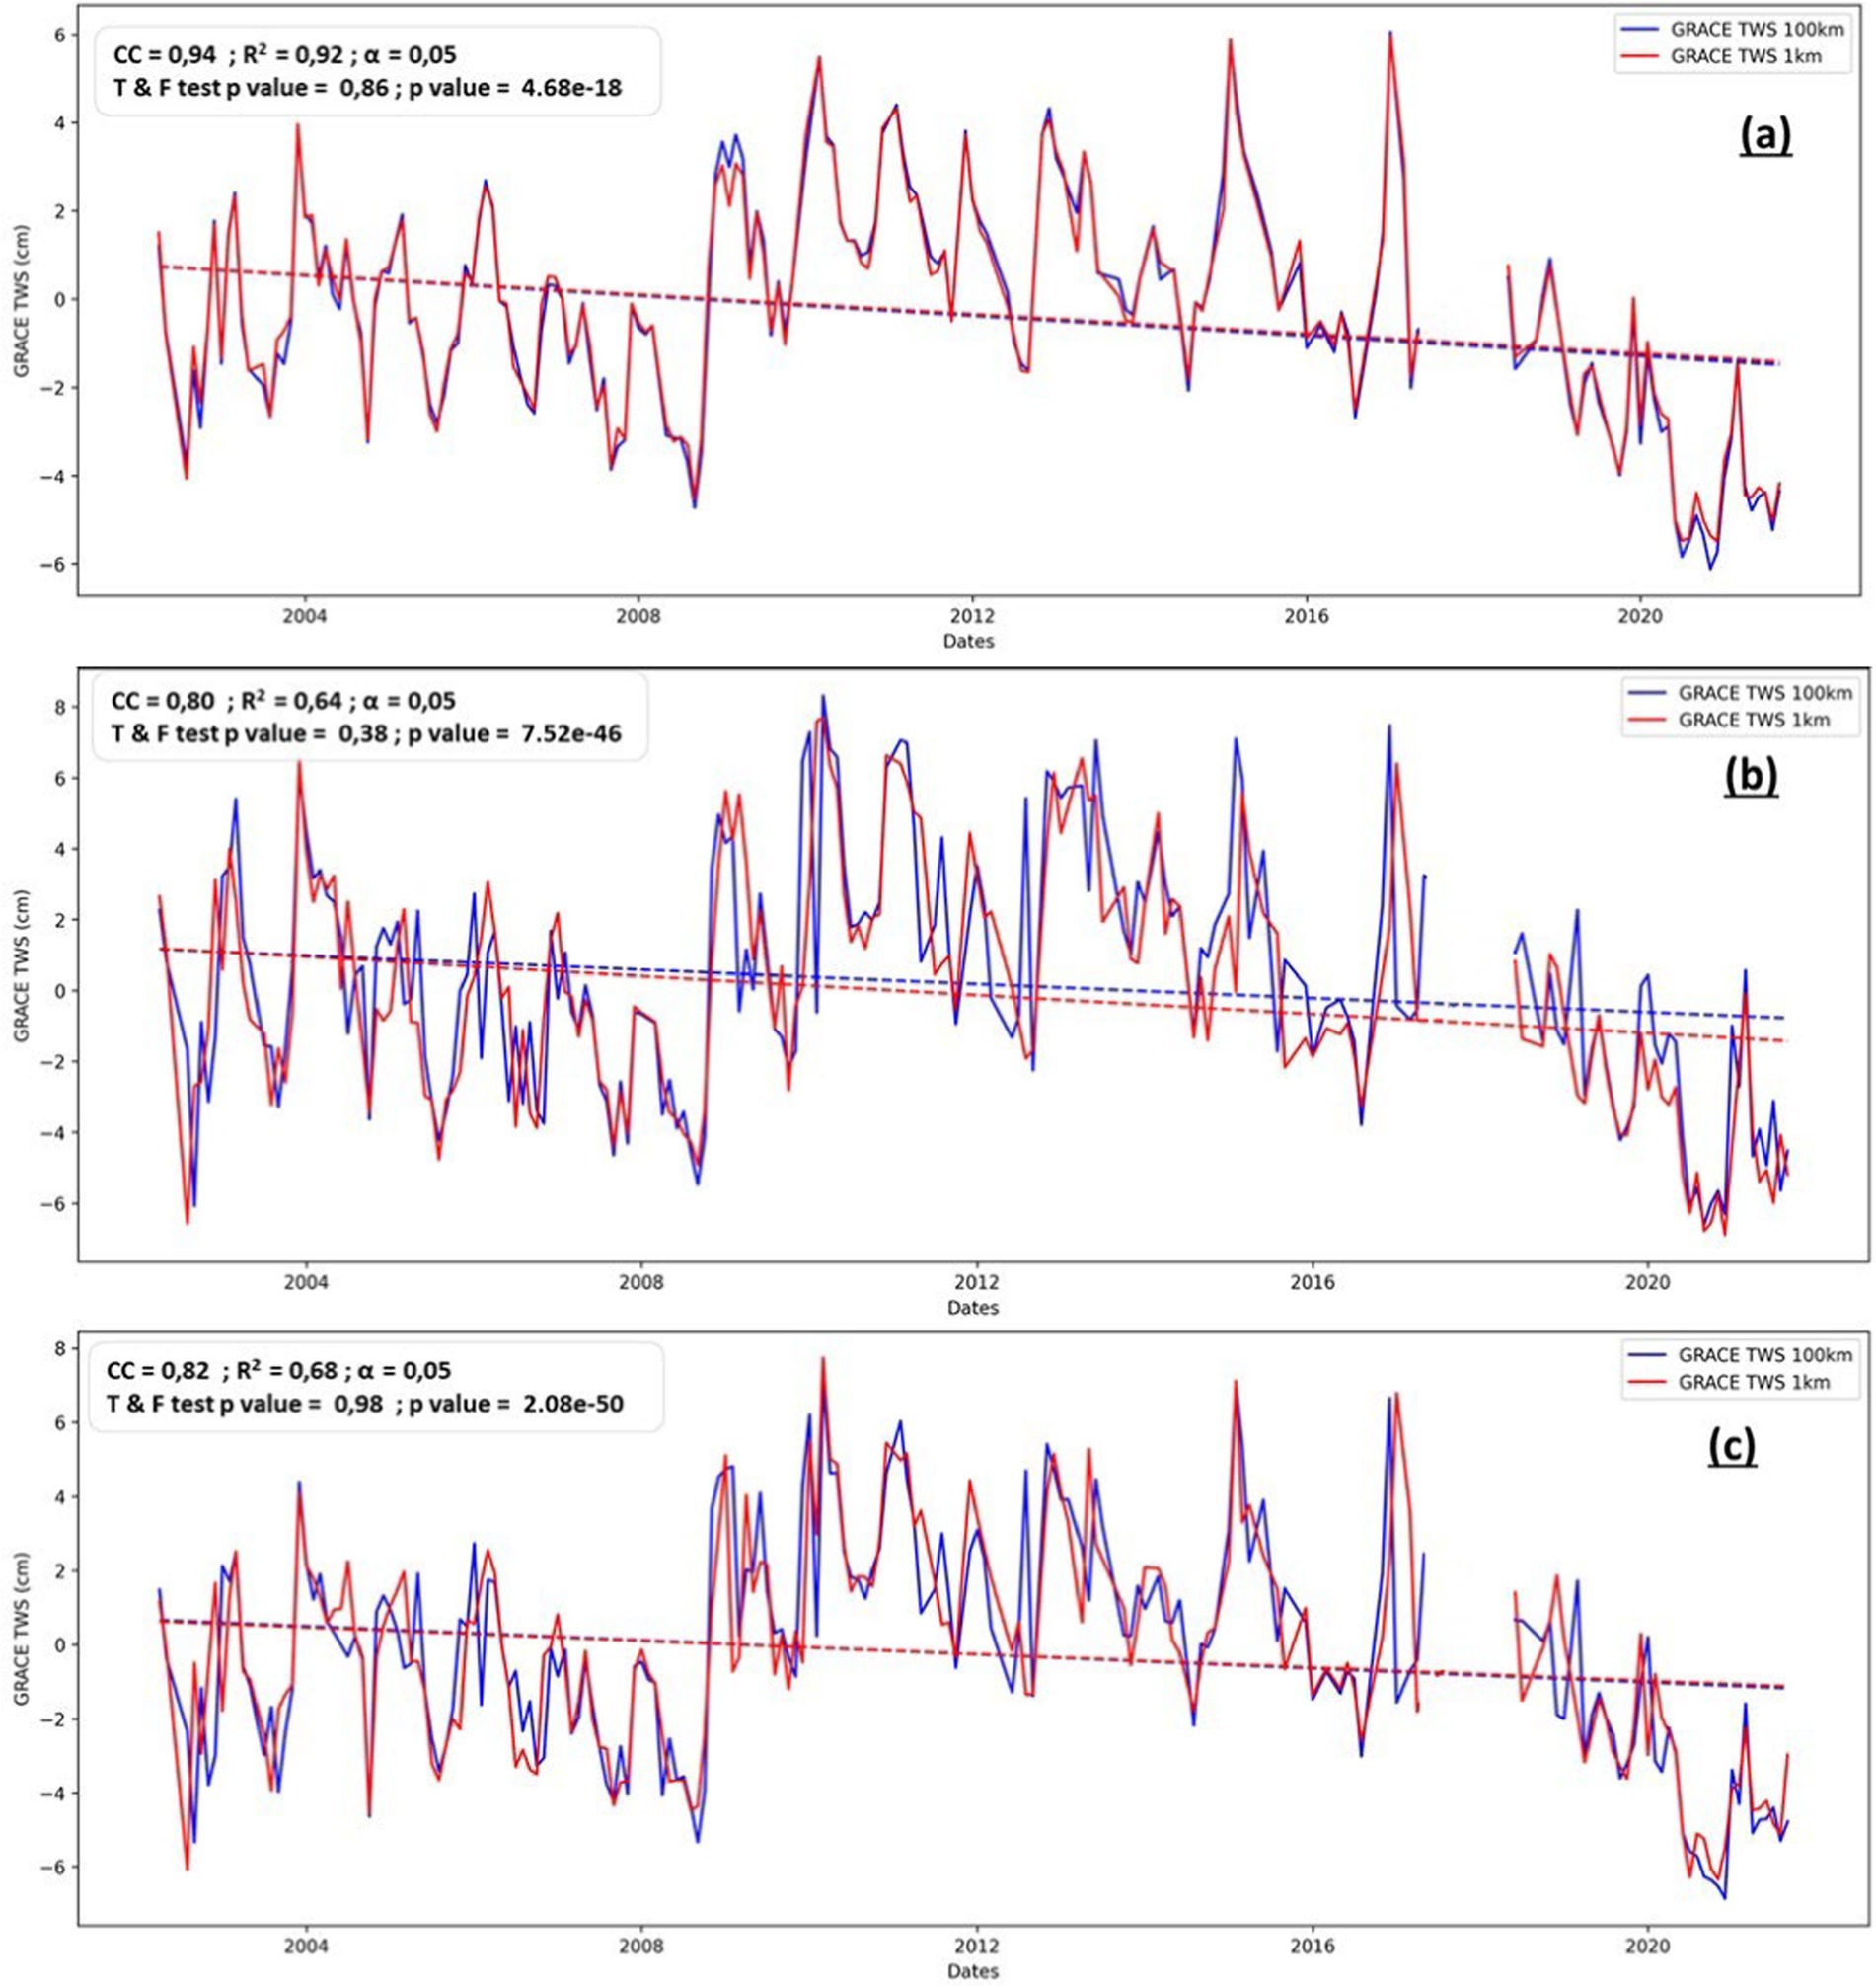
Figure 9. Temporal Variation of GRACE TWS anomalies data at 100 km and 1 km: (a) The study area; (b) The Loukkos basin; (c) The Bouregreg basin.
As illustrated in Figure 9, the statistical validation reveals a strong alignment between the downscaled GRACE data and the original GRACE data across all three cases analyzed. Initially, the comparison of trends shows that the downscaled fluctuations closely follow those of the original data, demonstrating consistent patterns over time. This visual agreement is further supported by high statistical metrics, including correlation coefficients (CC) and coefficients of determination (R2). The analysis yields CC values of 0.94 for the study area, 0.80 for the Loukkos basin, and 0.82 for the Bouregreg basin, with corresponding R2 values of 0.92, 0.64, and 0.68, respectively. Additionally, the p-values for all cases are significantly below the threshold α-value of 0.05 (4.68e-18 for Morocco, 7.52e-46 for the Loukkos basin, and 2.08e-50 for the Bouregreg basin), confirming that these correlations are statistically significant (Zhang et al., 2019; Rahaman et al., 2019; Ning et al., 2014).
Additionally, the downscaled GRACE data display significant underestimation of extreme positive values and overestimation of extreme negative values, particularly prior to 2018—a year marked by worsening drought conditions following a brief wet period that began in 2015 (Figure 9) (Bennouna, 2020; Hammoudy et al., 2022; Direction Générale de l’Hydraulique, 2023). The finer resolution of the 1 km data allows for better detection of local variations in water storage, which likely explains the differences observed compared to the 100 km data (He et al., 2021; Sahour et al., 2020). The underestimation of extreme positive values may represent a more accurate reflection of localized water recharge events, which were less frequent during drought (Rahaman et al., 2019; Sahour et al., 2020). Similarly, the overestimation of extreme negative values may result from improved detection of declines in groundwater levels and surface water reserves in drought-affected and over-exploited areas (Foroumandi et al., 2023).
For the study area, Student’s t-test yields a p-value of 0.86, which exceeds the α-value of 0.05, indicating no significant difference between the means of the GRACE data at 100 km and 1 km resolutions (Figure 9) (Yin et al., 2018; Zhang et al., 2019). Similarly, Fisher’s F-test produces a p-value of 0.86, also higher than the α-value of 0.05, suggesting no significant difference in variances between the two datasets. The Loukkos basin (T-test p-value = 0.38, F-test p-value = 0.38) and Bouregreg basin (T-test p-value = 0.98, F-test p-value = 0.98) follow the same pattern, both with p-values exceeding the α-value of 0.05 (Figure 9) (Davis et al., 2008; Pertiwi et al., 2020; Ameur et al., 2017; Massuel et al., 2017; Kuper et al., 2012). These results suggest that the downscaled 1 km data retain the overall statistical characteristics of the original 100 km data. Consequently, the observed discrepancies in extreme values are likely linked to downscaling effects, particularly in response to drought conditions (Bennouna, 2020; Hammoudy et al., 2022; Direction Générale de l’Hydraulique, 2023; Foroumandi et al., 2023).
5.2.2 Validation using groundwater level in situ data
Figure 10 presents the spatial distribution of the 139 studied wells across the four regions of Casablanca-Settat, Draa-Tafilalet, Béni Mellal-Khénifra, and Marrakech-Safi. The figure also depicts the evolution of correlation coefficients between in-situ groundwater levels and GRACE TWS data before and after downscaling. Among the analyzed wells, 88 (63%) exhibited an improvement in correlation, with 66 surpassing a threshold of 0.2.
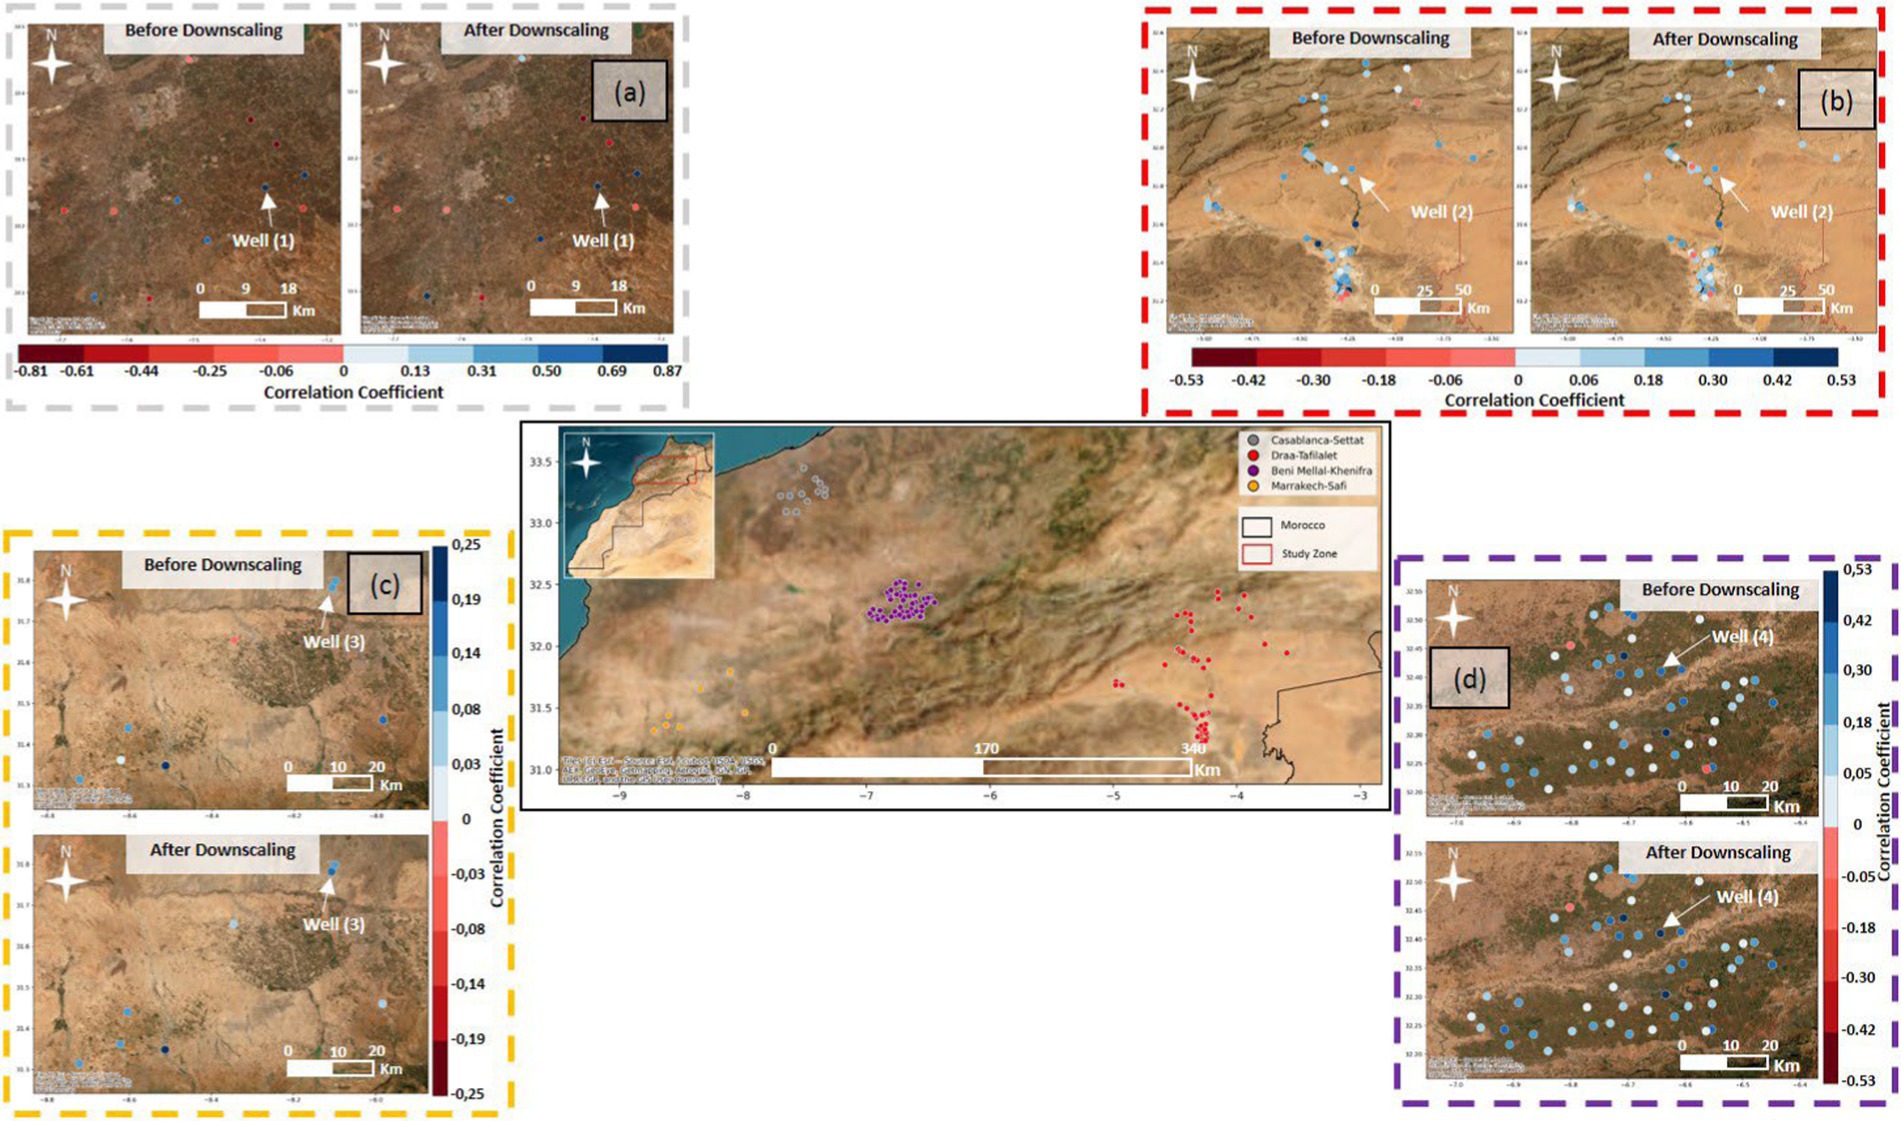
Figure 10. The spatial distribution of wells and their correlations with GRACE TWS anomalies data befor and after downscaling: (a) Casablanca-Settat region, (b) Draa-Tafilalet region, (c) Marrakech-Safi region, (d) Beni Mellal-Khenifra region.
At the regional scale, all four regions show a general enhancement in correlation following downscaling. The average correlation coefficient increased from 0.42 to 0.47 in Béni Mellal-Khénifra, from 0.46 to 0.53 in Casablanca-Settat, from 0.41 to 0.49 in Draa-Tafilalet, and from 0.38 to 0.46 in Marrakech-Safi (Table 2). However, the correlation values and their variability differ across regions. Casablanca-Settat exhibits the widest correlation range, spanning from −0.81 to 0.87, indicating high variability in well responses. In contrast, Marrakech-Safi displays the narrowest range (−0.25 to 0.25), suggesting more uniform behavior. The Draa-Tafilalet and Béni Mellal-Khénifra regions present similar correlation ranges, from −0.53 to 0.53, reflecting moderate variability in correlation improvement (Figure 10). Statistical significance tests (p-values) confirm that the observed correlations remain robust before and after downscaling (Table 2), reinforcing the reliability of the relationship between GRACE TWS and in-situ groundwater levels (Figure 11).

Table 2. Correlation coefficients and p-value.
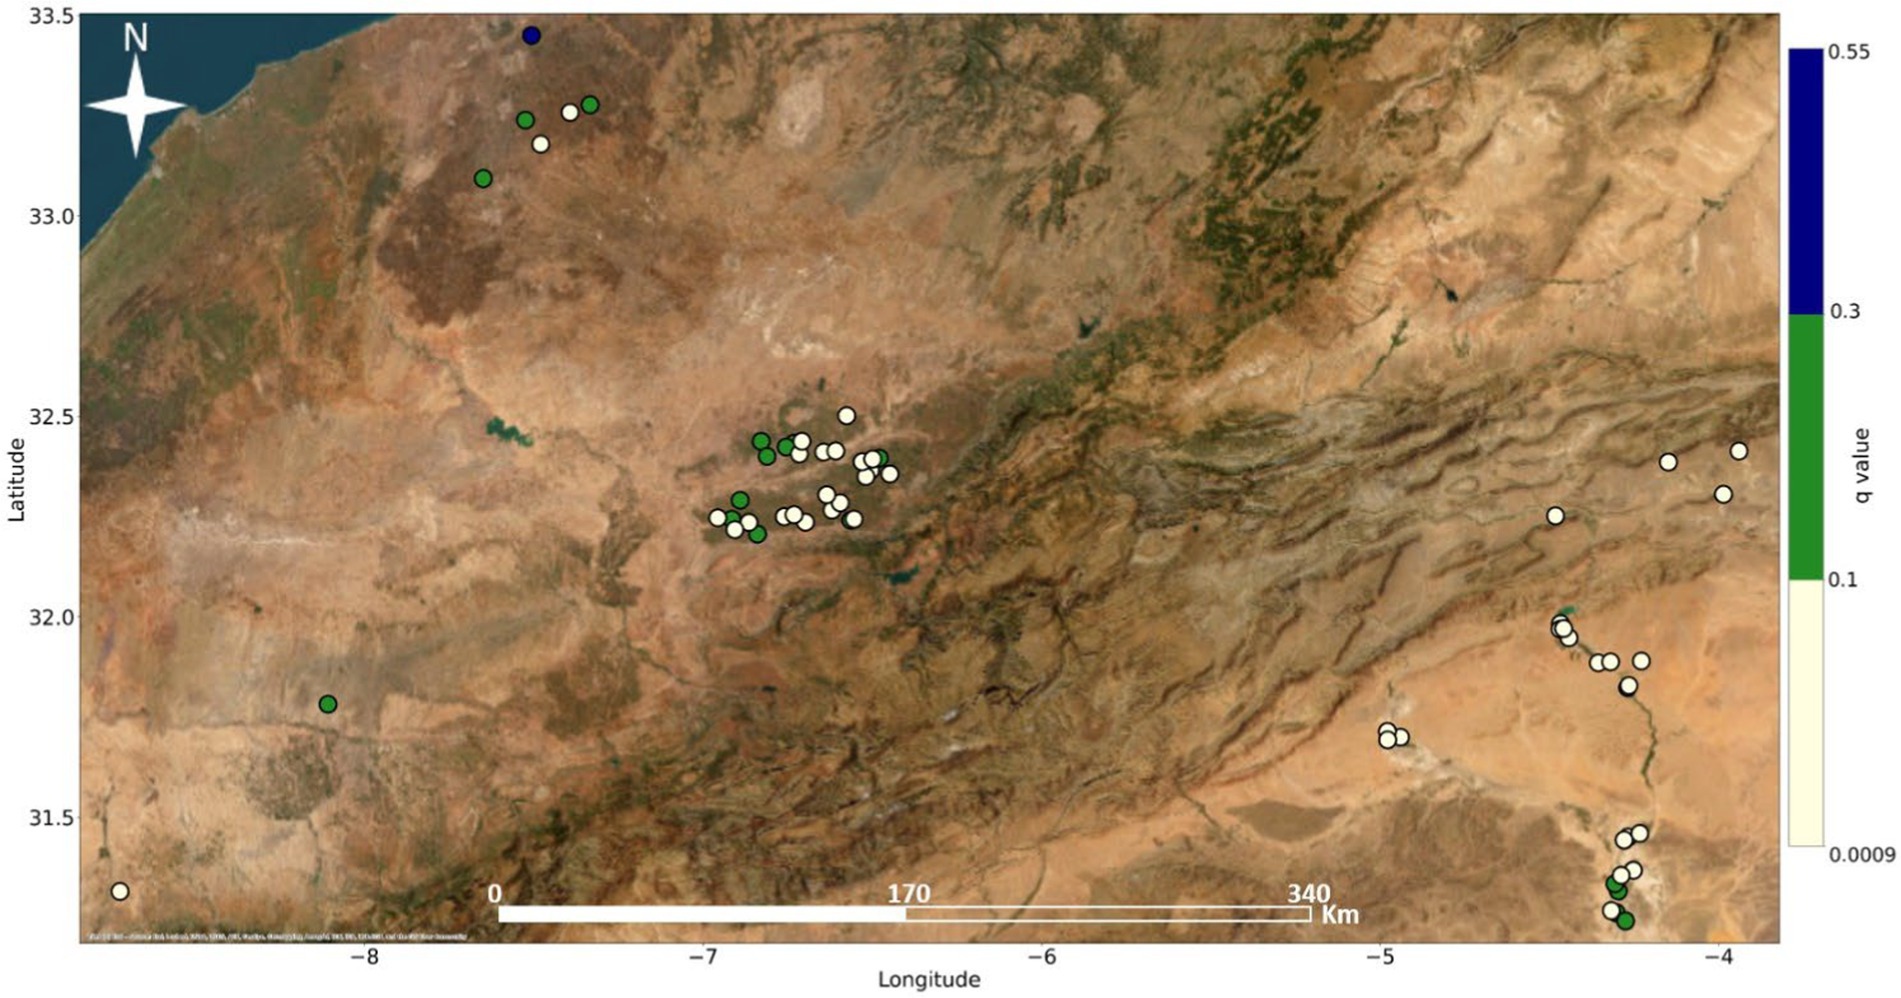
Figure 11. Spatial distribution of wells with improved correlation coefficients exceeding 0.2 and their Cohen’s q values.
We used Cohen’s q method to evaluate the improvement in correlation between GRACE TWS and groundwater level in-situ data of the wells exhibiting enhanced correlations (Cohen, 1988). Out of the wells that showed a correlation coefficient higher than 0.2 after downscaling, 67% showed a small improvement (q < 0.1), 32% showed a moderate to high improvement (q between 0.1 and 0.3), and only one well had a large improvement (q > 0.3). Since all wells exhibited post-downscaling correlations above the 0.2 threshold, this indicates that the downscaling model consistently improved the relevance of the GRACE data, even though the magnitude of improvement varied from one well to another.
When compared with previous studies, our results demonstrate significant advancements in the downscaling of GRACE TWS data for groundwater monitoring. Earlier works have reported improvements in correlation metrics, but often on a limited number of wells or with less pronounced effects. In contrast, our study achieved an average correlation coefficient improvement of 27.12% across 66 wells, highlighting both the robustness of our methodology and its applicability on a larger spatial scale. Additionally, while some studies have assessed downscaling success by focusing on wells surpassing a predefined correlation threshold, our results indicate a clear enhancement, with an increased number of wells exceeding a correlation coefficient of 0.2 after downscaling. This suggests that our approach not only maintains but strengthens the relationship between GRACE TWS and in-situ groundwater observations (Ning et al., 2014; Chen et al., 2019; Zhang et al., 2021).
While earlier studies have reported correlation improvements, these were often observed in a limited number of wells or with less pronounced effects. In contrast, this study achieved an average correlation coefficient improvement of 27.12% across 66 wells, underscoring both the robustness of the methodology and its applicability on a larger spatial scale. Importantly, the validation was not restricted to wells that initially exhibited strong correlations with GRACE TWS at 100 km resolution; wells with no prior correlation were also included to ensure a more objective assessment of the model’s effectiveness. Additionally, while some studies have assessed downscaling success by focusing on wells surpassing a predefined correlation threshold, the results indicate a clear enhancement, with an increased number of wells exceeding a correlation coefficient of 0.2 after downscaling. Moreover, since the analysis is based on TWS, which integrates both surface and groundwater storage, the correlations specifically reflect the relationship between TWS and in-situ groundwater levels (GWL) rather than total groundwater storage (GWS) (Ning et al., 2014; Chen et al., 2019; Zhang et al., 2021). This distinction highlights the model’s ability to capture the variability in GWL, despite the complex interactions between groundwater and surface water storage.
The observed regional variations in correlation are largely influenced by the heterogeneity of groundwater data (Table 2), as groundwater monitoring is managed by distinct hydraulic basin agencies in each region (Othman et al., 2022). One of the key factors contributing to these differences is the inconsistency in the length and continuity of temporal groundwater records, with some wells exhibiting more data gaps than others (Table 1) (Bouramtane et al., 2023; Bikše et al., 2023). Among the studied regions, Casablanca-Settat has the lowest average number of data gaps per well, indicating superior data quality and contributing to stronger correlations. Conversely, the Marrakech-Safi region exhibits the highest number of data gaps per well, combined with a lower well density, leading to weaker correlation results both before and after downscaling (Table 1). Additionally, regional differences in correlation strength stem from the varying influence of SWB and GWS on TWS (Zhu et al., 2021; Cui et al., 2022; Deng et al., 2022). These hydrological differences, combined with factors such as land use, agricultural activities, irrigation practices, groundwater pumping intensity, and local climatic conditions, further contribute to the observed spatial variability in correlation strength (Pulido-Bosch et al., 2018; Tweed et al., 2018; Cavelan et al., 2022).
Figure 12 presents the time series of GRACE TWS data at 100 km and 1 km resolution alongside groundwater level variations for four wells selected from the 88 wells that showed an improvement in their correlation coefficients. Additionally, the figure illustrates the evolution of correlation coefficients before and after downscaling for three wells. The TWS at 1 km resolution (black line) more closely follows groundwater level fluctuations compared to the 100 km GRACE TWS data, demonstrating a better alignment with aquifer dynamics. Notably, the 1 km TWS reduces both underestimation and overestimation of rapid and abrupt groundwater level changes. The improvements in correlation coefficients (CC) for wells 1, 2, 3, and 4—rising from 0.78 to 0.84, 0.19 to 0.28, 0.17 to 0.24, and 0.42 to 0.46, respectively—highlight the effectiveness of the downscaling approach. The enhanced resolution at 1 km has strengthened the direct relationship between TWS and groundwater dynamics, especially in semi-arid and arid regions where surface water is scarce and groundwater serves as the primary water resource. This refined spatial resolution improves the ability to capture groundwater trends within aquifers more effectively (Ouassanouan et al., 2022; El Ouali et al., 2023; El Meknassi Yousoufi et al., 2024).

Figure 12. Comparison of in situ groundwater levels with downscaled and original GRACE TWS anomalies data and the evolution of their coefficients before and after downscaling: well (1) Casablanca-Settat region; well (2) Draa-Tafilalet region; well (3) Marrakech-Safi region; well (4) Béni Mellal-Khénifra region.
5.2.3 Validation using known aquifer dynamics
The trends in GRACE data for 100 km and 1 km were calculated and analyzed using the Theil-Sen trend calculation method, for 66 groundwater tables in Morocco over four periods 2002–2007, 2007–2012, 2012–2017 and 2017–2022. The results are shown in Figure 13, where aquifer systems in red exhibit negative trends and those in blue show positive trends, with the shades reflecting the intensity of these trends. The TWS trends for the 100 km and 1 km GRACE data over the same periods reveal overall consistency in the water table trends, underscoring the effectiveness of the 1 km GRACE data in preserving the original characteristics and trends of the TWS. However, the 1 km GRACE data shows a discrimination in TWS trends between groundwater tables that belong to the same structural domain or are geographically close.
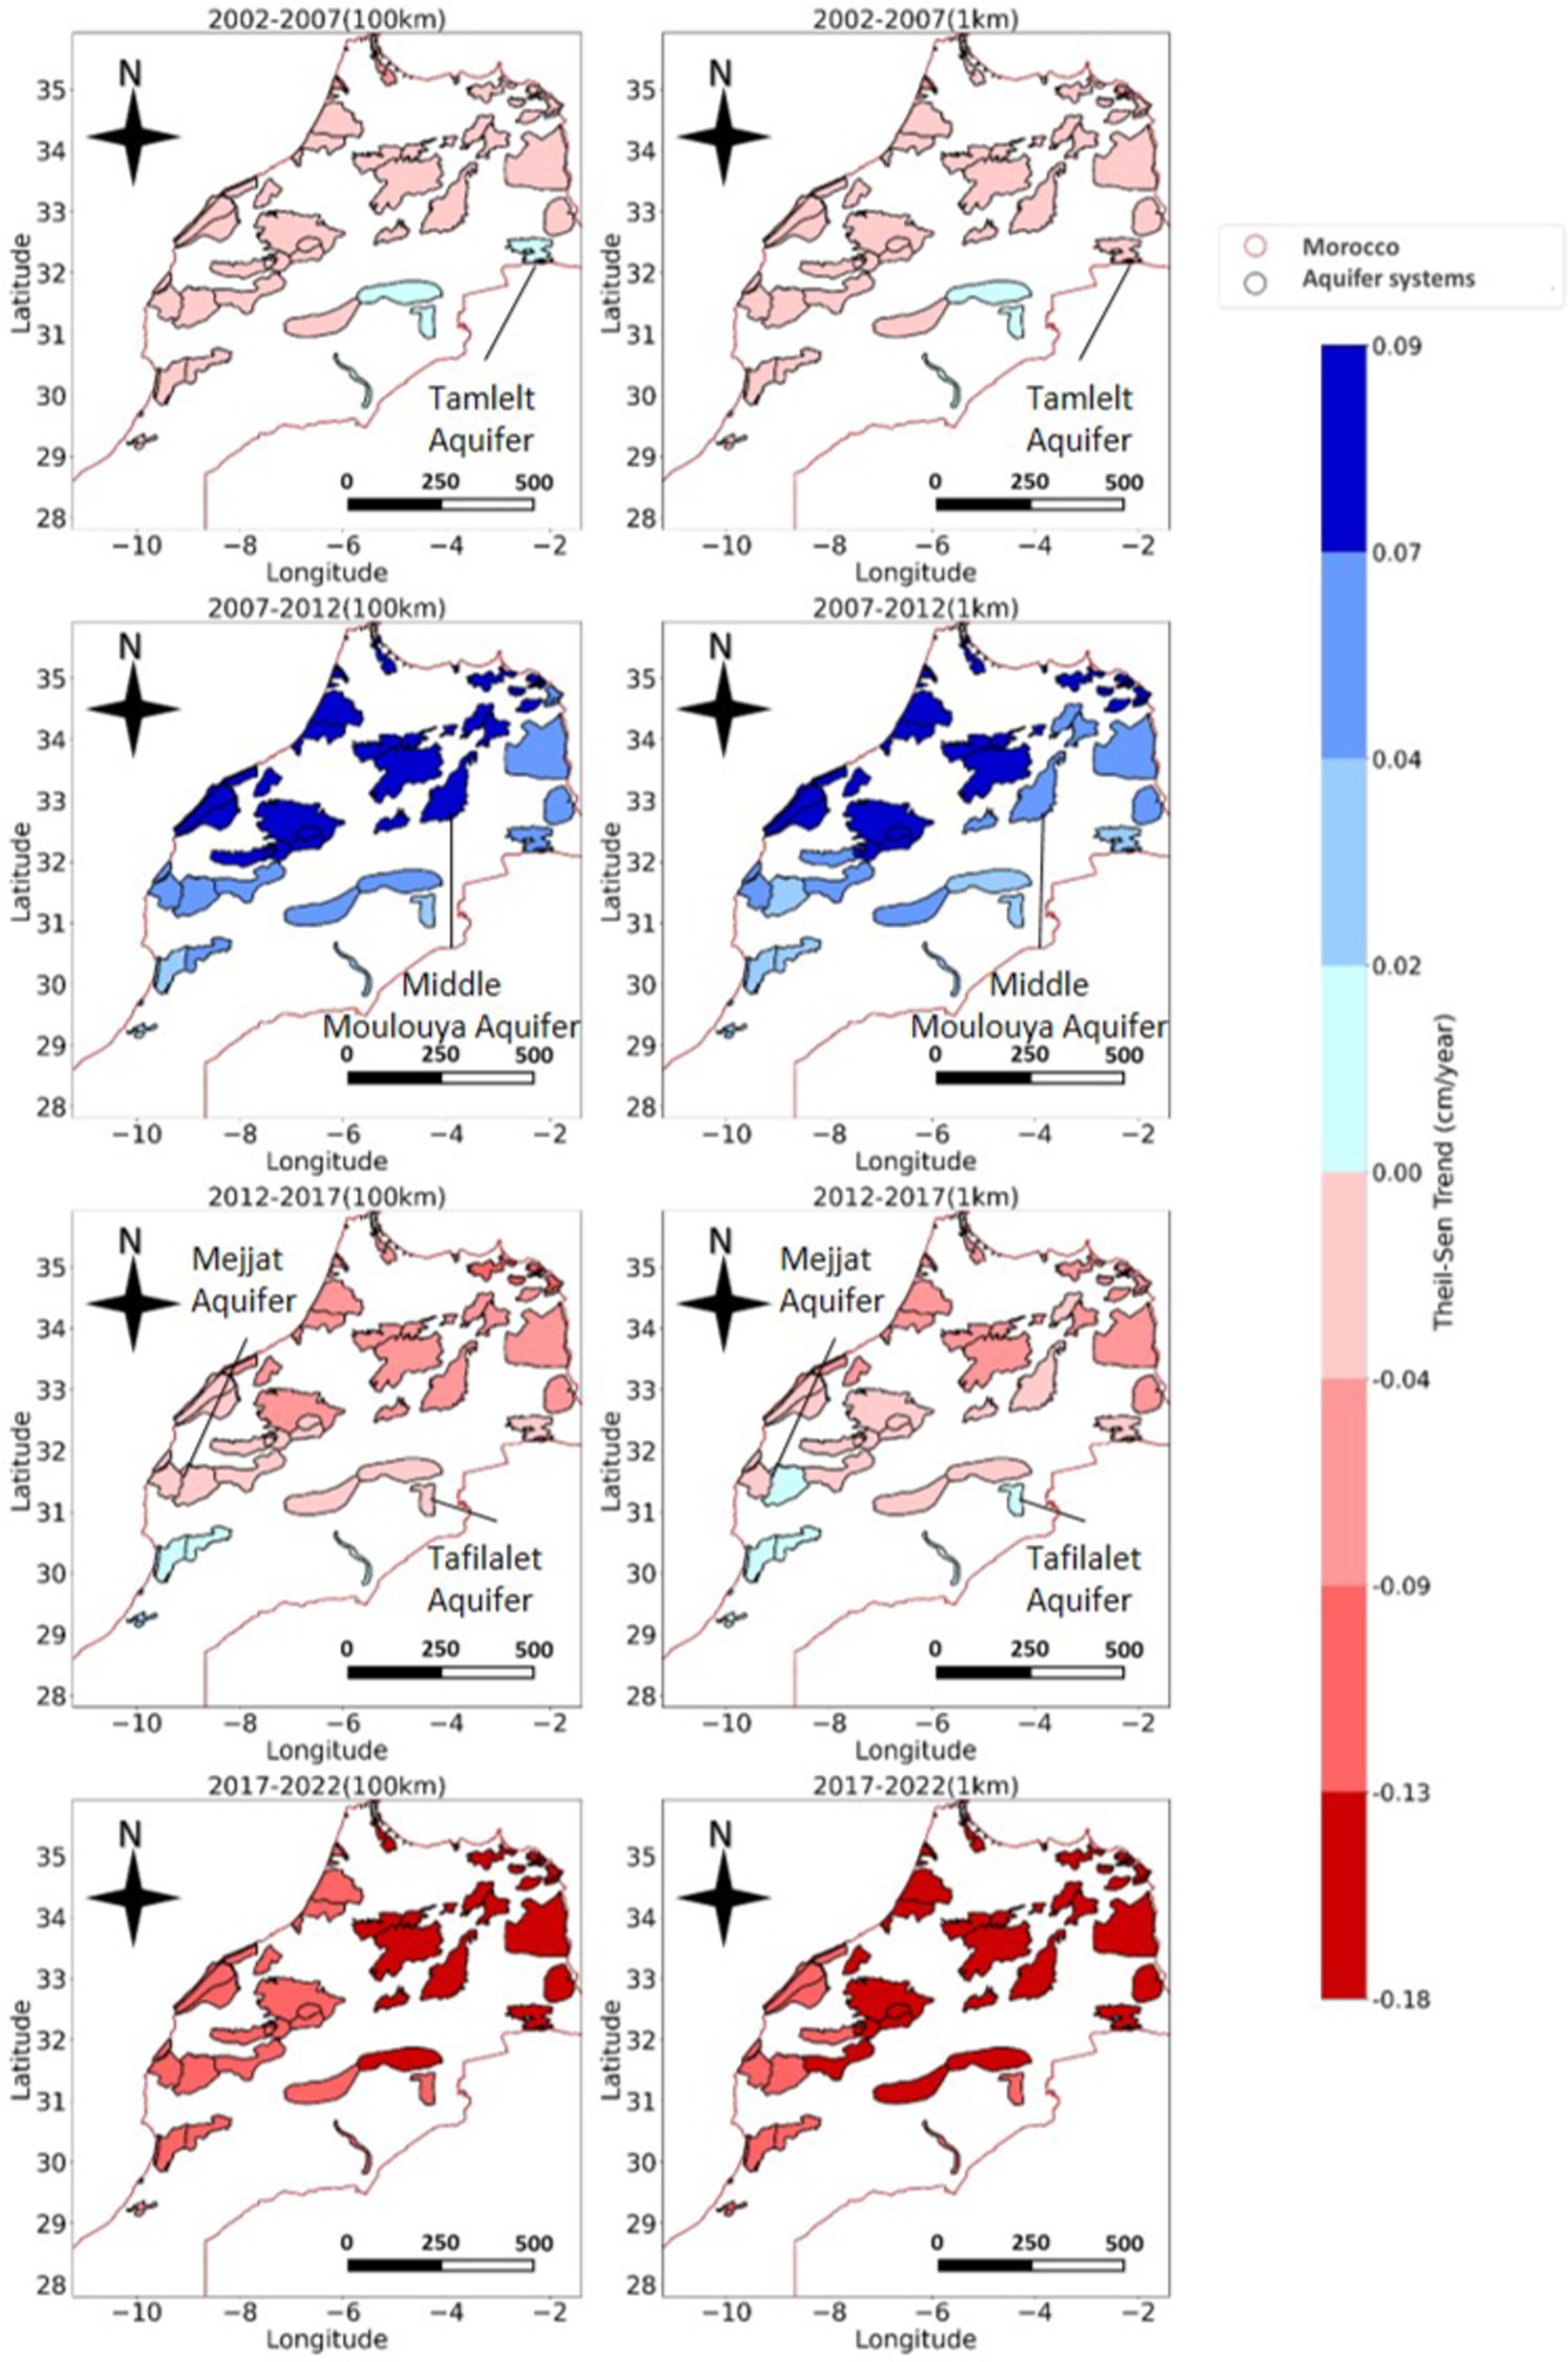
Figure 13. Trends in cm per year of GRACE TWS anomalies data at 100 km and 1 km for aquifer systems in northern Morocco (Theil-Sen): (a) Before downscaling; (b) After downscaling.
For instance, during the period from 2002 to 2007, GRACE data for the Tamlelet aquifer at the 100 km resolution indicated a positive but relatively weak trend in TWS, ranging between 0.0 cm/year and 0.02 cm/year (Figure 13a). In contrast, the downscaled GRACE data for the Temlelet aquifer at the 1 km resolution revealed a more pronounced negative trend, ranging from −0.04 cm/year to −0.09 cm/year. This negative TWS trend is now more consistent with the overall negative trend observed across the eastern region of the study area, particularly in the aquifers of the Eastern Meseta, where groundwater resources exhibit a persistent decline and a significant water deficit (Hssaisoune et al., 2020; Ahmed et al., 2021).
The period from 2007 to 2012 was marked by predominantly positive trends in groundwater tables across northern Morocco. Notably, aquifers along the Atlantic coast (Western Meseta), the middle Moulouya aquifer (Eastern Meseta), and those in the high relief areas of the Middle Atlas and High Atlas exhibited similar trends in TWS when analyzed using GRACE data at the 100 km resolution, ranging from 0.04 cm/year to 0.07 cm/year. However, the finer resolution of the GRACE 1 km data provides a clearer spatial differentiation, revealing distinct trends among aquifers based on their structural domains. Specifically, aquifers in the western part of the study area, closer to the Atlantic Ocean, exhibit stronger positive trends, while those in the eastern part, on the leeward slopes of the Atlas Mountains, display a generally positive but weaker trend. This pattern aligns with the geomorphological and climatic characteristics of northern Morocco, where western regions, influenced by Atlantic moisture, receive higher precipitation and show stronger positive groundwater trends. In contrast, eastern regions, experiencing drier conditions and greater reliance on groundwater resources, display weaker positive trends in groundwater levels (Ahmed et al., 2021).
Specifically, the Western Meseta and Middle Atlas aquifers display consistent trend values between 0.04 cm/year and 0.07 cm/year, which can be attributed to their climatic linkage and the shared influence of Atlantic climatic conditions (Tramblay et al., 2012; Ahmed et al., 2021). In contrast, the High Atlas aquifers show slightly lower trends ranging from 0.02 cm/year to 0.04 cm/year. Being further south, these aquifers are less influenced by the Atlantic climate and are more affected by arid continental Saharan influences (Tramblay et al., 2012; Ahmed et al., 2021). Additionally, the middle Moulouya aquifer, when analyzed at the 1 km resolution, demonstrates a trend of 0.02 cm/year to 0.04 cm/year, aligning closely with other aquifers in the Eastern Meseta structural domain.
Downscaling to a 1 km resolution has unveiled specific variations in the TWS trends for certain aquifers during the 2012–2017 period that were not visible at the 100 km resolution of GRACE data. Specifically, the Tafilalt and Mejatte aquifers showed TWS trends ranging from −0.04 cm/year to −0.09 cm/year in the 100 km GRACE data, which were consistent with trends observed in other aquifers within their structural domain. However, when analyzed at the 1 km resolution, these aquifers displayed relatively weak positive TWS trends, ranging from 0.0 cm/year to 0.02 cm/year. For the Tafilalt aquifer, this observation aligns with the findings of El Ouali et al. (2023), who reported alternating wet and dry years following a prolonged drought up to 2005/2006. These fluctuations likely contribute to the positive TWS trend at the 1 km resolution, capturing recharge periods missed by the coarser resolution. On the other hand, the Mejatte aquifer’s TWS trends during this period are likely influenced by a less severe dry period from 2008 to 2014, which resulted in a smaller decline in groundwater levels compared to neighboring aquifers (Ouassanouan et al., 2022).
For the period 2017–2022, the downscaling of GRACE data has highlighted the widespread impact of drought in all of Morocco’s northern regions, revealing no significant differences between them. Indeed, the intensity of the drought is so severe and pervasive that all regions of Morocco are experiencing water resource shortages to similar degrees (Hamdi, 2023; Bennouna, 2020).
The aquifer systems in Morocco were categorized based on their geographical locations within structural domains in the study area: the Rif Mountains (RIF), Western Meseta, Eastern Meseta, Atlas Mountains and Southern Atlas. (Bouramtane et al., 2020b) (Figures 14a,b). The median Theil-Sen slope values for GRACE data at 100 km and 1 km resolutions were analyzed and compared for two periods: 2002–2012 and 2012–2020.
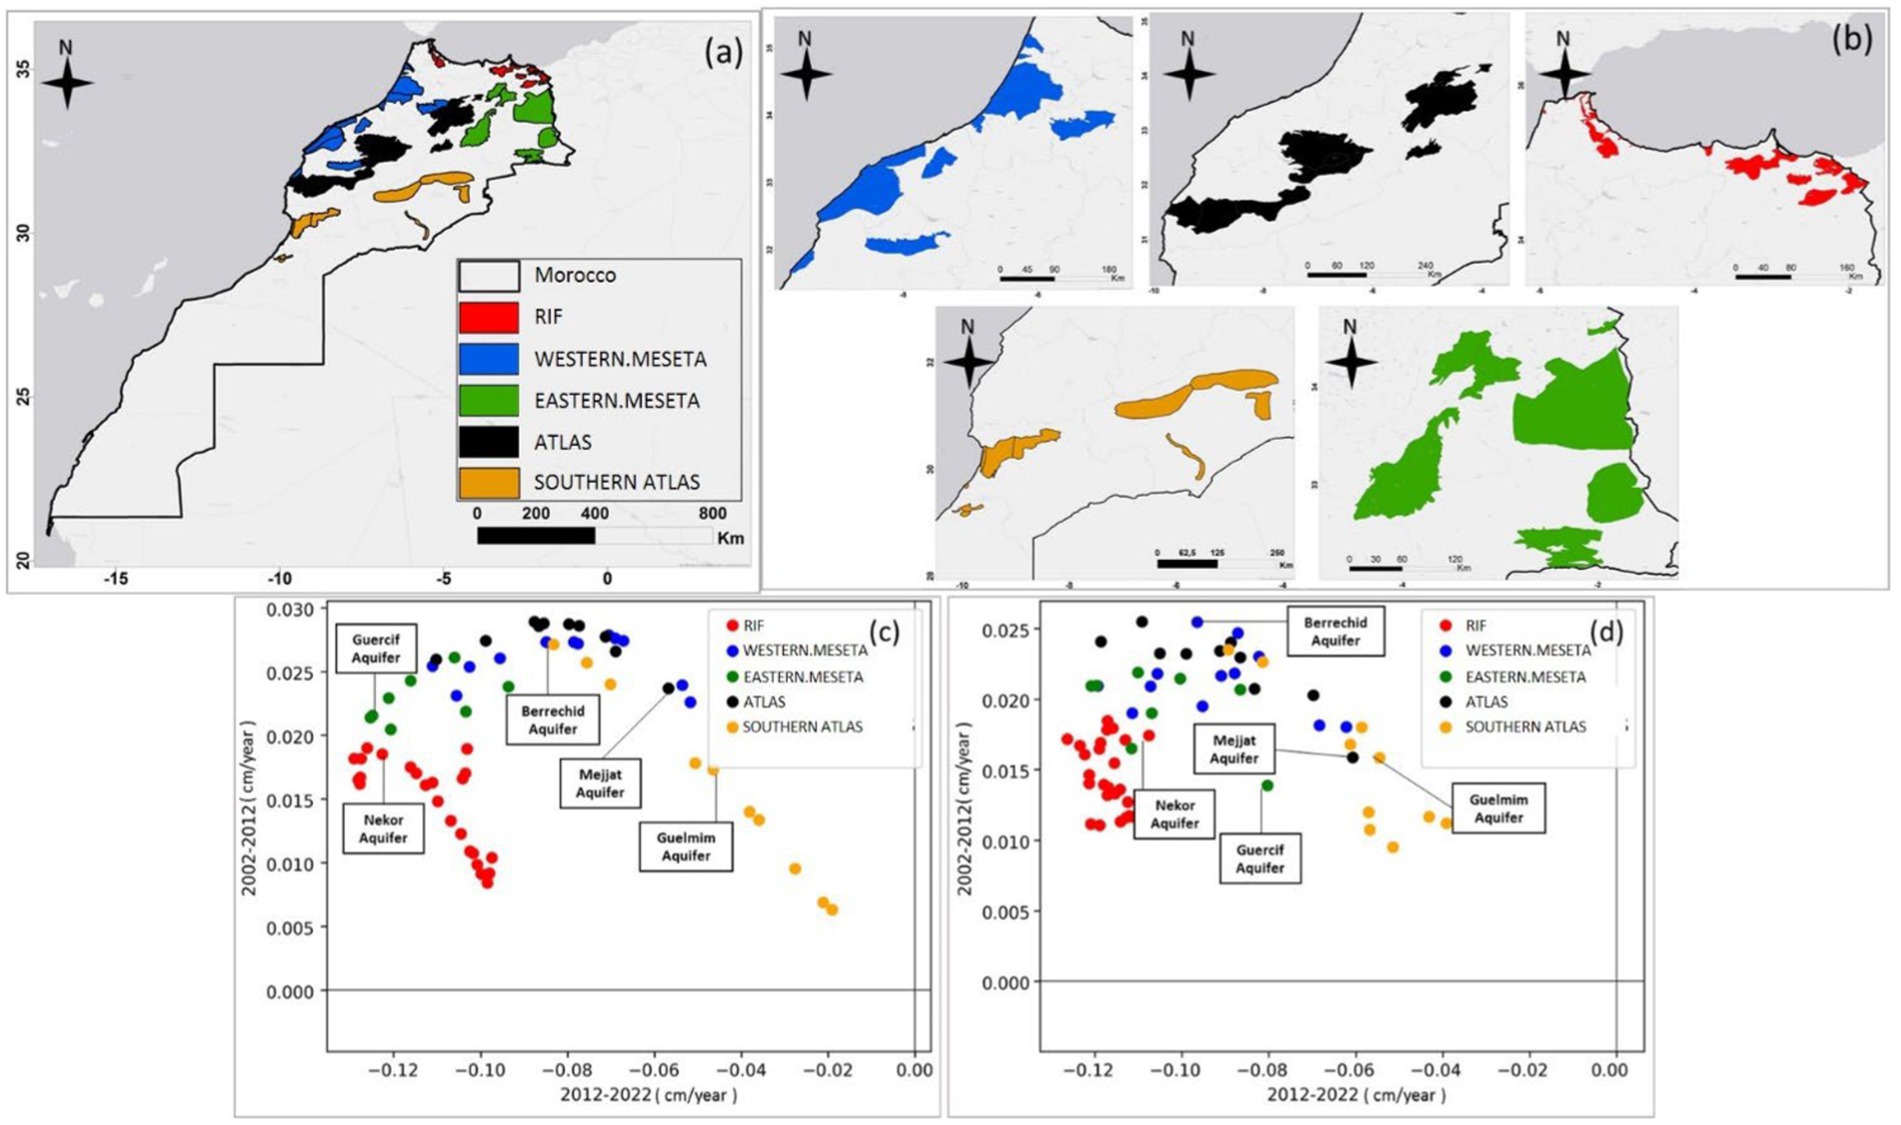
Figure 14. Locations of Aquifer systems in Morocco and scatter plot showing the evolution of trends in GRACE TWS anomalies data for the aquifer systems at 100 km and 1 km resolutions [2002–2012; 2012–2022] using Theil-Sen estimation: (a) Locations of aquifers in Morocco; (b) Zoom at the location of the aquifers; (c) Scatter plot before downscaling; (d) Scatter plot after downscaling.
Figures 14c,d show scatter plots comparing the median Theil-Sen slope values representing TWS trends from 2002–2012 (Y-axis) to 2012–2022 (X-axis) for both 100 km and downscaled 1 km GRACE data. These comparisons assess the downscaling model’s ability to capture geographical variations in TWS trends. A similarity in the overall distribution of aquifer systems is observed between the 100 km and 1 km data. At both resolutions, the aquifers displayed positive trends during 2002–2012, followed by a marked shift to negative trends during 2012–2022. This shift highlights the model’s consistency in capturing the significant changes caused by drought and water resources overexploitation (Gouahi et al., 2023; Hamid et al., 2024; El-Yazidi et al., 2024).
For the GRACE 100 km TWS scatter plot, significant dispersion is observed in the trends among the points for each aquifer system over the two decades, particularly in the Southern Atlas and Rif domains. This suggests greater variability or heterogeneity in groundwater trends within these regions, as the 100 km resolution is too coarse to capture localized variations accurately, resulting in increased variability within each class. In contrast, the GRACE 1 km TWS scatter plot shows much less dispersion within each class, with points more concentrated and grouped, especially for the Rif and Southern Atlas groundwater systems (Figure 14d). This indicates a greater coherence and a more precise representation of groundwater trends at the finer 1 km resolution.
These findings indicate that downscaling GRACE data to a finer 1 km resolution more effectively captures localized variations, yielding more consistent and accurate groundwater trends compared to the coarser 100 km resolution. Moreover, the downscaling process reveals that aquifer systems within the same structural domain, tend to exhibit similar TWS trends, highlighting the model’s ability to preserve spatial coherence in groundwater dynamics.
6 Conclusion
In this study, a Random Forest (RF)-based algorithm was developed to downscale GRACE TWS data from a 100 km to a 1 km resolution, incorporating multiple remote sensing variables to enhance spatial precision. The selected predictors included precipitation from the Global Precipitation Measurement (GPM) sensor (10 km resolution), the Normalized Difference Vegetation Index (NDVI) from MODIS (1 km), Land Surface Temperature (LST) from MODIS (1 km), Evapotranspiration (ET) from MODIS (500 m), the Digital Elevation Model (DEM) from SRTM (30 m), and the Normalized Difference Snow Index (NDSI) from MODIS (500 m). This methodology was applied to Morocco, a region characterized by significant climatic, hydrological, and topographical variability and facing severe drought conditions since 2016. The primary objective was to enhance the resolution and accuracy of GRACE TWS data to better assess groundwater storage dynamics in response to drought.
The validation of the downscaling model was comprehensive, employing multiple assessment methods to ensure robustness. Statistical validation demonstrated strong model performance, with a Nash-Sutcliffe Efficiency (NSE) of 0.80, a low RMSE of 0.82 cm, and an MAE of 0.57 cm. Time series analysis confirmed a high correlation (R2 = 0.80) between the original and downscaled data, with consistent temporal trends. While minor discrepancies were noted for extreme values, statistical tests indicated no significant differences in means and variances, confirming the model’s reliability. The cross-validation results further reinforced the robustness of the downscaling approach. Box plots of performance metrics (R2, MAE, RMSE) showed that, for most pixels, the downscaled GRACE-TWS data maintained a strong correlation with the original 100 km data, with a median R2 of 0.64 and an interquartile range between 0.5 and 0.7. The error metrics remained low across tested pixels, with MAE values predominantly between 0. 36 cm and 0.6 cm with a mean value of 0.49 cm and a median of 0.46 cm, and RMSE values between 0.5 cm and 0.8 cm with a mean value of 0.74 cm a median of 0.69 cm. While outliers indicated occasional local discrepancies, overall performance indices remained within acceptable thresholds, further validating the model’s reliability. Additionally, the comparison of downscaled GRACE TWS data with in-situ groundwater measurements showed significant improvements in correlation coefficients for 63% of the analyzed wells. The downscaling process enhanced alignment with groundwater level variations, with 66 wells exceeding a correlation threshold of 0.2.
The validation of GRACE TWS trends at different resolutions (100 km vs. 1 km) for 66 monitored groundwater tables between 2002 and 2022 revealed key findings. The general TWS trends remained consistent across resolutions, confirming that the downscaling model preserved large-scale hydrological patterns. However, the high-resolution (1 km) data provided a more detailed representation of local groundwater variations, allowing for finer differentiation of TWS trends within and between aquifers. This was particularly evident during critical periods such as 2007–2012 and 2012–2017, where the downscaling revealed distinct trends not observable at 100 km resolution. Specific cases, such as the Mejatte and Tafilalt aquifers, showcased localized variations that were previously undetectable. Moreover, the ability to distinguish TWS trends between aquifers within the same structural domain further validated the model’s capacity to refine regional water storage assessments.
While the results are promising and confirm the robustness of the downscaling approach, they also highlight areas for improvement. Some local inconsistencies suggest the need for enhanced modeling techniques that better capture spatial heterogeneity. Future research will explore the integration of temporal dynamics through recurrent neural networks (RNNs) or other machine learning frameworks to improve accuracy and refine trend estimations in downscaled GRACE TWS data.
Data availability statement
The raw data supporting the conclusions of this article will be made available by the authors, without undue reservation.
Author contributions
YH-A: Conceptualization, Data curation, Investigation, Methodology, Software, Visualization, Writing – original draft, Writing – review & editing. NK: Data curation, Investigation, Methodology, Software, Writing – original draft. IM: Conceptualization, Data curation, Investigation, Methodology, Software, Supervision, Writing – original draft. TB: Conceptualization, Data curation, Formal analysis, Investigation, Methodology, Software, Supervision, Validation, Visualization, Writing – original draft, Writing – review & editing. IK: Conceptualization, Data curation, Formal analysis, Funding acquisition, Project administration, Resources, Supervision, Visualization, Writing – original draft. ST: Conceptualization, Formal analysis, Funding acquisition, Project administration, Resources, Validation, Visualization, Writing – review & editing. MT: Funding acquisition, Project administration, Resources, Writing – review & editing. NK: Funding acquisition, Project administration, Resources, Visualization, Writing – review & editing. AE: Data curation, Formal analysis, Project administration, Resources, Writing – original draft. OC: Data curation, Formal analysis, Project administration, Resources, Visualization, Writing – original draft. ME: Data curation, Formal analysis, Project administration, Resources, Visualization, Writing – original draft. SL: Data curation, Project administration, Resources, Visualization, Writing – original draft. AZ: Data curation, Project administration, Resources, Writing – original draft. ML: Conceptualization, Data curation, Formal analysis, Funding acquisition, Investigation, Methodology, Project administration, Resources, Software, Supervision, Validation, Visualization, Writing – original draft, Writing – review & editing.
Funding
The author(s) declare that financial support was received for the research and/or publication of this article. This work was supported by the River Basin Agency of Bouregreg and Chaouia, the River Basin Agency of Loukkos, and the Research and Water Planning Directorate of Morocco. It was funded by the Institut de Recherche pour le Développement (IRD) through the JEAI PESAS project. The research was conducted at the Laboratory of Geosciences, Water, and Environment, Faculty of Sciences, Mohamed V University of Rabat, Morocco.
Conflict of interest
The authors declare that the research was conducted in the absence of any commercial or financial relationships that could be construed as a potential conflict of interest.
Generative AI statement
The authors declare that no Gen AI was used in the creation of this manuscript.
Publisher’s note
All claims expressed in this article are solely those of the authors and do not necessarily represent those of their affiliated organizations, or those of the publisher, the editors and the reviewers. Any product that may be evaluated in this article, or claim that may be made by its manufacturer, is not guaranteed or endorsed by the publisher.
References
Abbaspour, K.C., (2013). SWAT-CUP 2012: SWAT Calibration and Uncertainty Programs—A User Manual. Eawag: Swiss Federal Institute of Aquatic Science and Technology.
Agarwal, V., Akyilmaz, O., Shum, C. K., and Feng, W. (2024). Machine learning-based spatiotemporal downscaling of satellite gravimetry groundwater storage variations in North China plain : SSRN.
Agarwal, V., Akyilmaz, O., Shum, C. K., Feng, W., Yang, T. Y., Forootan, E., et al. (2023). Uz: machine learning based downscaling of GRACE-estimated groundwater in Central Valley, California. Sci. Total Environ. 865:161138. doi: 10.1016/j.scitotenv.2022.161138
Ahmed, M., Aqnouy, M., and El Messari, J. S. (2021). Sustainability of Morocco’s groundwater resources in response to natural and anthropogenic forces. J. Hydrol. 603:126866. doi: 10.1016/j.jhydrol.2021.126866
Ait Dhmane, L., Saidi, M. E., Moustadraf, J., Rafik, A., and Hadri, A. (2024). Spatiotemporal characterization and hydrological impact of drought patterns in northwestern Morocco. Front. Water 6:1463748. doi: 10.3389/frwa.2024.1463748
Al-Abadi, A. M., Hassan, A. A., Al-Moosawi, N. M., Handhal, A. M., Alzahrani, H., Jabbar, F. K., et al. (2024). Drought susceptibility mapping in Iraq using GRACE/GRACE-FO, GLDAS, and machine learning algorithms. Physics Chemistry Earth Parts A/B/C 134:103583. doi: 10.1016/j.pce.2024.103583
Alghafli, K., Shi, X., Sloan, W., Shamsudduha, M., Tang, Q., Sefelnasr, A., et al. (2023). Groundwater recharge estimation using in-situ and GRACE observations in the eastern region of the United Arab Emirates. Sci. Total Environ. 867:161489. doi: 10.1016/j.scitotenv.2023.161489
Ali, S., Khorrami, B., Jehanzaib, M., Tariq, A., Ajmal, M., Arshad, A., et al. (2023). Spatial downscaling of GRACE data based on XGBoost model for improved understanding of hydrological droughts in the Indus Basin irrigation system (IBIS). Remote Sens. 15:873. doi: 10.3390/rs15040873
Ali, S., Liu, D., Fu, Q., Cheema, M. J. M., Pham, Q. B., Rahaman, M. M., et al. (2021). Improving the resolution of GRACE data for spatio-temporal groundwater storage assessment. Remote Sens. 13:3513. doi: 10.3390/rs13173513
Ameur, F., Amichi, H., Kuper, M., and Hammani, A. (2017). Specifying the differentiated contribution of farmers to groundwater depletion in two irrigated areas in North Africa. Hydrogeol. J. 25, 1579–1591. doi: 10.1007/s10040-017-1569-1
Armon, M., de Vries, A. J., Marra, F., Peleg, N., and Wernli, H. (2024). Saharan rainfall climatology and its relationship with surface cyclones. Weather Climate Extremes 43:100638. doi: 10.1016/j.wace.2023.100638
Arshad, A., Mirchi, M., and Samimi, B. (2022). Ahmad: combining downscaled-GRACE data with SWAT to improve the estimation of groundwater storage and depletion variations in the irrigated Indus Basin (IIB). Sci. Total Environ. 838:156044.
Arshad, A., Mirchi, A., and Taghvaeian, S. (2024). Downscaled-GRACE data reveal anthropogenic and climate-induced water storage decline across the Indus Basin. Water Resour. Res. 60:5882. doi: 10.1029/2023WR035882
Bai, P., Liu, X., and Liu, C. (2018). Improving hydrological simulations by incorporating GRACE data for model calibration. J. Hydrol. 557, 291–304. doi: 10.1016/j.jhydrol.2017.12.025
Belahsen, S., Khellaf, A., and Belahsen, M. (2016). Evaluation de la stratégie agricole du Maroc (Plan Maroc Vert): Une analyse en équilibre général dynamique. Dossiers de Recherches en Economie et Gestion 5, 1–22.
Benassi, M. (2008). Drought and climate change in Morocco. Analysis of precipitation field and water supply. In In A. López-Francos (Ed.), Drought Management: Scientific and Technological Innovations, Options Méditerranéennes: Série A. Séminaires Méditerranéens, No. 80. 80, 83–87.
Bennouna, A. (2020). Gestion de l'eau au Maroc et changement climatique. Espace Géographique et Société Marocaine 32, 1–15.
Bikše, J., Retike, I., Haaf, E., and Kalvāns, A. (2023). Assessing automated gap imputation of regional scale groundwater level data sets with typical gap patterns. J. Hydrol. 620:129424. doi: 10.1016/j.jhydrol.2023.129424
Bouizrou, I., Bouadila, A., Aqnouy, M., and Gourfi, A. (2023). Assessment of remotely sensed precipitation products for climatic and hydrological studies in arid to semi-arid data-scarce region, Central-Western Morocco. Remote Sensing Appl. 30:100976. doi: 10.1016/j.rsase.2023.100976
Bouramtane, T., Leblanc, M., Kacimi, I., Ouatiki, H., and Boudhar, A. (2023). The contribution of remote sensing and input feature selection for groundwater level prediction using LSTM neural networks in the Oum Er-Rbia Basin, Morocco. Front. Water 5:1241451. doi: 10.3389/frwa.2023.1241451
Bouramtane, T., Tiouiouine, A., Kacimi, I., Valles, V., Talih, A., Kassou, N., et al. (2020c). Drainage network patterns determinism: a comparison in arid, semi-arid and semi-humid area of Morocco using multifactorial approach. Hydrology 7:87. doi: 10.3390/hydrology7040087
Bouramtane, T., Yameogo, S., Touzani, M., Tiouiouine, A., el Janati, M.'h., Ouardi, J., et al. (2020b). Statistical approach of factors controlling drainage network patterns in arid areas. Application to the eastern anti atlas (Morocco). J. Afr. Earth Sci. 162:103707. doi: 10.1016/j.jafrearsci.2019.103707
Bouramtane, T., et al. (2020a). Drainage network patterns determinism: a comparison in arid, semi-arid and semi-humid area of Morocco using multifactorial approach. Hydrology 7:4.
Brahim, Y. A., Saidi, M. E. M., Kouraiss, K., Sifeddine, A., and Bouchaou, L. (2017). Analysis of observed climate trends and high resolution scenarios for the 21st century in Morocco. J Mater Environ Sci 8, 1375–1384.
Carabajal, C. C., and Boy, J. P. (2021). Lake and reservoir volume variations in South America from radar altimetry, ICESat laser altimetry, and GRACE time-variable gravity. Adv. Space Res. 68, 652–671. doi: 10.1016/j.asr.2020.04.022
Cavelan, A., Golfier, F., Colombano, S., Davarzani, H., Deparis, J., Faure, P., et al. (2022). A critical review of the influence of groundwater level fluctuations and land surface temperatureon LNAPL contaminations in the context of climate change. Sci. Total Environ. 806:150412. doi: 10.1016/j.scitotenv.2021.150412
Chao, L., Zhang, K., Wang, J., Feng, J., and Zhang, M. (2021). A comprehensive evaluation of five evapotranspiration datasets based on ground and grace satellite observations: implications for improvement of evapotranspiration retrieval algorithm. Remote Sens. 13:2414. doi: 10.3390/rs13122414
Chen, L., He, Q., Liu, K., Li, J., and Jing, C. (2019). Downscaling of GRACE-derived groundwater storage based on the random forest model. Remote Sens. 11:2979. doi: 10.3390/rs11242979
Chen, Z., Zheng, W., Yin, W., Li, X., Zhang, G., and Zhang, J. (2021). Improving the spatial resolution of GRACE-derived terrestrial water storage changes in small areas using the machine learning spatial downscaling method. Remote Sens. 13:4760. doi: 10.3390/rs13234760
Cui, L., Li, Y., Zhong, B., An, J., and Meng, J. (2024). Assessing the impact of 2022 extreme drought on the Yangtze River basin using downscaled GRACE/GRACE-FO data obtained by partitioned random Forest. Int. J. Remote Sens.
Cui, L., Zhu, C., Wu, Y., Yao, C., Wang, X., An, J., et al. (2022). Natural-and human-induced influences on terrestrial water storage change in Sichuan, Southwest China from 2003 to 2020. Remote Sens. 14:1369. doi: 10.3390/rs14061369
Davis, J. L., Elósegui, P., Mitrovica, J. X., and Tamisiea, M. E. (2008). A statistical filtering 986 approach for Gravity Recovery and Climate Experiment (GRACE) gravity data. Journal of 987 Geophysical Research: Solid Earth, 113. doi: 10.1029/2007JB005043
Dembélé, Moctar. "Spatially explicit hydrological modelling for water accounting under climate change in the Volta river basin in West Africa." Université de Lausanne, Faculté des géosciences et de l’environnement 10. (2020).
Deng, H., Chen, Y., and Chen, X. (2022). Driving factors and changes in components of terrestrial water storage in the endorheic Tibetan plateau. J. Hydrol. 612:128225. doi: 10.1016/j.jhydrol.2022.128225
Direction Générale de l’Hydraulique (2023). L’hydraulique En Chiffres. Ministère de 992 l’Équipement et de l’Eau, Royaume du Maroc: Maroc.
Dong, C., and Menzel, L. (2020). Recent snow cover changes over central European low mountain ranges. Hydrol. Process. 34, 321–338. doi: 10.1002/hyp.13586
Driouech, Fatima. Distribution des précipitations hivernales sur le Maroc dans le cadre d'un changement climatique: descente d'échelle et incertitudes. Diss. Institut National Polytechnique de Toulouse-INPT. (2010).
El Meknassi Yousoufi, E., Hammani, A., Kuper, M., Bouarfa, S., and Vallée, D. (2024). Water accounting in the Berrechid plain (Morocco): a process approach. Irrig. Drain. 73, 180–197. doi: 10.1002/ird.2858
El Ouali, A., Roubil, A., Lahrach, A., Moudden, F., Ouzerbane, Z., Hammani, O., et al. (2023). Assessment of groundwater quality and its recharge mechanisms using hydrogeochemical and isotopic data in the Tafilalet plain (South-Eastern Morocco). Medit. Geosci. Rev. 5, 1–14. t, 834, 155328. doi: 10.1007/s42990-023-00096-1
El-Yazidi, M., Dafouf, S., El-Yazidi, O., and Benabdelhadi, M. (2024). “Characterization of climatic drought in the Souss-Massa watershed (Morocco) using the standardized precipitation index (SPI)” in BIO Web of Conferences, vol. 109 (EDP Sciences), 01032.
El Ajhar, L., El Harchi, M., and El Moutaki, S.. (2018). Evolution de la pluviométrie de 1960 à 2015 au Maroc. Int. J. Res. Sci. Manag. 5, 47–56.
Farr, T. G., Rosen, P. A., Caro, E., Crippen, R., Duren, R., Hensley, S., et al. (2007). The Shuttle Radar Topography Mission. Reviews of Geophysics 45, RG2004. doi: 10.1029/2005RG000183
Ferreira, V., Yong, B., Montecino, H., Ndehedehe, C. E., Seitz, K., Kutterer, H., et al. (2023). Estimating GRACE terrestrial water storage anomaly using an improved point mass solution. Scientific Data 10:234. doi: 10.1038/s41597-023-02122-1
Foroumandi, E., Nourani, V., Jeanne Huang, J., and Moradkhani, H. (2023). Drought monitoring by downscaling GRACE-derived terrestrial water storage anomalies: a deep learning approach. J. Hydrol. 616:128838. doi: 10.1016/j.jhydrol.2022.128838
Gao, G., Zhao, J., Wang, J., Zhao, G., Chen, J., and Li, Z. (2022). Spatiotemporal variation and driving analysis of groundwater in the Tibetan plateau based on GRACE downscaling data. Water 14:3302. doi: 10.3390/w14203302
García-Ruiz, J. M., López-Moreno, J. I., Vicente-Serrano, S. M., Lasanta–Martínez, T., and Beguería, S. (2011). Mediterranean water resources in a global change scenario. Earth Sci. Rev. 105, 121–139. doi: 10.1016/j.earscirev.2011.01.006
Gautam, P. K., Chandra, S., and Henry, P. K. (2024). Monitoring of the groundwater level using GRACE with GLDAS satellite data in ganga plain, India to understand the challenges of groundwater, depletion, problems, and strategies for mitigation. Environ. Challenges 15:100874. doi: 10.1016/j.envc.2024.100874
Gemitzi, A., Koutsias, N., and Lakshmi, V. (2021). A spatial downscaling methodology for GRACE total water storage anomalies using GPM IMERG precipitation estimates. Remote Sens. 13:5149. doi: 10.3390/rs13245149
Gonçalvès, J., Séraphin, P., Stieglitz, T., Chekireb, A., Hamelin, B., and Deschamps, P. (2021). Coastal aquifer recharge and groundwater–seawater exchanges using downscaled GRACE data: case study of the Djeffara plain (Libya–Tunisia). Comptes Rendus. Géoscience 353, 297–318. doi: 10.5802/crgeos.74
Gou, J., and Soja, B. (2024). Global high-resolution total water storage anomalies from self-supervised data assimilation using deep learning algorithms. Nature Water, 1–12.
Gouahi, S., Hssaisoune, M., Nehmadou, M., Bouaakkaz, B., Boudhair, H., and Bouchaou, L. (2023). Spatio-temporal assessment of groundwater drought risk in the Souss-Massa aquifer: Impacts of climate variability and anthropogenic activity. In EGU general assembly conference abstracts (pp. EGU-14822).
Guerschman, J. P., McVicar, T. R., Vleeshower, J., van Niel, T. G., Peña-Arancibia, J. L., and Chen, Y. (2022). Estimating actual evapotranspiration at field-to-continent scales by calibrating the CMRSET algorithm with MODIS, VIIRS, Landsat and Sentinel-2 data. J. Hydrol. 605:127318. doi: 10.1016/j.jhydrol.2021.127318
Gumus, V., El Moçayd, N., Seker, M., and Seaid, M. (2024). Future projection of droughts in Morocco and potential impact on agriculture. J. Environ. Manag. 367:122019. doi: 10.1016/j.jenvman.2024.122019
Guo, X., Lian, Y., Sun, Y., Zhou, H., and Luo, Z. (2024). Assessment of the added value of the GOCE GPS data on the GRACE monthly gravity field solutions. Remote Sens. 16:1586. doi: 10.3390/rs16091586
Hachem, A., Mili, E. M., Benbella, B., El Ouardi, H., and Mehdaoui, R. (2023). Characterization of climatic drought sequences in the upper Moulouya watershed, vol. 24. Morocco: Ecological Engineering & Environmental Technology, 162–179.
Hadri, A., Saidi, M. E. M., and Boudhar, A. (2021). Multiscale drought monitoring and comparison using remote sensing in a Mediterranean arid region: a case study from west-Central Morocco. Arab. J. Geosci. 14, 1–18. doi: 10.1007/s12517-021-06493-w
Hamdi, Mohamed. Réponse d'un système aquifère aux changements climatiques et au stress anthropique: apport de la modélisation numérique et la gravimétrie satellitaire. Diss. Université de Sherbrooke, (2023).
Hamid, M., Aguerd, J., and El Ghachi, M. (2024). “Climatic drought in the Hydraulic Basin of Oum Er Rbia, Morocco (1980–2021): statistical and cartographic analysis” in Climate change effects and sustainability needs: The case of Morocco, Ed. R. T. Benslimane (Springer Nature Switzerland: Cham), 65–77.
Hammoudy, Wahib, Ilmen, Rachid, and Sinan, Mohamed. Impact du changement climatique sur les extrêmes de températures au Maroc. 35ème colloque annuel de l’Association Internationale de Climatologie: Le changement climatique, les risques et l'adaptation. (2022).
He, H., Yang, K., Wang, S., Petrosians, H. A., Liu, M., Li, J., et al. (2021). Deep learning approaches to spatial downscaling of GRACE terrestrial water storage products using EALCO model over Canada. Can. J. Remote. Sens. 47, 657–675. doi: 10.1080/07038992.2021.1954498
Herrera, E., Ouarda, T. B. M. J., and Bobée, B. (2006). Downscaling methods applied to atmosphere-ocean general circulation models (AOGCM). Méthodes de désagrégation Appliquées aux Modèles du Climat Global Atmosphère-Océan (MCGAO) 19, 297–312.
Hssaisoune, M., Bouchaou, L., Sifeddine, A., Bouimetarhan, I., and Chehbouni, A. (2020). Moroccan groundwater resources and evolution with global climate changes. Geosciences 10:81. doi: 10.3390/geosciences10020081
Hu, Z., Zhou, Q., Chen, X., Chen, D., Li, J., Guo, M., et al. (2019). Groundwater depletion estimated from GRACE: a challenge of sustainable development in an arid region of Central Asia. Remote Sens. 11:1908. doi: 10.3390/rs11161908
Jain, S., Srivastava, A., Khadke, L., Chatterjee, U., and Elbeltagi, A. (2024). Global-scale water security and desertification management amidst climate change. Environ. Sci. Pollut. Res. 31, 58720–58744. doi: 10.1007/s11356-024-34916-0
Jasechko, S., Seybold, H., Perrone, D., Fan, Y., Shamsudduha, M., Taylor, R. G., et al. (2024). Rapid groundwater decline and some cases of recovery in aquifers globally. Nature 625, 715–721. doi: 10.1038/s41586-023-06879-8
Jeffcoat, S., Baughman, D., and Thomas, P. M. (2009). Total water management strategies for utility master planning. J. Am. Water Works Ass. 101, 56–64. doi: 10.1002/j.1551-8833.2009.tb09839.x
Jyolsna, P. J., Kambhammettu, B. V. N. P., and Gorugantula, S. (2021). Application of random forest and multi-linear regression methods in downscaling GRACE derived groundwater storage changes. Hydrol. Sci. J. 66, 874–887. doi: 10.1080/02626667.2021.1896719
Kafy, A.-A., Rahman, M. A., Islam, M. T., and Islam, M. TS. (2021). Prediction of seasonal urban thermal field variance index using machine learning algorithms in Cumilla, Bangladesh. Sustain. Cities Soc. 64:102542. doi: 10.1016/j.scs.2020.102542
Kalu, I., Ndehedehe, C. E., and Ferreira, V. G. (2024). Remote sensing estimation of shallow and deep aquifer response to precipitation-based recharge through downscaling. Water Resour. Res. 60. doi: 10.1029/2024WR037360
Kang, S., Su, X., Tong, L., Shi, P., Yang, X., Abe, Y., et al. (2004). The impacts of human activities on the water–land environment of the Shiyang River basin, an arid region in Northwest China/les impacts des activités humaines Sur l’environnement pédo-hydrologique du bassin de la Rivière Shiyang, Une région aride du Nord-Ouest de la chine. Hydrol. Sci. J. 49, 413–427. doi: 10.1623/hysj.49.3.413.54347
Karunakalage, A. A., Kannaujiya, S., Chatterjee, R. S., Taloor, A. K., Pranjal, P., Chauhan, P., et al. (2021a). “Groundwater storage assessment using effective downscaling grace data in water-stressed regions of India” in Water, cryosphere, and climate change in the Himalayas: A geospatial approach (Cham: Springer International Publishing), 245–233.
Karunakalage, A., et al. (2021b). The appraisal of groundwater storage dwindling effect, by applying high resolution downscaling GRACE data in and around Mehsana district, Gujarat, India. Groundwater Sustain. Dev. 13:100559.
Khalki, E., Mahdi, E., et al. (2021). Climate change impacts on surface water resources in the Oued El Abid basin, Morocco. Hydrol. Sci. J. 66, 2132–2145. doi: 10.1080/02626667.2021.1982137
Khorrami, B. (2023). Satellite-based investigation of water stress at the basin scale: an integrated analysis of downscaled GRACE estimates and remotely sensed data. J. Hydroinf. 25, 1501–1512. doi: 10.2166/hydro.2023.062
Kim, J. (2009). Development of a satellite-based evapotranspiration algorithm for semi-arid regions. Los Angeles: University of California.
Knipper, K., Hogue, T., Scott, R., and Franz, K. (2017). Evapotranspiration estimates derived using multi-platform remote sensing in a semiarid region. Remote Sens. 9:184. doi: 10.3390/rs9030184
Knippertz, P., Christoph, M., and Speth, P. (2003). Long-term precipitation variability in Morocco and the link to the large-scale circulation in recent and future climates. Meteorog. Atmos. Phys. 83, 67–88. doi: 10.1007/s00703-002-0561-y
Kuper, M., Hammani, A., Chohin, A., Garin, P., and Saaf, M. (2012). When groundwater takes over: linking 40 years of agricultural and groundwater dynamics in a large-scale irrigation scheme in Morocco. Irrig. Drain. 61, 45–53. doi: 10.1002/ird.1653
Lachgar, R., Badri, W., and Chlaida, M. (2022). Assessment of future changes in downscaled temperature and precipitation over the Casablanca-Settat region (Morocco). Modeling Earth Systems Environment 8, 2123–2133. doi: 10.1007/s40808-021-01213-5
Lee, T., and Jeong, C. (2014). Nonparametric statistical temporal downscaling of daily precipitation to hourly precipitation and implications for climate change scenarios. J. Hydrol. 510, 182–196. doi: 10.1016/j.jhydrol.2013.12.027
Longuevergne, L., Scanlon, B. R., and Wilson, C. R. (2010). GRACE hydrological estimates for small basins: evaluating processing approaches on the High Plains aquifer, USA. Water Resour. Res. 46. doi: 10.1029/2009WR008564
Longuevergne, L., Wilson, C. R., Scanlon, B. R., and Crétaux, J. F. (2013). GRACE water storage estimates for the Middle East and other regions with significant reservoir and lake storage. Hydrol. Earth Syst. Sci. 17, 4817–4830. doi: 10.5194/hess-17-4817-2013
Loomis, B. D., Felikson, D., Sabaka, T. J., and Medley, B. (2021). High-spatial-resolution mass rates from GRACE and GRACE-FO: global and ice sheet analyses. Journal of geophysical research: solid. Earth 126:e2021JB023024. doi: 10.1029/2021JB023024
Ma, Z., Dong, C., Lin, K., Yan, Y., Luo, J., Jiang, D., et al. (2022). A global 250-m downscaled NDVI product from 1982 to 2018. Remote Sens. 14:3639. doi: 10.3390/rs14153639
Magruder, L., Neuenschwander, A., and Klotz, B. (2021). Digital terrain model elevation corrections using space-based imagery and ICESat-2 laser altimetry. Remote Sens. Environ. 264:112621. doi: 10.1016/j.rse.2021.112621
Mahdaoui, K., Chafiq, T., Asmlal, L., and Tahiri, M. (2024). Assessing hydrological response to future climate change in the Bouregreg Watershed, Morocco. Scientific African 23:e02046. doi: 10.1016/j.sciaf.2023.e02046
Massuel, S., Amichi, F., Ameur, F., Calvez, R., Jenhaoui, Z., Bouarfa, S., et al. (2017). Considering groundwater use to improve the assessment of groundwater pumping for irrigation in North Africa. Hydrogeol. J. 25, 1565–1577. doi: 10.1007/s10040-017-1573-5
Melati, M. D., Athayde, G. B., Fan, F. M., Garcia, L. H., and de Vasconcelos Muller Athayde, C. (2023). Monitoring groundwater storage in a fractured volcanic aquifer system. Environ. Monit. Assess. 195:385. doi: 10.1007/s10661-023-10978-4
Melati, M. D., Fleischmann, A. S., Fan, F. M., Paiva, R. C., and Athayde, G. B. (2019). Estimates of groundwater depletion under extreme drought in the Brazilian semi-arid region using GRACE satellite data: application for a small-scale aquifer. Hydrogeol. J. 27, 2789–2802. doi: 10.1007/s10040-019-02065-1
Milewski, A., Elkadiri, R., and Durham, M. (2015). Assessment and comparison of TMPA satellite precipitation products in varying climatic and topographic regimes in Morocco. Remote Sens. 7, 5697–5717. doi: 10.3390/rs70505697
Milewski, A. M., Durham, M. C., and El Kadiri Sabaka, R.. "Spatial downscaling of GRACE TWSA data to identify spatiotemporal groundwater level trends in the upper Floridan Aquifer, Georgia, USA." Remote Sensing. (2019). 2756.
Miro, M. E., and Famiglietti, J. S. (2018). Downscaling GRACE remote sensing datasets to high-resolution groundwater storage change maps of California’s Central Valley. Remote Sens. 10:143. doi: 10.3390/rs10010143
Mohtaram, A., and Shafizadeh-Moghadam, H. (2025). A flexible multi-scale approach for downscaling GRACE-derived groundwater storage anomaly using light GBM and random Forest. J. Hydrol.
Mudd, S. M. (2020). “Topographic data from satellites” in Developments in earth surface processes, (Amsterdam: Elsevier), 23:91–128.
Ndehedehe, C. E., Ferreira, V. G., and Agutu, N. O. (2019). Hydrological controls on surface vegetation dynamics over west and Central Africa. Ecol. Indic. 103, 494–508. doi: 10.1016/j.ecolind.2019.04.032
Ning, S., Ishidaia, A., and Wang, J. (2014). Statistical downscaling of grace-derived terrestrial water storage using satellite and Gldas products. J Japan Soc Civ Eng Ser B1 70, I_133–I_138.
Othman, M., Ayoub, S., Mohamed, S., Qarro, M., Mustapha, N., Mohamed, C., et al. (2022). Water in Morocco, retrospective at the political, regulatory and institutional levels. Open J. Modern Hydrol. 12, 11–31. doi: 10.4236/ojmh.2022.122002
Ouassanouan, Y., Fakir, Y., Simonneaux, V., Kharrou, M. H., Bouimouass, H., Najar, I., et al. (2022). Multi-decadal analysis of water resources and agricultural change in a Mediterranean semiarid irrigated piedmont under water scarcity and human interaction. Sci. Total Environ. 834:155328. doi: 10.1016/j.scitotenv.2022.155328
Ouatiki, H., Boudhar, A., Leblanc, M., Fakir, Y., and Chehbouni, A. (2022). When climate variability partly compensates for groundwater depletion: An analysis of the GRACE signal in Morocco. J. Hydrol. Reg. Stud. 42, 101177. doi: 10.1016/j.ejrh.2022.101177
Ouhamdouch, S., and Bahir, M. (2017). Climate change impact on future rainfall and temperature in semi-arid areas (Essaouira Basin, Morocco). Environ. Process. 4, 975–990. doi: 10.1007/s40710-017-0265-4
Ouhamdouch, S., Bahir, M., and Carreira, P. M. (2018). Impact du changement climatique sur la ressource en eau en milieu semi-aride: exemple du bassin d'Essaouira (Maroc). Revue des Sciences de l’Eau 31, 13–27. doi: 10.7202/1047050ar
Oussou, F. E., Yalo, N., Ndehedehe, C. E., Oloukoi, J., Alassane, A., Boukari, M., et al. (2022). Fracture aquifers identification in the Zou basin (West Africa) using remote sensing and GIS. Geocarto Int. 37, 3199–3222. doi: 10.1080/10106049.2020.1852613
Pascal, Claire. Cartographie multi-échelle des ressources en eau sur les régions irriguées: une approche par télédétection multi-capteurs. Diss. Université Paul Sabatier-Toulouse III. (2022).
Pascal, C., Ferrant, S., Selles, A., Maréchal, J. C., Paswan, A., and Merlin, O. (2022). Evaluating downscaling methods of GRACE (gravity recovery and climate experiment) data: a case study over a fractured crystalline aquifer in southern India. Hydrol. Earth Syst. Sci. 26, 4169–4186. doi: 10.5194/hess-26-4169-2022
Pellet, V., Aires, F., Alfieri, L., and Bruno, G. (2024). A physical/statistical data-fusion for the dynamical downscaling of GRACE data at daily and 1 km resolution. J. Hydrol. 628:130565. doi: 10.1016/j.jhydrol.2023.130565
Pertiwi, M., Muhammad, J., and Farma, R. (2020). Analysis of shallow well depth prediction: A study of temporal variation of GRACE satellite data in Tampan District-Pekanbaru, Indonesia. Science, Technology, and Communication Journal, 1, 27–36.
Pulido-Bosch, A., Rigol-Sanchez, J. P., Vallejos, A., Andreu, J. M., Ceron, J. C., Molina-Sanchez, L., et al. (2018). Impacts of agricultural irrigation on groundwater salinity. Environ. Earth Sci. 77, 1–14. doi: 10.1007/s12665-018-7386-6
Pulla, S. T., Yasarer, H., and Yarbrough, L. D. (2023). GRACE Downscaler: a framework to develop and evaluate downscaling models for GRACE. Remote Sens. 15:2247. doi: 10.3390/rs15092247
Qadem, Z., and Tayfur, G. (2024). In-depth exploration of temperature trends in Morocco: combining traditional methods of Mann Kendall with innovative ITA and IPTA approaches. Pure Appl. Geophys. 181, 2717–2739. doi: 10.1007/s00024-024-03535-8
Rahaman, M. M., Haider, M. R., Hassan, Q. K., and Dewan, A. (2019). Estimating high-resolution groundwater storage from GRACE: A random forest approach. Environments, 6, 63. doi: 10.3390/environments6060063
Rafik, A. (2023). Groundwater level forecasting in a data-scarce region through remote sensing data downscaling, hydrological modeling, and machine learning: a case study from Morocco. J. Hydrol. 50:101569.
Rousta, I., Olafsson, H., Nasserzadeh, M. H., Zhang, H., Krzyszczak, J., and Baranowski, P. (2021). Dynamics of daytime land surface temperature (LST) variabilities in the Middle East countries during 2001–2018. Pure Appl. Geophys. 178, 2357–2377. doi: 10.1007/s00024-021-02765-4
Sabale, R., Venkatesh, B., and Jose, M. (2023). Sustainable water resource management through conjunctive use of groundwater and surface water: a review. Innov. Infrastruct. Solut. 8:17. doi: 10.1007/s41062-022-00992-9
Sahour, H., Sultan, M., Vazifedan, M., Abdelmohsen, K., Karki, S., Yellich, J. A., et al. (2020). Statistical applications to downscale GRACE-derived terrestrial water storage data and to fill temporal gaps. Remote Sens. 12:533. doi: 10.3390/rs12030533
Satizábal-Alarcón, D. A., Suhogusoff, A., and Ferrari, L. C. (2024). Characterization of groundwater storage changes in the Amazon River basin based on downscaling of GRACE/GRACE-FO data with machine learning models. Sci. Total Environ. 912:168958. doi: 10.1016/j.scitotenv.2023.168958
Scanlon, B. R., Fakhreddine, S., Rateb, A., de Graaf, I., Famiglietti, J., Gleeson, T., et al. (2023). Global water resources and the role of groundwater in a resilient water future. Nature Reviews Earth Environ. 4, 87–101. doi: 10.1038/s43017-022-00378-6
Schilling, J., Freier, K. P., Hertig, E., and Scheffran, J. (2012). Climate change, vulnerability and adaptation in North Africa with focus on Morocco. Agric. Ecosyst. Environ. 156:12–26. doi: 10.1016/j.agee.2012.04.021
Schyns, J. F., and Hoekstra, A. Y. (2014). The added value of water footprint assessment for National Water Policy: a case study for Morocco. PLoS One 9:e99705. doi: 10.1371/journal.pone.0099705
Seo, K. W., Wilson, C. R., Famiglietti, J. S., Chen, J. L., and Rodell, M. (2006). Terrestrial water mass load changes from gravity recovery and climate experiment (GRACE). Water Resour. Res. 42. doi: 10.1029/2005WR004255
Seyoum, W. M., Kwon, D., and Milewski, A. M. (2019). Downscaling GRACE TWSA data into high-resolution groundwater level anomaly using machine learning-based models in a glacial aquifer system. Remote Sens. 11:824. doi: 10.3390/rs11070824
Shen, H., Chen, J., Zhou, Y., Hong, Y., Chen, Y., and Cheng, G. (2015). Groundwater depletion in the Hai River Basin, China, from in situ and GRACE observations. Hydrological Sciences Journal, 60, 671–687. doi: 10.1080/02626667.2014.891473
Sherif, M., Liaqat, M. U., Baig, F., and Al-Rashed, M. (2023). Water resources availability, sustainability and challenges in the GCC countries: An overview. Heliyon 9:e20543. doi: 10.1016/j.heliyon.2023.e20543
Shi, Z., Wang, Z., Zhang, B., and Zhang, G. (2024). Improving the spatial resolution of GRACE-derived ice sheet mass change in Antarctica. IEEE Trans. Geosci. Remote Sens.
Singh, D., Zhu, Y., Liu, S., Srivastava, P. K., Dharpure, J. K., Chatterjee, D., et al. (2022). Exploring the links between variations in snow cover area and climatic variables in a Himalayan catchment using earth observations and CMIP6 climate change scenarios. J. Hydrol. 608:127648. doi: 10.1016/j.jhydrol.2022.127648
Soltani, S. S., Ataie-Ashtiani, B., and Simmons, C. T. (2021). Review of assimilating GRACE terrestrial water storage data into hydrological models: advances, challenges and opportunities. Earth Sci. Rev. 213:103487. doi: 10.1016/j.earscirev.2020.103487
Sun, J., Hu, L., Chen, F., Sun, K., Yu, L., and Liu, X.. (2023a). A dynamical downscaling method of groundwater storage changes using GRACE data. J. Hydrol. Reg. Stud. 50:101558.
Tapley, B. D., Watkins, M. M., Flechtner, F., Reigber, C., Bettadpur, S., Rodell, M., et al. (2019). Contributions of GRACE to understanding climate change. Nat. Clim. Chang. 9, 358–369. doi: 10.1038/s41558-019-0456-2
Tariq, A., and Shu, H. (2020). CA-Markov chain analysis of seasonal land surface temperature and land use land cover change using optical multi-temporal satellite data of Faisalabad, Pakistan. Remote Sens. 12:3402. doi: 10.3390/rs12203402
Tian, J., Chen, Y., Wang, S., Chen, X., and Cheng, H. (2024). Spatiotemporal monitoring of water storage in the North China plain from 2002 to 2022 based on an improved GRACE downscaling method. SSRN.
Touchan, R., Anchukaitis, K. J., Meko, D. M., Sabir, M., Attalah, S., and Aloui, A. (2011). Spatiotemporal drought variability in northwestern Africa over the last nine centuries. Clim. Dyn. 37, 237–252. doi: 10.1007/s00382-010-0804-4
Tramblay, Y., Badi, W., Driouech, F., El Adlouni, S., Neppel, L., and Servat, E. (2012). Climate change impacts on extreme precipitation in Morocco. Glob. Planet. Chang. 82-83, 104–114. doi: 10.1016/j.gloplacha.2011.12.002
Tweed, S., Celle-Jeanton, H., Cabot, L., Huneau, F., Montety, D. E., Nicolau, V., et al. (2018). Impact of irrigated agriculture on groundwater resources in a temperate humid region. Sci. Total Environ. 613-614, 1302–1316. doi: 10.1016/j.scitotenv.2017.09.156
Tyralis, H., Papacharalampous, G., and Langousis, A. (2019). A brief review of random forests for water scientists and practitioners and their recent history in water resources. Water 11:910. doi: 10.3390/w11050910
Vishwakarma, B. D., Zhang, J., and Sneeuw, N. (2021). Downscaling GRACE total water storage change using partial least squares regression. Scientific data 8:95. doi: 10.1038/s41597-021-00862-6
Wang, L., Chen, C., Thomas, M., Kaban, M. K., Güntner, A., and Du, J. (2018). Increased water storage of Lake Qinghai during 2004–2012 from GRACE data, hydrological models, radar altimetry and in situ measurements. Geophys. J. Int. 212, 679–693. doi: 10.1093/gji/ggx443
Wang, L., Kaban, M. K., Thomas, M., Chen, C., and Ma, X. (2019). The challenge of spatial resolutions for GRACE-based estimates volume changes of larger man-made lake: the case of China’s three gorges reservoir in the Yangtze River. Remote Sens. 11:99. doi: 10.3390/rs11010099
Wang, Y., Li, C., Cui, Y., Cui, Y., Xu, Y., Hora, T., et al. (2024). Spatial downscaling of GRACE-derived groundwater storage changes across diverse climates and human interventions with random forests. J. Hydrol. 640:131708. doi: 10.1016/j.jhydrol.2024.131708
Wang, G., et al. (2020). A universal ratio snow index for fractional snow cover estimation. IEEE Geosci. Remote Sens. Lett. 18, 721–725.
Wheater, H. S. (2002). Hydrological processes in arid and semi-arid areas. Hydrol. Wadi Syst., 5–22.
Winkler, M., Schellander, H., and Gruber, S. (2021). Snow water equivalents exclusively from snow depths and their temporal changes: the Δ snow model. Hydrol. Earth Syst. Sci. 25, 1165–1187. doi: 10.5194/hess-25-1165-2021
Wouters, B., Bonin, J. A., Chambers, D. P., Riva, R. E., Sasgen, I., and Wahr, J. (2014). GRACE, time-varying gravity, earth system dynamics and climate change. Rep. Prog. Phys. 77:116801. doi: 10.1088/0034-4885/77/11/116801
Xie, X., He, B., Guo, L., Miao, C., and Zhang, Y. (2019). Detecting hotspots of interactions between vegetation greenness and terrestrial water storage using satellite observations. Remote Sens. Environ. 231:111259. doi: 10.1016/j.rse.2019.111259
Xu, L., Ferris, D., Huggins, X., Wong, J. S., Mohan, C., Sadri, S., et al. (2023). From coarse resolution to practical solution: GRACE as a science communication and policymaking tool for sustainable groundwater management. J. Hydrol. 623:129845. doi: 10.1016/j.jhydrol.2023.129845
Xue, Y., Janjic, Z., Dudhia, J., Vasic, R., and De Sales, F. (2014). A review on regional dynamical downscaling in intraseasonal to seasonal simulation/prediction and major factors that affect downscaling ability. Atmos. Res. 147-148, 68–85. doi: 10.1016/j.atmosres.2014.05.001
Yazdian, H., Salmani-Dehaghi, N., and Alijanian, M. (2023). A spatially promoted SVM model for GRACE downscaling: using ground and satellite-based datasets. J. Hydrol. 626:130214. doi: 10.1016/j.jhydrol.2023.130214
Yin, W., Hu, L., Zhang, M., Wang, J., and Han, S. C. (2018). Statistical downscaling of GRACE-derived groundwater storage using ET data in the North China plain. J. Geophys. Res. Atmos. 123, 5973–5987. doi: 10.1029/2017JD027468
Yin, J., Zhan, X., Liu, J., Moradkhani, H., Fang, L., and Walker, J. P. (2020). Near-real-time one-kilometre Soil Moisture Active Passive soil moisture data product. Hydrol. Process. 34, 4083–4096. doi: 10.1002/hyp.13857
Zhang, L., Dobslaw, H., Stacke, T., Güntner, A., Dill, R., and Thomas, M. (2017). Validation of terrestrial water storage variations as simulated by different global numerical models with GRACE satellite observations. Hydrol. Earth Syst. Sci. 21, 821–837. doi: 10.5194/hess-21-821-2017
Zhang, D., Liu, X., and Bai, P. (2019). Assessment of hydrological drought and its recovery time for eight tributaries of the Yangtze River (China) based on downscaled GRACE data. J. Hydrol. 568, 592–603. doi: 10.1016/j.jhydrol.2018.11.030
Zhang, J., Liu, K., and Wang, M. (2021). Downscaling groundwater storage data in China to a 1-km resolution using machine learning methods. Remote Sens. 13:523. doi: 10.3390/rs13030523
Zhong, B., Li, X., Chen, J., and Li, Q. (2023). WHU-GRACE-GPD01s: a series of constrained monthly gravity field solutions derived from GRACE-based geopotential differences. Earth Space Sci. 10:2699. doi: 10.1029/2022EA002699
Zhong, D., Wang, S., and Li, J. (2021a). A self-calibration variance-component model for spatial downscaling of GRACE observations using land surface model outputs. Water Resour. Res. 57:e2020WR028944. doi: 10.1029/2020WR028944
Zhong, D., Wang, S., and Li, J. (2021b). Spatiotemporal downscaling of GRACE Total water storage using land surface model outputs. Remote Sens. 13:900. doi: 10.3390/rs13050900
Zhong, Y., Yang, R., Zhang, X., Maimaitituersun, A., and Ju, X. (2025). A comparative study of downscaling methods for groundwater based on GRACE data using RFR and GWR models in Jiangsu Province. Remote Sensing: China.
Zhou, Q., Huang, J., Hu, Z., and Yin, G. (2022). Spatial-temporal changes to GRACE-derived terrestrial water storage in response to climate change in arid Northwest China. Hydrol. Sci. J. 67, 535–549. doi: 10.1080/02626667.2022.2030060
Zhu, Y., Liu, S., Yi, Y., Xie, F., Grünwald, R., Miao, W., et al. (2021). Overview of terrestrial water storage changes over the Indus River Basin based on GRACE/GRACE-FO solutions. Sci. Total Environ. 799:149366. doi: 10.1016/j.scitotenv.2021.149366
Zkhiri, W., Tramblay, Y., Hanich, L., Jarlan, L., and Ruelland, D. (2019). Spatiotemporal characterization of current and future droughts in the high atlas basins (Morocco). Theor. Appl. Climatol. 135, 593–605. doi: 10.1007/s00704-018-2388-6
Keywords: GRACE data, total water storage, downscaling, hydrological validation, drought, Morocco
Citation: Hamou-Ali Y, Karmouda N, Mohsine I, Bouramtane T, Kacimi I, Tweed S, Tahiri M, Kassou N, El Bilali A, Chafki O, Ezzaouini MA, Laraichi S, Zerouali A and Leblanc M (2025) Downscaling GRACE total water storage data using random forest: a three-round validation approach under drought conditions. Front. Water. 7:1545821. doi: 10.3389/frwa.2025.1545821
Edited by:
Evangelos Rozos, National Observatory of Athens, GreeceReviewed by:
Raphael Schneider, Geological Survey of Denmark and Greenland, DenmarkReed Maxwell, Princeton University, United States
Copyright © 2025 Hamou-Ali, Karmouda, Mohsine, Bouramtane, Kacimi, Tweed, Tahiri, Kassou, El Bilali, Chafki, Ezzaouini, Laraichi, Zerouali and Leblanc. This is an open-access article distributed under the terms of the Creative Commons Attribution License (CC BY). The use, distribution or reproduction in other forums is permitted, provided the original author(s) and the copyright owner(s) are credited and that the original publication in this journal is cited, in accordance with accepted academic practice. No use, distribution or reproduction is permitted which does not comply with these terms.
*Correspondence: Tarik Bouramtane, dC5ib3VyYW10YW5lQHVtNXIuYWMubWE=