 Youness Hrour
 Zahra Thomas
 Pauline Rousseau-Gueutin2
 Yassine Ait-Brahim
 Ophélie Fovet
- 1Institut Agro, INRAE, SAS, Rennes, France
- 2Univ Rennes, EHESP, Rennes, France
- 3International Water Research Institute (IWRI), Mohammed VI Polytechnic University (UM6P), Ben Guerir, Morocco
Hydrological models are widely used to assess climate change effect on water resources at the catchment scale. However, data scarcity is one of the main challenges faced by hydrological modelers especially in developing countries. Remotely sensed and large-scale climatic datasets offer a viable alternative for hydrological modeling. Hence, this study evaluates CFSR-NCEP reanalysis data for discharge simulation using SWAT semi-distributed and GR4J conceptual lumped hydrological models. First, the CFSR-NCEP monthly reanalysis precipitation and temperature were compared to the observed data. Then, the performance of SWAT and GR4J models to simulate monthly discharge using both daily CFSR-NCEP reanalysis data with and without bias correction was compared across different climate conditions. Results indicated that the GR4J model performed well, with an average NSE of 0.89 across calibration and validation periods, indicating its ability to handle low-quality input data. A poor performance of the SWAT model was observed using CFSR-NCEP data without bias correction (NSE < 0.60). Primarily due to biases in meteorological data, and to low quality of spatial data. Bias correction improved both models’ performance, with NSEs exceeding 0.78 for SWAT model and 0.91 for GR4J model. Moreover, the stability of models’ performances under the three calibration periods shows that SWAT and GR4J models are, respectively, influenced and not much influenced by the climate of the calibration period. Consequently, GR4J remains valid for climate projection. Our research shows that despite their widespread use, complex physics-based hydrological models such as SWAT are often less performing in data-limited catchments. However, conceptual models prove more performing, providing valuable information for researchers and decision-makers to devise robust quantitative water resource management strategies under these challenging conditions.
1 Introduction
The effects of climate change on water resources are already evident globally (Allan et al., 2020), with the Mediterranean region being particularly the most vulnerable (Caloiero et al., 2018; Hallett et al., 2018; Hrour et al., 2022; Lionello and Scarascia, 2018; Naumann et al., 2018; Tramblay et al., 2020). Future projections suggest increasing aridity in Mediterranean basins throughout the 21st century, with a high spatial variability (Cos et al., 2022; Hrour et al., 2023; Zittis et al., 2021). These changes, associated with a growing water demand, owing to population growth and socio-economic development, intensify the pressure on water resources (Javed et al., 2020). Consequently, conflicts are arising between environmental needs and human activities, highlighting the need of an in-depth understanding of water issues, in order to develop more appropriate water resource management strategies at the local scale, particularly in arid and semi-arid contexts (Ostad-Ali-Askari et al., 2019).
Hydrological modeling is an important tool for integrated and interdisciplinary management of water resources (Badham et al., 2019; Devia et al., 2015; Hermassi et al., 2025; Tan et al., 2017). Hydrological models are widely used to understand hydrological processes (Borrelli et al., 2020; Bouslihim et al., 2019), as well as to assess the impact of climate variability, human activities and management practices at the catchment scale (Aawar and Khare, 2020; Alehu and Bitana, 2023; El Harraki et al., 2021; El Khalki et al., 2021). Several hydrological models with different typologies have been proposed, and categorized based on the hydrological processes involved and their degree of spatial discretization (Hrachowitz and Clark, 2017; Jajarmizadeh et al., 2012). They range from global lumped conceptual models, such as the GR4J model (Perrin et al., 2003) to distributed and semi-distributed physically based models, such as the Soil and Water Assessment Tool (SWAT) model (Arnold et al., 1998).
Physically-based distributed models can produce reliable results and are more powerful in representing and analyzing the spatial variability of hydrological processes (Clark et al., 2017; Paniconi and Putti, 2015). However, their implementation requires a large amount of data. For example, SWAT model is widely used to simulate the hydrological functioning of catchments in response to complex phenomena such as climate change, erosion, infiltration, and changes in land use and agricultural practices (Neitsch et al., 2011). On the other hand, it requires an exhaustive database of spatial and meteorological data (Arnold et al., 1998), which are, inaccessible or limited, and frequently unavailable particularly in developing countries. The emergence of remote sensing techniques, along with the availability and accessibility of large-scale climate data have fostered and improved the application of SWAT model globally (Abbaspour, 2008). In the Moroccan context, many research studies have used this model, using the open-source databases available online [such as STATSGO and SSURGO (Corwin et al., 1997) for soils], and remote sensing data to develop land use maps (Acharki et al., 2023; Alitane et al., 2022; Aloui et al., 2023; Brouziyne et al., 2018; Kusi et al., 2023; Lelieveld et al., 2016; Milewski et al., 2020).
Regarding meteorological data, satellite climate products have been developed to supplement standard weather station data, by providing spatio-temporal continuous data and capturing climate variability on a global scale (Abera et al., 2016). The Climate Forecast System Reanalysis (CFSR) of the National Centers for Environmental Prediction (NCEP) (CFSR-NCEP) (Dile and Srinivasan, 2014; Saha et al., 2010) in among these products, and is commonly used in scientific research as a viable alternative in data scarce region. Several studies have evaluated the CFSR-NCEP reanalysis data and demonstrated their good performance in discharge simulations (Acharki et al., 2023; Bui et al., 2021; Dile and Srinivasan, 2014; Lagrini et al., 2020). Conversely, some studies have reported unsatisfactory performance of CFSR-NCEP reanalysis data, particularly in tropical and subtropical regions (Monteiro et al., 2016; Tan et al., 2017), in China (Yang et al., 2019), as well as in South African catchments (Mararakanye et al., 2020). The CFSR-NCEP reanalysis data were chosen because of the availability of several meteorological variables necessary for the implementation of the SWAT model (precipitation, temperature, wind speed, solar radiation and relative humidity) over a long time period (from 1979 to 2014) (Saha et al., 2010). These studies revealed that results vary between regions and models. In addition, these data may contain systematic errors and biases resulting in poor agreement with observations in some areas (Cui et al., 2012; Mararakanye et al., 2020; Yao et al., 2020). This emphasizes the importance of assessing their potential, especially in areas with limited climatic data.
Lumped conceptual models are still an interesting alternative due to their structural simplicity and the small amount of data required for their implementation. These include the Génie Rural (GR) models family (Mouelhi, 2003; Mouelhi et al., 2006; Perrin et al., 2003), which benefit from a variety of application examples and several tools to facilitate their implementation [e.g., the airGR package under R (Coron et al., 2017)]. In addition to their robustness and parsimony, their main advantage is that they require few meteorological data (precipitation, temperature, and/or potential evapotranspiration). The GR4J model (Perrin et al., 2003) is widely adopted by the scientific community for rainfall-runoff modeling (Bouadila et al., 2023; Bouizrou et al., 2023; Kodja et al., 2020; Wei et al., 2021) also for discharge simulation based on future climate projections (Séne et al., 2024; Stephens et al., 2018). However, such an approach raises the question of whether the functions assessed by the calibrated parameters model can be transferred to other climate conditions (Brigode et al., 2013; Coron et al., 2012). This issue becomes even more critical considering the uncertainties inherent in future climate projections and hydrological models, which are highly sensitive to the quality of available climate data, particularly as climate variability increases in the future (Joseph et al., 2018; Krysanova et al., 2018). It is therefore essential to evaluate the performance and temporal transferability of calibrated model parameters under climate non-stationarity (Deb and Kiem, 2020).
The main objective of this study is to evaluate the applicability of CFSR-NCEP reanalysis data for streamflow simulation in data-scarce basins by comparing the performance of two contrasting hydrological models: SWAT and GR4J. The study focuses on the Oued El Makhazine dam catchment in northwestern Morocco a subhumid Mediterranean watershed characterized by high temporal climatic variability. This catchment presents a relevant case study due to its limited availability of high-quality hydro-meteorological data, a challenge common to many basins in developing regions. The originality of this study lies in its integrated assessment of model performance using both uncorrected and bias-corrected CFSR-NCEP data and its comparison of a physically based, semi-distributed model (SWAT) with a lumped conceptual model (GR4J) under the same climatic and data constraints. The two models were deliberately selected to represent different modeling philosophies and data requirements: SWAT for its detailed representation of spatial heterogeneity and process complexity, and GR4J for its parsimonious structure and minimal input needs. This dual-model comparison provides insight into the trade-offs between model complexity and performance robustness in data-limited settings. Furthermore, the study investigates the transferability of calibrated model parameters across different climatic periods, offering a novel perspective on model stability under climate variability. The findings contribute to the broader field of operational hydrology by identifying modeling approaches that are more reliable for planning and managing water resources in regions where observational data are sparse or uncertain. These results also establish a foundation for future scenario-based studies on climate change and water resource planning in similar Mediterranean and semi-arid contexts.
2 Material and method
2.1 Study area
The catchment area of the Oued El Makhazine dam (1,800 km2) is in north-western Morocco (Figure 1). The eastern part of the catchment is rugged and mountainous, with a maximum altitude of about 1,700 m a.s.l. The Oued El Makhazine dam catchment, primarily drained by the Oued-Loukkos River, extends 180 km from the Rif mountains in the east (Figure 1). The climate is subhumid Mediterranean, with a cool, wet season from October to April and a hot, dry season from May to September. It is one of the rainiest catchments in Morocco and supplies one of the most important agricultural sectors, with an average annual rainfall of about 1,100 mm (70% of which falls between October and April), and a significant inter-annual variability. At the dam, the average annual specific discharge is 460 mm, resulting in a water supply to the dam of about 760 mm3. The average evaporation is estimated at 1,200 mm yr.−1. However, water availability in this catchment has decreased significantly in the last decades (Hrour et al., 2022; Milewski et al., 2020). This situation, combined with population growth and the development of agricultural activities, could lead to devastating water shortages in the future (Acharki et al., 2023; Hrour et al., 2023).
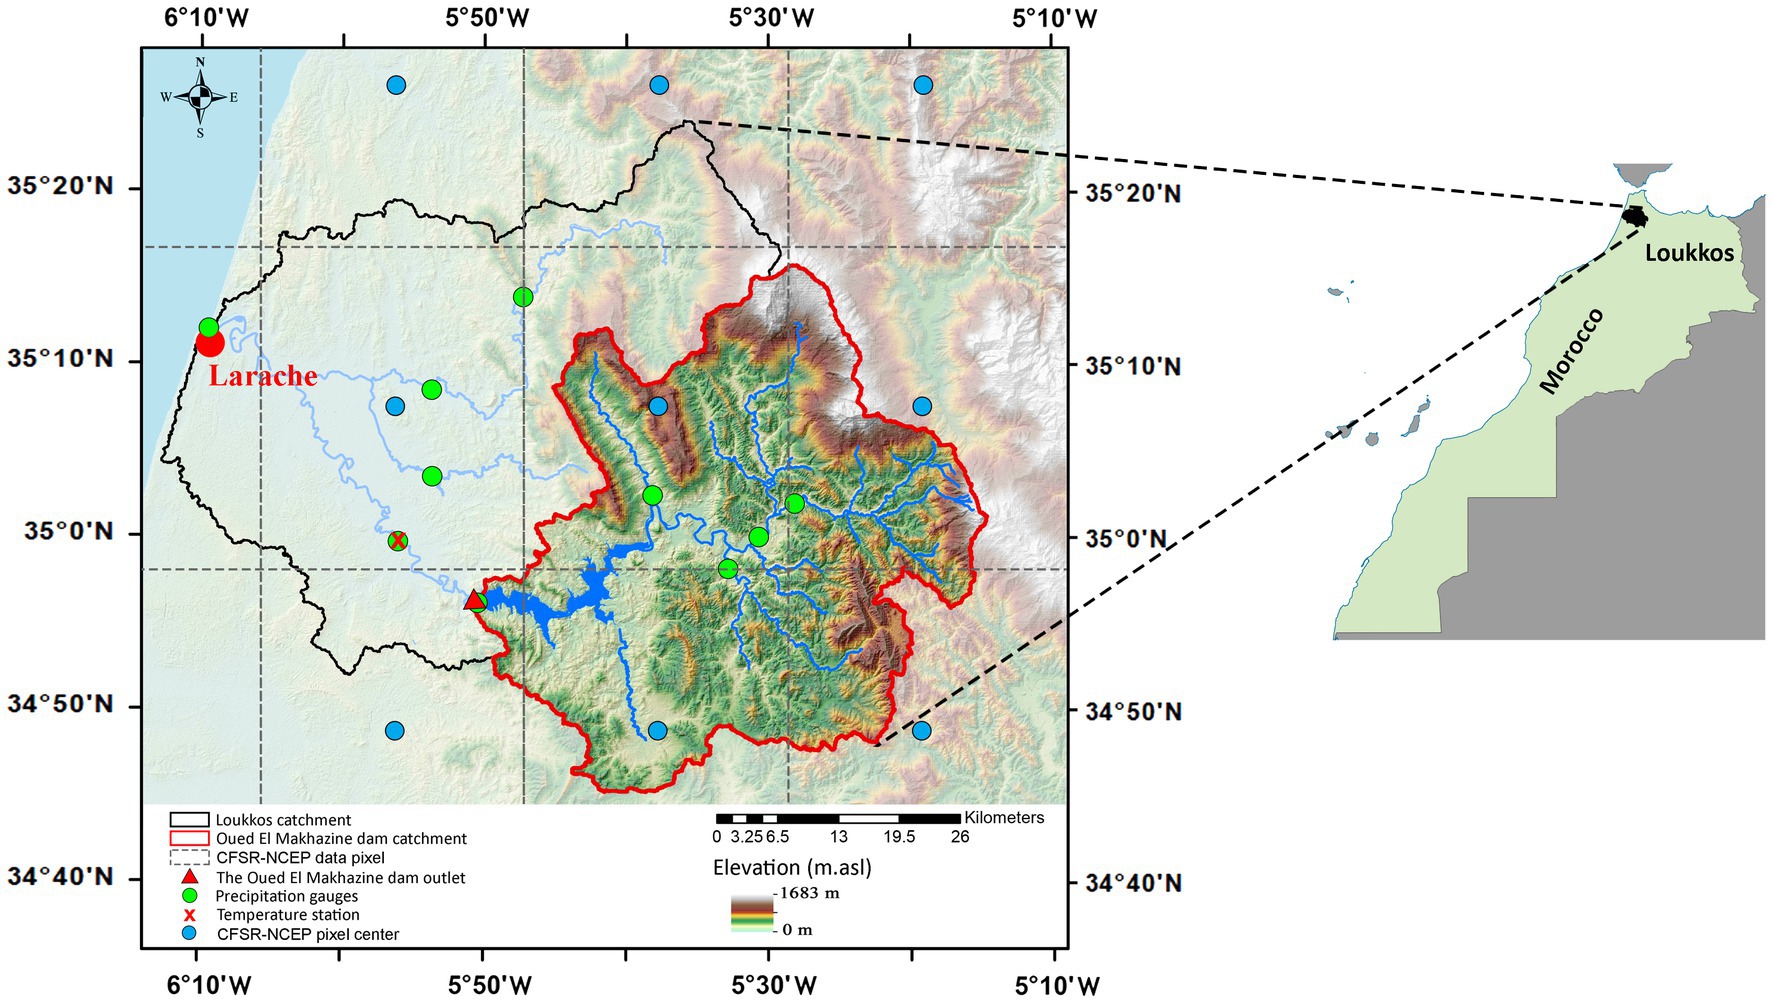
Figure 1. The study area of the Oued El Makhazine dam catchment (red outline), located to the west of the Rif mountains and representing a sub-basin of the Bas Loukkos catchment (black outline), the locations of the hydro-climatic stations and the digital elevation model detailing the topography.
2.2 Models’ description and configuration
2.2.1 SWAT model
The Soil and Water Assessment Tool (SWAT) is a semi-distributed and processes based hydrological model developed by the United States Department of Agriculture’s Agricultural Research Service (USDA-ARS) (Arnold et al., 1998, 1993; Neitsch et al., 2011). It is a physically based that operates at continuous daily time steps (Neitsch et al., 2011). It is designed to assess the effects of climate, management practices and land use on runoff, sediment and agricultural yields in large complex catchments (Neitsch et al., 2011). SWAT has been widely used around the world, including in the Mediterranean region and more specifically in Morocco. Research has applied SWAT in a wide range of areas, including the assessment of climate change, agricultural practices, and land use change on past and future water resources (Acharki et al., 2023; Aloui et al., 2023; Brouziyne et al., 2017; Choukri et al., 2020; Khaleghi and Hosseini, 2024; Lamane et al., 2022; Milewski et al., 2020; Sánchez-Gómez et al., 2025).
In the SWAT model, the catchment is divided into several sub-catchments, each of which is subdivided into hydrological response units (HRUs) (Arnold et al., 2012). Each HRU is characterized by a unique and homogeneous combination of soil type, land use and slope. The outputs (discharges, sediments, nutrients, etc.) for each HRU are then aggregated at the sub-catchment outlet and conveyed through channels, ponds, reservoirs and wetlands to the catchment outlet. For further details on the theoretical concepts of the model, the reader is referred to the SWAT documentation (Neitsch et al., 2011).
SWAT’s input data includes meteorological data (daily rainfall, temperature, relative humidity, wind speed, and solar radiation) and spatial data (digital elevation model (DEM), land use map, soil type map, and slope map). More details on these data are given in Section 2.3.
2.2.2 GR4J model
The GR4J model (Perrin et al., 2003) is a global lumped rainfall-runoff model with a daily time step. It has only four parameters (X1: daily maximum production storage capacity; X2: groundwater exchange coefficient; X3: daily maximum routing storage capacity; and X4: time base of the unit hydrograph). The GR4J model simulates discharge using two functions: production (nonlinear production storage) and routing (nonlinear routing storage) (see Perrin et al., 2003 for more details). The model requires daily precipitation and potential evapotranspiration as meteorological input data to simulate discharge. The model has been widely used for hydrological simulations (Ait Naceur et al., 2025; Anshuman et al., 2021; Bouizrou et al., 2023; Wei et al., 2021) and has attracted attention for its simplicity, accuracy, and adaptability to various climate and catchment conditions.
2.3 Dataset
2.3.1 Climatic and hydrological data
2.3.1.1 Observed data
Precipitation, temperature and discharge data were provided by the agricultural council [Office Régional de Mise en Valeur Agricole du Loukkos (ORMVAL)] and by the water agency [Agence du Bassin Hydraulique du Loukkos (ABHL)]. Monthly precipitation was provided for 10 stations (Figure 1) over the period 1960–2018. Average monthly discharges were provided for the Oued El Makhazine station (at the dam) over the period 1960–2012. Monthly maximum and minimum temperatures were provided for the Mrissa station over the period 1981–2008 (Figure 1). See Hrour et al. (2022) for more information on the available dataset.
2.3.1.2 CFSR-NCEP data
This study uses daily datasets from the Climate Forecast System Reanalysis (CFSR) by the National Centers for Environmental Prediction (NCEP) (Dile and Srinivasan, 2014; Saha et al., 2010) to address the lack of meteorological data in both space and time. The use of CFSR-NCEP datasets is justified by their global coverage, long-term consistency 1981–2014, and ease of access. These datasets provide key meteorological variables such as precipitation, maximum and minimum temperatures, relative humidity, wind speed, and solar radiation which are essential inputs for the SWAT model. CFSR data combines observations with numerical weather models to generate continuous and homogeneous time series, making them particularly useful in regions with limited or unreliable ground measurements. Their spatial resolution (0.3125° × 0.3125°) and daily time step are well suited for large-scale hydrological studies like this one. In addition, the data can be directly formatted for use in SWAT, which makes CFSR-NCEP especially suitable for SWAT model especially in data-scarce regions (Fuka et al., 2014). However, these data contain systematic errors and biases (Cui et al., 2012). For example, they overestimate precipitation, especially in mountainous areas such as the study area (Yao et al., 2020). Therefore, it is worth correcting these data before using them in hydrological models. In the present study, CFSR-NCEP data with and without bias correction were used to assess their respective performance in hydrological modelling.
2.3.1.3 Bias correction
Precipitation and temperature (maximum and minimum) were corrected using the linear scaling (LS) method. This method aims to fit the long-term monthly mean of the corrected values perfectly to that of the observed values (Teutschbein and Seibert, 2012). A monthly scaling factor is calculated as the ratio between the long-term monthly mean of the observed data and that of the CFSR-NCEP data. Each of the uncorrected CFSR-NCEP daily precipitation and temperature values for a given month is then corrected by the monthly scaling factor for that month. It is important to note that these correction factors vary according to the month of the year, but the LS method has certain limitations, especially that it does not capture all the characteristics of the observed data. (i.e., inter-monthly variation, daily probability distribution).
2.3.2 Spatial data
2.3.2.1 Digital Elevation Model (DEM)
The DEM (Figure 2) was obtained from the Global Digital Elevation Model of the ASTER sensor (GDEM-ASTER). It can be downloaded from the Earth Explorer portal1 of the United States Geological Survey (USGS). It has a spatial resolution of 30 m, similar to that used in many studies (Acharki et al., 2023; Aloui et al., 2023; Bouslihim et al., 2019; Chkara and EL Morabiti, 2016). Nevertheless, Nazari-Sharabian et al. (2019) have shown that using a 12.5 m resolution leads to better discharge simulation results while using resolutions of 30 m and 90 m leads to discharge overestimation of about 0.74 and 2.73% (respectively) compared to a resolution of 12.5 m.
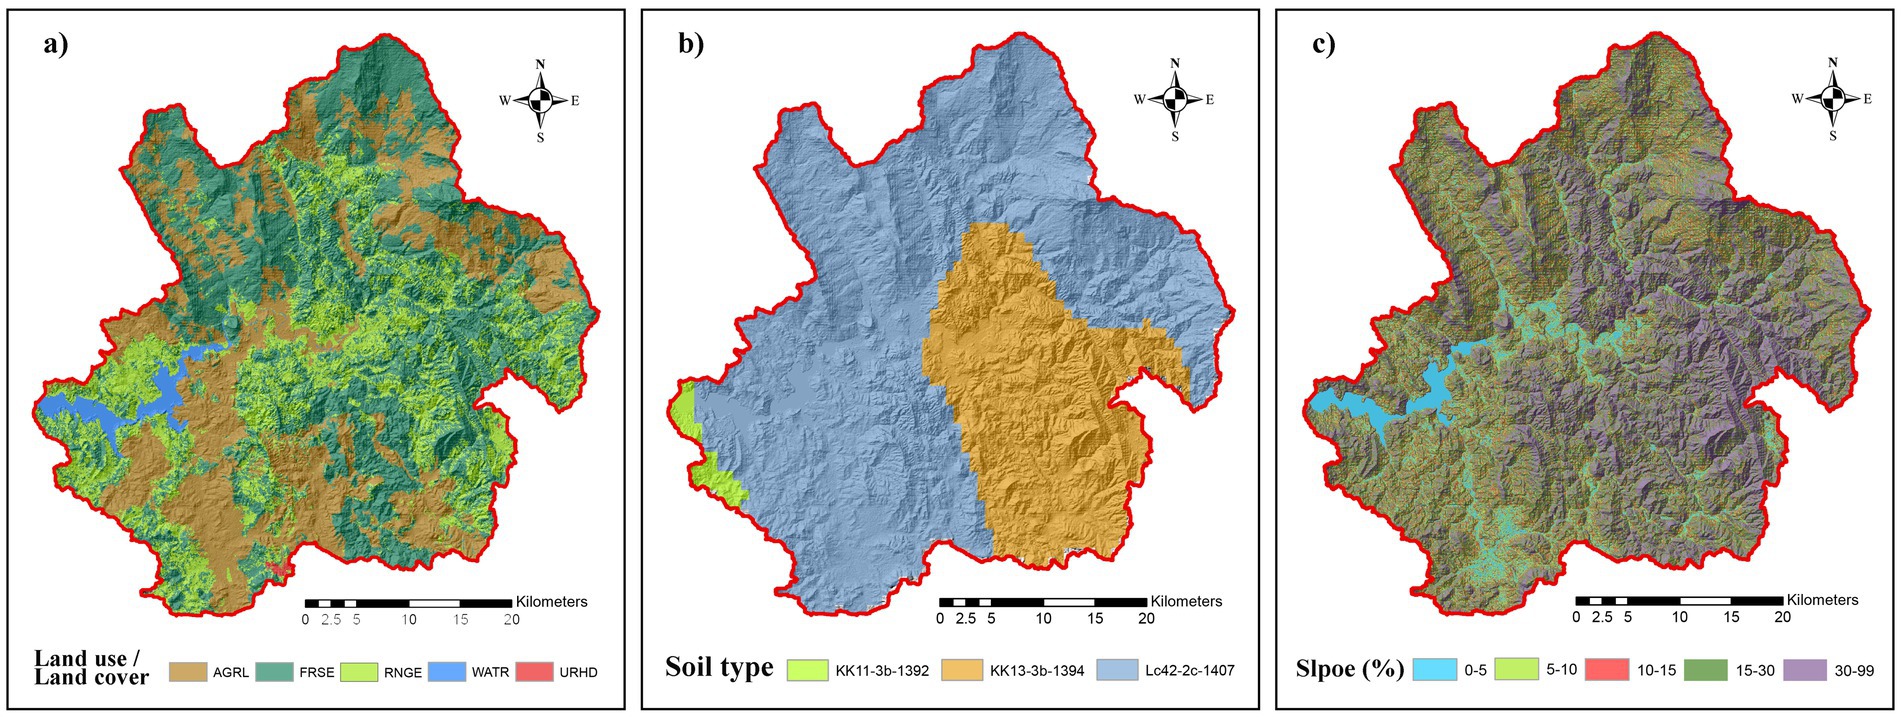
Figure 2. Spatial data layers used in the SWAT Model. (a) Land use/ land cover map classified according to SWAT categories: Forest (FRSE), Agricultural Land—Generic (AGRL), Rangeland—Grasses (RNGE), Water (WATR), and Urban Residential—High Density (URHD); (b) Soil map classified using SWAT-compatible soil types; and (c) Slope class distribution, highlighting dominant soil types: Luvisols (Lc42-2c-1407), Calcic Kastanozems (KK13-3b-1394), and Eutric Fluvisols (KK11-3b-1392). Models’ setup, calibration and validation.
2.3.2.2 Soil data
The Harmonized World Soil Database (HWSD_v121) (FAO et al., 2012), accessible through the Food and Agriculture Organization of the United Nations soil portal,2 was used in this study. The database was spatialized and rasterized to the same resolution as the DEM (30 m) using ARCGIS software, and then the soil classes were reclassified and renamed to match those in the SWAT database. This database contains all the soil parameters required by the SWAT model, such as texture, soil water content, organic carbon content, bulk density, soil depth, and soil hydrological group (Supplementary 1). The soil types in the catchment are dominated by Chromic Luvisols (Lc42-2c-1407), followed by Calcic Kastanozems (KK13-3b-1394) and Eutric Fluvisols (KK11-3b-1392), accounting for 58.0, 32.2 and 9.8% of the total catchment area, respectively (Figure 2).
2.3.2.3 Land use/land cover data
The land cover map was produced by ABHL using remote sensing based on medium-resolution satellite imagery, field knowledge, field surveys, and Google Earth images. To be consistent with the classification and nomenclature used in the SWAT database, the land cover map was reclassified, and land use types were renamed. The land use classes are Forest (FRSE), Agricultural Land-Generic (AGRL), Range-Grasses (RNGE), Water (WATR), and Residential-High Density (URHD), representing, respectively, 45.5, 29.9, 22.4, 2.05, and 0.15% of the total surface area of the basin (Figure 2).
2.3.3 SWAT model
The model of the Oued El Makhazine dam basin was built using ArcSWAT software with the ArcGIS interface in its 2012 version (“SWAT,” 2012). The general approach used for the building and calibration of the SWAT model is presented in Figure 3.
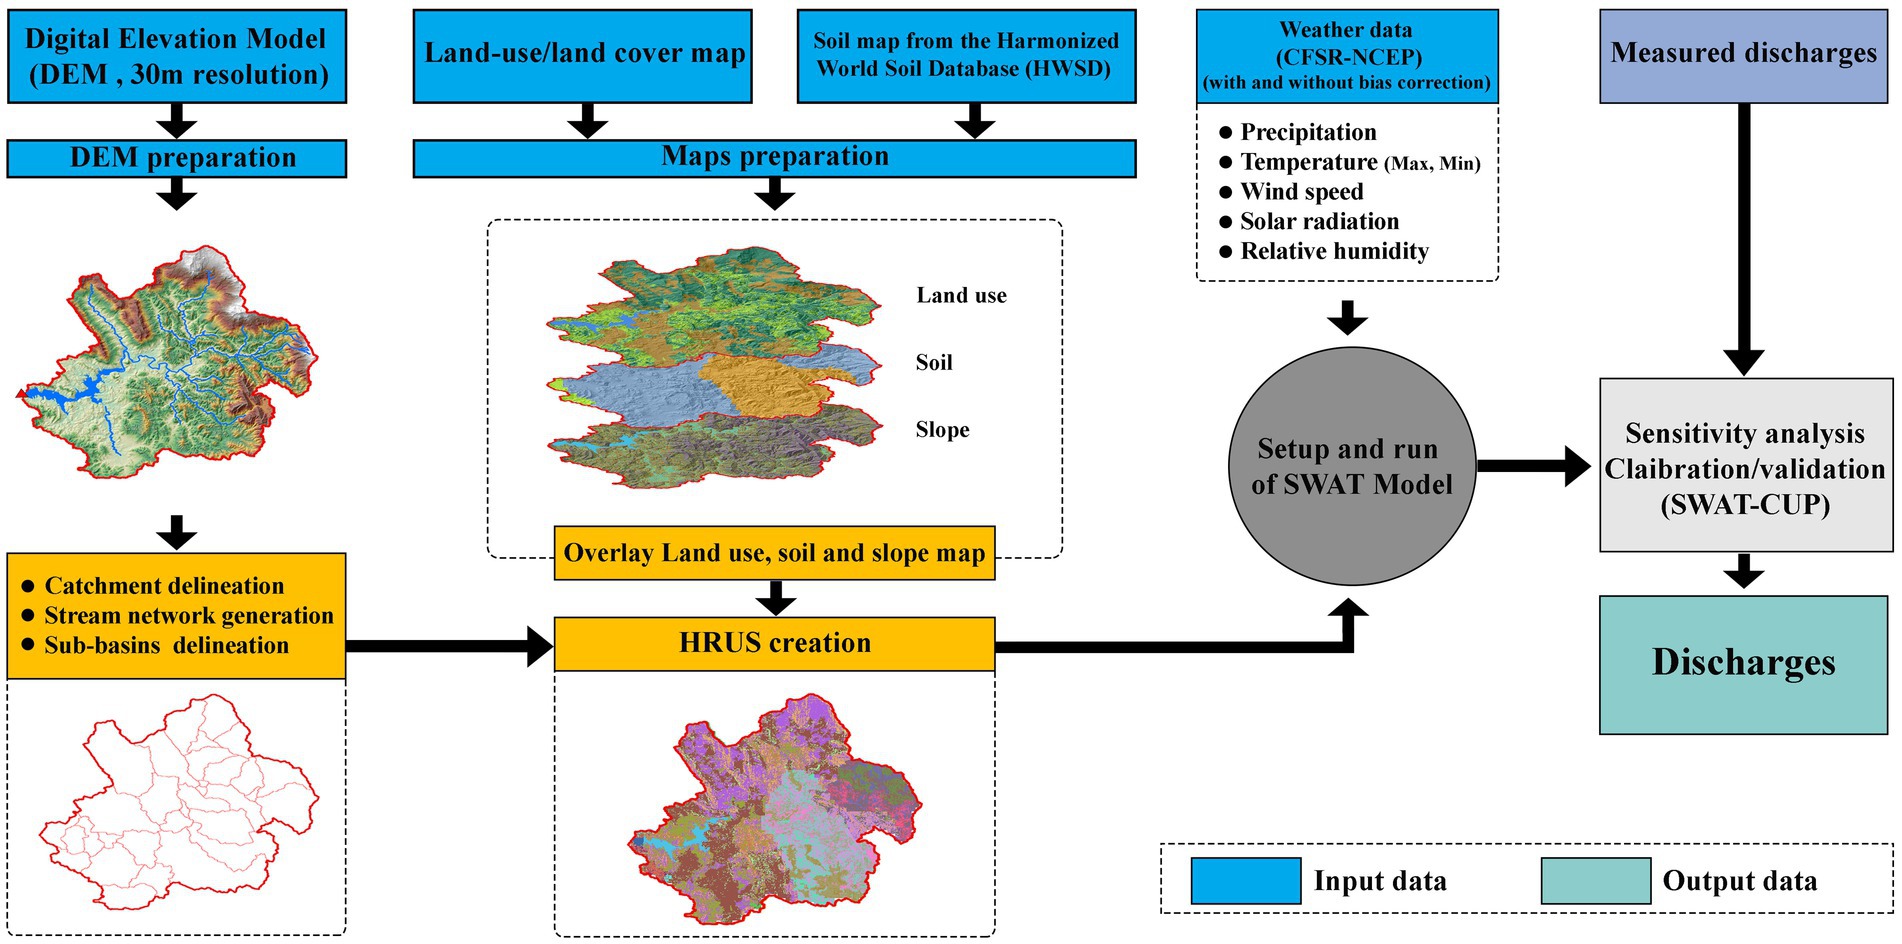
Figure 3. General methodology for the set-up, calibration and validation of the SWAT model.
The first step is to delineate the catchment and sub-catchments using the DEM. The hydrographic network was extracted from the DEM, verified and corrected using satellite imagery and information provided by ABHL. SWAT then divided the Oued El Makhazine dam catchment into 15 sub-catchments. This subdivision into sub-catchments is sufficiently detailed to represent the significant topographic variability of the catchment. This is crucial as it can affect the results of runoff simulations (Aouissi et al., 2013; Neitsch et al., 2011).
The second step involved the definition of Hydrological Response Units (HRUs), which are unique combinations of land use, soil type, and slope classes. To generate the HRUs, spatial overlay of the land use map, soil map, and a slope map (derived from the DEM using the SWAT interface) was performed (Figure 2c). Each layer was treated with equal importance in the overlay process, and no weighting factors were applied, in line with the standard SWAT procedure. A threshold of 20% was applied to each category (land use, soil, and slope) to exclude minor classes and avoid the generation of HRUs with negligible area, following the recommendation of Arnold et al. (2012). This method strikes a balance between spatial detail and model manageability. As a result, 360 HRUs were delineated across the 15 sub-catchments.
The third step consisted on integrating the daily meteorological data, precipitation, minimum and maximum temperature, relative humidity, wind speed and solar radiation from the CFSR-NCEP. The SWAT model was first Configurated and simulated with the CFSR-NCEP meteorological data without bias correction, and then with the data with bias correction, with all other input parameters held constant. Surface runoff was calculated as a function of soil moisture using the curve number method. Potential evapotranspiration (PET) was estimated using the Penman-Monteith equations, while variable storage was used to move water through the channels. After building and configuring the SWAT model, a simulation was run on a monthly time step for 28 years (1981–2008) for both models with and without bias correction of the CFSR-NCEP data.
2.3.4 Sensitivity and uncertainty analysis
Before calibrating and validating the SWAT model, it is essential to perform a sensitivity analysis to the model parameters. This aims to identify the key parameters that affect the model performance (Song et al., 2015) and helps to reduce the number of parameters that need to be adjusted when calibrating the SWAT model (Abbaspour, 2008; Abbaspour et al., 2017). For this purpose, the Sequential Uncertainty Fitting Version 2 (SUFI-2) algorithm from the SWAT Calibration and Uncertainty Programs (SWAT-CUP) software package (Abbaspour et al., 2007) was used. SUFI-2 is particularly effective due to its ability to account for uncertainties on parameters and input data, which enhances the robustness and accuracy of the SWAT model. Its built-in sensitivity analysis and efficient exploration of the parameter space make it well-suited for model calibration, especially in complex systems and data-scarce environments. The algorithm quantifies prediction uncertainty using the 95% prediction uncertainty (95PPU), defined by the 2.5th and 97.5th percentiles of the cumulative distribution of the model outputs (Memarian et al., 2014). Among the available calibration algorithms, SUFI-2 is the most widely used in hydrological modeling because it efficiently manages water balance parameters, requires fewer simulations to define uncertainty bounds, and performs well with limited computational resources (Abbaspour et al., 2019; El Harraki et al., 2021; Mehan et al., 2019). In addition, the SUFI-2 method assumes that model uncertainty includes all types of uncertainties, such as those related to input data, model conceptualization, model parameters, and those related to measured data (Abbaspour et al., 2007). SUFI-2 allows the parameters to vary within possible ranges, specified for each parameter (Supplementary Table S2). The P-factor and the R-factor are calculated to estimate uncertainty. The P-factor is the percentage of observations within the 95% uncertainty band (95PPU). The R-factor is the width of the 95PPU uncertainty band. It thus represents the amplitude of the uncertainty attributed to the model parameters. The aim of calibration is to have as many observations as possible within the 95PPU with the lowest possible R-factor (see Abbaspour et al., 2007 for more details).
As the focus of this study is on discharge simulation, the sensitivity analysis has been done with the 19 parameters (Supplementary Table S2) of the water balance equations (Briak et al., 2019; Chkara and EL Morabiti, 2016; Rafik et al., 2023; Strohmeier et al., 2020).
2.3.5 GR4J model
Daily precipitation and potential evapotranspiration (PET) used as inputs to the GR4J model, with and without bias correction were provided from CFSR-NCEP database. This approach allows a comparison of the performance of the two models using the same input data, ensuring a consistent and objective evaluation of the influence of the bias correction on the hydrological simulations. The GR4J model was run using the airGR package (Coron et al., 2017) of R software (R Core Team, 2021).
2.3.6 Calibration and validation
The sample split test (SST) method (Klemeš, 1986; Thirel et al., 2015) was used to evaluate the performance of the SWAT and GR4J models. This method was chosen because it allows for a clear and objective assessment of model performance under different precipitation conditions by dividing the dataset into distinct calibration and validation periods. Unlike other methods, SST helps detect overfitting and assess the model’s ability to generalize beyond the calibration period, which is essential for evaluating the robustness and predictive reliability of hydrological models. The simulation period (1981–2008) was divided into three non-overlapping sub-periods of equal duration to represent distinct climatic conditions, based on the standardized precipitation index (Hrour et al., 2022). The period 1981–1990 (Config.1) was characterized as very dry, 1991–1999 (Config.2) included a dry phase (1991–1994) followed by normal conditions (1995–1999), and 2000–2008 (Config.3) corresponded to average precipitation conditions with a higher frequency of extreme events. These periods were selected to ensure the model’s robustness by covering a range of hydroclimatic variability (dry, normal, and variable/extreme). The models were calibrated separately for each of these periods. For validation, each calibrated model was applied to the concatenation of the two remaining periods, which served as an independent validation set. For example, when the model was calibrated on 1981–1990, it was validated using the combined period of 1991–2008. This approach allows the evaluation of model performance under different climatic conditions. A two-year warm-up period was applied at the start of each simulation to initialize model state variables, and results from these warm-up years were excluded from the analysis.
The performance of the models was assessed by calculating the efficiency criteria: Nash-Sutcliffe efficiency coefficient (NSE) (Nash and Sutcliffe, 1970) (Eq. S3.1), the Coefficient of determination (R2) (Eq. S3.2), the Root mean square error (RMSE) (Eq. S3.3) and the Percentage bias (Pbias) (Supplementary 3). The mathematical definitions and detailed interpretations of these metrics are provided in Supplementary 3.
3 Results and discussion
3.1 Bias correction and evaluation of meteorological data from CFSR-NCEP
The CFSR-NCEP precipitation (without bias correction) provides a satisfactory representation of the temporal dynamics of monthly and annual precipitation (Figure 4). The R2 values are 0.83 and 0.89 for monthly and annual precipitation respectively, indicating a high statistical agreement between the CFSR-NCEP and observed precipitation. However, the CFSR-NCEP precipitation overestimates the monthly averages, especially during the winter period, and the annual cumulative of the observed precipitation (Figure 4). The RMSE is 60.68 mm and 382.04 mm (i.e., a bias of between 59 and 59%) at monthly and annual timescales, respectively.
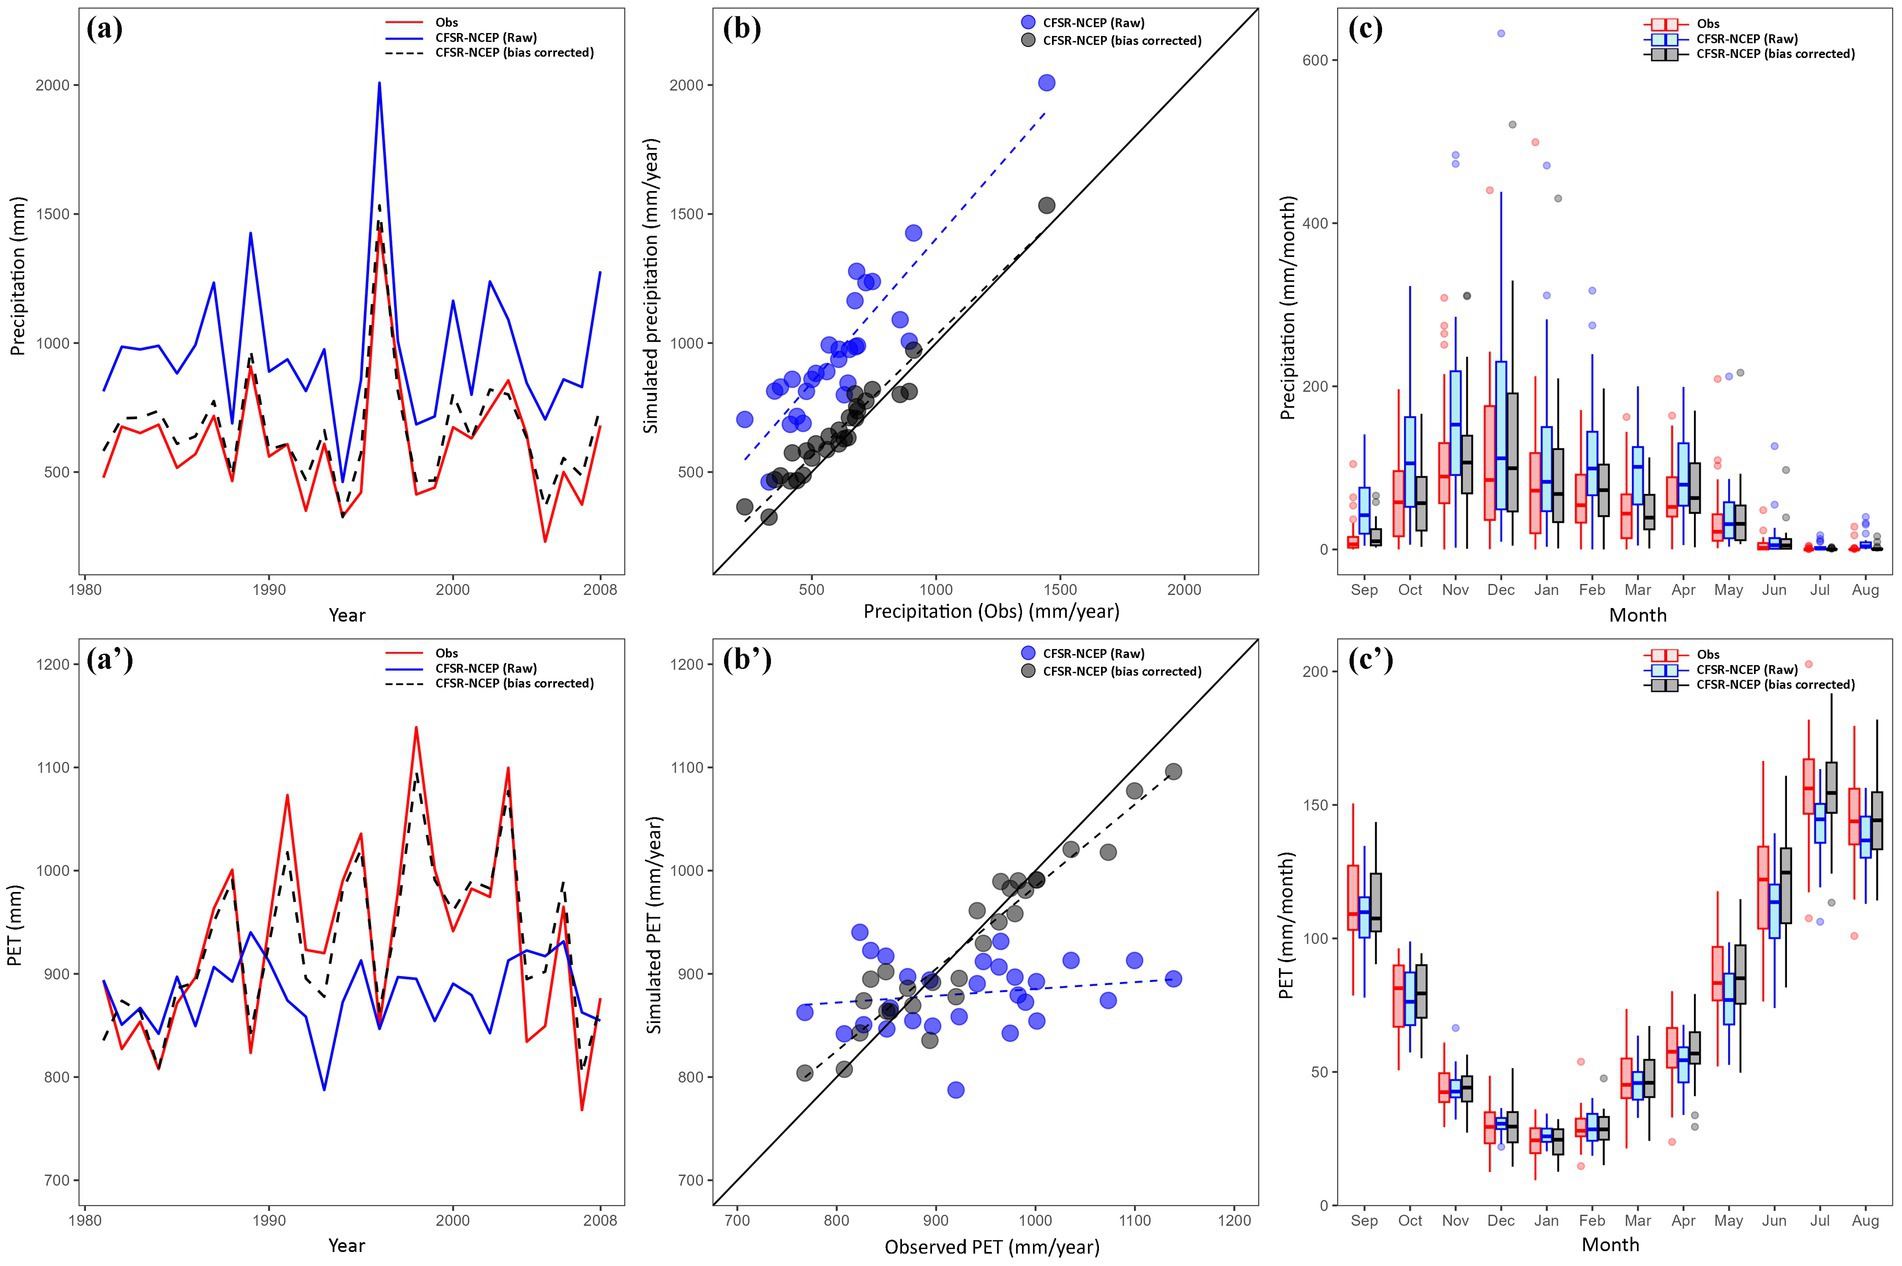
Figure 4. Comparison of CFSR-NCEP with and without bias correction against observed precipitation (Top) and PET (Estimated Using the Penman-Monteith Method) (bottom): Annual precipitation (a) and PET (a’); scatter plots of annual cumulated precipitation (b) et PET (b’) and Box plot of monthly precipitation (c) and PET (c’) over the period 1981–2008.
The potential evapotranspiration (PET) estimated from CFSR-NCEP data shows poor agreement with the mean monthly dynamics of those estimated from observed data (Figure 4). The R2 values are relatively low at 0.45 and 0.18 on monthly and annual timescales, respectively. Overall, the potential evapotranspiration (PET) estimated from CFSR-NCEP data is lower than that derived from observed data (Figure 4), with a root mean square error (RMSE) of 16.59 mm at the monthly scale and 103.74 mm at the annual scale. In addition, the intra-and inter-annual variability of PET estimated from the CFSR-NCEP data is lower than that of PET from observed data.
Bias correction ensures a good agreement between precipitation and PET from CFSR-NCEP and the observed values (Figure 4), with an R2 of 0.95 and 0.97 and RMSE of 21.32 and 76.31 (i.e., a bias of 8.82 and 8.82%) for monthly and annual precipitation, respectively. Similarly, for PET, the R2 are of 0.96 and 0.99 and RMSE of 4.32 and 29.74 (i.e., a bias of 0.18 and 0.17%) for monthly and annual timescales, respectively.
3.2 Sensitivity analysis of SWAT model
The sensitivity analysis of the SWAT parameters showed that the most sensitive parameters were the runoff curve number (CN2), the available water capacity of the soil layer (SOL_AWC), the wet bulk density (SOL_BD), and the soil evaporation compensation factor (ESCO) (Table 1). These results are in line with several studies, such as the study by (Chkara and EL Morabiti, 2016), which confirmed that the parameters CN2, SOL_AWC, and ESCO are the most sensitive in a small catchment in northern Morocco. Finally, 7 significant parameters were identified for calibration of the SWAT model in this case (Table 1). The sensitivity of these parameters was based on the T-statistic and p-value, with a threshold of less than 15% (Abbaspour et al., 2007).
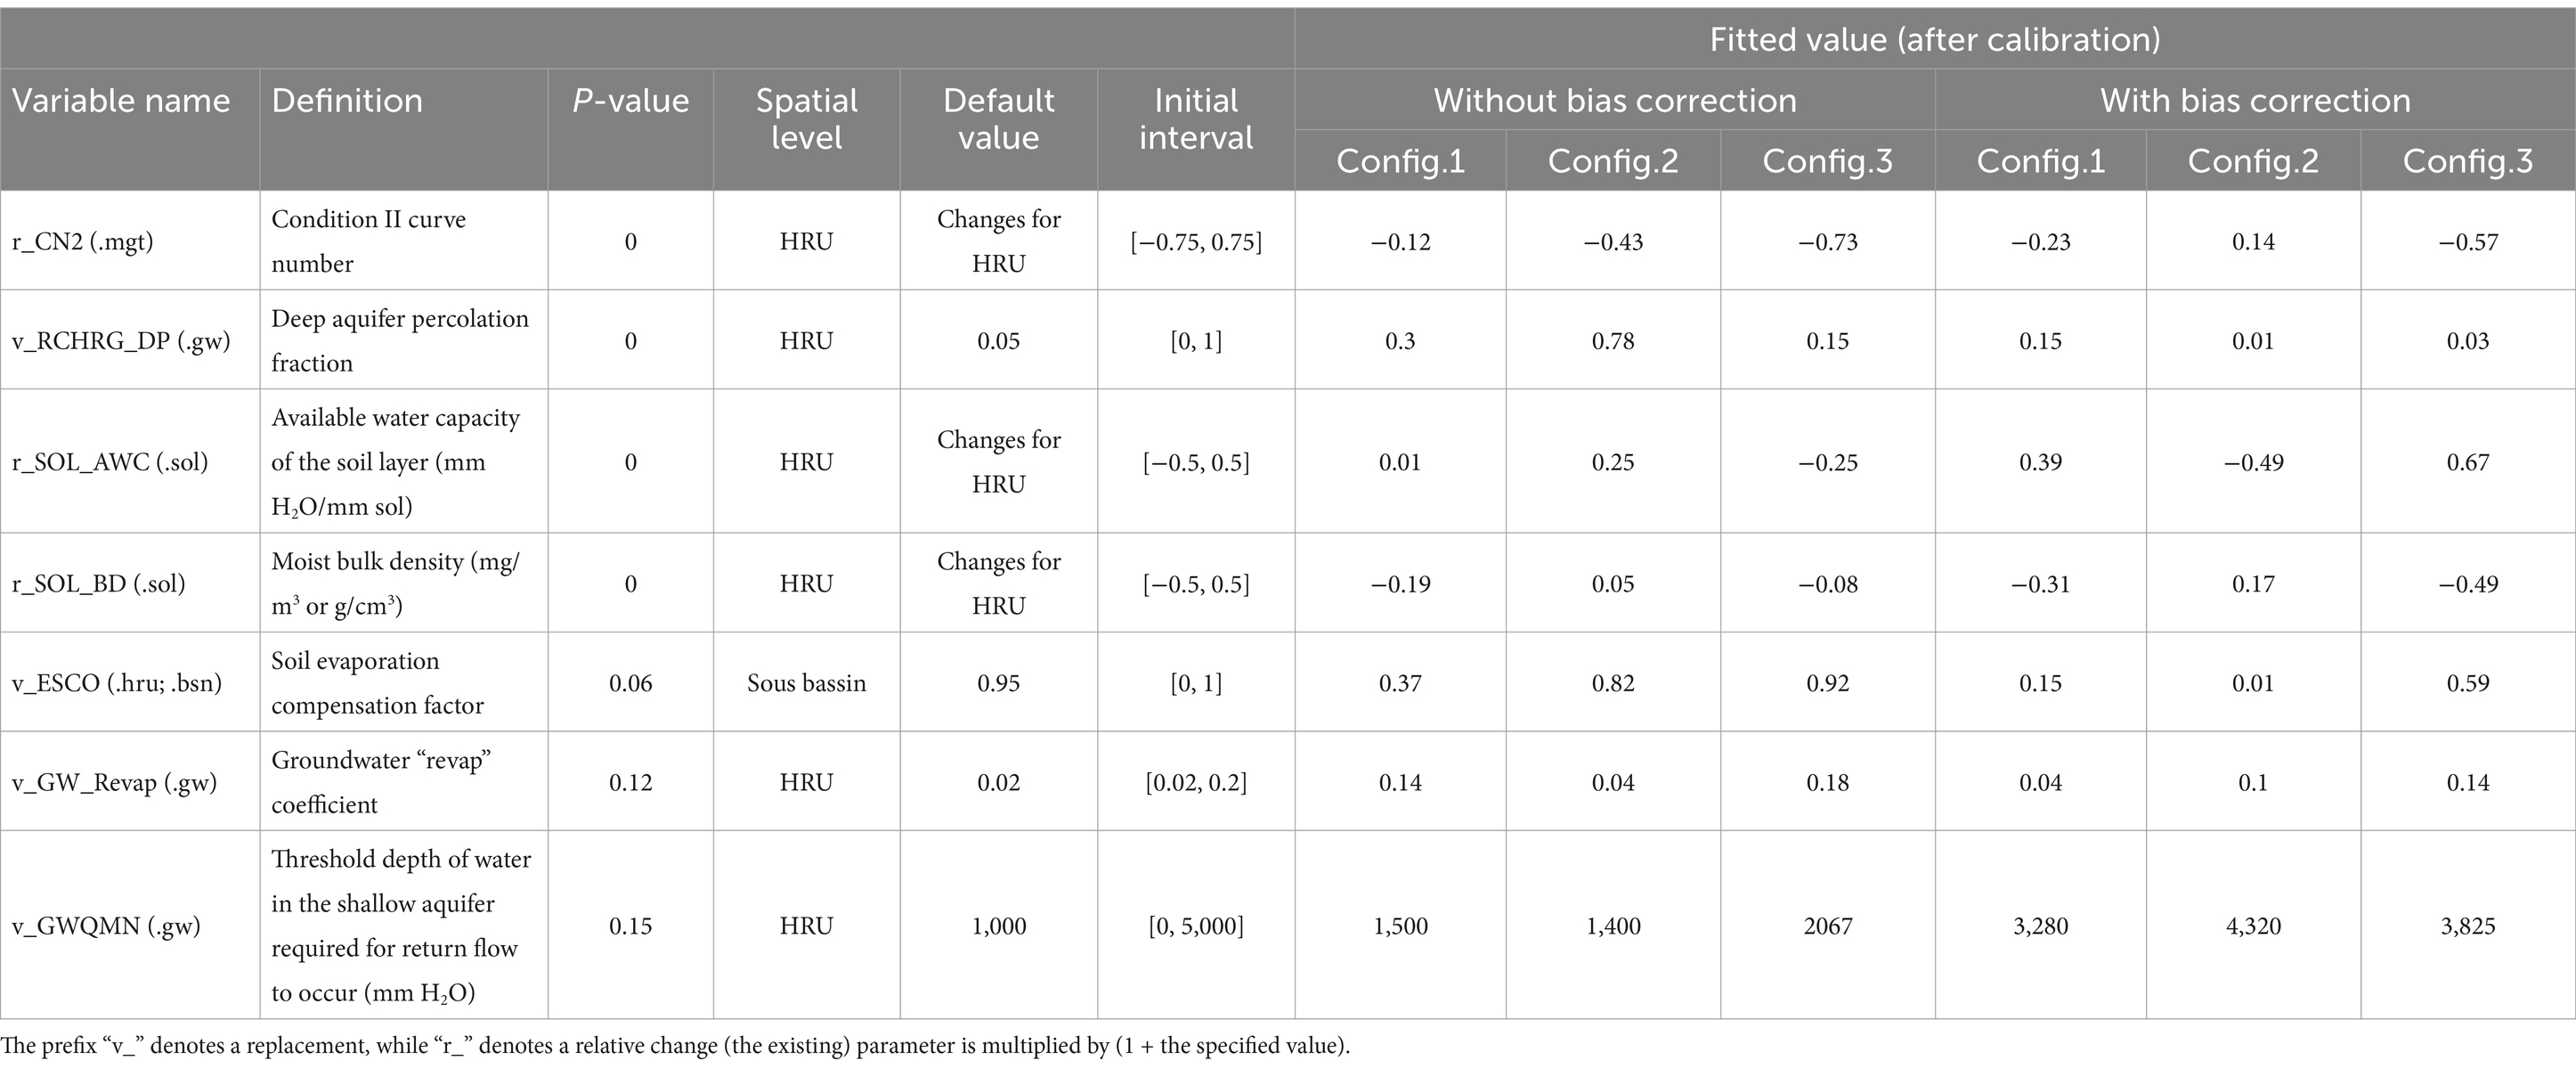
Table 1. Description, initial calibration range and fitted values of the most sensitive parameters used to calibrate the SWAT model.
3.3 SWAT calibration and discharge simulation
3.3.1 Using CFSR-NCEP data without bias correction
The SWAT model calibration results using data without bias correction are unsatisfactory. The statistical efficiency criteria calculated between the measured and simulated discharges by calibrated SWAT model (Table 2), as well as the hydrograms (Figure 5), indicate low to medium performance (Moriasi et al., 2007). The NSE coefficient ranges from 0.53–0.60 (0.47–0.53) during calibration (during validation) across the three configurations (Table 2). The correlation coefficient R2 varies between 0.71 and 0.80 (0.65 and 0.74) in the calibration (validation) periods for the three configurations (Table 2), which indicates that the SWAT model was able to satisfactorily reproduce the overall trend of the measured discharges (Figure 4). However, high discharges are slightly underestimated and low-discharges are overestimated (Figure 4). The RMSE values indicate relatively high levels of error and the Pbias varies between 32.7 and 55.5% (18.50 and 79.7%) for calibration (validation) periods (Table 2). These biases should be between −25 and +25% for a satisfactory simulation and between −15 and +15% for a good simulation (Arnold et al., 2012; Moriasi et al., 2007). Overall, the Pbias show poor model performance for all three calibration configurations. The overestimation of the low discharge and the underestimation of the high discharge were the main reasons for the high Pbias values. In addition, SWAT failed to simulate some high-peak events for the three configurations, e.g., in December/January 1984, 1990, 1991, 1996, 1997 and around March/April 2003 and 2004.
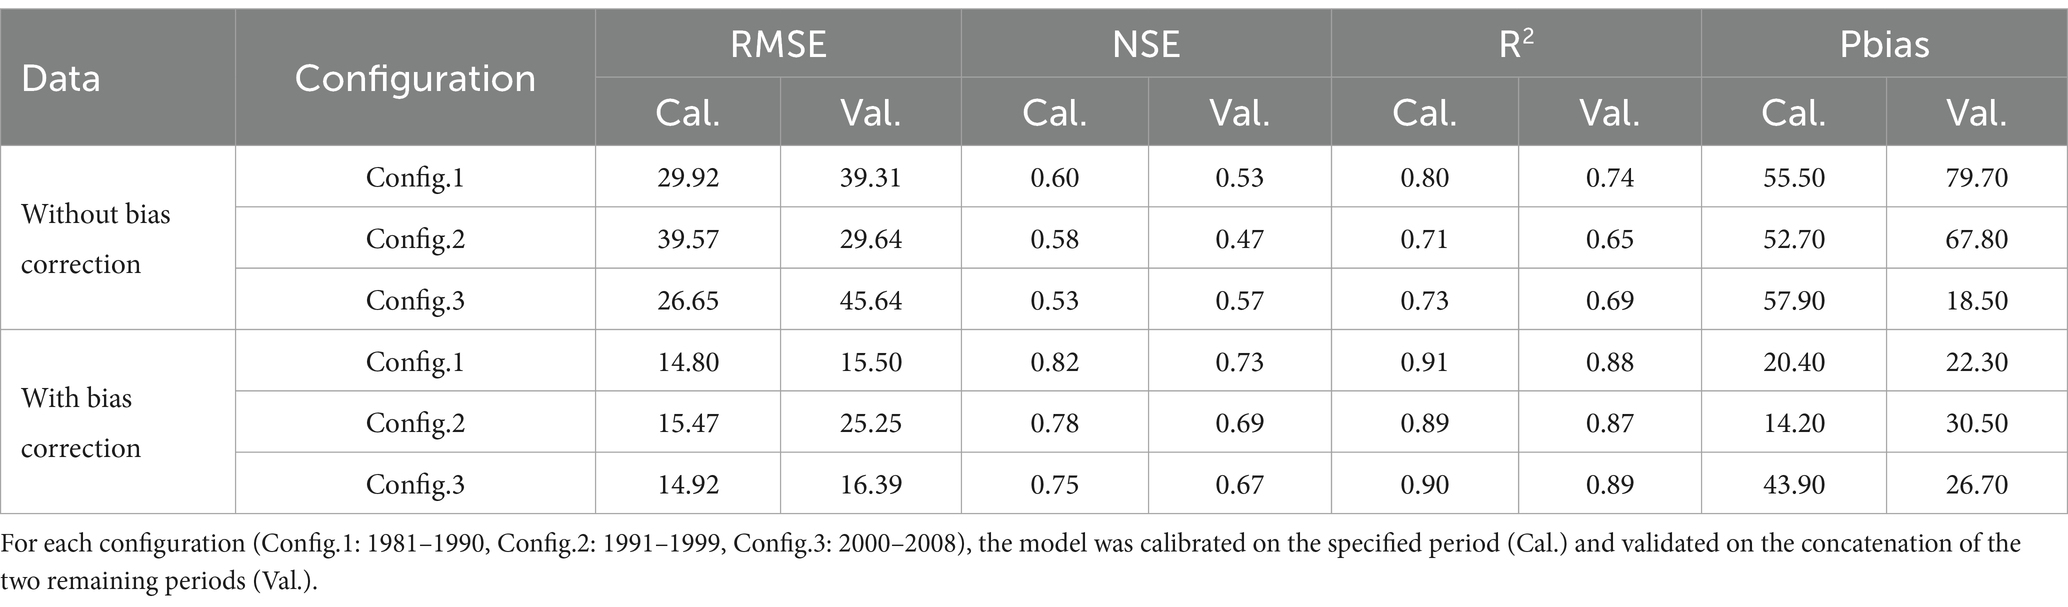
Table 2. Performance criteria of the SWAT model for the Oued El Makhazine dam catchment under the three calibration configurations.
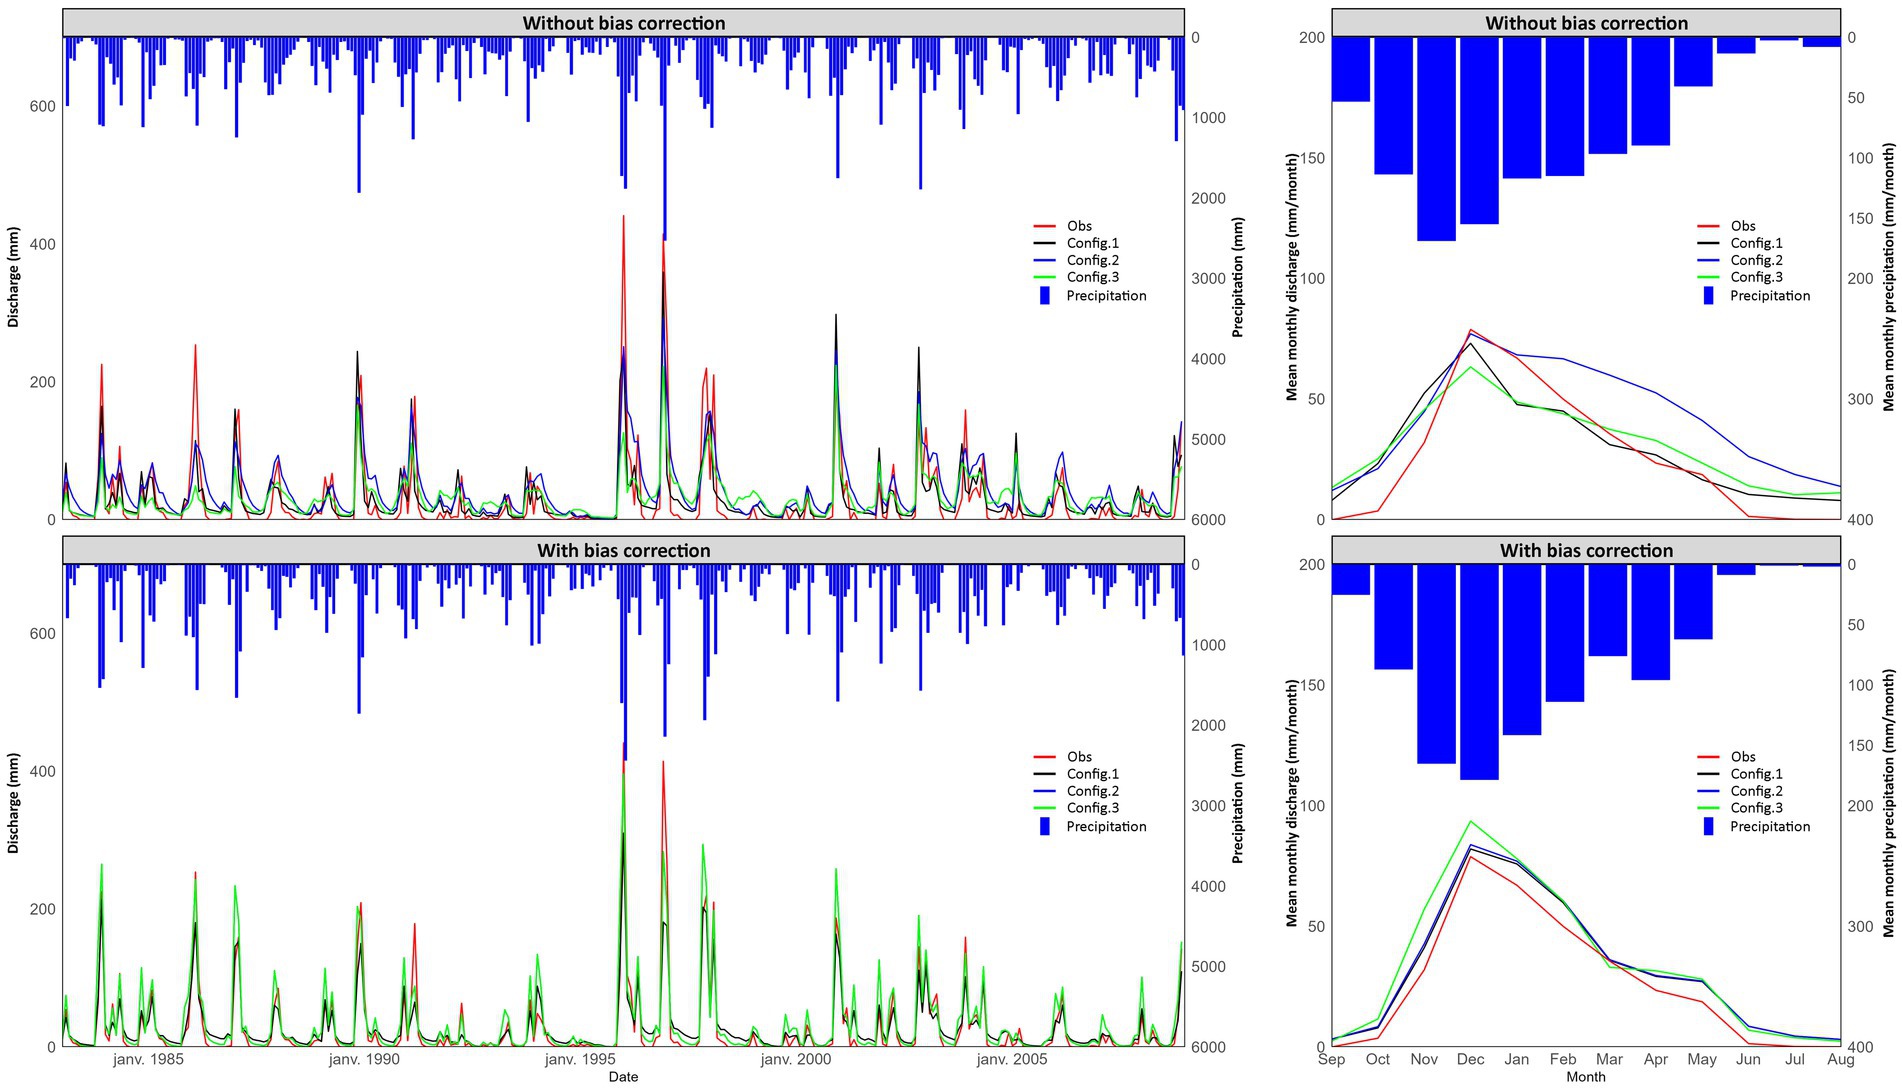
Figure 5. SWAT model calibration results: (right) monthly variation and (left) monthly mean of precipitation, observed discharge, and simulated discharge (mm month−1) using parameters sets from Config.1, Config.2 and Config.3 over the simulation period (1981–2008); using data without (top) and with (bottom) bias correction.
The mean monthly precipitation, observed discharges, and simulated discharges (without bias correction) over the period 1981–2008 (Figure 5, top right) show a significant difference between the three calibration configurations. The simulated discharges by Config.1 (blue line) overestimate those observed for all months of the year, with a relative mean difference of 42% (the monthly mean simulated discharge exceeds those observed ca. 42% for all months). For Config.2 (black line), the monthly mean discharge is overestimated, while for Config.3 (green line), the high and low discharge are significantly underestimated and overestimated, respectively.
3.3.2 Using CFSR-NCEP data with bias correction
The performance of the SWAT model was substantially improved using the CFSR-NCEP data with bias correction. The statistical criteria (Table 2) and the hydrograms (Figure 5, bottom) show a satisfactory performance of the SWAT model (with bias correction) for the three calibration categories. The NSE coefficient ranges from 0.75 to 0.82 in calibration and from 0.67 to 0.73 in validation (Table 2), indicating good model performance. The R2 coefficient improved, reaching 0.89–0.91 in calibration and 0.87–0.89 in validation.
Analysis of the hydrograms (Figure 5, bottom right) reveals differences between the three configurations, with Pbias values ranging from 20.40 to 43.90% during calibration and 22.30 to 33.50% during validation. In general, the average monthly discharges are overestimated, even after correcting for the bias in the CFSR-NCEP data. Config.1 and Config.2 show similar results, with an average overestimation of the monthly mean discharges of 17% (Table 2 and Figure 5). However, these configurations fail to correctly simulate high peak events. Config.3 further overestimates monthly discharges (by about 33% on average) and overestimates both low and high discharges.
3.4 GR4J calibration and discharge simulation
3.4.1 Using CFSR-NCEP data without bias correction
The monthly discharges simulated by GR4J using data without bias correction varied (Figure 5, top). The performance criteria indicate satisfactory results, with NSE values ranging from 0.86 to 0.91 (0.73 to 0.86) in the calibration (validation), while the R2 coefficient is greater than 0.9 in all configurations (Table 3). These results, combined with the analysis of the hydrograms (Figure 5, top), show a strong agreement between the monthly discharges simulated with data without bias corrections and the observed discharges. In general, the long-term discharge data simulated by the GR4J models were in good agreement with the observed discharges data in terms of seasonal variations. However, the three calibration configurations failed to reproduce high peaks such as those recorded in 1984, 1990, 1991, 1996, 1997 and around March/April in 2003 and 2004 (Figure 5, top). The same observation was made for the SWAT model using data without bias correction.
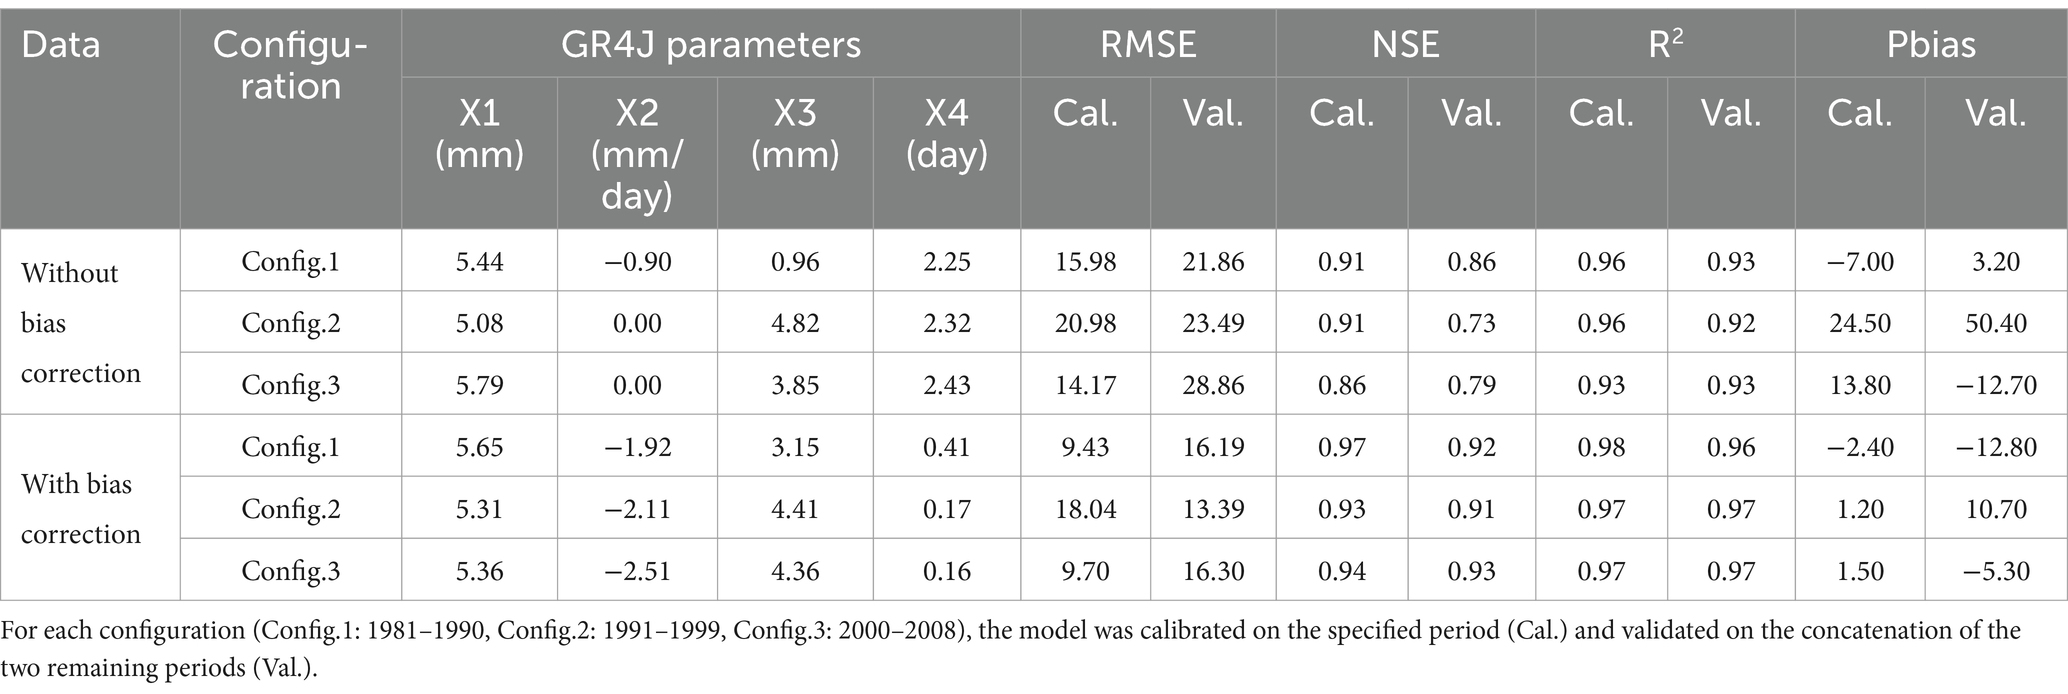
Table 3. Calibrated parameters and performance criteria of the GR4J model for the Oued El Makhazine dam catchment under the three calibration configurations.
Pbias show significant differences between the three configurations: Config.1 shows a moderate bias (−7.0% in calibration, 3.2% in validation), while Config.2 significantly overestimates the mean monthly discharge over the period 1981–2008 (24.50% in calibration and 50.40% in validation) (Table 3 and Figure 5, top right, line blue). Config.3 underestimates discharges during the wet period (October to March) and overestimates them during the low water period (April to September), with Pbias of 13.8% in calibration and-12.7% in validation (Table 3).
The calibrated parameters of the GR4J model show differences between the three configurations. The X1 and X4 parameters remain relatively constant, reflecting the consistency of the maximum capacity of the GR4J production reservoir and the delay between the three configurations. On the other hand, the X2 parameter increases from −0.90 (Config.1) to 0.00 (Config.2 and Config.3), assuming a different level of exchange with the outside of the catchment. Similarly, the X3 parameter varies from 0.96 mm (Config.1) to 4.82 and 3.85 mm for Config.2 and Config.3 respectively, reflecting a difference in the capacity of the routing reservoir between these three configurations.
3.4.2 Using CFSR-NCEP data with bias correction
The performance of the GR4J model was improved when using data with bias correction, with a very good performance range of statistical criteria. A visual (Figure 5) and quantitative (Table 3) comparison of the performance criteria over the period 1981–2008, both during calibration and validation, confirms this improvement. The NSE and R2 values were slightly higher than those obtained using data without bias correction, with values above 0.92 and 0.96, respectively, for the calibration and validation periods in all three configurations. This indicates a very good agreement between simulated and observed discharges in terms of seasonal variations. The hydrograms also show an improvement in the simulation of high discharges for the three configurations. In addition, the Pbias values did not exceed 17.70% in absolute terms, indicating very acceptable results.
Using data with bias correction minimizes the differences in calibrated model parameters, with minimal variation between configurations. The hydrograms showed no clear differences between the configurations. However, it should be noted that Config.2 (blue line in Figure 5, bottom right) slightly overestimates the mean monthly discharges from December to May. Nevertheless, this overestimation remains much lower than that observed with data without bias correction, with Pbias values of 1.2% during calibration and 17.70% during validation.
Overall, the GR4J model demonstrated excellent performance when input variables (P and PET) were bias corrected (see Figure 6).
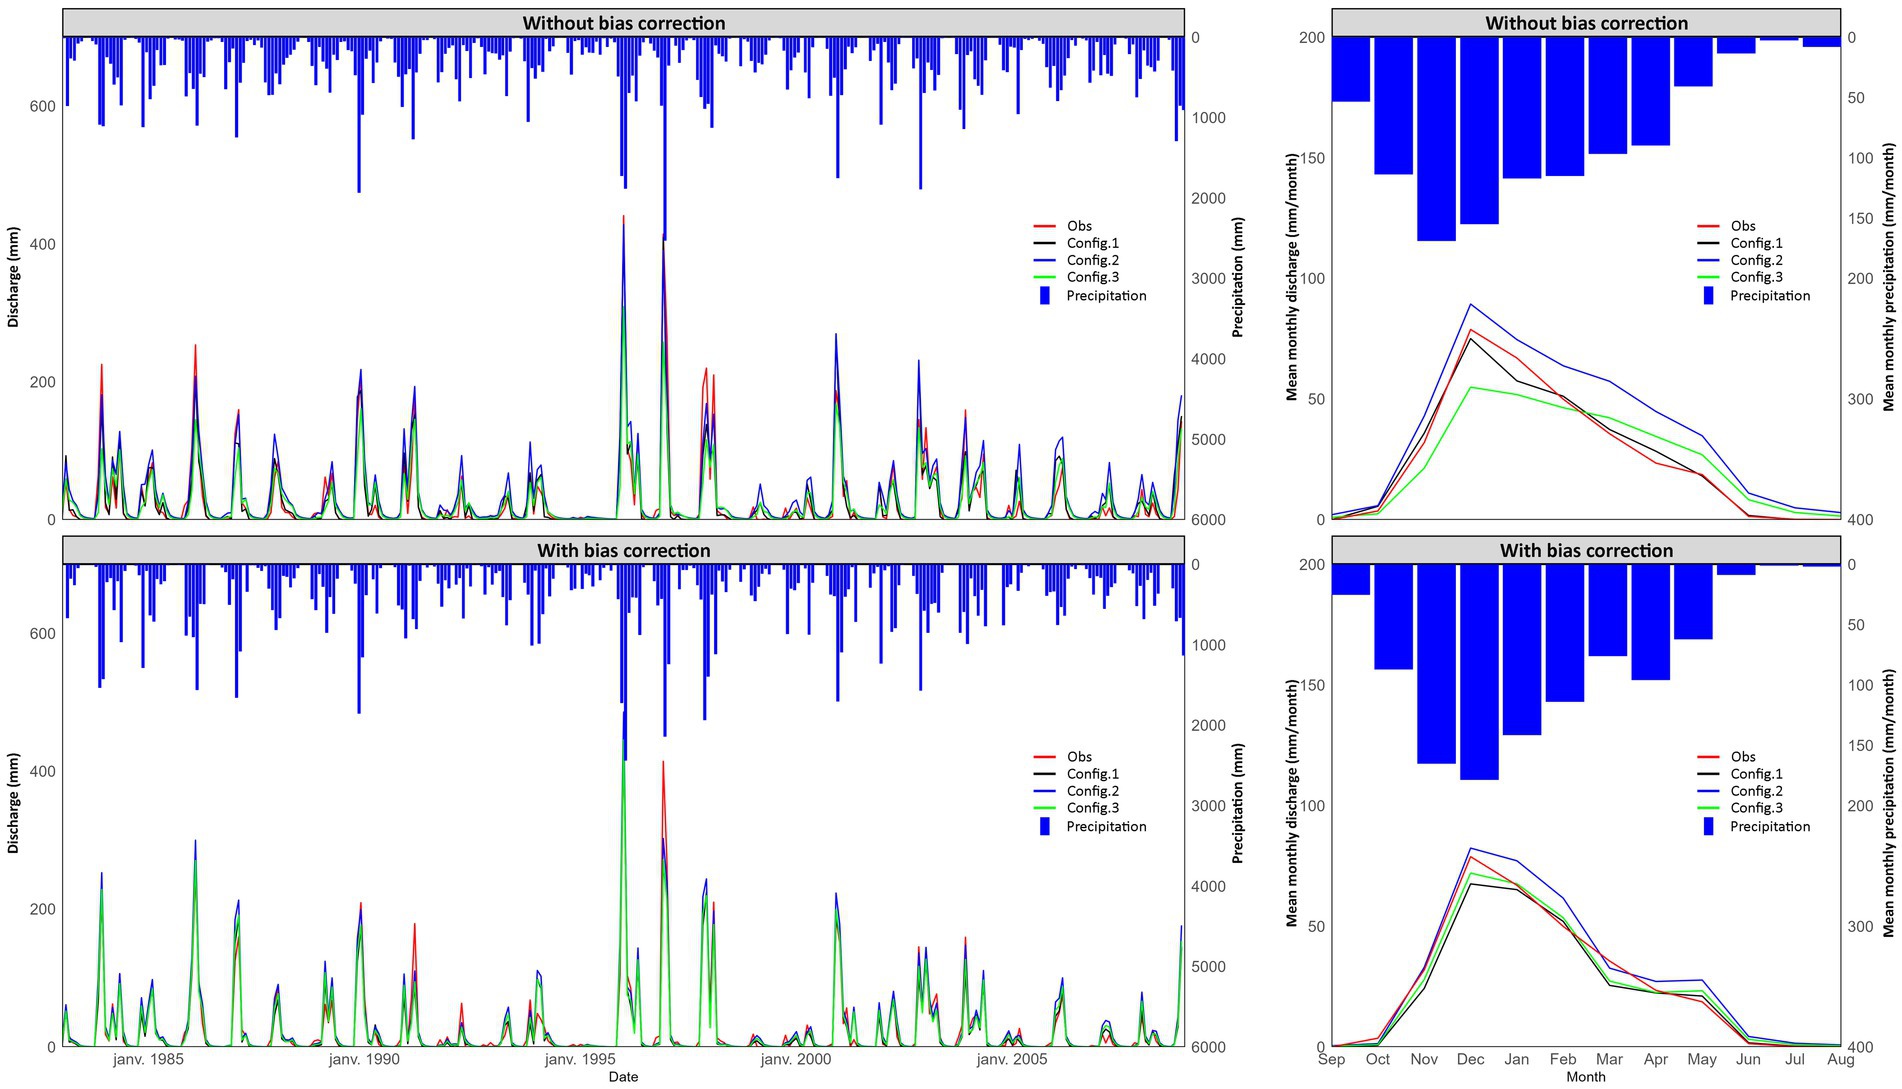
Figure 6. GR4J model calibration results: (right) monthly variation and (left) monthly mean of precipitation, observed discharge, and simulated discharge (mm month−1) using parameters sets from Config.1, Config.2 and Config.3 over the simulation period (1981–2008); using data without (top) and with (bottom) bias correction.
4 Discussions
4.1 Simulated discharge using SWAT model
Although other studies have reported good results with the SWAT model in catchments similar to the Oued El Makhazine dam catchment (Aloui et al., 2023; Chkara and EL Morabiti, 2016; Markhi et al., 2019; Sellami et al., 2016; Tan et al., 2020), the results obtained in this study are not satisfactory when using CFSR-NCEP data with or without bias correction. Fadil et al. (2011) demonstrated that the SWAT model yielded highly satisfactory results in simulating discharges in the Bouregreg catchment (Morocco), achieving an NSE coefficient of over 0.80 and an R2 exceeding 0.9. Milewski et al. (2020) employed databases identical to those used in our study as inputs for the SWAT model in the Oum Er Rbia basins (central Morocco): DEM (ASTER-GDEM), a soil map (HWSD), land cover data (Corine Land Cover, 2000), and meteorological data for precipitation and temperature without bias correction (sourced from CFSR-NCEP reanalysis). They successfully calibrated the model with an NSE coefficient greater than 0.65 and an R2 exceeding 0.75, which is not in line with results of this paper. Moreover, Mararakanye et al. (2020) evaluated the performance of the SWAT model using CFSR-NCEP data (without bias correction) to simulate runoff in the lower Vaal catchment. Their results showed poor statistical agreement between CFSR precipitation and rain gauge data. They reported that the SWAT model performed poorly in simulating discharges with these data. These results are consistent with the results of this study.
In addition to the low quality of the CFSR-NCEP data, the less satisfactory results of the SWAT model obtained in this study can be explained by the inaccuracies in the spatial data utilized and their unsuitable resolution. Serval studies have analyzed the sensitivity of the SWAT model to soil data. They have demonstrated that the resolution of the soil map used, as well as the type and amount of information present on it, significantly impact the quality of the simulations (Bouslihim et al., 2019; Romanowicz et al., 2005; Worqlul et al., 2018; Ye et al., 2011). Ye et al. (2011) analyzed the impact of the spatial resolution of soil data, in a large wetland catchment of the Xinjiang River (15,535 km2) in the Poyang Lake catchment in China. They revealed that soil data resolution influences the quality of simulations by altering soil water storage. The high-resolution soil data generates higher monthly streamflow simulations compared to the lower-resolution data across the entire watershed. In a related study, Bouslihim et al. (2019) performed a similar analysis on the Tamedroust catchment (Morocco), with highly contrasting climatic conditions during the period 1998–2002. They used two soil databases: (i) HWSD-2 L, a low-resolution database with only three soil types, and (ii) TAMED-SOL, a refined database comprising 11 soil types, developed through field measurements and laboratory soil analysis. Initial results, prior to calibration, highlighted significant variability and the critical influence of soil characteristics on different aspects of the hydrological cycle. Simulated discharges using the HWSD-2 L database were consistently lower than those simulated with TAMED-SOL, despite both databases overestimating observed discharges. Model calibration significantly improved model performance for both databases, achieving an R2 and an NSE of about 0.64 and 0.65, respectively. The findings underscore the pivotal role of soil data quality and resolution in influencing the accuracy of SWAT model simulations across all components of the hydrological cycle, mainly discharges.
Other studies have shown that the quality and resolution of the land use map significantly affect SWAT model performance (Moriasi and Starks, 2010). Furthermore, using a single land use map (from 1 year, or the average over several years) throughout the simulation period fails to integrate the variability or changes in land use and agricultural practices into the modelling approach. Indeed, Jin et al. (2019) demonstrated that using a high-resolution precision dataset and a reduced number of land-use classes can improve the performance of the hydrological model between 1.1 and 6.9%. Additionally, the same authors have shown that using multiple years of land cover/land use data, with reduced time intervals (e.g., annual), can improve the modelling of discharges by about 2.2 to 13.9% compared to using only 1 year. However, El Harraki et al. (2021) did not find any improvement in the modelling discharge through the SWAT model by refining the spatial resolution of the land use data. The land use map used in this study has a resolution of 30 m, but it is not highly detailed. In addition, agricultural management and practices (tillage, drainage, irrigation, pumping, etc.) were not simulated. The accuracy of certain parameters may have had an impact on the results and may explain the poor performance of SWAT model over the catchment area.
CFSR-NCEP data with bias correction shows good agreement with observed data. Our simulations using CFSR-NCEP data with bias correction improved the SWAT model discharge simulations and minimized biases in the simulated discharges. However, despite this improvement, the overall performance of SWAT in this case remains unsatisfactory. This highlights the importance of meteorological data quality in accurately simulating discharges using the SWAT model. In addition, the use of bias-corrected data reduces the differences in model performance between the three configurations and improves the stability of the SWAT model under varying precipitation conditions. The application of bias correction methods to the CFSR-NCEP reanalysis data (precipitation and temperature) prior to their use in the SWAT model is crucial to further improve the results.
4.2 Simulated discharge using GR4J model
Our results demonstrate the effective performance of the GR4J model in simulating discharges, aligning with the results of several previous studies conducted in the Mediterranean region and in regions with hydro-climatic conditions like the study context (high variability of the hydro-climatic regime). Those work has shown the good performance of GR4J model in simulating discharge (Ait Naceur et al., 2025; Kodja et al., 2020; Oueldkaddour et al., 2021). In general, the GR4J model underestimates high-peaks events and overestimates low-discharges, which is a common modelling problem already observed by many authors (Rwasoka et al., 2014; Tramblay et al., 2013).
Furthermore, conceptual and global hydrological models such as GR4J are not designed to handle abrupt and widespread transitions in climatic conditions (Gutierrez-Jurado et al., 2021) and are unable to simulate extreme values whose time scale is more at the event level (a few hours to a few days). Moreover, errors in CFSR-NCEP data without bias correction and measured discharges may explain this anomaly. In fact, using data with bias correction solves this problem and gives a better simulation of peak events. In larger catchments or when the density of observations is higher, distributed and semi-distributed hydrological models can help account for the spatial and temporal variability of precipitation (Aouissi et al., 2018).
For GR4J, a slight difference was observed between the three calibration configurations in terms of performance criteria (in calibration and validation). The results show that the distribution of the four GR4J model parameters is significantly different under contrasting precipitation conditions (using data without bias correction). Moreover, using data with bias minimizes variation in calibrated model parameters among the three configurations. This shows that the GR4J model parameters can be transferred to different climatic conditions. In fact, the three configurations have been calibrated over three contrasting periods in terms of precipitation (Hrour et al., 2022). It should be noted that in the present study we have only focused on the performance of the model in simulating discharges.
4.3 Comparative analysis of the two models
In this study, the inter-comparison between the semi-distributed model (SWAT) and the conceptual lumped model (GR4J) was carried out to identify the most robust model for simulating discharge from CFSR-NCEP satellite meteorological data, with and without bias correction, and to assess the transferability of its parameters under contrasting precipitation conditions.
The GR4J model performed well with NCEP data without bias correction (Figure 5 and Table 3), illustrating its ability to compensate for the poor quality of the meteorological data input. This robustness can be attributed to its simple and parsimonious structure (two reservoirs and only four parameters), which limits over-parametrization and minimize the impact of the input data bias (Darbandsari and Coulibaly, 2020; Pushpalatha et al., 2012). Furthermore, the calibration of conceptual models such as GR4J can deform the parameters to produce good results even with data without bias correction (Drogue and Khediri, 2016). On the other hand, results show a slight improvement in GR4J performance using data with bias correction, which is in line with the work of Coron et al. (2012), who found that bias correction provides limited gains in some cases. These results lend support to the idea that GR4J is particularly well suited to contexts in which data are incomplete or of limited quality. Furthermore, the model showed satisfactory calibration and validation performance for different calibration configurations, with or without bias correction, highlighting temporal transferability of its calibrated parameters.
The performance of the SWAT model is highly dependent on the quality of the meteorological data. When using data without bias correction, performance is unsatisfactory, but becomes acceptable after bias correction, highlighting the importance of rigorous pre-processing of inputs (Fuka et al., 2014). Although capable of modelling complex hydrological processes, the SWAT model is sensitive to biases in the input data, which are propagated into the calculation of key processes such as discharge and aquifer recharge (Arnold et al., 2012; Ashraf Vaghefi et al., 2015). This was confirmed by Srivastava et al. (2020), who compared a semi-distributed and a lumped model, again demonstrating the superiority of the lumped model for hydrological modelling in data-limited basins. However, the stability of performance between the three calibration configurations for data with and without bias correction underlines a certain temporal transferability of its parameters, even under different climatic conditions.
5 Conclusion
This study evaluates the performance of the semi-distributed model SWAT and the conceptual lumped model GR4J, to simulate monthly discharge using CFSR-NCEP satellite meteorological data in the Oued El Makhazine dam catchment, a data-scarce catchment. First, precipitation and temperature data from the CFSR-NCEP reanalysis were compared with those observed on a monthly timescale, revealing poor agreement between the two sources. Precipitation and potential evaporation were bias corrected. The models were calibrated over three sub-periods with contrasting precipitation conditions to assess the transferability of its parameters under different climatic conditions. The performance of the SWAT and GR4J models in simulating monthly discharge was then assessed using daily CFSR-NCEP data, with and without bias correction.
Without bias correction, the two models reproduced the monthly runoff trends (base and peak) well, although to different extents. The SWAT model performed unsatisfactorily, with an NSE of less than 0.60 over the three calibration periods, mainly due to biases in the meteorological data and the low quality of the spatial data. In contrast, the GR4J model performed well, with an average NSE of 0.89 over all calibration and validation periods, demonstrating its ability to assimilate low quality input data. However, with bias correction, both models improved their performance: SWAT achieved an NSE of more than 0.78, while GR4J achieved an NSE of more than 0.91 over all calibration and validation periods. On the other hand, this study showed that the performance of the two models remained stable between the different calibration configurations, indicating that their parameters are transferable over time, even under varying climatic conditions.
The study concludes that the GR4J model is the most robust for data-poor catchments, thanks to its ability to handle uncertainties in input data such as precipitation and temperature. CFSR-NCEP data are a promising source for feeding hydrological models in these regions. However, the biases inherent in these data need to be corrected, particularly before use in semi-distributed models such as the SWAT model.
This study provides valuable information for researchers and practitioners working on hydrological modelling in data-limited contexts. However, its conclusions are mainly applicable to basins with similar morphological characteristics and climatic conditions. Further research on other basin types and with different spatial and climatic data is recommended.
Data availability statement
The data analyzed in this study is subject to the following licenses/restrictions: the data from Moroccan agencies cannot be shared; however, all satellite weather data and hydrological simulation results will be made available on request to aHJvdXIuaWF2QGdtYWlsLmNvbQ==.
Author contributions
YH: Conceptualization, Data curation, Formal analysis, Investigation, Methodology, Resources, Software, Validation, Visualization, Writing – original draft, Writing – review & editing. ZT: Conceptualization, Formal analysis, Methodology, Project administration, Supervision, Validation, Writing – review & editing. PR-G: Conceptualization, Formal analysis, Methodology, Validation, Writing – review & editing. YA-B: Conceptualization, Formal analysis, Methodology, Validation, Writing – review & editing. OF: Conceptualization, Formal analysis, Methodology, Validation, Writing – review & editing.
Funding
The author(s) declare that financial support was received for the research and/or publication of this article. YH was funded by the PHC Toubkal program (No TBK/20/95 No CAMPUS: 43710YB) and “Ambassade de France au Maroc”.
Acknowledgments
We would like to thank ABHL and ORMVAL for providing the data and for the valuable discussions.
Conflict of interest
The authors declare that the research was conducted in the absence of any commercial or financial relationships that could be construed as a potential conflict of interest.
Generative AI statement
The authors declare that no Gen AI was used in the creation of this manuscript.
Publisher’s note
All claims expressed in this article are solely those of the authors and do not necessarily represent those of their affiliated organizations, or those of the publisher, the editors and the reviewers. Any product that may be evaluated in this article, or claim that may be made by its manufacturer, is not guaranteed or endorsed by the publisher.
Supplementary material
The Supplementary material for this article can be found online at: https://www.frontiersin.org/articles/10.3389/frwa.2025.1582589/full#supplementary-material
Footnotes
References
Aawar, T., and Khare, D. (2020). Assessment of climate change impacts on streamflow through hydrological model using SWAT model: a case study of Afghanistan. Model. Earth Syst. Environ. 6, 1427–1437. doi: 10.1007/s40808-020-00759-0
Abbaspour, K. C. (2008). SWAT-CUP2: SWAT calibration and uncertainty programs–a user manual. Department of Systems Analysis. Integrated assessment and modelling (SIAM), Eawag, Swiss Federal Institute of Aquatic Science and Technology, Duebendorf, Switzerland.
Abbaspour, K. C., Vaghefi, S. A., and Srinivasan, R. (2017). A guideline for successful calibration and uncertainty analysis for soil and water assessment: a review of papers from the 2016 international SWAT conference. Water 10. doi: 10.3390/w10010006
Abbaspour, K. C., Vaghefi, S. A., Yang, H., and Srinivasan, R. (2019). Global soil, landuse, evapotranspiration, historical and future weather databases for SWAT applications. Sci. Data 6:263. doi: 10.1038/s41597-019-0282-4
Abbaspour, K. C., Vejdani, M., Haghighat, S., and Yang, J. (2007) Swat-cup calibration and uncertainty programs for SWAT, in: MODSIM 2007 international congress on modelling and simulation, modelling and simulation society of Australia and New Zealand. Swiss Federal Institute of Aquatic Science and Technology Dübendorf, Switzerland, pp. 1596–1602
Abera, W., Brocca, L., and Rigon, R. (2016). Comparative evaluation of different satellite rainfall estimation products and bias correction in the upper Blue Nile (UBN) basin. Atmos. Res. 178-179, 471–483. doi: 10.1016/j.atmosres.2016.04.017
Acharki, S., Taia, S., Arjdal, Y., and Hack, J. (2023). Hydrological modeling of spatial and temporal variations in streamflow due to multiple climate change scenarios in northwestern Morocco. Clim. Serv. 30:100388. doi: 10.1016/j.cliser.2023.100388
Ait Naceur, K., El Khalki, E. M., Hadri, A., Jaffar, O., Brocca, L., Saidi, M. E., et al. (2025). Comparison of calibration strategies for daily streamflow simulations in semi-arid basins. Water Resour. Manag. 39:1089–1105. doi: 10.1007/s11269-024-04007-3
Alehu, B. A., and Bitana, S. G. (2023). Assessment of climate change impact on water balance of Lake Hawassa catchment. Environ. Process. 10:14. doi: 10.1007/s40710-023-00626-x
Alitane, A., Essahlaoui, A., Van Griensven, A., Yimer, E. A., Essahlaoui, N., Mohajane, M., et al. (2022). Towards a decision-making approach of sustainable water resources management based on hydrological modeling: a case study in Central Morocco. Sustainability 14:10848. doi: 10.3390/su141710848
Allan, R. P., Barlow, M., Byrne, M. P., Cherchi, A., Douville, H., Fowler, H. J., et al. (2020). Advances in understanding large-scale responses of the water cycle to climate change. Ann. N. Y. Acad. Sci. 1472, 49–75. doi: 10.1111/nyas.14337
Aloui, S., Mazzoni, A., Elomri, A., Aouissi, J., Boufekane, A., and Zghibi, A. (2023). A review of soil and water assessment tool (SWAT) studies of Mediterranean catchments: applications, feasibility, and future directions. J. Environ. Manag. 326:116799. doi: 10.1016/j.jenvman.2022.116799
Anshuman, A., Kunnath-Poovakka, A., and Eldho, T. I. (2021). Performance evaluation of conceptual rainfall-runoff models GR4J and AWBM. ISH J. Hydraul. Eng. 27, 365–374. doi: 10.1080/09715010.2018.1556124
Aouissi, J., Benabdallah, S., Chabaâne, Z. L., and Cudennec, C. (2013). Sensitivity analysis of SWAT model to the spatial rainfall distribution and watershed subdivision in streamflow simulations in the Mediterranean context: a case study in the Joumine watershed. Tunisia, in: 2013 5th international conference on modeling, simulation and applied optimization (ICMSAO). Presented at the 2013 5th International Conference on Modeling, Simulation and Applied Optimization (ICMSAO), pp. 1–6. doi: 10.1109/ICMSAO.2013.6552706
Aouissi, J., Benabdallah, S., Chabaâne, Z. L., and Cudennec, C. (2018). Valuing scarce observation of rainfall variability with flexible semi-distributed hydrological modelling–mountainous Mediterranean context. Sci. Total Environ. 643, 346–356. doi: 10.1016/j.scitotenv.2018.06.086
Arnold, J. G., Engel, B. A., and Srinivasan, R. (1993) A continuous time, grid cell watershed model. Application of advanced information technologies for management of natural resources, pp. 17–19
Arnold, J. G., Moriasi, D. N., Gassman, P. W., Abbaspour, K. C., White, M. J., Srinivasan, R., et al. (2012). SWAT: model use, calibration, and validation. Trans. ASABE 55, 1491–1508. doi: 10.13031/2013.42256
Arnold, J. G., Srinivasan, R., Muttiah, R. S., and Williams, J. R. (1998). Large area hydrologic modeling and assessment part I: model development. J. Am. Water Resour. Assoc. 34, 73–89. doi: 10.1111/j.1752-1688.1998.tb05961.x
Ashraf Vaghefi, S., Mousavi, S. J., Abbaspour, K. C., Srinivasan, R., and Arnold, J. R. (2015). Integration of hydrologic and water allocation models in basin-scale water resources management considering crop pattern and climate change: Karkheh River basin in Iran. Reg. Environ. Chang. 15, 475–484. doi: 10.1007/s10113-013-0573-9
Badham, J., Elsawah, S., Guillaume, J. H. A., Hamilton, S. H., Hunt, R. J., Jakeman, A. J., et al. (2019). Effective modeling for integrated water resource management: a guide to contextual practices by phases and steps and future opportunities. Environ. Model. Softw. 116, 40–56. doi: 10.1016/j.envsoft.2019.02.013
Borrelli, P., Robinson, D. A., Panagos, P., Lugato, E., Yang, J. E., Alewell, C., et al. (2020). Land use and climate change impacts on global soil erosion by water (2015-2070). Proc. Natl. Acad. Sci. 117, 21994–22001. doi: 10.1073/pnas.2001403117
Bouadila, A., Bouizrou, I., Aqnouy, M., En-nagre, K., El Yousfi, Y., Khafouri, A., et al. (2023). Streamflow simulation in semiarid data-scarce regions: a comparative study of distributed and lumped models at Aguenza watershed (Morocco). Water 15:1602. doi: 10.3390/w15081602
Bouizrou, I., Bouadila, A., Aqnouy, M., and Gourfi, A. (2023). Assessment of remotely sensed precipitation products for climatic and hydrological studies in arid to semi-arid data-scarce region, Central-Western Morocco. Remote Sens. Appl.: Soc. Environ. 30:100976. doi: 10.1016/j.rsase.2023.100976
Bouslihim, Y., Rochdi, A., El Amrani Paaza, N., and Liuzzo, L. (2019). Understanding the effects of soil data quality on SWAT model performance and hydrological processes in Tamedroust watershed (Morocco). J. Afr. Earth Sci. 160:103616. doi: 10.1016/j.jafrearsci.2019.103616
Briak, H., Mrabet, R., Moussadek, R., and Aboumaria, K. (2019). Use of a calibrated SWAT model to evaluate the effects of agricultural BMPs on sediments of the Kalaya river basin (north of Morocco). Int. Soil Water Conserv. Res. 7, 176–183. doi: 10.1016/j.iswcr.2019.02.002
Brigode, P., Oudin, L., and Perrin, C. (2013). Hydrological model parameter instability: a source of additional uncertainty in estimating the hydrological impacts of climate change? J. Hydrol. 476, 410–425. doi: 10.1016/j.jhydrol.2012.11.012
Brouziyne, Y., Abouabdillah, A., Bouabid, R., Benaabidate, L., and Oueslati, O. (2017). Swat manual calibration and parameters sensitivity analysis in a semi-arid watershed in North-Western Morocco. Arab. J. Geosci. 10:427. doi: 10.1007/s12517-017-3220-9
Brouziyne, Y., Abouabdillah, A., Hirich, A., Bouabid, R., Zaaboul, R., and Benaabidate, L. (2018). Modeling sustainable adaptation strategies toward a climate-smart agriculture in a Mediterranean watershed under projected climate change scenarios. Agric. Syst. 162, 154–163. doi: 10.1016/j.agsy.2018.01.024
Bui, M. T., Lu, J., and Nie, L. (2021). Evaluation of the climate forecast system reanalysis data for hydrological model in the Arctic watershed Målselv. J. Water Clim. Chang. 12, 3481–3504. doi: 10.2166/wcc.2021.346
Caloiero, T., Caloiero, P., and Frustaci, F. (2018). Long-term precipitation trend analysis in Europe and in the Mediterranean basin. Water Environ. J. 32, 433–445. doi: 10.1111/wej.12346
Chkara, I., and EL Morabiti, K. (2016) Simulation des transferts de polluants sous influences agricole dans la nappe de Rmel (Larache, Maroc)
Choukri, F., Raclot, D., Naimi, M., Chikhaoui, M., Nunes, J. P., Huard, F., et al. (2020). Distinct and combined impacts of climate and land use scenarios on water availability and sediment loads for a water supply reservoir in northern Morocco. Int. Soil Water Conserv. Res. 8, 141–153. doi: 10.1016/j.iswcr.2020.03.003
Clark, M. P., Bierkens, M. F. P., Samaniego, L., Woods, R. A., Uijlenhoet, R., Bennett, K. E., et al. (2017). The evolution of process-based hydrologic models: historical challenges and the collective quest for physical realism. Hydrol. Earth Syst. Sci. 21, 3427–3440. doi: 10.5194/hess-21-3427-2017
Coron, L., Andréassian, V., Perrin, C., Lerat, J., Vaze, J., Bourqui, M., et al. (2012). Crash testing hydrological models in contrasted climate conditions: an experiment on 216 Australian catchments. Water Resour. Res. 48. doi: 10.1029/2011WR011721
Coron, L., Thirel, G., Delaigue, O., Perrin, C., and Andréassian, V. (2017). The suite of lumped GR hydrological models in an R package. Environ. Model. Softw. 94, 166–171. doi: 10.1016/j.envsoft.2017.05.002
Corwin, D. L., Vaughan, P. J., and Loague, K. (1997). Modeling nonpoint source pollutants in the vadose zone with GIS. Environ. Sci. Technol. 31, 2157–2175. doi: 10.1021/es960796v
Cos, J., Doblas-Reyes, F., Jury, M., Marcos, R., Bretonnière, P.-A., and Samsó, M. (2022). The Mediterranean climate change hotspot in the CMIP5 and CMIP6 projections. Earth Syst. Dynam. 13, 321–340. doi: 10.5194/esd-13-321-2022
Cui, B., Toth, Z., Zhu, Y., and Hou, D. (2012). Bias correction for global ensemble forecast. Weather Forecast. 27, 396–410. doi: 10.1175/WAF-D-11-00011.1
Darbandsari, P., and Coulibaly, P. (2020). Inter-comparison of lumped hydrological models in data-scarce watersheds using different precipitation forcing data sets: case study of northern Ontario, Canada. J. Hydrol. Reg. Stud. 31:100730. doi: 10.1016/j.ejrh.2020.100730
Deb, P., and Kiem, A. S. (2020). Evaluation of rainfall–runoff model performance under non-stationary hydroclimatic conditions. Hydrol. Sci. J. 65, 1667–1684. doi: 10.1080/02626667.2020.1754420
Devia, G. K., Ganasri, B. P., and Dwarakish, G. S. (2015). A review on hydrological models. Aquat. Procedia 4, 1001–1007. doi: 10.1016/j.aqpro.2015.02.126
Dile, Y. T., and Srinivasan, R. (2014). Evaluation of CFSR climate data for hydrologic prediction in data-scarce watersheds: an application in the Blue Nile River basin. J. Am. Water Resour. Assoc. 50, 1226–1241. doi: 10.1111/jawr.12182
Drogue, G., and Khediri, W. B. (2016). Catchment model regionalization approach based on spatial proximity: does a neighbor catchment-based rainfall input strengthen the method? J. Hydrol. Reg. Stud. 8, 26–42. doi: 10.1016/j.ejrh.2016.07.002
El Harraki, W., Ouazar, D., Bouziane, A., El Harraki, I., and Hasnaoui, D. (2021). Streamflow prediction upstream of a dam using SWAT and assessment of the impact of land use spatial resolution on model performance. Environ. Process. 8, 1165–1186. doi: 10.1007/s40710-021-00532-0
El Khalki, E. M., Tramblay, Y., Hanich, L., Marchane, A., Boudhar, A., and Hakkani, B. (2021). Climate change impacts on surface water resources in the Oued El Abid basin, Morocco. Hydrol. Sci. J. 66, 2132–2145. doi: 10.1080/02626667.2021.1982137
Fadil, A., Rhinane, H., Kaoukaya, A., Kharchaf, Y., and Bachir, O. A. (2011). Hydrologic modeling of the Bouregreg watershed (Morocco) using GIS and SWAT model. J. Geogr. Inf. Syst. 3:279. doi: 10.4236/jgis.2011.34024
FAO, IIASA, ISRIC, ISSCAS, JRC (2012). Harmonized world soil database (version 1.2). Rome, Italy: FAO.
Fuka, D. R., Walter, M. T., MacAlister, C., Degaetano, A. T., Steenhuis, T. S., and Easton, Z. M. (2014). Using the climate forecast system reanalysis as weather input data for watershed models. Hydrol. Process. 28, 5613–5623. doi: 10.1002/hyp.10073
Gutierrez-Jurado, K. Y., Partington, D., and Shanafield, M. (2021). Taking theory to the field: streamflow generation mechanisms in an intermittent Mediterranean catchment. Hydrol. Earth Syst. Sci. 25, 4299–4317. doi: 10.5194/hess-25-4299-2021
Hallett, C. S., Hobday, A. J., Tweedley, J. R., Thompson, P. A., McMahon, K., and Valesini, F. J. (2018). Observed and predicted impacts of climate change on the estuaries of South-Western Australia, a Mediterranean climate region. Reg. Environ. Chang. 18, 1357–1373. doi: 10.1007/s10113-017-1264-8
Hermassi, T., Jarray, F., Tlili, W., Achour, I., and Mechergui, M. (2025). Integrative hydrologic modelling of soil and water conservation strategies: a SWAT-based evaluation of environmental resilience in the Merguellil watershed, Tunisia. Front. Water 7. doi: 10.3389/frwa.2025.1521812
Hrachowitz, M., and Clark, M. P. (2017). HESS opinions: the complementary merits of competing modelling philosophies in hydrology. Hydrol. Earth Syst. Sci. 21, 3953–3973. doi: 10.5194/hess-21-3953-2017
Hrour, Y., Fovet, O., Lacombe, G., Rousseau-Gueutin, P., Sebari, K., Pichelin, P., et al. (2023). A framework to assess future water-resource under climate change in northern Morocco using hydro-climatic modelling and water-withdrawal scenarios. J. Hydrol.: Reg. Stud. 48:101465. doi: 10.1016/j.ejrh.2023.101465
Hrour, Y., Thomas, Z., Fovet, O., Sebari, K., and Rousseau-Gueutin, P. (2022). Changes in precipitation and discharge in a Mediterranean catchment as a response to climate change and human activities. J. Water Clim. Change 13, 3253–3273. doi: 10.2166/wcc.2022.074
Jajarmizadeh, M., Harun, S., and Salarpour, M. (2012). A review on theoretical consideration and types of models in hydrology. J. Environ. Sci. Technol. 5, 249–261. doi: 10.3923/jest.2012.249.261
Javed, S. A., Haider, A., and Nawaz, M. (2020). How agricultural practices managing market risk get attributed to climate change? Quasi-experiment evidence. J. Rural. Stud. 73, 46–55. doi: 10.1016/j.jrurstud.2019.11.020
Jin, X., Jin, Y., Yuan, D., and Mao, X. (2019). Effects of land-use data resolution on hydrologic modelling, a case study in the upper reach of the Heihe River, Northwest China. Ecol. Model. 404, 61–68. doi: 10.1016/j.ecolmodel.2019.02.011
Joseph, J., Ghosh, S., Pathak, A., and Sahai, A. K. (2018). Hydrologic impacts of climate change: comparisons between hydrological parameter uncertainty and climate model uncertainty. J. Hydrol. 566, 1–22. doi: 10.1016/j.jhydrol.2018.08.080
Khaleghi, M. R., and Hosseini, S. H. (2024). Using SWAT and SWAT-CUP for hydrological simulation and uncertainty analysis of the arid and semiarid watersheds (case study: Zoshk watershed, Shandiz, Iran). Appl. Water Sci. 14:266. doi: 10.1007/s13201-024-02327-8
Klemeš, V. (1986). Operational testing of hydrological simulation models. Hydrol. Sci. J. 31, 13–24. doi: 10.1080/02626668609491024
Kodja, D. J., Akognongbé, A. J. S., Amoussou, E., Mahé, G., Vissin, E. W., Paturel, J.-E., et al. (2020). Calibration of the hydrological model GR4J from potential evapotranspiration estimates by the penman-Monteith and Oudin methods in the Ouémé watershed (West Africa). Proc. Int. Assoc. Hydrol. Sci. 383, 163–169. doi: 10.5194/piahs-383-163-2020
Krysanova, V., Donnelly, C., Gelfan, A., Gerten, D., Arheimer, B., Hattermann, F., et al. (2018). How the performance of hydrological models relates to credibility of projections under climate change. Hydrol. Sci. J. 63, 696–720. doi: 10.1080/02626667.2018.1446214
Kusi, K. K., Khattabi, A., and Mhammdi, N. (2023). Evaluating the impacts of land use and climate changes on water ecosystem services in the Souss watershed, Morocco. Arab. J. Geosci. 16:126. doi: 10.1007/s12517-023-11206-6
Lagrini, K., Ghafiri, A., Ouali, A., Elrhaz, K., Feddoul, R., and Elmoutaki, S. (2020). Application of geographical information system (GIS) for the development of climatological air temperature vulnerability maps: an example from Morocco. Meteorol. Appl. 27:e1871. doi: 10.1002/met.1871
Lamane, H., Moussadek, R., Baghdad, B., Mouhir, L., Briak, H., Laghlimi, M., et al. (2022). Soil water erosion assessment in Morocco through modeling and fingerprinting applications: A review. Heliyon 8:e10209. doi: 10.1016/j.heliyon.2022.e10209
Lelieveld, J., Proestos, Y., Hadjinicolaou, P., Tanarhte, M., Tyrlis, E., and Zittis, G. (2016). Strongly increasing heat extremes in the Middle East and North Africa (MENA) in the 21st century. Clim. Chang. 137, 245–260. doi: 10.1007/s10584-016-1665-6
Lionello, P., and Scarascia, L. (2018). The relation between climate change in the Mediterranean region and global warming. Reg. Environ. Chang. 18, 1481–1493. doi: 10.1007/s10113-018-1290-1
Mararakanye, N., Le Roux, J. J., and Franke, A. C. (2020). Using satellite-based weather data as input to SWAT in a data poor catchment. Phys. Chem. Earth A/B/C 117:102871. doi: 10.1016/j.pce.2020.102871
Markhi, A., Laftouhi, N., Grusson, Y., and Soulaimani, A. (2019). Assessment of potential soil erosion and sediment yield in the semi-arid N′ fis basin (high atlas, Morocco) using the SWAT model. Acta Geophys. 67, 263–272. doi: 10.1007/s11600-019-00251-z
Mehan, S., Aggarwal, R., Gitau, M. W., Flanagan, D. C., Wallace, C. W., and Frankenberger, J. R. (2019). Assessment of hydrology and nutrient losses in a changing climate in a subsurface-drained watershed. Sci. Total Environ. 688, 1236–1251. doi: 10.1016/j.scitotenv.2019.06.314
Memarian, H., Balasundram, S. K., Abbaspour, K. C., Talib, J. B., Boon Sung, C. T., and Sood, A. M. (2014). Swat-based hydrological modelling of tropical land-use scenarios. Hydrol. Sci. J. 59, 1808–1829. doi: 10.1080/02626667.2014.892598
Milewski, A., Seyoum, W. M., Elkadiri, R., and Durham, M. (2020). Multi-scale hydrologic sensitivity to climatic and anthropogenic changes in northern Morocco. Geosciences 10:13. doi: 10.3390/geosciences10010013
Monteiro, J. A. F., Strauch, M., Srinivasan, R., Abbaspour, K., and Gücker, B. (2016). Accuracy of grid precipitation data for Brazil: application in river discharge modelling of the Tocantins catchment. Hydrol. Process. 30, 1419–1430. doi: 10.1002/hyp.10708
Moriasi, D. N., Arnold, J. G., Van Liew, M. W., Bingner, R. L., Harmel, R. D., and Veith, T. L. (2007). Model evaluation guidelines for systematic quantification of accuracy in watershed simulations. Trans. ASABE 50, 885–900. doi: 10.13031/2013.23153
Moriasi, D. N., and Starks, P. J. (2010). Effects of the resolution of soil dataset and precipitation dataset on SWAT2005 streamflow calibration parameters and simulation accuracy. J. Soil Water Conserv. 65, 63–78. doi: 10.2489/jswc.65.2.63
Mouelhi, S. (2003). Vers une chaîne cohérente de modèles pluie-débit aux pas de temps pluriannue, annuel, mensuel et journalier. ENGREF (AgroParisTech).
Mouelhi, S., Michel, C., Perrin, C., and Andréassian, V. (2006). Stepwise development of a two-parameter monthly water balance model. J. Hydrol. 318, 200–214. doi: 10.1016/j.jhydrol.2005.06.014
Nash, J. E., and Sutcliffe, J. V. (1970). River flow forecasting through conceptual models part I—a discussion of principles. J. Hydrol. 10, 282–290. doi: 10.1016/0022-1694(70)90255-6
Naumann, G., Alfieri, L., Wyser, K., Mentaschi, L., Betts, R. A., Carrao, H., et al. (2018). Global changes in drought conditions under different levels of warming. Geophys. Res. Lett. 45, 3285–3296. doi: 10.1002/2017GL076521
Nazari-Sharabian, M., Taheriyoun, M., and Karakouzian, M. (2019). Sensitivity analysis of the DEM resolution and effective parameters of runoff yield in the SWAT model: a case study. J. Water Supply Res. Technol. AQUA 69, 39–54. doi: 10.2166/aqua.2019.044
Neitsch, S. L., Arnold, J. G., Kiniry, J. R., and Williams, J. R. (2011). Soil and water assessment tool theoretical documentation version 2009. Texas Water Resources Institute.
Ostad-Ali-Askari, K., Ghorbanizadeh Kharazi, H., Shayannejad, M., and Zareian, M. J. (2019). Effect of management strategies on reducing negative impacts of climate change on water resources of the Isfahan–Borkhar aquifer using MODFLOW. River Res. Appl. 35, 611–631. doi: 10.1002/rra.3463
Oueldkaddour, F.-Z. E., Wariaghli, F., Brirhet, H., and Yahyaoui, A. (2021). Hydrological modeling of rainfall-runoff of the semi-arid Aguibat Ezziar watershed through the GR4J model. Limnol. Rev. 21, 119–126. doi: 10.2478/limre-2021-0011
Paniconi, C., and Putti, M. (2015). Physically based modeling in catchment hydrology at 50: survey and outlook. Water Resour. Res. 51, 7090–7129. doi: 10.1002/2015WR017780
Perrin, C., Michel, C., and Andréassian, V. (2003). Improvement of a parsimonious model for streamflow simulation. J. Hydrol. 279, 275–289. doi: 10.1016/S0022-1694(03)00225-7
Pushpalatha, R., Perrin, C., Le Moine, N., and Andréassian, V. (2012). A review of efficiency criteria suitable for evaluating low-flow simulations. J. Hydrol. 420, 171–182. doi: 10.1016/j.jhydrol.2011.11.055
R Core Team (2021). R: A language and environment for statistical computing. R Foundation for Statistical Computing. https://www.R-project.org/
Rafik, A., Ait Brahim, Y., Amazirh, A., Ouarani, M., Bargam, B., Ouatiki, H., et al. (2023). Groundwater level forecasting in a data-scarce region through remote sensing data downscaling, hydrological modeling, and machine learning: A case study from Morocco. J. Hydrol.: Reg. Stud. 50:101569. doi: 10.1016/j.ejrh.2023.101569
Romanowicz, A. A., Vanclooster, M., Rounsevell, M., and La Junesse, I. (2005). Sensitivity of the SWAT model to the soil and land use data parametrisation: a case study in the Thyle catchment, Belgium. Ecol. Model. 187, 27–39. doi: 10.1016/j.ecolmodel.2005.01.025
Rwasoka, D. T., Madamombe, C. E., Gumindoga, W., and Kabobah, A. T. (2014). Calibration, validation, parameter indentifiability and uncertainty analysis of a 2–parameter parsimonious monthly rainfall-runoff model in two catchments in Zimbabwe. Phys. Chem. Earth. A/B/C/ 67-69, 36–46. doi: 10.1016/j.pce.2013.09.015
Saha, S., Moorthi, S., Pan, H.-L., Wu, X., Wang, J., Nadiga, S., et al. (2010). The NCEP climate forecast system reanalysis. Bull. Am. Meteorol. Soc. 91, 1015–1058. doi: 10.1175/2010BAMS3001.1
Sánchez-Gómez, A., Arnold, J. G., Bieger, K., Čerkasova, N., Sammons, N. B., Martínez-Pérez, S., et al. (2025). Modelling water management using SWAT+ : application of reservoirs release tables and the new water allocation module in a highly managed river basin. Water Resour. Manag. 39:143. doi: 10.1007/s11269-024-04071-9
Sellami, H., Benabdallah, S., La Jeunesse, I., and Vanclooster, M. (2016). Quantifying hydrological responses of small Mediterranean catchments under climate change projections. Sci. Total Environ. 543, 924–936. doi: 10.1016/j.scitotenv.2015.07.006
Séne, S. M. K., Faye, C., and Pande, C. B. (2024). Assessment of current and future trends in water resources in the Gambia River basin in a context of climate change. Environ. Sci. Eur. 36:32. doi: 10.1186/s12302-024-00848-2
Song, X., Zhang, J., Zhan, C., Xuan, Y., Ye, M., and Xu, C. (2015). Global sensitivity analysis in hydrological modeling: review of concepts, methods, theoretical framework, and applications. J. Hydrol. 523, 739–757. doi: 10.1016/j.jhydrol.2015.02.013
Srivastava, A., Deb, P., and Kumari, N. (2020). Multi-model approach to assess the dynamics of hydrologic components in a tropical ecosystem. Water Resour. Manag. 34, 327–341. doi: 10.1007/s11269-019-02452-z
Stephens, C. M., Johnson, F. M., and Marshall, L. A. (2018). Implications of future climate change for event-based hydrologic models. Adv. Water Resour. 119, 95–110. doi: 10.1016/j.advwatres.2018.07.004
Strohmeier, S., López López, P., Haddad, M., Nangia, V., Karrou, M., Montanaro, G., et al. (2020). Surface runoff and drought assessment using global water resources datasets – from Oum Er Rbia basin to the Moroccan country scale. Water Resour. Manag. 34, 2117–2133. doi: 10.1007/s11269-019-02251-6
Tan, M. L., Gassman, P. W., and Cracknell, A. P. (2017). Assessment of three long-term gridded climate products for hydro-climatic simulations in tropical river basins. Water 9:229. doi: 10.3390/w9030229
Tan, M. L., Gassman, P. W., Yang, X., and Haywood, J. (2020). A review of SWAT applications, performance and future needs for simulation of hydro-climatic extremes. Adv. Water Resour. 143:103662. doi: 10.1016/j.advwatres.2020.103662
Teutschbein, C., and Seibert, J. (2012). Bias correction of regional climate model simulations for hydrological climate-change impact studies: review and evaluation of different methods. J. Hydrol. 456-457, 12–29. doi: 10.1016/j.jhydrol.2012.05.052
Thirel, G., Andréassian, V., Perrin, C., Audouy, J.-N., Berthet, L., Edwards, P., et al. (2015). Hydrology under change: an evaluation protocol to investigate how hydrological models deal with changing catchments. Hydrol. Sci. J. 60, 1184–1199. doi: 10.1080/02626667.2014.967248
Tramblay, Y., Koutroulis, A., Samaniego, L., Vicente-Serrano, S. M., Volaire, F., Boone, A., et al. (2020). Challenges for drought assessment in the Mediterranean region under future climate scenarios. Earth-Sci. Rev. 210:103348. doi: 10.1016/j.earscirev.2020.103348
Tramblay, Y., Ruelland, D., Somot, S., Bouaicha, R., and Servat, E. (2013). High-resolution med-CORDEX regional climate model simulations for hydrological impact studies: a first evaluation of the ALADIN-climate model in Morocco. Hydrol. Earth Syst. Sci. 17, 3721–3739. doi: 10.5194/hess-17-3721-2013
Wei, X., Guo, S., and Xiong, L. (2021). Improving efficiency of hydrological prediction based on meteorological classification: a case study of gr4j model. Water 13:2546. doi: 10.3390/w13182546
Worqlul, A. W., Ayana, E. K., Yen, H., Jeong, J., MacAlister, C., Taylor, R., et al. (2018). Evaluating hydrologic responses to soil characteristics using SWAT model in a paired-watersheds in the upper Blue Nile Basin. Catena 163, 332–341. doi: 10.1016/j.catena.2017.12.040
Yang, Y., Gan, T. Y., and Tan, X. (2019). Spatiotemporal changes in precipitation extremes over Canada and their teleconnections to large-scale climate patterns. J. Hydrometeorol. 20, 275–296. doi: 10.1175/JHM-D-18-0004.1
Yao, J., Chen, Y., Yu, X., Zhao, Y., Guan, X., and Yang, L. (2020). Evaluation of multiple gridded precipitation datasets for the arid region of northwestern China. Atmos. Res. 236:104818. doi: 10.1016/j.atmosres.2019.104818
Ye, X., Zhang, Q., and Viney, N. R. (2011). The effect of soil data resolution on hydrological processes modelling in a large humid watershed. Hydrol. Process. 25, 130–140. doi: 10.1002/hyp.7823
Keywords: hydrological models, SWAT, GR4J, data scarcity, discharge simulation, parameters transferability, CFSR-NCEP reanalysis data
Citation: Hrour Y, Thomas Z, Rousseau-Gueutin P, Ait-Brahim Y and Fovet O (2025) Enhancing hydrological modeling with bias-corrected satellite weather data in data-scarce catchments: a comparative analysis of SWAT and GR4J models. Front. Water. 7:1582589. doi: 10.3389/frwa.2025.1582589
Edited by:
Nevil Wyndham Quinn, University of the West of England, United KingdomReviewed by:
Murat Şan, Gumushane University, TürkiyeMustapha Namous, Université Sultan Moulay Slimane, Morocco
Copyright © 2025 Hrour, Thomas, Rousseau-Gueutin, Ait-Brahim and Fovet. This is an open-access article distributed under the terms of the Creative Commons Attribution License (CC BY). The use, distribution or reproduction in other forums is permitted, provided the original author(s) and the copyright owner(s) are credited and that the original publication in this journal is cited, in accordance with accepted academic practice. No use, distribution or reproduction is permitted which does not comply with these terms.
*Correspondence: Youness Hrour, SHJvdXIuaWF2QGdtYWlsLmNvbQ==