 Dylan Laicher-Edwards1*
 Lei Liu1
 Kirsten Benkendorff2
 Scott G. Johnston1
 Angus Ferguson3
 Gloria M. S. Reithmaier4Renee Borrow1
 Damien T. Maher1
- 1School of Science and Engineering, Southern Cross University, Lismore, NSW, Australia
- 2National Marine Science Centre, Southern Cross University, Coffs Harbour, NSW, Australia
- 3New South Wales Department of Climate Change Energy the Environment and Water, Parramatta, NSW, Australia
- 4Goteborgs Universitet, Gothenburg, Sweden
Changing fire regimes, marked by more intense, extensive, and catastrophic wildfires are predicted to lead to significant shifts in carbon cycling along the land-ocean-aquatic-continuum (LOAC). One important consequence of bushfires is the mobilisation of dissolved black carbon (DBC), which can be released from soils overtime into downstream waters. Estuaries, which reside at the critical terrestrial-ocean interface, remain poorly studied in this context, despite their key role in processing and transporting organic matter. This study examined six intermittently closed and open lake or lagoons (ICOLLs) on the south coast of New South Wales, Australia, which were affected by the 2019–2020 bushfires. Surface water and shallow groundwater samples were analysed for dissolved organic carbon (DOC) and DBC concentrations using the benzenepolycarboxylic acid (BPCA) method. DBC concentrations ranged from 2.33 to 77.80 μmol L−1, with higher levels generally observed in shallow groundwater samples, and results demonstrated a strong correlation between DOC and DBC concentrations. Findings suggest that both sources and transport pathways are linked, and that estuaries may significantly attenuate dissolved black carbon before it reaches the ocean. Results highlight the estuary-specific nature of post-fire carbon dynamics and emphasize the urgent need for baseline data to better understand how increasingly severe fire regimes impact water quality and carbon cycling in coastal systems.
1 Introduction
For approximately 400 million years, wildfire has existed as a natural and fundamental part of Earth’s evolution, playing a dynamic and crucial role in all Earth’s systems (Bowman et al., 2019). Modern human activities—such as settlement patterns, land degradation, and suppression of wildfire—have led to shifts in fire regimes across the planet, contributing to more frequent catastrophic wildfire events (Bowman et al., 2011; Bowman et al., 2019). Anthropogenic climate change is predicted to further exacerbate wildfire regime shifts, with the frequency, duration, and intensity of fire risk predicted to substantially increase over approximately 74% of global land by the end of the 21st century (IPCC, 2019; IPCC, 2022; Bowman et al., 2011). Despite wildfire being a long-term and integrated part of Earth’s systems, our understanding of wildfire interactions with coastal aquatic systems is extremely limited, particularly when considering future wildfire regimes.
Wildfires are an important driver of geomorphological and hydrological change in burned landscapes. Through the loss of vegetation and increased soil erosion following wildfires, large amounts of sediment and pyrogenic material can be mobilised and transported from burnt catchments to lower elevation environments (Shakesby and Doerr, 2006; Wagner et al., 2015) including aquatic systems (Dahm et al., 2015). Wildfires generate pyrogenic carbon (PyC)—carbon that has been thermochemically altered from the incomplete combustion of organic material during burning. Black carbon (BC) represents the thermally refractory portion of PyC (Preston and Schmidt, 2006), and an estimated 40–215 Tg BC year−1 is produced by landscape wildfires yearly, providing a continuous source of BC to soils worldwide (Jones et al., 2020). However, the stability and structure of BC in the environment is largely dependent on fire severity: low-temperature fires tend to produce less-condensed char with more polar functional groups, while high-temperature fires result in more condensed aromatic structures that are associated with greater environmental persistence (Keiluweit et al., 2010; Schneider et al., 2010; Howell et al., 2022; Ascough et al., 2020). Half-life estimates of soil BC greatly vary and can range from <50 to 107 years (Bird et al., 1999; Zimmerman, 2010), leaving considerable uncertainties about the accumulation, preservation, and turnover mechanisms of BC in soils (Dittmar et al., 2012a; Ding et al., 2013). Over time, oxygen atoms are introduced into the condensed aromatic structures of black carbon structure, forming carboxylated molecules that become water soluble and mobilise as dissolved black carbon (DBC) (Abiven et al., 2011; Cheng and Lehmann, 2009).
Following wildfires, DBC can be transported to aquatic environments via leaching, groundwater transport, and surface water runoff, and may continue to be exported from fire-impacted soils into downstream aquatic systems for decades (Dittmar et al., 2012a). The global fluvial discharge of DBC to the ocean is estimated to be ~27 Tg-C/year, contributing to an important and major land-ocean flux in the global carbon budget (Jaffé et al., 2013; Xu et al., 2017). Estuaries reside at the interface between fluvial and oceanic environments and therefore estuarine processes can mediate fluvial export of DBC to the ocean. Although a substantial portion of DBC is proposed to be lost from riverine waters and saline waters through photooxidation (Riedel et al., 2016, Stubbins et al., 2012, respectively), it remains unclear how much is transported from rivers and groundwater to estuaries and what proportion of DBC is deposited or degraded within estuaries (Xu et al., 2017). This leaves significant uncertainty around the fate and behaviour of DBC in coastal estuarine systems following fire events, and its broader implications for the global carbon budget. The benzenepolycarboxylic acid (BPCA) method is a well-established and reliable method for quantifying DBC in natural waters, capable of detecting PyC produced across a wide range of burn temperatures (Dittmar, 2008; Ziolkowski et al., 2011; Glaser et al., 1998; Wiedemeier et al., 2016). Despite its robustness, its application in estuarine systems remains limited (Wang et al., 2025; Zhao et al., 2023; Zhang et al., 2024a; Fang et al., 2025), leaving a key gap in our ability to constrain DBC dynamics at this critical land-ocean interface- particularly in Australian estuaries, where it has not been used.
The 2019–2020 bushfires in Australia, termed the Black Summer fires, followed the country’s hottest and driest year on record (Abram et al., 2021). Over 17 million hectares were burned during the fire season, releasing an estimated 278 million tonnes of carbon dioxide into the atmosphere—over half of Australia’s total emissions from the previous year (Bureau of Meteorology (BOM), 2020; Nolan et al., 2020; Richards et al., 2020; Global Fire Emissions Database (GFED), 2020). New South Wales was the most severely affected state, where approximately 9.7 million hectares of vegetation was burnt and heavy rainfall led to the erosion and runoff of pyrogenic material into numerous estuaries along the south coast (Ward et al., 2020; Murray Darling Basin Authority, 2020). Despite these extreme events, no studies have yet quantified post-fire DBC in Australian estuaries, with very few studies conducted overall. To address this gap, our study quantified post-fire DBC in multiple fire-impacted estuaries along the south coast of NSW using the BPCA method. We investigated how DBC concentrations may be influenced by estuarine geomorphology, fire severity, and hydrological conditions. We hypothesize that DBC concentrations will differ among estuaries depending on local catchment burn severity and geomorphic features. Furthermore, we expect DBC concentrations to be elevated in shallow groundwater compared to surface waters due to continuous leaching of DBC from burnt soils. Depending on estuarine hydrodynamics, we also anticipate that a fraction of DBC may be removed from estuary surface waters before being transported to the ocean. By improving our understanding of DBC concentrations in fire-impacted estuaries, this study contributes essential data to inform regional carbon accounting and global efforts to model pyrogenic carbon transport through coastal aquatic systems.
2 Methodology
2.1 Study areas
The south coast of New South Wales has a large number of estuaries, many of which were severely impacted by the 2019/2020 bushfires. Six fire impacted estuaries were surveyed for the purpose of this study; Lake Conjola, Burill Lake, Lake Termeil, Durras Lake, Tuross Lake, and Wonboyn Lake (Figure 1). All surveyed estuaries are intermittently closed and open lake or lagoons (ICOLLs), with the exception of Tuross Lake, which was originally considered an ICOLL, but was artificially opened to the sea permanently prior to the fire and flood events (Hydrosphere Consulting, 2017). The studied estuaries varied from one another in their mixing and flushing dynamics, size, volume, and depths (Table 1). These estuaries are all located in a temperate climate zone (Bureau of Meteorology (BOM), 2025) and vegetation in the catchments mainly comprises of sclerophyll forests and shrublands (NSW) extent of bushfire impact (Table 1).
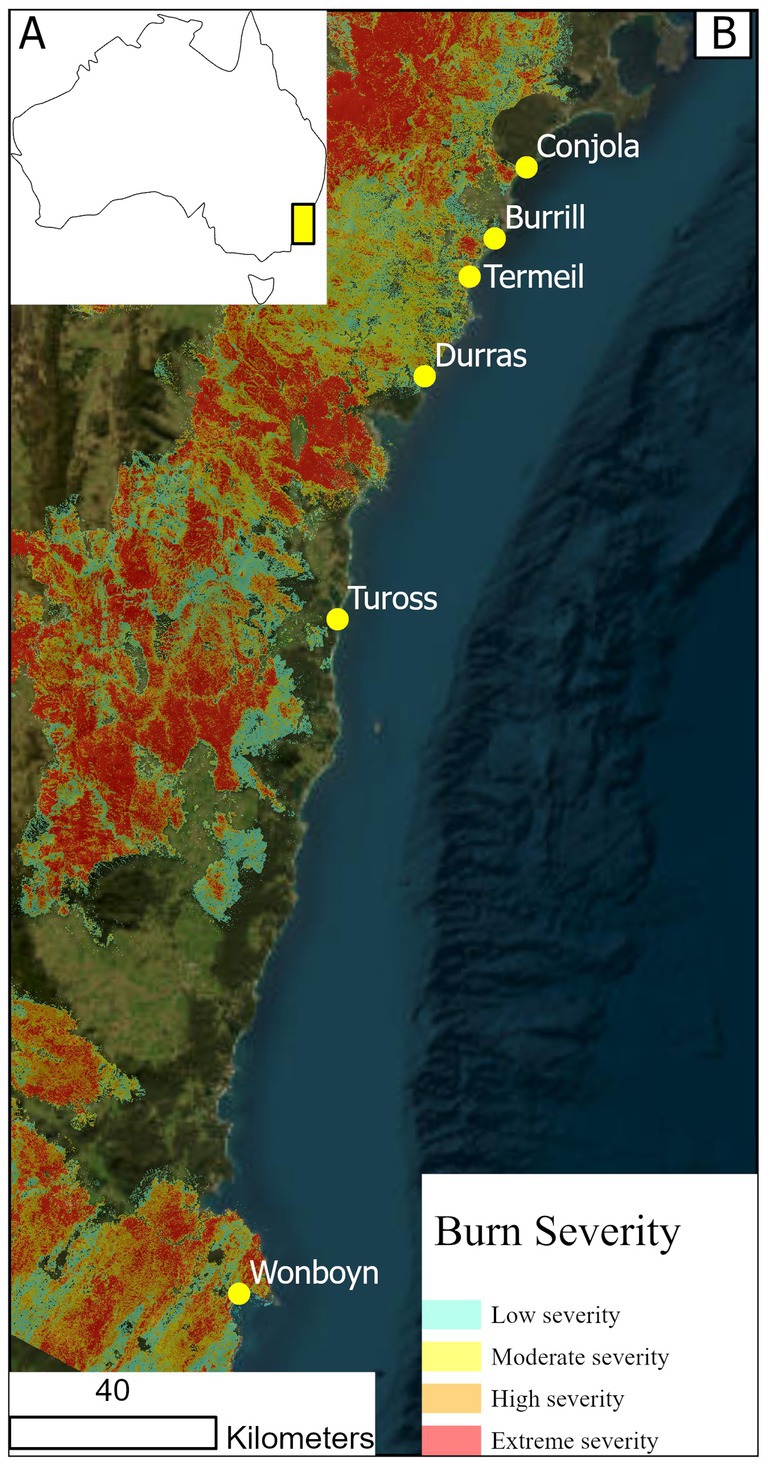
Figure 1. Estuaries sampled along the south coast of New South Wales and fire severities from the 2019 to 2020 Australian wildfires. (A) Location of the study region along the south coast of New South Wales within Australia. (B) Distribution of sampled estuaries (yellow points) and fire severity classifications derived from Fire Extent and Severity Mapping (FESM) (NSW Department of Climate Change, Energy, the Environment and Water (DCEEW), 2024): low = burnt understory with unburnt canopy, medium = partial canopy scorch, high = full canopy scorch/partial consumption, extreme = full canopy consumption.
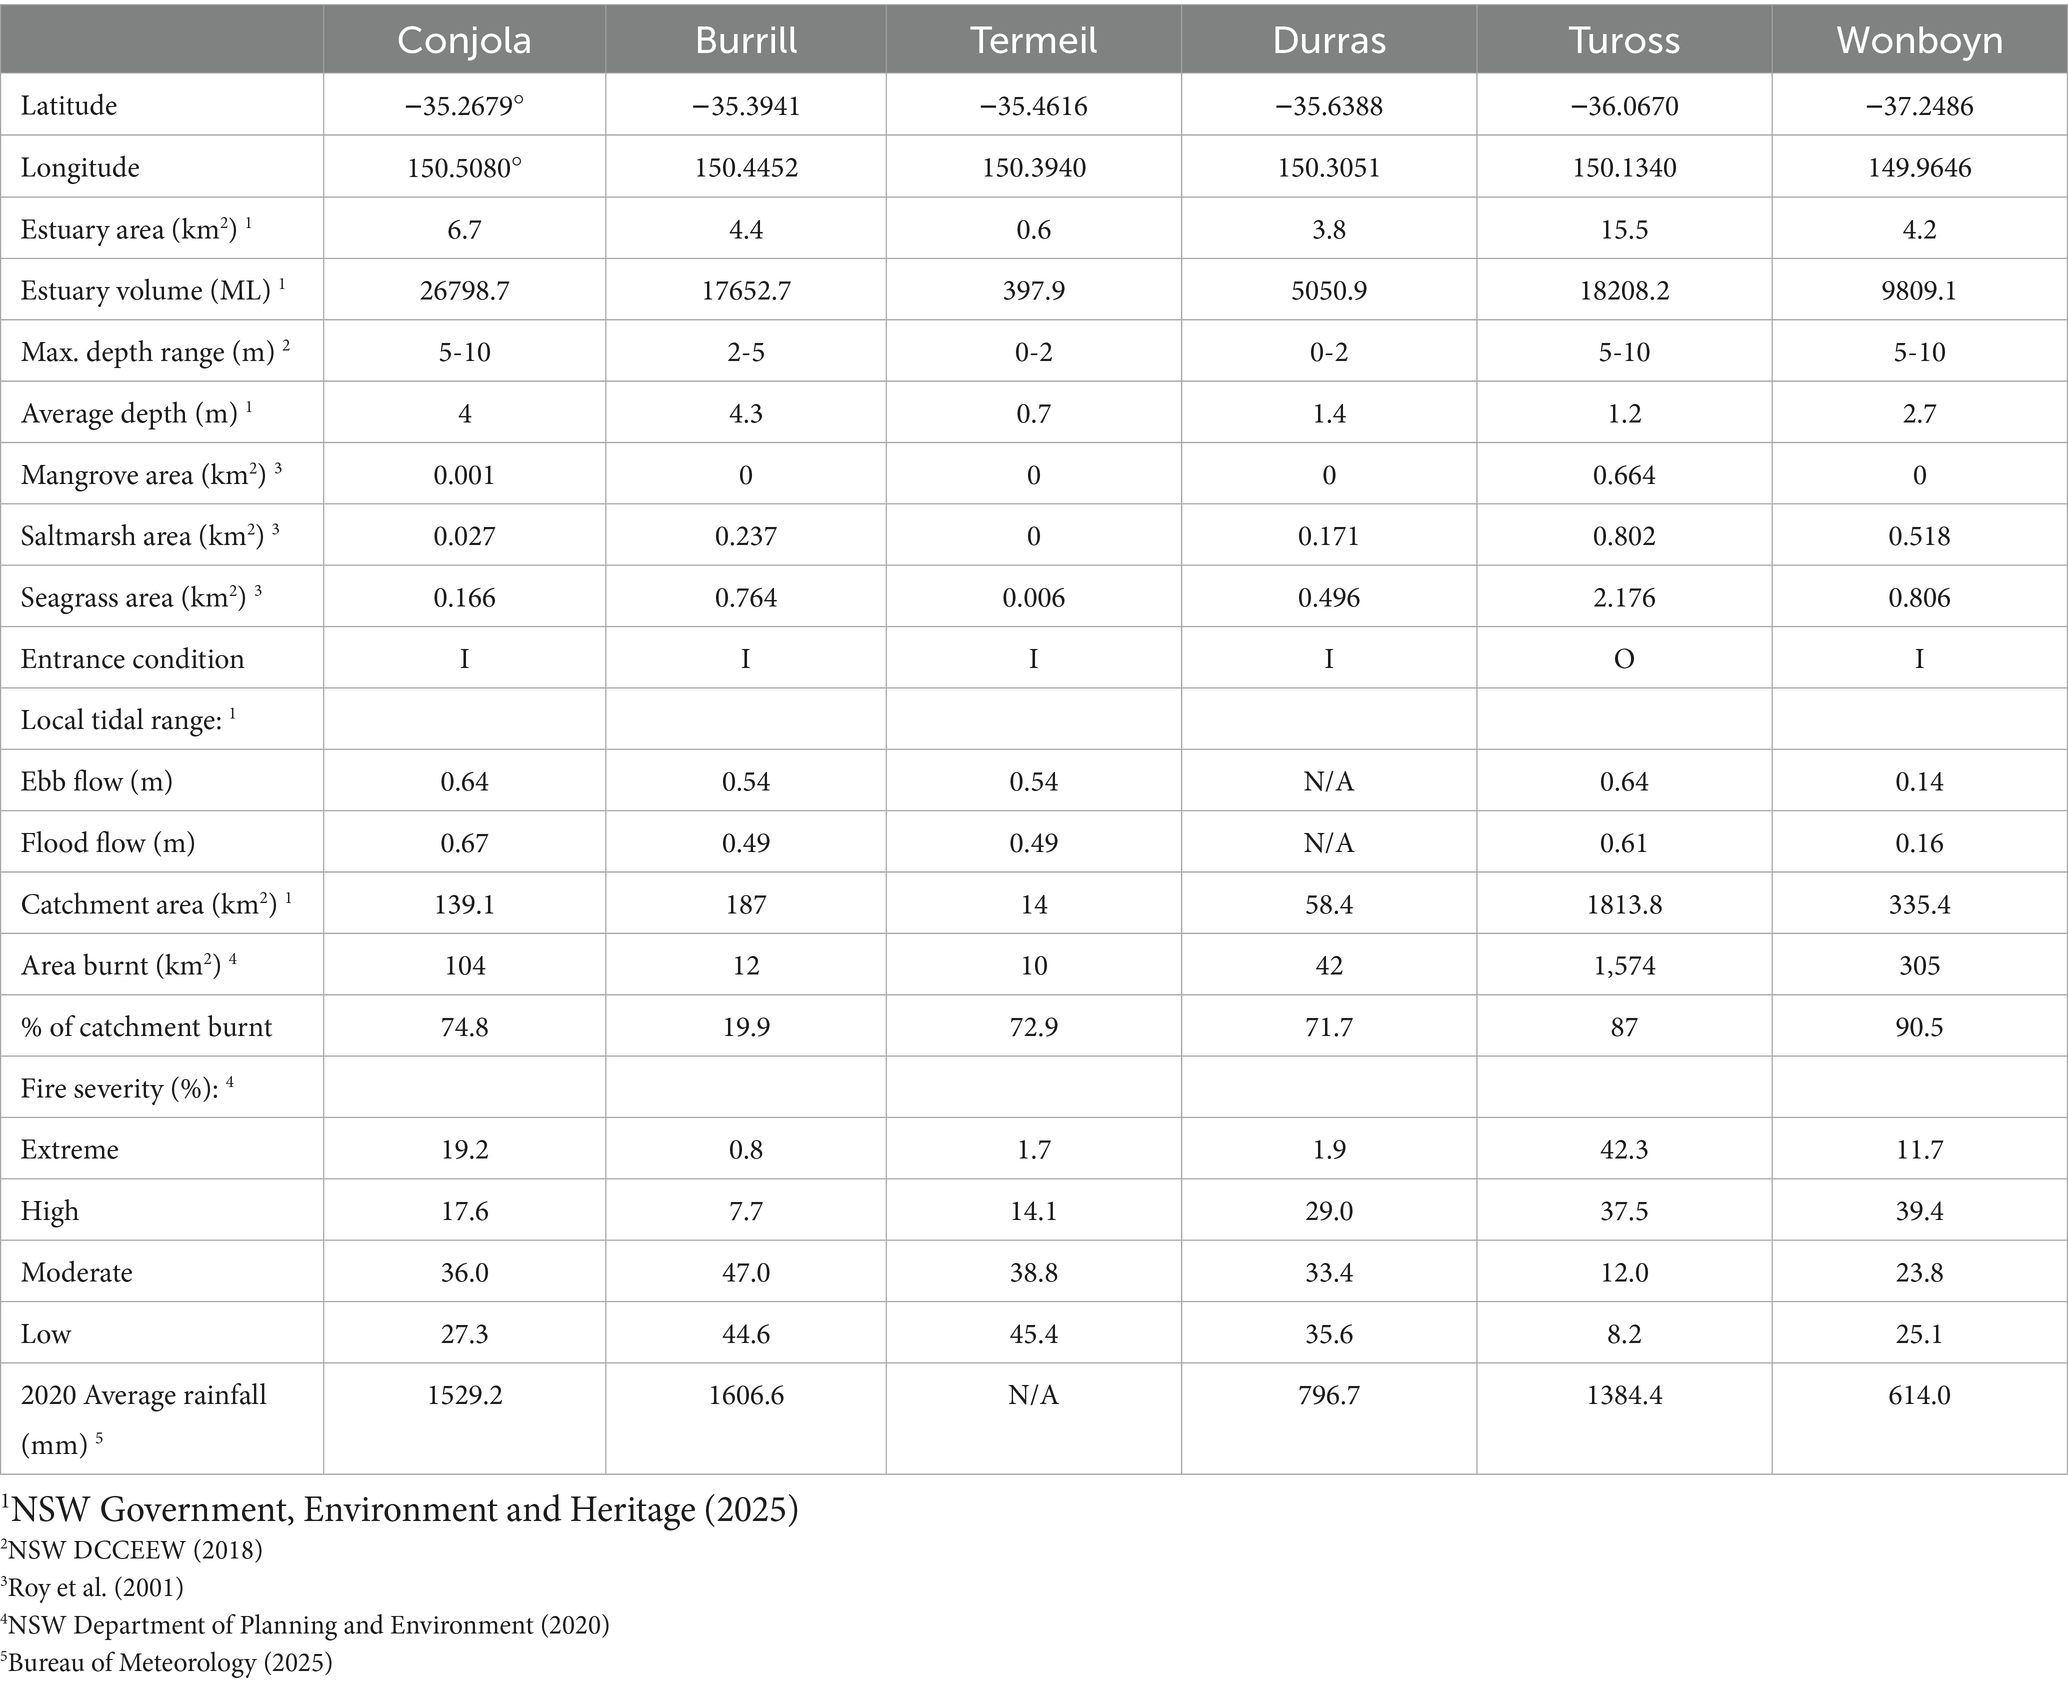
Table 1. Geomorphic variables and burn data pertaining to the studied estuaries. Latitude and longitude are taken from the estuary mouth. Entrance conditions are categorized by being either intermittently open/closed (I) or open (O). Rainfall averages (mm) are recorded from the nearest Bureau station (<15km) where possible.
2.2 Sample collection
The six fire-impacted estuaries (Figure 1) were surveyed in April 2021, a little over a year following the 2019/2020 wildfires. Surface water and shallow groundwater samples were collected from each of the estuaries, primarily at high tide to ensure boat access to sample sites. The number of surface water sample sites within each estuary varied based on estuary size and geomorphic characteristics (Table 1; Appendix Table 1) and location of surface water collection sites were chosen based on the low, middle, and upper estuary gradient when possible, and to represent varying geomorphic aspects of estuaries (i.e., basin, fluvial channel, etc.). Shallow groundwater samples were taken from one or two sites per estuary (Appendix Table 1). Surface water was collected approximately ~0.3 m below the surface directly into four 1 L Nalgene™ bottles, which had been acid washed and rinsed three times with site water prior to collection. Shallow groundwater samples were collected with the use of a peristaltic pump into four 1 L Nalgene™ bottles that had been acid washed and rinsed three times with groundwater prior to sample collection. The water samples were filtered using a 0.7 μM GFF filter within a day of collection and acidified to a pH of 2 using HCl to inhibit microbial activity and increase extraction efficiency (Dittmar, 2008). All water samples were frozen (−20 °C) and stored in the dark prior to analysis. Physiochemical parameters (pH, temperature, salinity, oxygen, turbidity) were measured in situ with a YSI EXO2 water quality sonde.
2.3 DOM extraction and DOC analysis
Dissolved organic matter (DOM) was extracted from water samples via solid phase extraction (SPE), using Varian Bond Elut Sorbent PPT cartridges, following the technique in Dittmar (2008). Immediately prior to extraction, 20 mL of methanol was run through the cartridges. Then, two litres of each sample were pumped through the cartridges using a vacuum pump at no more than 15 mL min−1. Directly after absorption, 20 mL of 0.01 M HCl was flushed through the cartridges to wash off any remaining salts. Cartridges were completely dried under an air stream through the pump and then 6 mL of methanol was pumped through the cartridges to extract DOM. Extracted samples were then wrapped in foil and stored in vials, in the freezer (−20 °C) until further analysis.
Following, DOC was analysed through high-temperature combustion in TOC-L SHIMADZU-Total Organic Carbon Analyzer. Quality control checks were undertaken by including 50 and 5 mg/L QC check standards every 10 samples. The precision of the analysis was better than 5 μmol C L−1 and accuracy was ±5%.
2.4 Black carbon analysis
Estuarine samples were analysed for DBC concentrations using the benezenpolycarboxylic acid (BPCA) method. The BPCA method breaks down condensed aromatics into individual benzene rings, each substituted with three, four, five, or six carboxylic acid groups (B3CA, B4CA, B5CA, B6CA) (Wagner et al., 2018). BPCA molar ratios were further calculated as B6CA:B5CA, which are useful in reflecting the degree of relative condensed aromaticity of DBC (Barton and Wagner, 2022; Myers-Pigg et al., 2024). Higher B6CA:B5CA ratios are indicative of larger fused aromatic ring structures, and have been found to decrease with increased photodegradation, with ratios usually lower in oceans compared to rivers (Barton and Wagner, 2022).
2.4.1 Preparation for BPCA analysis
Sample preparation was guided by Glaser et al. (1998) and Dittmar (2008). To prepare samples for BPCA analysis, each extracted DOM sample (2 mL) was inserted into glass ampules. DOM samples were dried completely under a stream of N2 gas at room temperature. Once dried, each ampule was rinsed with 5 mL HNO3 (70%) and put directly into thoroughly sanitised Teflon reaction vessels (CEM Mars Xpress). Samples were digested for 6 h at 170 °C. Following oxidation, samples were allowed to cool completely and then pipetted into borosilicate vials. Each sample was then evaporated under a N2 stream at 50 °C. Samples were wrapped in foil and stored in the freezer until BPCA analysis.
2.4.2 BPCA analysis by liquid chromatography
BPCA analysis was conducted using a modified method based on Hindersmann and Achten (2017). The BPCA analysis was performed using an Agilent 1,290 Infinity II Liquid Chromatography system coupled with a Quadrupole Time-of-Flight mass detector (LC-QTOF -MS). For liquid chromatography, a Phenomenex Kinetex EVO C18 Column (1.7 μm, 100 Å, 100 × 2.1 mm) was used as the stationary phase and the column temperature was 20 °C. The mobile phase contained two parts, A and B, and the total flow rate of the mobile phase was 0.3 mL/min. The mobile phase A was 100% milli-Q water containing 4% formic acid, and the mobile phase B was 100% acetonitrile. A gradient elution was used: 0–5 min 100% A (0%B), 5–8 min 0–8% B, 8–11 min, 8–12% B, 11–11.3 min 12–99% B, 11.3–11.6 min 99% B, 11.6–12 min 99-0%B, 12–16 min 100%A (0%B). Samples were injected in duplicate, and the injection volume was 1.0 μL.
For mass spectrometry, the ionisation was carried out via an Agilent Dual Jet Stream electrospray source. The mass spectrometry was operated in negative mode with the drying gas flow at 10 L min−1 N2, at 250 °C; sheath gas flow at 12 L min−1 at 250 °C; nebuliser pressure at 20 psi; Vcap voltage at 3,000 V, Fragmentor at 50 V; Skimmer at 45 V, Qct 1 RF Vpp at 750 V. The TOF mass range was between 50 and 1,700 m/z, and the acquisition rate was 2 spectra/s.
1,2,3-Benzenetricarboxylic acid (B3CA, Product No. B4201), 1,2,4,5-benzenetetracarboxylic acid (B4CA, Product No. B4007), mellitic acid (B6CA, Product No. M2705) were used as the standards to identify and quantify BPCA. Three B3CA isomers, three B4CA isomers, B5CA and B6CA were identified by comparing the retention times of pure standards and accurate mass-to-charge ratios (m/z). B3CA was quantified based on deprotonated molecular ion [M–H]−, 209.0102 m/z at 5.283 min, 6.960 min, and 9.680 min. B4CA was quantified based on deprotonated ion [M–H]−, 253.0018 m/z at 1.800 min, 2.100 min, and 3.878 min. B5CA was quantified based on deprotonated and dehydrated deprotonated [M–H–H2O]− molecular ion, 234.9886 m/z at 1.110 min. B6CA was quantified based on deprotonated and dehydrated deprotonated [M–H–H2O]− molecular ion, 322.9693 m/z at 0.790 min. Quantification of BPCA was carried out by external calibration standards based on the area under peaks of extracted ion chromatograms for BPCAs (ions listed above). Linear calibration curves were established between 0.5 and 80 μg mL−1 for pure BPCA. The available B3CA and B4CA standards were used to quantify their isomers. As no commercial standard was found for B5CA, B5CA was quantified based on the calibration curve of the available B4CA standard.
Dissolved black carbon was calculated based on the concentrations of the individual BPCAs (mol BPCA L−1), as provided in Dittmar (2008): DBC (mol C L−1) = 33.4 × (B6CA + B5CA + 0.5 B4CA + 0.5 B3CA).
2.5 Statistical analysis
Statistical analysis were undertaken using Primer V.7 + PERMANOVA.1 One-way permutational analysis of variance (PERMANOVA) was used to investigate the differences in DOC and DBC concentrations in the surface water of estuaries. The models were run using Type III sum of squares and 9,999 unrestricted permutations of the data. Pair-wise post hoc tests were run to establish which estuaries differed from which, with Monte Carlo tests used in cases where there were less than 100 permutations. PERMANOVAs were not run on the shallow groundwater samples due to insufficient replication in some estuaries (Appendix Table 1). However, shallow groundwater vs. surface water was included in distance-based linear models (DBLM). These models were used to test the relationship between DOC or DBC and geomorphic and burn characteristics in the estuaries and associated catchments (Table 1). Estuary and catchment data (as listed below and in Appendix Table 2) were first tested for collinearity based on Pearson’s correlations then prioritised for inclusion in the analysis. Parameters with a correlation coefficient r > 0.8 were generally excluded (with the exception of % moderate burn which was negatively correlated to the percent extreme and high burn, and total catchment area, which was positively correlated to the % extreme burn) (Appendix Table 2). The final models included: (1) catchment area, (2) estuary volume; (3) percent extreme burn; (4) percent high burn; (5) percent moderate burn; (6) estuary volume: burn area; (7) surface water vs. ground water (coded 1:0). Marginal tests were performed for individual variables, and the Akaike information criterion (AICc) was used to select the BEST model.
3 Results and discussion
3.1 Drivers of DOC and DBC variation across estuaries
3.1.1 DOC
Surface water DOC concentrations ranged from 145 to 540 μmol L−1, with the lowest values occurring at Burrill (MEAN: 183.23 ± 20.75 μmol L−1) and the highest at Termeil (MEAN: 540.42 ± 0.42 μmol L−1) (Figure 2; Appendix Table 3). PERMANOVA confirmed a significant difference in the surface water DOC concentrations of the different estuaries (Pseudo-F = 43.293, P(perm) = 0.0001, unique 9,960 permutations). Pairwise tests revealed DOC in surface water was significantly higher in Termeil than Wonboyn, which was significantly higher than all other estuaries except Durras, which has significantly higher DOC than Conjola, which is significantly higher than Tuross and Burrill (Table 2).
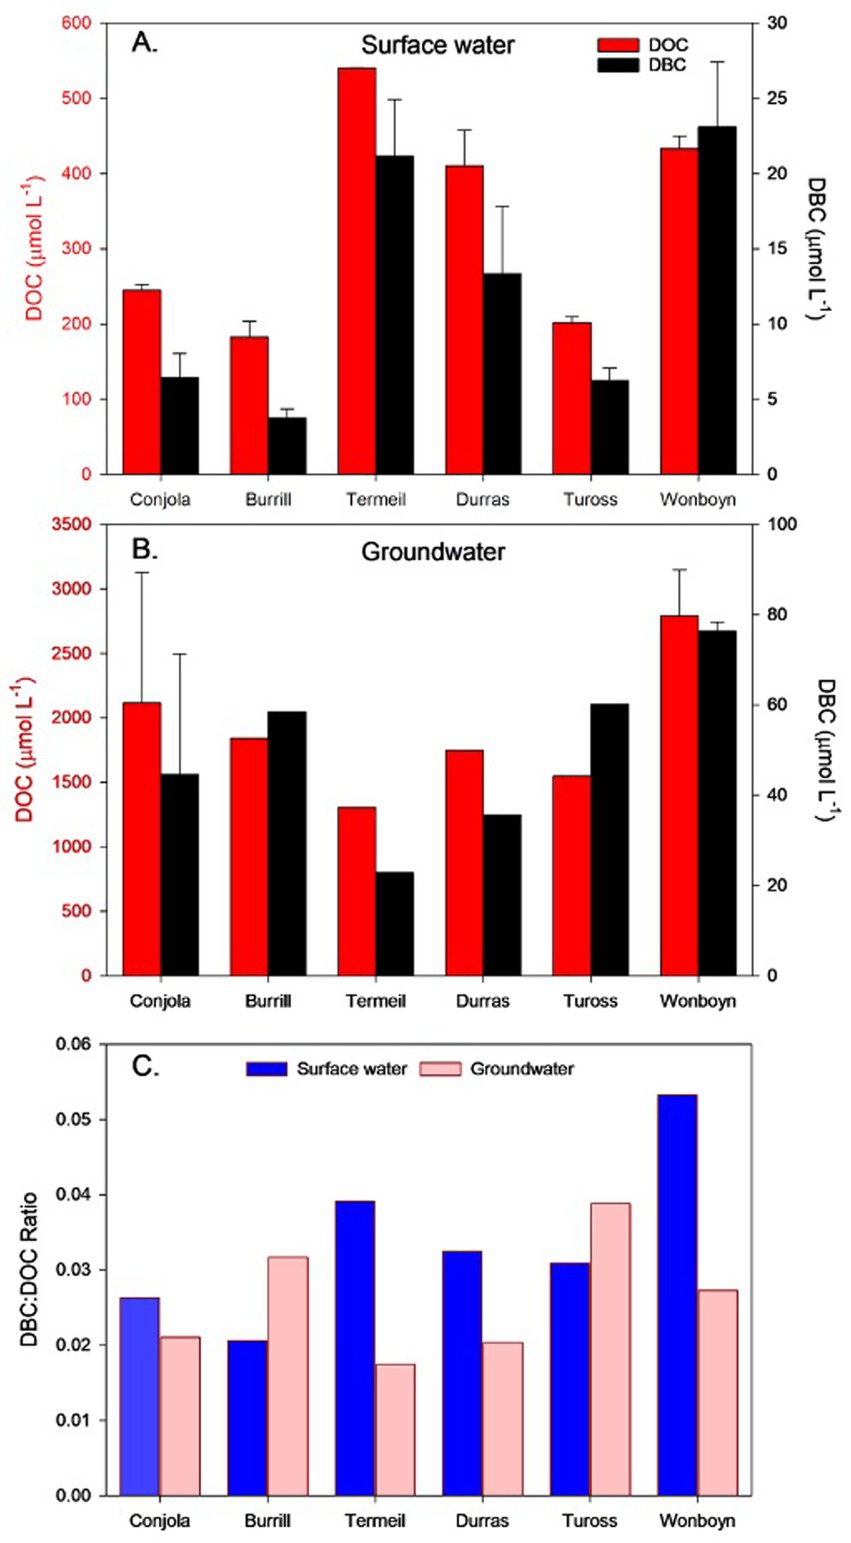
Figure 2. Average concentrations of dissolved black carbon (DOC) and dissolved black carbon (DBC) in surface water and shallow groundwater across six estuaries on the south coast of NSW: Conjola, Burrill, Termiel, Durras, and Wonboyn. (A) DOC and DBC concentrations (μmol L−1) in surface water; (B) DOC and DBC concentrations (μmol L−1) in shallow groundwater and; (C) Ratio of DBC to DOC for surface water and shallow groundwater, indicating relative contributions of combustion-derived carbon to the total dissolved organic carbon pool.
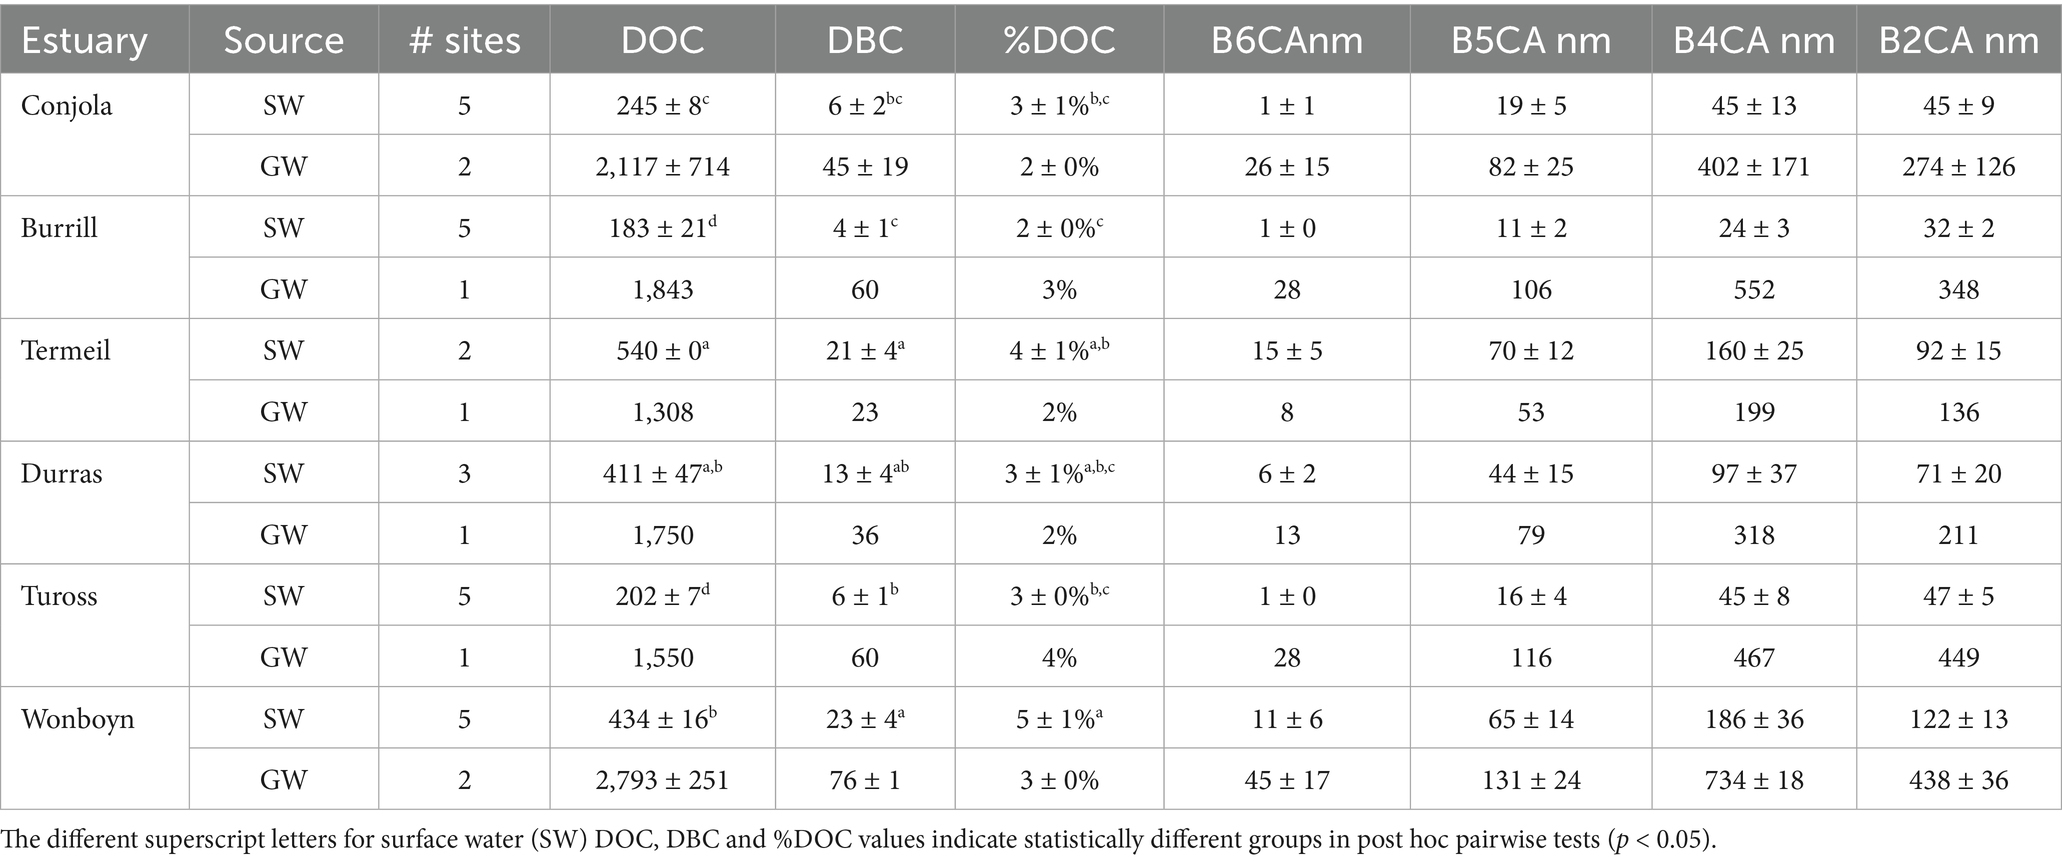
Table 2. DOC averages (μmol L−1), DBC average (μmol L−1), DBC proportion of DOC (%), and BPCAs found in surface and shallow groundwater samples from the six studied estuaries on the south coast of NSW.
Shallow groundwater DOC was markedly higher than surface water across all sites (Table 2), ranging from 1,308.3 to 3,043.3 μmol L−1. The highest concentration was observed at Wonboyn (3,043 μmol L−1), and the lowest at Termeil (1,308 μmol L−1). Marginal tests in the DBLM indicated that the water source (surface water vs. shallow groundwater) was the only significant predictor independently, explaining 66.3% of the variation in DOC on its own (p = 0.001) (Appendix Table 4).
The BEST model, which explained 86.94% of variation in DOC concentrations across all samples (AICc = 362.8), included catchment area (km2), percent of high severity burn, and water source (surface water vs. groundwater) as predictor variables. A closely performing alternative model explained 86.6% of the variation and included moderate severity burn, catchment area, and water source. Low-severity burn was excluded from the DBLM due to high collinearity with other burn categories, specifically it was negatively correlated with extreme burn (r = −0.942) and positively correlated with moderate burn (r = 0.929) (Appendix Table 2).
Surface water DOC concentrations observed in this study align with reported ranges in post-fire aquatic environments (Dittmar et al., 2012a,b; Wei et al., 2021). For example, Dittmar et al. (2012a) reported surface water DOC concentrations ranging from 229 to 608 μmol L−1 in the lower creeks and river tributaries of the Apalachicola Bay intertidal marsh system in Florida.
While this range overlaps with the DOC concentrations observed in this study (145–540 μmol L−1), it is important to note that their samples were collected 3 years after the fire event, suggesting that DOC concentrations in the present study, taken within a shorter post-fire timeframe, may be relatively low by comparison. Furthermore, some of the highest concentrations in Dittmar et al. (2012a) were recorded in tidal creeks, where restricted flow and limited tidal exchange likely contributed to DOC accumulation. In contrast, the estuaries in this study, particularly Tuross, likely experienced greater flushing, leading to more diluted DOC levels. Additionally, prescribed burning is a common land management practise in the Apalachicola region, potentially influencing DOC inputs differently than in the wildfire-affected systems explained here.
DOC concentrations have typically been found to decline from headwaters to coastal waters due to dilution, photodegradation and flushing (Jones et al., 2016; Moody et al., 2013; Crosswell et al., 2017; Moyer et al., 2015; Dittmar et al., 2012a). While our results demonstrated relatively uniform concentrations throughout estuary surface water—showing no clear upper to lower estuary gradient at most sites—these processes are still likely to influence DOC levels at the broader estuary scale. Specifically, lower DOC concentrations were generally observed in larger, more flushed estuaries (e.g., Tuross, Burrill, and Conjola), while higher concentrations occurred in smaller systems with reduced flushing and lower water volumes (e.g., Wonboyn, Termeil, and Durras). This suggests that although longitudinal variation of DOC within estuaries may be limited, dilution, photodegradation, and flushing remain important drivers of DOC variability across systems.
Differences in DOC concentrations between estuaries also likely reflect of a combination of catchment features, such as the catchment size, proportion of vegetated area, fire severity and recovery stage. For example, Termeil—a small ICOLL with limited ocean exchange, a predominantly forested catchment (NSW Government, Environment and Heritage, 2021), low water levels at the time of sampling, and mostly low to moderate severity burn (45.40, 38.84%, respectively) (NSW DCCEEW, 2024) (Table 1)—had the highest surface water DOC concentrations. In contrast, Tuross experienced extensive high and extreme severity fire (37.5, 42.3%) within its catchment, which has been observed to lead to decreased carbon stocks in organic soil horizons in comparison to unburned soils (Maestrini et al., 2017; Adkins et al., 2019). While intense fire can initially mobilise large pulses of organic carbon, long-term effects often include sustained reductions in DOC availability. Santos et al. (2019) identified a significant interaction between fire severity and time since fire in shaping DOC concentrations in fire-affected streams, showing that high intensity burns can lead to prolonged decreases in DOC lasting well into the recovery period—a duration that varies depending on the specific ecosystem (Wei et al., 2021). In contrast, the study also found that low severity fires, where canopy remains intact, can result in increased DOC concentrations in streams over time. Given the extensive high severity burn that occurred in Tuross’s catchment, it is likely that large pulses of organic matter were mobilised during and after the immediate post-fire rainfall events (Johnston and Maher, 2022). This would have been followed by significant reductions in soil DOC, which combined with increased flushing, would have ultimately led to DOC concentrations in surface waters (Santos et al., 2019). However, without pre-fire baseline data, it is difficult to be sure whether these levels represent an increase/decrease, recovery or continuation of pre-existing conditions.
3.1.2 DBC
Surface water DBC concentrations ranged from 2.33 to 38.86 μmol L−1 (Figure 2). The highest averages were measured at Wonboyn (23.11 ± 4.29 μmol L−1), followed by Termeil (21.17 ± 3.74 μmol L−1), Durras (13.36 ± 4.48 μmol L−1), Conjola Lake (6.47 ± 1.58 μmol L−1), Tuross (6.27 ± 0.79 μmol L−1), and lowest at Burrill (3.79 ± 0.58 μmol L−1) (Figure 3). PERMANOVA confirmed a significant difference in the surface water DBC concentrations of the different estuaries (Pseudo-F = 9.3042, P(perm) = 0.0002, unique 9,953 permutations) (Table 2). Marginal tests in the DBLM indicated that source of sample water (shallow groundwater vs. surface water) was the only predictor of DBC concentrations that was significant on its own, explaining 66.3% of variation in concentrations (p = 0.0001). The BEST model included high burn (%), moderate burn (%), and source of the water sample to explain 76.5% of variation in DBC concentrations (AICc = 164.68). The addition of extreme burn (%) and estuary volume to the above model explained 79.5% of variation in DBC (AICc = 166.07) (Appendix Table 4).
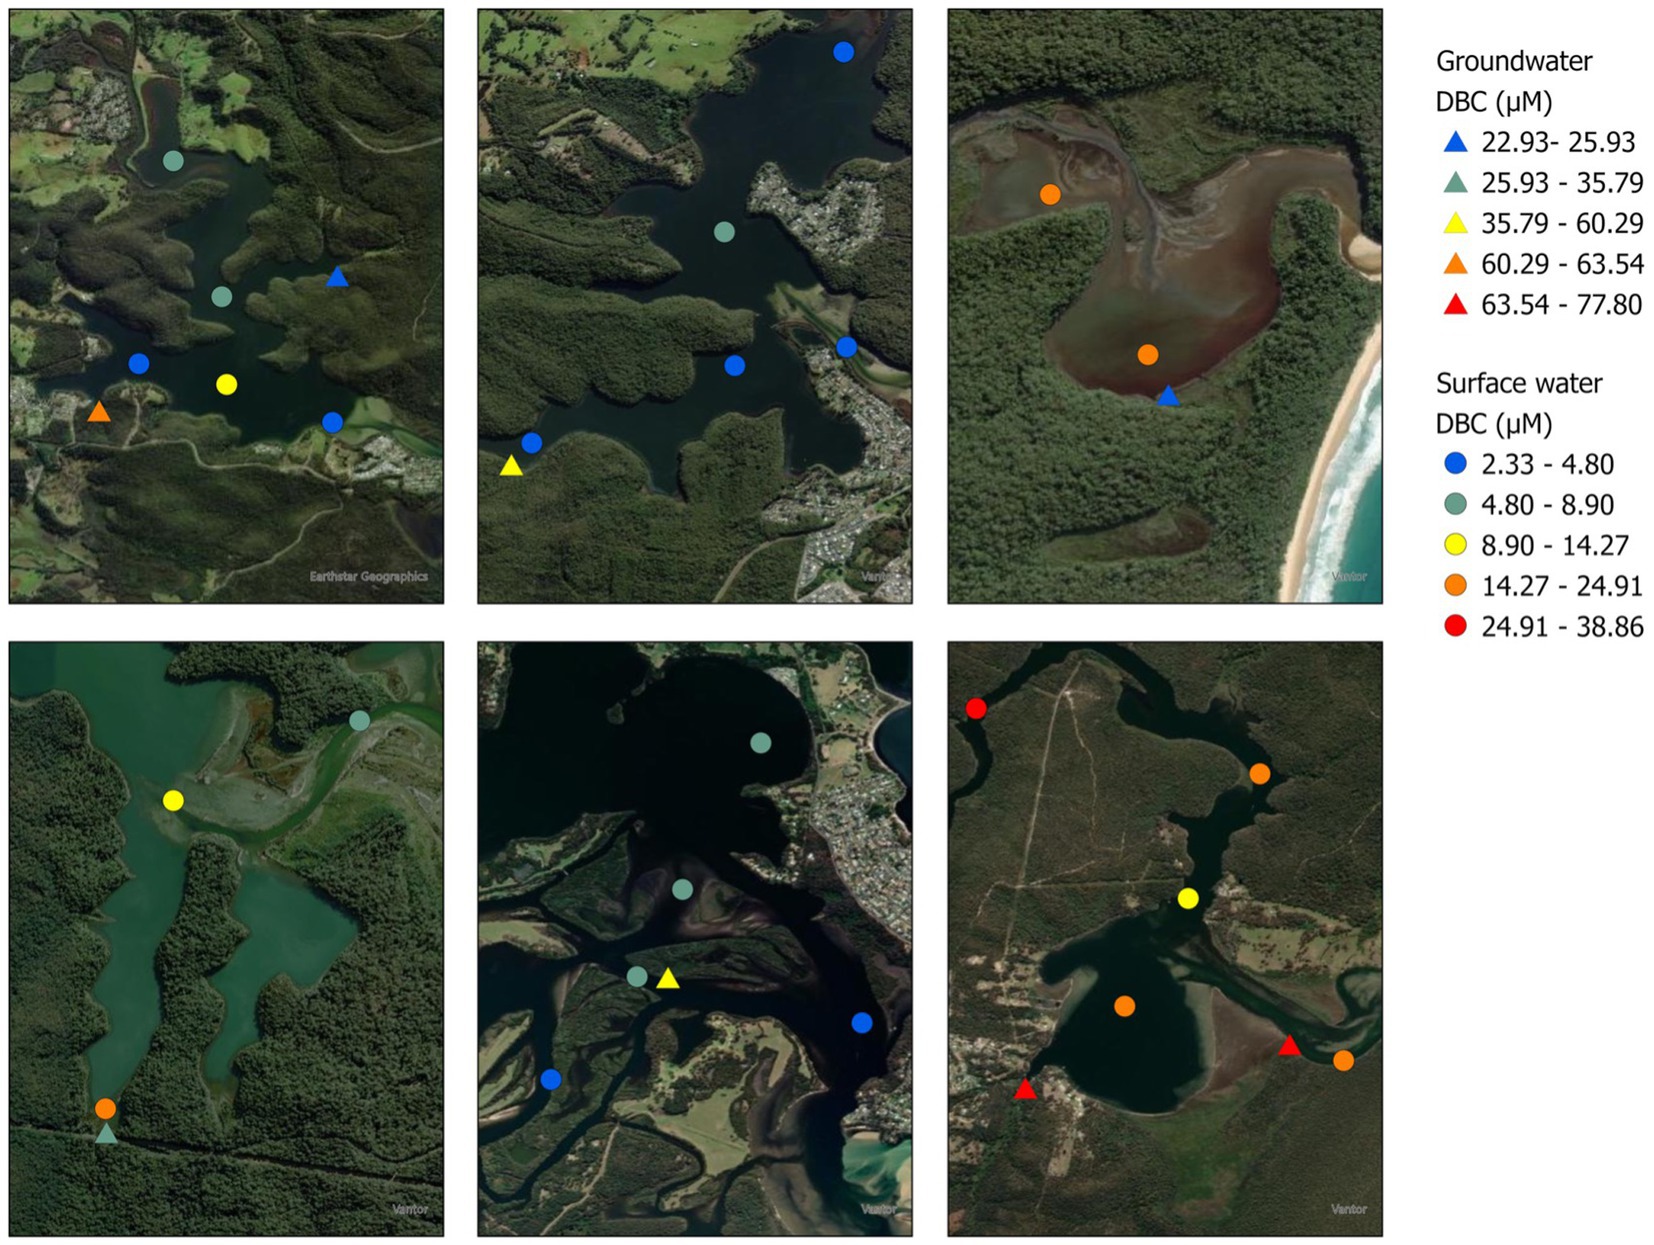
Figure 3. Spatial distribution of DBC concentrations (μmol L−1) in surface water and shallow groundwater throughout the studied fire-impacted estuaries (A = Conjola, B = Burrill, C = Termeil, D = Durras, E = Tuross, F = Wonboyn).
Wonboyn estuary recorded the highest DBC concentrations, consistent with elevated DOC levels, ranging from 14.27 μmol L−1 (3.66% of DOC) to 38.86 μmol L−1 (8.43% of DOC) (Appendix Table 4). Pair-wise tests showed significant differences between Wonboyn surface water DBC concentrations and those found at Tuross, Conjola, and Burrill (Table 2). Wonboyn experienced the most extensive catchment burn out of the studied estuaries (Table 1), with approximately 91% of its 335 km2 catchment burned, much of which was classified as “high severity” burn (Table 1) (DPE, 2020).
In most estuaries, lower surface water DBC concentrations were observed near tidal exchange zones, reflecting dilution, reduced residence times, and the influence of riverine inputs. However, this gradient was not evident in Wonboyn, where surface waters near the estuary mouth retained relatively high DBC. This likely reflects the unique influence of adjacent fire-affected areas. During the 2019/2020 fires, the burn extended to the estuary’s edge, burning through much of the saltmarsh habitat, likely providing a direct and ongoing source of PyC to estuarine waters via lateral transport (NSW DCEEW, 2020; Dittmar et al., 2012a). Elevated DBC concentrations in the upper estuary near freshwater inflows also point to substantial inputs from upstream tributaries.
By contrast, Burrill exhibited significantly lower surface water DBC concentrations, as confirmed by PERMANOVA and aligning with its lower DOC levels. Burrill’s catchment was the least affected by the Black Summer fires (20% burned, <8.5% at high or extreme severity), which likely influenced its relatively low DBC values (Table 1; Figure 3). Tuross also showed comparatively low surface water DBC concentrations, despite experiencing extensive fire across its large catchment (87% of its 1,574 km2 burned, including 44.33% at extreme and 37.46% at high severity) (Table 1). In this case, other factors appear to be driving DBC patterns. Tuross has a permanently open mouth, promoting increased tidal flushing and shorter residence times, which likely reduced DBC accumulation. In addition, because most of the burned area was located upstream rather than adjacent to the estuary, overland inputs were buffered, and DBC transported via river flow likely travelled greater distances before entering the estuary (Barros et al., 2022). During transit, significant losses may have occurred through photodegradation (Stubbins et al., 2010), deposition, or transformation into particulate forms that settled out before reaching the estuary (Xu et al., 2017). Also, chars produced at high temperatures can result in highly condensed forms of PyC, which are less soluble and therefore less likely to make it into downstream aquatic systems (Schneider et al., 2010; Abiven et al., 2011; Barton et al., 2024). These processes may have significantly reduced DBC concentrations in the estuary, despite the catchment’s extensive high severity burn.
The estuary-specific differences observed illustrate the complex and non-linear relationship between fire severity, catchment burn extent, and surface water DBC concentrations. While intense fires tend to produce more pyrogenic material (Komarek et al., 1973; Czimczik et al., 2005), downstream concentrations depend heavily on catchment characteristics, transport dynamics, and estuarine processing. For example, Tuross, despite being one of the most severely impacted catchments, displayed relatively low surface water concentrations of both DOC and DBC. This pattern may reflect post-fire reductions in carbon stocks (Maestrini et al., 2017; Adkins et al., 2019), as well as enhanced flushing and carbon losses during transport to the estuary. While fire severity is likely to be a key driver for initial DOC and DBC levels in surface waters, their export dynamics may differ depending on catchment recovery, connectivity to estuarine waters, and estuarine processing mechanism.
Shallow groundwater DBC concentrations ranged from 22.93 to 77.80 μmol L−1 (Appendix Table 3). The highest levels were observed at Wonboyn, consistent with surface water results, and the lowest were found at Termeil. Shallow groundwater DBC was generally higher than surface water concentrations across all estuaries, with the exception of Termeil, at which a single surface water site was slightly higher than shallow groundwater levels. The elevated shallow groundwater found at Wonboyn was likely due, in part, to the extensive burn occurring through estuarine and tidal marsh areas. The elevated DBC levels found in one of the shallow groundwater sites, located in the tidal marsh, as well as in the adjacent surface water site (Figure 3), indicate that groundwater discharge from the marsh contributes to DBC levels in surface waters. This is consistent with results from prior studies demonstrating tidal flushing as an important pathway for organic matter transfer from intertidal areas to estuaries (Dittmar et al., 2001, 2006, 2012a). Dittmar et al. (2006) estimated that >10% of the world-wide land-ocean DOM flux originates from mangroves, suggesting that material transport from marshes could be similarly efficient (Dittmar et al., 2006; Dittmar et al., 2012a). Although further study is required, we propose that tidal pumping and shallow groundwater discharge from the marsh appear to be important sources of DBC in the estuary.
Tuross shallow groundwater was among one of the higher DBC values observed, despite being sampled from a small, vegetated island towards the centre of the estuary, which was not directly impacted during the 2019/2020 fires (Figure 3). Due to the sample site’s location (Appendix Table 1) and distance from the fire-impacted catchment, DBC likely accumulated from tidal flushing and deposition of pyrogenic material to the island from the upstream burnt catchment. Such material could potentially leach DBC into shallow groundwater, acting as a source of DBC to estuarine waters over time.
3.2 DBC and DOC relationship
The spatial patterns observed in surface water DBC concentrations followed similar patterns to those of DOC, with both showing elevated concentrations in systems like Wonboyn and Termeil and lower values in Burrill and Tuross. This parallel distribution, supported by a strong linear correlation (R2 = 0.86) (Figure 4) between DOC and DBC, suggests that factors controlling DOC and DBC mobilisation and transport are related, similar to what has been observed in previous studies (Dittmar et al., 2012a; Ding et al., 2013; Jaffé et al., 2013). The DOC/DBC relationship observed in this study has a slope approximately 50% lower than the slope reported in Jaffé et al. (2013), who estimated global riverine DBC fluxes to oceans using DOC and DBC concentrations from 27 river and wetland systems from around the world. If the results from this study are representative of estuaries more broadly, these results suggest that estuaries may reduce the export of DBC to the ocean by ~50%. These results align with those in Marques et al. (2017) who found that 23–40% of surface water DBC was lost along a transect from river to estuary in the Paraiba do Sul River system. This suggests that estimates of riverine DBC transport to oceans that do not account for this attenuation are at risk of overestimating loads.
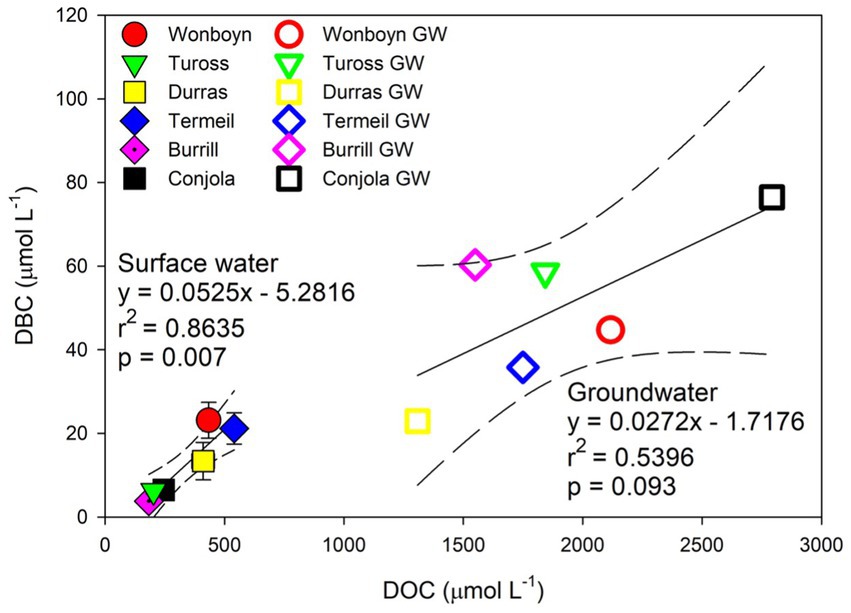
Figure 4. DBC and DOC correlations across surface waters and shallow groundwaters in the fire-impacted estuaries on the south coast of NSW.
DBC as a proportion of DOC ranged from 1.14 to 8.43% in surface waters, and 1.75–3.89% in shallow groundwater samples. Wonboyn exhibited the highest DBC:DOC ratios on average (Figure 2), with the greatest proportion (8.43%) observed at the most upstream site. This supports the idea that the extensive high- and extreme-severity burns that occurred in the catchment continued to contribute elevated levels of DBC to the estuary’s surface waters through riverine transport. Wonboyn proportions decreased in downstream sites, although still remaining in the high range when compared to the other studied estuaries. Across the estuaries, the lower DBC proportions were typically observed closest to tidal flushing and in higher salinities, suggesting that tidal flushing and dilution reduces DBC:DOC ratios in estuarine surface waters, as also observed in previous studies (Marques et al., 2017; Zhao et al., 2023; Martinot et al., 2025). The exception was Wonboyn, where DBC still comprised a relatively high fraction (4.14%) near the estuary mouth, supporting earlier observations of lateral transport of pyrogenic carbon from nearby burnt saltmarsh.
Elevated DBC proportions of DOC were succinct with higher DBC concentrations in surface water, but this trend was not consistent across shallow groundwater sites. Shallow groundwater DBC concentrations were often substantially higher than surface water DBC concentrations, but DBC as a proportion of DOC in shallow groundwater remained consistently low (Figure 2). This is due to high DOC pools in shallow groundwater, making DBC a small relative component despite its absolute increase. As water is transported from shallow groundwater sites to estuarine waters, it is likely that labile DOC components are degraded through processes (e.g., microbial mineralisation, photochemical oxidation, sorption onto sediments), whereas DBC likely persists longer in the environment (Bass and Gu, 2024; Zhang et al., 2024b; Jaffé et al., 2013). The DBC:DOC ratios observed in this study suggest the loss of non-pyrogenic, labile DOC during transport or exposure to light and oxygen, while DBC persists during hydrological transport, leaving a more refractory, DBC-enriched carbon pool.
3.3 Composition of dissolved black carbon (BPCAs)
All estuarine water samples yielded detectable amounts of BPCAs, with most yielding all measured compounds. Exceptions included a few samples where B6CA was undetectable and one sample lacking a detectable B4CA isomer a (Appendix Table 5). All samples yielded significantly higher proportions of B4CA and B3CA, and smaller proportions of B5CA and B6CA (Table 2; Figure 5). The highest proportions of B6CA in surface water samples were found on average at Wonboyn, Durras, and Termeil, which aligns with the sites that produced the highest surface water DBC concentrations. B6CA proportions slightly greater than 5% were found at Termeil (5.10%) and Wonboyn (5.31%), although the corresponding DBC concentration and DBC: DOC ratio at the Wonboyn site was much higher than that of the Termeil site.
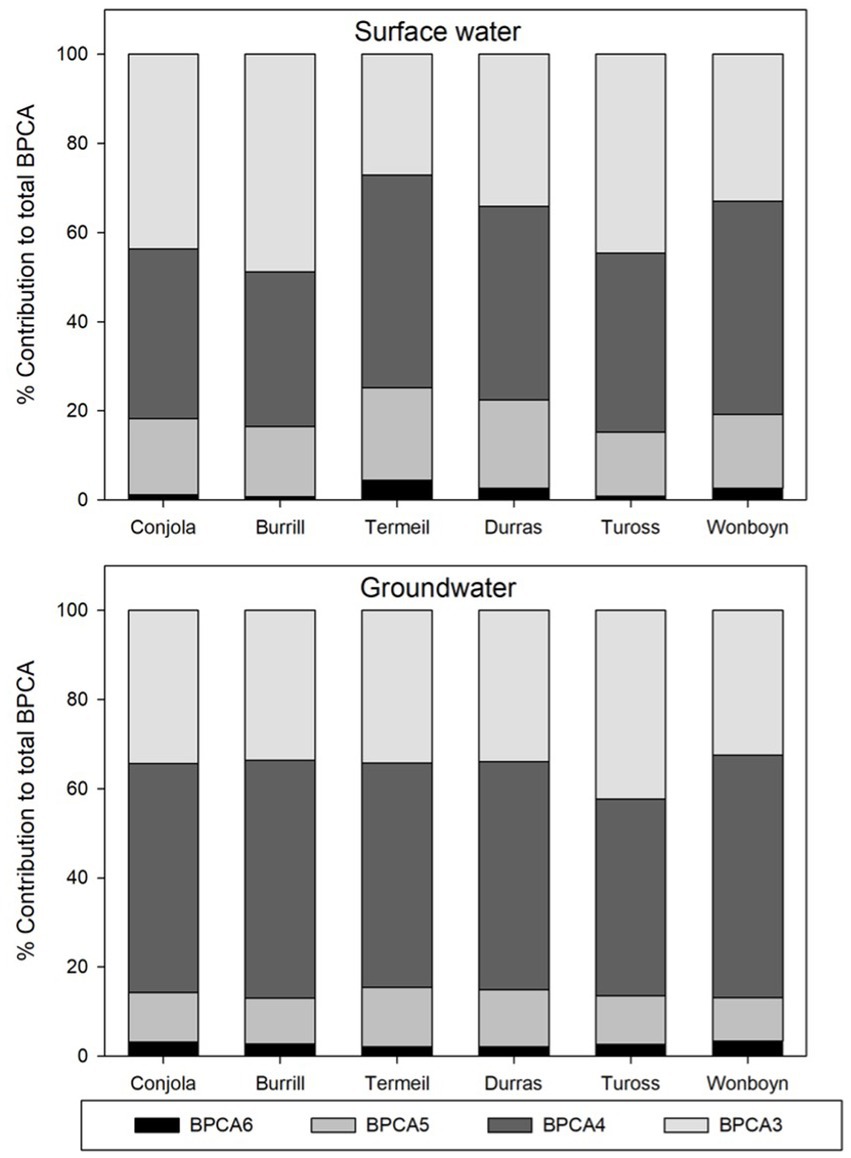
Figure 5. Proportions of B6CA, B5CA, B4CA, and B3CA contributing to total BPCA for surface water and shallow groundwater sites.
High temperature charring typically produces more condensed forms of PyC, resulting in higher proportions of B5CA and B6CA (Schneider et al., 2010; Schneider et al., 2010). However, the resulting PyC from high charring temperatures becomes more structurally complex and resistant to dissolution, making them less soluble in water and more likely to be removed via infiltration, sorption, or sedimentation before reaching aquatic systems (Coppola et al., 2014). Although some of the studied estuaries experienced high proportions of high and extreme severity burning, B6CA proportions were relatively low across all sites, potentially reflecting the limited solubility of the high-temperature combustion products. Our samples were collected a little over a year following the wildfire events, and so the PyC transported to the estuaries may exhibit increased B6CA content over time, as oxidation with ageing can enhance the solubility of their molecular structures over time (Abiven et al., 2011; Dittmar and Koch, 2006; Barton et al., 2024).
B6CA has been found to have high photo-lability (Stubbins et al., 2012; Vaezzadeh et al., 2023), and therefore the low B6CA proportions found in our samples may also be influenced by a number of factors stemming from the duration of time between the wildfires and time of sampling. Stubbins et al. (2012) observed a decrease in B6CA/B5CA from 0.32 to 0.23 after 28 days of sunlight exposure to deep ocean water in the Atlantic. Marques et al. (2017) also observed similar reductions in B6CA/B5CA along a river transect (0.38–0.27), suggesting that the decrease was due to photodegradation. We can speculate that the high intensity wildfire, followed by intense rainfall and flooding, resulted in a large amount of char being flushed into the downstream estuaries on the NSW south-coast immediately, where it was potentially flushed to sea (Marques et al., 2017). Depending on individual estuary residence times, remaining DBC in estuary surface waters at the time of sampling had likely been readily photo-oxidised, resulting in more stable DBC (Xu et al., 2017). This suggests that the DBC being exported to the ocean (e.g., when the ICOLL is broken) is also likely to be more stable. Additionally, Ding et al. (2015) showed higher proportions of B3CA and B4CA in riverine DBC, which may be indicative that a significant proportion of the DBC in the estuaries was being exported from fluvial channels at the time of sampling.
Shallow groundwater B6CA/B5CA ratios were generally higher than those in surface waters (Appendix Table 5), ranging from 0.16 to 0.40. The highest shallow groundwater B6CA/B5CA ratios were observed in samples from Wonboyn (0.40) and Conjola (0.38), potentially due to their proximity to burnt woody vegetation burnt at “extreme” and “high” intensity burn. Although B6CA/B5CA ratios were mostly higher in shallow groundwater, proportions of B6CA did not exceed those in surface waters and B5CA proportions were mostly lower than those in surface waters. While few studies have directly examined BPCA patterns in groundwater following wildfire, these observations suggest that subsurface processes, such as selective transport, sorption to mineral surfaces, or differential mobility of DBC fractions, may influence the composition of PyC in shallow groundwater (Luo et al., 2019; Zhao et al., 2023).
3.4 Global comparisons
Existing studies on post-fire DBC have mainly focused on inland aquatic systems, such as rivers (Wagner et al., 2015; Ding et al., 2015) and lakes (Kruger et al., 2023) as well as oceanic water (Kelly et al., 2021; Nakane et al., 2017). Information on post-fire DBC quantification in estuaries and other coastal aquatic environments is limited globally, and to date no data is available for Australian coastal waterways. The results from this study fall in a similar range to those in Dittmar et al. (2012a), which measured DBC concentrations in a fire-impacted marsh in the northern Gulf of Mexico. The study found values up to 41 μmol L−1 in a tidal creek at low tide, but most values were <18 μmol L−1 in riverine and marine endmembers, with values as low as 0.6 μmol L−1 along an offshore transect in the Gulf of Mexico. Surface water samples measured by Dittmar et al. (2012a) were collected 3 years following a fire event, during a spring tide. Due to enhanced tidal pumping during spring tides, DBC concentrations from the study were considered an upper-limit estimate for that stage of post-fire recovery. In contrast, our samples were collected only 1 year after the bushfires and primarily during high tides, to enable access to shallow estuarine surface water sites. Dittmar et al. (2012a) estimated that DBC measured in the tidal creek at low tide made up 7.2% of DOC, whereas at high tide, DBC dropped to 3.2% of DOC. Considering this, surface water concentrations measured in our study may be considered to represent the lower limits and concentrations would likely increase during low tide due to tidal pumping of high DBC shallow groundwater.
DBC concentrations found in the coastal river and estuary system of Paraiba do Sul basin in Brazil were also comparable to those in our study, though the concentrations found near the oceanic waters were slightly lower than at some of our sampling sites (Marques et al., 2017). DBC concentrations measured in the Paraiba do Sul River system ranged from 5 to 35 μmol L−1, of which the highest values occurred during the wet season. In the study, estuary DBC values ranged from 0.3 to 17 μmol L−1 (Marques et al., 2017), which were slightly lower than those that were found on the south coast of Australia.
4 Conclusions and suggestions
The south-east coast of Australia is a mild climate and is likely to experience an increase in drought conditions and wildfire occurrence in the coming years, consistent with global trends (IPCC, 2019). As a result, the production and transport of pyrogenic carbon, including particulate and DBC, to estuaries and coastal environments is expected to shift, potentially altering the global flux of DBC to the ocean. This study provides a snapshot in time of DBC concentrations in fire-affected estuaries along Australia’s south coast. However, further research is essential to better constrain global DBC fluxes. DBC levels in estuaries appear to vary significantly between systems and are influenced by estuary- and catchment-specific factors, such as burn severity, vegetation type, catchment and estuary geomorphology, and estuary hydrodynamics. The estuaries sampled in this study are all ICOLLs, which experience limited tidal flushing. This likely leads to different DBC dynamics compared to macrotidal or river-dominated estuaries, which are subject to more consistent flushing of oceanic waters.
To fully understand DBC behaviour in fire-affected estuaries, more comprehensive studies are needed. Estuaries are highly variable, and this variability likely drives much of the observed heterogeneity in DBC concentrations. Further work should aim to characterise baseline DBC conditions prior to fire events and investigate DBC dynamics across different timescales-immediate, short-term, and long-term post fire. Given the projected changes in fire and flood regimes due to climate change and current land-use practises, it is critical to understand the fate and transport of pyrogenic carbon in estuaries. Doing so will improve our understanding of coastal carbon cycling and the global carbon budget. Future studies should build off the findings presented in this study, by investigating how different water residence times across the coastal aquatic continuum influence the retention or export of pyrogenic carbon before it enters the oceanic carbon pool.
Data availability statement
The datasets presented in this study can be found in online repositories. The names of the repository/repositories and accession number(s) can be found in the article/Supplementary material.
Author contributions
DL-E: Conceptualization, Data curation, Formal analysis, Investigation, Methodology, Writing – original draft, Writing – review & editing, Project administration, Visualization. LL: Formal analysis, Supervision, Writing – original draft, Writing – review & editing, Methodology, Resources, Software. KB: Formal analysis, Methodology, Supervision, Writing – original draft, Writing – review & editing, Data curation, Validation. SJ: Supervision, Writing – original draft, Writing – review & editing, Conceptualization, Project administration, Validation. AF: Writing – review & editing, Funding acquisition, Project administration, Validation. GR: Investigation, Writing – review & editing, Data curation, Methodology, Project administration. RB: Investigation, Writing – review & editing, Methodology, Project administration. DM: Conceptualization, Formal analysis, Funding acquisition, Investigation, Methodology, Project administration, Resources, Supervision, Validation, Visualization, Writing – original draft, Writing – review & editing.
Funding
The author(s) declared that financial support was received for this work and/or its publication. DL-E scholarship was funded by the New South Wales Department of Planning and Environment through the Marine Estates Management Strategy.
Acknowledgments
We acknowledge Aboriginal and Torres Strait Islander peoples as the Traditional Owners and Custodians of the unceded land and water on which this research was conducted. We pay our respects to Elders past and present and extend that respect to all Aboriginal and Torres Strait Islander peoples. We recognise their deep and ongoing connection to Country and honour their ongoing role in caring for Country for countless generations.
Conflict of interest
The author(s) declared that this work was conducted in the absence of any commercial or financial relationships that could be construed as a potential conflict of interest.
Generative AI statement
The author(s) declared that Generative AI was not used in the creation of this manuscript.
Any alternative text (alt text) provided alongside figures in this article has been generated by Frontiers with the support of artificial intelligence and reasonable efforts have been made to ensure accuracy, including review by the authors wherever possible. If you identify any issues, please contact us.
Publisher’s note
All claims expressed in this article are solely those of the authors and do not necessarily represent those of their affiliated organizations, or those of the publisher, the editors and the reviewers. Any product that may be evaluated in this article, or claim that may be made by its manufacturer, is not guaranteed or endorsed by the publisher.
Supplementary material
The Supplementary material for this article can be found online at: https://www.frontiersin.org/articles/10.3389/frwa.2025.1653473/full#supplementary-material
Footnotes
References
Abiven, S., Hengartner, P., Schneider, M. P., Singh, N., and Schmidt, M. W. (2011). Pyrogenic carbon soluble fraction is larger and more aromatic in aged charcoal than in fresh charcoal. Soil Biol. Biochem. 43, 1615–1617. doi: 10.1016/j.soilbio.2011.03.027
Abram, N. J., Henley, B. J., Gupta, A. S., Lippmann, T. J., Clarke, H., Dowdy, A. J., et al. (2021). Connections of climate change and variability to large and extreme forest fires in Southeast Australia. Commun. Earth Environ. 2, 1–17. doi: 10.1038/s43247-020-00065-8,
Adkins, J., Sanderman, J., and Miesel, J. (2019). Soil carbon pools and fluxes vary across a burn severity gradient three years after wildfire in Sierra Nevada mixed-conifer forest. Geoderma 333, 10–22. doi: 10.1016/j.geoderma.2018.07.009
Ascough, P. L., Brock, F., Collinson, M. E., Painter, J. D., Lane, D. W., and Bird, M. I. (2020). Chemical characteristics of macroscopic pyrogenic carbon following millennial-scale environmental exposure. Front. Environ. Sci. 7:203. doi: 10.3389/fenvs.2019.00203
Barros, T. L., Bracewell, S. A., Mayer-Pinto, M., Dafforn, K. A., Simpson, S. L., Farrell, M., et al. (2022). Wildfires cause rapid changes to estuarine benthic habitat. Environ. Pollut. 308:119571. doi: 10.1016/j.envpol.2022.119571,
Barton, R., and Wagner, S. (2022). Measuring dissolved black carbon in water via aqueous, inorganic, high-performance liquid chromatography of benzenepolycarboxylic acid (BPCA) molecular markers. PLoS One 17:e0268059. doi: 10.1371/journal.pone.0268059,
Barton, R., Richardson, C. M., Pae, E., Montalvo, M. S., Redmond, M., Zimmer, M. A., et al. (2024). Hydrology, rather than wildfire burn extent, determines post-fire organic and black carbon export from mountain rivers in central coastal California. Limnol. Oceanogr. Lett. 9, 70–80. doi: 10.1002/lol2.10360
Bass, A. M., and Gu, C. (2024). Decoupling of dissolved organic carbon (DOC) and dissolved black carbon (DBC) in a temperate fluvial network. Biogeochemistry 167, 1269–1279. doi: 10.1007/s10533-024-01172-w
Bird, M. I., Moyo, C., Veenendaal, E. M., Lloyd, J., and Frost, P. (1999). Stability of elemental carbon in a savanna soil. Glob. Biogeochem. Cycles 13, 923–932. doi: 10.1029/1999GB900067
Bowman, D. M., Balch, J., Artaxo, P., Bond, W. J., Cochrane, M. A., D’antonio, C. M., et al. (2011). The human dimension of fire regimes on earth. J. Biogeogr. 38, 2223–2236. doi: 10.1111/j.1365-2699.2011.02595.x,
Bowman, D. M., Moreira-Muñoz, A., Kolden, C. A., Chávez, R. O., Muñoz, A. A., Salinas, F., et al. (2019). Human–environmental drivers and impacts of the globally extreme 2017 Chilean fires. Ambio 48, 350–362. doi: 10.1007/s13280-018-1084-1,
Bureau of Meteorology (BOM) (2020). New South Wales in 2020: above average temperature and rainfall Australian Government. Available online at: http://www.bom.gov.au/climate/current/annual/nsw/archive/2020.summary.shtml
Bureau of Meteorology (BOM) (2025). Climate Data Online: Monthly Rainfall Australian Government. Available online at: https://www.bom.gov.au/climate/data/
Cheng, C. H., and Lehmann, J. (2009). Ageing of black carbon along a temperature gradient. Chemosphere 75, 1021–1027. doi: 10.1016/j.chemosphere.2009.01.045,
Coppola, A. I., Ziolkowski, L. A., Masiello, C. A., and Druffel, E. R. (2014). Aged black carbon in marine sediments and sinking particles. Geophys. Res. Lett. 41, 2427–2433. doi: 10.1002/2013gl059068
Crosswell, J. R., Anderson, I. C., Stanhope, J. W., Van Dam, B., Brush, M. J., Ensign, S., et al. (2017). Carbon budget of a shallow, lagoonal estuary: transformations and source-sink dynamics along the river-estuary-ocean continuum. Limnol. Oceanogr. 62, S29–S45. doi: 10.1002/lno.10631
Czimczik, C. I., Schmidt, M. W. I., and Schulze, E. D. (2005). Effects of increasing fire frequency on black carbon and organic matter in podzols of Siberian Scots pine forests. Eur. J. Soil Sci. 56, 417–428. doi: 10.1111/j.1365-2389.2004.00665.x
Dahm, C. N., Candelaria-Ley, R. I., Reale, C. S., Reale, J. K., and Van Horn, D. J. (2015). Extreme water quality degradation following a catastrophic forest fire. Freshw. Biol. 60, 2584–2599. doi: 10.1111/fwb.12548
Ding, Y., Yamashita, Y., Dodds, W. K., and Jaffé, R. (2013). Dissolved black carbon in grassland streams: is there an effect of recent fire history? Chemosphere 90, 2557–2562. doi: 10.1016/j.chemosphere.2012.10.098,
Ding, Y., Yamashita, Y., Jones, J., and Jaffé, R. (2015). Dissolved black carbon in boreal forest and glacial rivers of Central Alaska: assessment of biomass burning versus anthropogenic sources. Biogeochemistry 123, 15–25. doi: 10.1007/s10533-014-0050-7
Dittmar, T. (2008). The molecular level determination of black carbon in marine dissolved organic matter. Org. Geochem. 39, 396–407. doi: 10.1016/j.orggeochem.2008.01.015
Dittmar, T., and Koch, B. P. (2006). Thermogenic organic matter dissolved in the abyssal ocean. Mar. Chem. 102, 208–217. doi: 10.1016/j.marchem.2006.04.003
Dittmar, T., De Rezende, C. E., Manecki, M., Niggemann, J., Coelho Ovalle, A. R., Stubbins, A., et al. (2012b). Continuous flux of dissolved black carbon from a vanished tropical forest biome. Nat. Geosci. 5, 618–622. doi: 10.1038/ngeo1541
Dittmar, T., Hertkorn, N., Kattner, G., and Lara, R. J. (2006). Mangroves, a major source of dissolved organic carbon to the oceans. Glob. Biogeochem. Cycles 20:208–217. doi: 10.1029/2005GB002570
Dittmar, T., Lara, R. J., and Kattner, G. (2001). River or mangrove? Tracing major organic matter sources in tropical Brazilian coastal waters. Mar. Chem. 73, 253–271. doi: 10.1016/S0304-4203(00)00110-9
Dittmar, T., Paeng, J., Gihring, T. M., Suryaputra, I. G., and Huettel, M. (2012a). Discharge of dissolved black carbon from a fire-affected intertidal system. Limnol. Oceanogr. 57, 1171–1181. doi: 10.4319/lo.2012.57.4.1171
Fang, Y., Huang, G., Liu, D., Wu, M., Wang, Y., He, J., et al. (2025). Differential nonconservative behaviors of dissolved black carbon along a major river-estuary-shelf continuum. J. Geophys. Res. Oceans 130:e2025JC022432. doi: 10.1029/2025JC022432
Glaser, B., Haumaier, L., Guggenberger, G., and Zech, W. (1998). Black carbon in soils: the use of benzenecarboxylic acids as specific markers. Org. Geochem. 29, 811–819. doi: 10.1016/S0146-6380(98)00194-6
Global Fire Emissions Database (GFED) (2020). Richards, L, Brew, N, Smith, L 2019–20 Australian bushfires—frequently asked questions: a quick guide, Research Paper Series 2019–20, 12 March, Australian Parliamentary Library. Available online at: https://parlinfo.aph.gov.au/parlInfo/download/library/prspub/7234762/upload_binary/7234762.pdf
Hindersmann, B., and Achten, C. (2017). Accelerated benzene polycarboxylic acid analysis by liquid chromatography–time-of-flight–mass spectrometry for the determination of petrogenic and pyrogenic carbon. Journal of Chromatography A. 1510:57–65.,
Howell, A., Helmkamp, S., and Belmont, E. (2022). Stable polycyclic aromatic carbon (SPAC) formation in wildfire chars and engineered biochars. Sci. Total Environ. 849:157610. doi: 10.1016/j.scitotenv.2022.157610,
Hydrosphere Consulting (2017). Coastal management program. Available online at: https://www.esc.nsw.gov.au/__data/assets/pdf_file/0004/149503/Tuross-and-Coila-Lake-CMP-FINAL-public-exhibition-red-opt.pdf
IPCC (2019). “Summary for policymakers” in Climate change and land: an IPCC special report on climate change, desertification, land degradation, sustainable land management, food security, and greenhouse gas fluxes in terrestrial ecosystems. eds. P. R. Shukla, J. Skea, E. Calvo Buendia, V. Masson-Delmotte, H.- O. Pörtner, and D. C. Roberts, et al. In Press. Geneva Switzerland: Intergovernmental Panel on Climate Change (IPCC).
IPCC (2022) in Climate change 2022: Impacts, adaptation, and vulnerability. Contribution of working group II to the sixth assessment report of the intergovernmental panel on climate change. eds. H.-O. Pörtner, D. C. Roberts, M. Tignor, E. S. Poloczanska, K. Mintenbeck, and A. Alegría, et al. (Geneva Switzerland: Intergovernmental Panel on Climate Change (IPCC)). In Press
Jaffé, R., Ding, Y., Niggemann, J., Vähätalo, A. V., Stubbins, A., Spencer, R. G., et al. (2013). Global charcoal mobilization from soils via dissolution and riverine transport to the oceans. Science 340, 345–347. doi: 10.1126/science.1231476,
Johnston, S. G., and Maher, D. T. (2022). Drought, megafires and flood-climate extreme impacts on catchment-scale river water quality on Australia's east coast. Water Res. 218:118510. doi: 10.1016/j.watres.2022.118510,
Jones, M. W., Coppola, A. I., Santín, C., Dittmar, T., Jaffé, R., Doerr, S. H., et al. (2020). Fires prime terrestrial organic carbon for riverine export to the global oceans. Nat. Commun. 11:2791. doi: 10.1038/s41467-020-16576-z,
Jones, T. G., Evans, C. D., Jones, D. L., Hill, P. W., and Freeman, C. (2016). Transformations in DOC along a source to sea continuum; impacts of photo-degradation, biological processes and mixing. Aquat. Sci. 78, 433–446. doi: 10.1007/s00027-015-0461-0
Keiluweit, M., Nico, P. S., Johnson, M. G., and Kleber, M. (2010). Dynamic molecular structure of plant biomass-derived black carbon (biochar). Environ. Sci. Technol. 44, 1247–1253. doi: 10.1021/es9031419,
Kelly, R. L., Bian, X., Feakins, S. J., Fornace, K. L., Gunderson, T., Hawco, N. J., et al. (2021). Delivery of metals and dissolved black carbon to the southern California coastal ocean via aerosols and floodwaters following the 2017 Thomas fire. J. Geophys. Res. Biogeosci. 126:e2020JG006117. doi: 10.1029/2020JG006117
Komarek, E. V., Carlysle, T. C., and Komarek, B. B. (1973). Ecology of smoke particulates and charcoal residues from forest and grassland fires. Tallahassee, Florida, USA: Tall Timbers Research Station.
Kruger, B. R., Hausner, M. B., Chellman, N., Weaver, M., Samburova, V., and Khlystov, A. (2023). Dissolved black carbon as a potential driver of surface water heating dynamics in wildfire-impacted regions: A case study from Pyramid Lake, NV, USA. Science of the Total Environment, 888, 164141.
Luo, L., Chen, Z., Lv, J., Cheng, Y., Wu, T., and Huang, R. (2019). Molecular understanding of dissolved black carbon sorption in soil-water environment. Water Res. 154, 210–216. doi: 10.1016/j.watres.2019.01.060,
Maestrini, B., Alvey, E. C., Hurteau, M. D., Safford, H., and Miesel, J. R. (2017). Fire severity alters the distribution of pyrogenic carbon stocks across ecosystem pools in a Californian mixed-conifer forest. J. Geophys. Res. Biogeosci. 122, 2338–2355. doi: 10.1002/2017JG003832
Marques, J. S., Dittmar, T., Niggemann, J., Almeida, M. G., Gomez-Saez, G. V., and Rezende, C. E. (2017). Dissolved black carbon in the headwaters-to-ocean continuum of Paraíba Do Sul River, Brazil. Front. Earth Sci. 5:11. doi: 10.3389/feart.2017.00011
Martinot, P. L., Guigue, C., Guyomarc’h, L., Mari, X., Chu, N. H. A., Vu, C. T., et al. (2025). First data on dissolved black carbon in the coastal northwestern Mediterranean Sea. Environ. Sci. Pollut. Res. 32, 18933–18943. doi: 10.1007/s11356-025-36816-3,
Moody, C., Worrall, F., Evans, C., and Jones, T. (2013). The rate of loss of dissolved organic carbon (DOC) through a catchment. J. Hydrol. 492, 139–150. doi: 10.1016/j.jhydrol.2013.03.016
Moyer, R. P., Powell, C. E., Gordon, D. J., Long, J. S., and Bliss, C. M. (2015). Abundance, distribution, and fluxes of dissolved organic carbon (DOC) in four small sub-tropical rivers of the Tampa Bay estuary (Florida, USA). Appl. Geochem. 63, 550–562. doi: 10.1016/j.apgeochem.2015.05.004
Murray Darling Basin Authority (2020). Relief of rain brings expected water quality challenges. Canberra: Murray Darling Basin Authority.
Myers-Pigg, A. N., Grieger, S., Roebuck, J. A. Jr., Barnes, M. E., Bladon, K. D., Bailey, J. D., et al. (2024). Experimental open air burning of vegetation enhances organic matter chemical heterogeneity compared to laboratory burns. Environ. Sci. Technol. 58, 9679–9688. doi: 10.1021/acs.est.3c10826,
Nakane, M., Ajioka, T., and Yamashita, Y. (2017). Distribution and sources of dissolved black carbon in surface waters of the Chukchi Sea, Bering Sea, and the North Pacific Ocean. Frontiers in Earth Science, 5, 34.
Nolan, R. H., Boer, M. M., Collins, L., de Resco Dios, V., Clarke, H. G., Jenkins, M., et al. (2020). Causes and consequences of eastern Australia's 2019-20 season of mega-fires. Glob. Chang. Biol. 26:1039–1041.
NSW Department of Climate Change, Energy, the Environment and Water (DCCEEW) (2018). Single Beam Bathymetry and Coastal Topography Survey Coverage Areas- Coastal Marine Unit [Dataset]. SEED. Available online at: https://datasets.seed.nsw.gov.au/dataset/single-beam-survey-coverage-areas-coastal-marine-unit883fa
NSW Department of Climate Change, Energy, the Environment and Water (DCCEEW) (2024). Fire extent and severity mapping (FESM) [dataset]. SEED. Available online at: https://www.google.com/search?client=safari&rls=en&q=fesm+seed+mapping&ie=UTF-8&oe=UTF-8
NSW Government, Environment and Heritage (2025). The health of our estuaries. Available online at: https://www.environment.nsw.gov.au/topics/water/estuaries/estuaries-of-nsw?sort=title_asc
Preston, C. M., and Schmidt, M. W. (2006). Black (pyrogenic) carbon: a synthesis of current knowledge and uncertainties with special consideration of boreal regions. Biogeosciences 3, 397–420. doi: 10.5194/bg-3-397-2006
Richards, L., Brew, N., and Smith, L. (2020) 2019–20 Australian bushfires—frequently asked questions: a quick guide, Research Paper Series 2019–20, 12 March, Australian Parliamentary Library. Available online at: https://parlinfo.aph.gov.au/parlInfo/download/library/prspub/7234762/upload_binary/7234762.pdf
Riedel, T., Zark, M., Vähätalo, A. V., Niggemann, J., Spencer, R. G. M., Hernes, P. J., et al. (2016). Molecular signatures of biogeochemical transformations in dissolved organic matter from ten world Rivers. Front. Earth Sci. 4:85. doi: 10.3389/feart.2016.00085
Roy, P., Williams, R., Jones, A., Yassini, I., Gibbs, P., Coates, B., et al. (2001). Structure and function of south-east Australian estuaries. Estuarine, coastal and shelf science, 53, 351–384.
Santos, F., Wymore, A. S., Jackson, B. K., Sullivan, S. M. P., McDowell, W. H., and Berhe, A. A. (2019). Fire severity, time since fire, and site-level characteristics influence streamwater chemistry at baseflow conditions in catchments of the Sierra Nevada, California, USA. Fire Ecol. 15, 1–15. doi: 10.1186/s42408-018-0022-8,
Schneider, M. P., Hilf, M., Vogt, U. F., and Schmidt, M. W. (2010). The benzene polycarboxylic acid (BPCA) pattern of wood pyrolyzed between 200 C and 1000 C. Org. Geochem. 41, 1082–1088. doi: 10.1016/j.orggeochem.2010.07.001
Shakesby, R. A., and Doerr, S. H. (2006). Wildfire as a hydrological and geomorphological agent. Earth-Sci. Rev. 74, 269–307. doi: 10.1016/j.earscirev.2005.10.006
Stubbins, A., Niggemann, J., and Dittmar, T. (2012). Photo-lability of deep ocean dissolved black carbon. Biogeosciences 9, 1661–1670. doi: 10.5194/bg-9-1661-2012
Stubbins, A., Spencer, R. G., Chen, H., Hatcher, P. G., Mopper, K., Hernes, P. J., et al. (2010). Illuminated darkness: molecular signatures of Congo River dissolved organic matter and its photochemical alteration as revealed by ultrahigh precision mass spectrometry. Limnol. Oceanogr. 55, 1467–1477. doi: 10.4319/lo.2010.55.4.1467
Vaezzadeh, V., Zhong, G., Gligorovski, S., Wang, Y., and Zhang, G. (2023). Characteristics of dissolved black carbon in riverine surface microlayer. Mar. Pollut. Bull. 194:115301. doi: 10.1016/j.marpolbul.2023.115301,
Wagner, S., Cawley, K. M., Rosario-Ortiz, F. L., and Jaffé, R. (2015). In-stream sources and links between particulate and dissolved black carbon following a wildfire. Biogeochemistry 124, 145–161. doi: 10.1007/s10533-015-0088-1
Wagner, S., Jaffé, R., and Stubbins, A. (2018). Dissolved black carbon in aquatic ecosystems. Limnol. Oceanogr. Lett. 3, 168–185. doi: 10.1002/lol2.10076
Wang, J., Zhang, R., Wang, J., Mo, L., Ji, Z., Wei, P., et al. (2025). Occurrence, spatiotemporal distribution and environmental behavior of dissolved, particulate, and sedimentary black carbon in a subtropical coastal environment: differences between semi-enclosed and open estuaries. Mar. Pollut. Bull. 215:117908. doi: 10.1016/j.marpolbul.2025.117908,
Ward, M., Tulloch, A. I., Radford, J. Q., Williams, B. A., Reside, A. E., Macdsonald, S. L., et al. (2020). Impact of 2019–2020 mega-fires on Australian fauna habitat. Nat. Ecol. Evol. 4, 1321–1326. doi: 10.1038/s41559-020-1251-1,
Wei, X., Hayes, D. J., and Fernandez, I. (2021). Fire reduces riverine DOC concentration draining a watershed and alters post-fire DOC recovery patterns. Environ. Res. Lett. 16:024022. doi: 10.1088/1748-9326/abd7ae
Wiedemeier, D. B., Lang, S. Q., Gierga, M., Abiven, S., Bernasconi, S. M., Früh-Green, G. L., et al. (2016). Characterization, quantification and compound-specific isotopic analysis of pyrogenic carbon using benzene polycarboxylic acids (BPCA). J. Vis. Exp. 111:53922.
Xu, F., Wei, C., Zeng, Q., Li, X., Alvarez, P. J., Li, Q., et al. (2017). Aggregation behavior of dissolved black carbon: implications for vertical mass flux and fractionation in aquatic systems. Environ. Sci. Technol. 51, 13723–13732. doi: 10.1021/acs.est.7b04232,
Zhang, Q., Zhou, J., Fang, Z., Yang, W., Chen, M., and Zheng, M. (2024a). Sources and dynamics of dissolved black carbon in the Pearl River estuary and shelf, northern South China Sea. J. Oceanogr. 80, 71–83. doi: 10.1007/s10872-023-00708-2
Zhang, X., Wang, Y., Liu, Z., Liu, B., Wu, W., Liu, L., et al. (2024b). Heterogeneous sources, distribution, and removal processes of dissolved black carbon from East China Sea shelf to open ocean of Northwest Pacific. Prog. Oceanogr. 229:103374. doi: 10.1016/j.pocean.2024.103374
Zhao, W., Bao, H., Huang, D., Niggemann, J., Dittmar, T., and Kao, S.-J. (2023). Evidence from molecular marker and FT-ICR-MS analyses for the source and transport of dissolved black carbon under variable water discharge of a subtropical estuary. Biogeochemistry 162, 43–55. doi: 10.1007/s10533-022-00987-9
Zimmerman, A. R. (2010). Abiotic and microbial oxidation of laboratory-produced black carbon (biochar). Environ. Sci. Technol. 44, 1295–1301. doi: 10.1021/es903140c,
Keywords: BPCA, dissolved black carbon, dissolved organic carbon, estuaries, wildfire
Citation: Laicher-Edwards D, Liu L, Benkendorff K, Johnston SG, Ferguson A, Reithmaier GMS, Borrow R and Maher DT (2026) Quantifying dissolved black carbon in fire-affected estuaries: a case study from the 2019–2020 Australian bushfires. Front. Water. 7:1653473. doi: 10.3389/frwa.2025.1653473
Edited by:
Zhuoran Duan, Pacific Northwest National Laboratory (DOE), United StatesReviewed by:
Taiping Wang, Pacific Northwest National Laboratory (DOE), United StatesRiley Barton, Oregon State University, United States
Copyright © 2026 Laicher-Edwards, Liu, Benkendorff, Johnston, Ferguson, Reithmaier, Borrow and Maher. This is an open-access article distributed under the terms of the Creative Commons Attribution License (CC BY). The use, distribution or reproduction in other forums is permitted, provided the original author(s) and the copyright owner(s) are credited and that the original publication in this journal is cited, in accordance with accepted academic practice. No use, distribution or reproduction is permitted which does not comply with these terms.
*Correspondence: Dylan Laicher-Edwards, ZHlsYW4ubGFpY2hlci1lZHdhcmRzQHNjdS5lZHUuYXU=