Abstract
An efficient groundwater management strategy requires identification of groundwater potential zones with a good groundwater quality index. The present study uses analytic hierarchy procedure (AHP) to identify potential groundwater resource zones along with quality for irrigation purposes in the Bargarh Canal command area of Odisha, India. The groundwater potential zone (GWPZ) was assessed using the geology, lineament density, geomorphology, groundwater fluctuation, soil type, topographic wetness index (TWI), slope, canal density, drainage density, and land use/cover of the study area. The groundwater quality index (GWQI) considers seven indices viz. sodium adsorption ratio (SAR), sodium percentage (Na%), magnesium hazard (MH), permeability index (PI), residual sodium carbonate (RSC), Kelly's ratio (KR), soluble sodium percentage (SSP) and three chemical parameters like electrical conductivity, chlorine, nitrate. The study area was categorized into three groundwater potential zones with 71.8% accuracy: good (48.12%), moderate (41.72%), and poor (10.16%). Irrigation water quality was assessed using Piper, United States Salinity Laboratory (USSL), and Wilcox Diagrams. Utilizing the groundwater quality index, the study region was divided into three distinct groundwater quality zones with an accuracy of 73.6%: poor (4.02%), moderate (45.20%), and good (50.78%). This classification was achieved through receiver operating characteristic (ROC) and area under curve (AUC) analyses, which demonstrated strong model reliability. Superimposition of the GWQI map over the GWPZ map reveals some degree of overlap between good potential zones with poor quality, which can guide policymakers and water managers for groundwater resource management and planning, underscoring the importance of both quantity and quality aspects.
1 Introduction
Groundwater resources are experiencing heightened stress from escalating demand in multiple sectors, resulting in degradation (Sehlaoui et al., 2020). Determining appropriate groundwater extraction locations is essential due to aquifer variability and differing yield potential (Gorgij and Vadiati, 2014). In recent decades, water shortages and human repercussions have escalated, as evidenced by the western region of Odisha experiencing annual water crises attributed to monsoon irregularities, deforestation, unregulated irrigation, and insufficient water management practices (Dhar et al., 2014).
Intensification of agriculture has led to nitrogen pollution, a significant type of groundwater contamination worldwide (Brindha and Kavitha, 2015). Evaluating irrigation water quality is crucial for sustainable harvest management since electrical conductivity (EC) influences plant-soil-water ion interactions (Binley et al., 2015; Sundaray et al., 2009). Groundwater is generally preferred for irrigation and drinking because of its safeguarding and convenience relative to surface water (Srivastava, 2019). However, while focusing on water quantity, quality issues are often overlooked. Poor water quality negatively impacts agricultural development, soil health, crop quality, and production (Sarkar and Islam, 2019; Sarkar et al., 2022). In India, groundwater sources provide 50% of agricultural water and 85% of potable water. Assessing groundwater quality, analysis and its correlation with management actions is crucial for effective resource management (Kavurmaci, 2016).
Conventional methods for assessing groundwater potential, including geophysical, geological, and hydrogeological techniques, are costly, labor-intensive, and require substantial data. Remote sensing (RS) and geographic information systems (GIS) have become essential instruments for assessing and mapping groundwater resources, providing solutions to water-related issues (Eldaw et al., 2021; Ierodiaconou et al., 2005). Multiple studies have utilized RS and GIS techniques to delineate groundwater potential zones (Saraf and Choudhury, 1998; Krishnamurthy et al., 2000; Solomon and Quiel, 2006; Suryawanshi et al., 2023).
Various techniques, including analytical hierarchy process (AHP), frequency ratios, random forest models, and logistic regression models, have been used to determine groundwater potential zones (GWPZs). The AHP based on RS and GIS is considered a simple, effective, and cost-efficient approach (Yildiz and Karakuş, 2020). Groundwater studies in developing regions (like the Bargarh Canal command area) often face data scarcity, spatial heterogeneity, and incomplete field observations. AHP does not depend on extensive datasets—it relies instead on expert-derived relationships and spatial layers that can be obtained from remote sensing and GIS. This makes AHP cost-effective and scalable, allowing accurate identification of groundwater potential zones even when continuous monitoring data are unavailable. Groundwater potential zoning involves the integration of various thematic layers such as geology, geomorphology, slope, drainage density, lineament density, and land use/land cover. These factors influence groundwater occurrence, movement, and recharge (Ahmed et al., 2024). The quality index, on the other hand, considers parameters like pH, electrical conductivity, total dissolved solids, and concentrations of major ions to assess the suitability of groundwater for different purposes (Adimalla and Qian, 2023).
Recent studies have highlighted the importance of considering both quantity and quality in groundwater assessments. For instance, Balaji et al. (2025) integrated groundwater potential zoning with a water quality index to identify suitable zones for drinking and irrigation purposes. Similarly, Machiwal et al. (2018) developed a comprehensive approach combining groundwater potential and vulnerability assessment to support the sustainable management of groundwater resources.
Many studies on identifying potential groundwater zones primarily focus on quantity, neglecting qualitative assessment (Zewdie et al., 2024; Mishra et al., 2024). Additionally, despite extensive irrigation in the Bargarh district, Odisha, India for the last 50 years, the suitability of groundwater in the Hirakud reservoir and Bargarh Main Canal for irrigation remains unexamined (Ahmed et al., 2024; Dhar et al., 2015; Saraf and Choudhury, 1998). Furthermore, there is a lack of integrated approaches that combine groundwater potential zoning with quality assessment to provide a holistic view of groundwater resources for sustainable management.
The present study aims to address these gaps by: (1) delineating groundwater potential zones (GWPZs) and groundwater quality indexes (GWQIs); (2) identifying safe zones by combining groundwater quality and potential zones; and (3) developing an integrated framework for assessing both quantity and quality aspects of groundwater resources. This research proposes a comprehensive evaluation of the hydro-chemical status of groundwater in the canal command areas, considering both the quality and quantity of groundwater for agricultural and drinking purposes. The study employs a novel method of identifying groundwater potential zones based on both quantity and quality using the AHP. By integrating both the quality and quantity of groundwater, this work aims to develop an innovative approach to sustainable management of groundwater resources by addressing the limitations of previous studies, which are either focused on quantity or quality in isolation.
2 Materials and methods
2.1 Study area
The Bargarh Canal command area (BCCA) is a part of the Hirakud command area (HCA) of the Mahanadi River Basin in Odisha, India. It lies between the latitudes of 20°43′N and 21°41′N and the longitudes of 82°39′E and 83°58′E. The study region encompasses a total area of 2,083 km2 (Figure 1). The Bargarh main canal, which is 84.28 km long and irrigates approximately one lakh thirty thousand hectares of land with 108.16 cumec discharge, emerges from the right dyke (Panda et al., 2014). The study area is bounded by the Mahanadi River to the east, the Bargarh main canal to the west, the Ong River to the south, and the Hirakud Reservoir to the north. The mean annual precipitation received in this region is 1,436 mm, and approximately 87% of it occurs due to the southwest monsoon from June to September. July and August are the wettest months in this region. In summer, the temperature fluctuates between 35 °C and 45 °C, whereas in winter it ranges between 9 °C and 20 °C. The groundwater table varied between 1 and 9 m below ground level (bgl). The command area is supplied with water year-round, with the exception of May, and the canals are occasionally stopped for 30 days in November and December for maintenance. The sloping terrain of the command area and field-to-field irrigation cause the lower part of the crop fields to become waterlogged and face a shortage of water supply at the tail end (Naghibi et al., 2018). The most common crop grown is paddy rice. The command area's geology comprises granite, granite gneisses, and quartzites to a significant extent. The predominant soil type in the area is Inceptisols, accounting for 83.8% of the total, followed by Vertisols at 14.11% and Alfisols at 1.86%.
Figure 1

Bargarh Canal command area with its major hydrological features.
2.1.1 Data collected and pre-processed
Groundwater data were collected from 86 observation wells of the Central Ground Water Board (CGWB) (2022), and 10 physiochemical characteristics recorded at well locations in the command area. Additionally, 10 thematic maps were created using traditional and satellite data to determine the groundwater potential zones of the BCCA: geology (GG), lineament density (LD), geomorphology (GM), groundwater fluctuation (GF), soil texture (ST), topographic wetness index (TWI), slope (SL), canal density (CD), drainage density (DD), and land use/land cover (LULC). LULC, CD, LD, and safe yield data of different well points used for validation of Ground Water Potential Zone (GWPZ) at a scale of 1:50,000 were collected using data from National Remote Sensing Centre (NRSC), Hyderabad, and Soil from National Bureau of Soil Survey and Land Use Planning (NBSS&LUP) Government of India, in raster format. The Digital Elevation Model (DEM) from the Shuttle Radar Topography Mission (SRTM; https://earthexplorer.usgs.gov/) was used to create the slope, drainage density, and TWI. Geological and geomorphological maps were downloaded from the Geological Survey of India (GSI) website (https://bhukosh.gsi.gov.in. in Bhukosh/the public). Groundwater level (GF) data for 10 years were collected from the Central Groundwater Board (CGWB) and Bhubaneswar for groundwater quantity analysis (https://cgwb.gov.in/en/data-download). The following physicochemical parameters were used for groundwater quality analysis: electrical conductivity, chlorine, nitrate, residual sodium carbonate, sodium percentage, sodium adsorption ratio (SAR), magnesium hazard (MH), permeability index (PI), and Kelly's ratio (KR; Verma et al., 2021) for groundwater quality analysis. Groundwater quality parameters, including calcium, chloride, and bicarbonate, were assessed using the titration technique, while electrical conductivity was measured using a microprocessor conductivity meter. Similar methods were used to test potassium, sodium, and nitrate using an ultraviolet-visible spectrophotometer, sulfate using a turbidity method, and fluoride with an ion meter (Freeze and Cherry, 1979; Yesilnacar and Topal, 2005).
The IDW method operates on the premise that the values of attributes at locations without samples are more significantly affected by nearby points than those farther away, with closer samples exerting a stronger influence. This method was chosen because of the even distribution of 86 observation wells and the low data density needed for variogram modeling in kriging. Although IDW can smooth out extreme values, this drawback was reduced through cross-validation and the selection of an optimal power parameter. Similar methodologies have been effectively applied in hydrogeological research (Li and Heap, 2014; Eldaw et al., 2021).
2.2 Groundwater potential and quality zoning
The assessment involves the identification of potential groundwater areas (GWPZs) and Groundwater Quality Indexes (GWQIs) by applying multi-criteria decision-making methods (MCDMs), known as the analytical hierarchical process (AHP).
The AHP was selected as the most suitable Multi-Criteria Decision Analysis (MCDA) technique because it provides a structured and transparent framework to integrate multiple hydrogeological parameters with varying influence on groundwater occurrence. AHP uses pairwise comparisons based on expert judgment to derive normalized weights for each thematic layer, ensuring logical coherence through the Consistency Ratio (CR), which was maintained below 0.1 (Saaty, 1980).
Compared to data-driven and complex methods such as logistic regression, frequency ratio, or random forest models, AHP requires fewer data inputs, offers interpretability, and performs effectively in heterogeneous regions with limited monitoring data or field observation (Jha et al., 2010; Machiwal et al., 2018; Eldaw et al., 2021; Zewdie et al., 2024). Thus, AHP was employed to integrate 10 thematic layers within a GIS environment to delineate groundwater potential and quality zones for the study area. Soil texture, LULC, geology, and geomorphology were among the feature layers that were converted into raster format. The fluctuation in groundwater level has been used to quantify the variance in groundwater over space and time. Initially, the distinct feature layers were separated into sub-features and ranked. Then the 10 characteristics were assigned weights from 1 to 9 according to Saaty's scale, which measures the impact on groundwater potential (Table 1). A parameter having higher weightage contributes significant influence whereas a parameter with low weightage subsidizes minimal impact on groundwater potential as well as quality. A matrix for pairwise comparison was created, encompassing all the thematic layers (features) for the decision-making process. The square matrix with dimensions n × n, where n is the number of parameters analyzed is called the pairwise comparison matrix or “A1”. Relative weights were determined for each layer and their characteristics to calculate the percentage influences. Then, the normalized weights were computed using the geometric mean, resulting in an n × 1 matrix called “A2”. Matrix multiplication was used to build the “A3” matrix from the “A2” and “A1” matrices. Matrix division between matrices “A3” and “A2” yielded the eigenvector matrix (A4). If we average the “A4” matrix, we get the final eigenvalue. The normalized eigenvectors and primary eigenvectors were calculated. Using the formulas laid forth by Saaty (1980), we determined the study's consistency level by calculating the consistency index (CI) and consistency ratio (CR) were calculated using the following formulas (Equations 1, 2).
Table 1
| Intensity of importance (1–9) | Definition |
|---|---|
| 1 | Equal importance; both elements contribute equally to the objective. |
| 2 | Weak or slight importance. |
| 3 | Moderate importance; experience slightly favors one element. |
| 4 | Moderate to strong importance. |
| 5 | Strong importance; one element is strongly favored in practice. |
| 6 | Strong to very strong importance. |
| 7 | Very strong importance; dominance shown consistently. |
| 8 | Very strong to extreme importance. |
| 9 | Extreme importance; highest possible level of evidence supports dominance. |
Measurement scale of AHP (Saaty, 1980).
Reciprocals (1/2–1/9): used when the less important element is compared to the more important one. All AHP-derived weights and normalized weights are dimensionless.
Consistency index (CI)
Where, n = number of criteria used; λmax = Principal eigenvalue.
Consistency ratio (CR)
Where, RCI = random consistency index.
Using a scale of 1–12, the RCI value was derived from the Saaty's standard table (Table 2).
Table 2
| N | 3 | 4 | 5 | 6 | 7 | 8 | 9 | 10 | 11 |
|---|---|---|---|---|---|---|---|---|---|
| RCI | 0.58 | 0.90 | 1.12 | 1.24 | 1.32 | 1.41 | 1.45 | 1.49 | 1.51 |
Random consistency index (RCI).
The expert-based weighting process involved six specialists, including three hydrogeologists, two soil scientists, and one GIS expert. Each expert independently prepared a pairwise comparison matrix for the 10 thematic layers using the Saaty 1–9 scale. These individual matrices were then combined using the geometric mean to generate a single group comparison matrix. From this aggregated matrix, we derived the normalized eigenvector values (representing the final weights) and calculated the maximum eigenvalue, followed by the Consistency Index (CI) and Consistency Ratio (CR) in accordance with Saaty's methodology. Only matrices with a CR value below 0.1 were accepted; whenever the CR exceeded this threshold, the experts collectively reviewed the inconsistencies and revised the matrices until an acceptable consistency level was achieved.
The relative importance of each parameter was defined according to its hydrogeological significance, supported by literature (e.g., Jha et al., 2010; Kavurmaci, 2016; Yildiz and Karakuş, 2020). The thematic layers chosen for groundwater potential zoning each have a unique hydrogeological function in affecting groundwater presence, movement, and replenishment. Geology and lineament density are key factors in determining groundwater potential as they influence both primary and secondary porosity, fracture connectivity, and the overall ability of the aquifer to transmit water. Geomorphology and slope significantly impact the balance between runoff and infiltration, thus controlling the spatial variability of recharge potential across the area. Drainage density and canal density affect localized recharge patterns by shaping surface water concentration, seepage processes, and the extent of natural or canal-fed water availability. Soil type and land use/land cover (LULC) influence infiltration rates, evapotranspiration, and return flows through variations in soil texture, permeability, and vegetation characteristics. The topographic wetness index (TWI) highlights areas susceptible to water accumulation and potential saturation, aiding in the identification of zones favorable for recharge. Lastly, groundwater fluctuation reflects the aquifer system's integrated response to recharge and extraction over time, serving as a valuable indicator for assessing the relative impact of other thematic layers (e.g., Krishnamurthy et al., 2000; Machiwal et al., 2018; Suryawanshi et al., 2023; Zewdie et al., 2024). Collectively, these factors determine the spatial distribution of groundwater potential in the study area. To draw any valid conclusions from AHP investigations, CR values should be less than 10% (Saaty, 1980). If this number is more than 10%, we investigated the process to find out where the discrepancy originated and fixed it. ArcGIS 10.8 was used to represent all of these parameters through spatial analysis. Ultimately, the feature maps are combined using a method that assigns weights to each map in a linear manner within the GIS platform. This process results in the creation of an index map, achieved through the use of the AHP technique. Many studies have used this strategy as it effectively combines different aspects to derive efficient decisions (Jha et al., 2010; Mogaji et al., 2016). Similarly, it was used to identify the groundwater quality index. All the parameters were calculated from 50 well points out of 86 well points using the Inverse Distance Weight (IDW) method. The GWPZ map was validated using the existing wells yield data using Receiver Operating Characteristics (ROC) or Area Under the Curve (AUC) method and GWQI map was validated using 36 well data out of 86 to verify the performance of the model (Naghibi et al., 2018).
2.3 Groundwater quality analysis
The assessment of groundwater quality in BCCA for agricultural purposes was assessed using different numerical and graphical tools. First of all, the sodium hazard was determined by calculating the Sodium Adsorption Ratio (SAR), Soluble Sodium Percentage (SSP), and Kelly's Ratio (KR). Soil salts accumulate and soil permeability decreases as a consequence of prolonged irrigation with poor-quality water (Ehya and Saeedi, 2019). Raghunath (1987) established a method to determine the suitability of water for irrigation based on permeability. This method uses the ionic concentrations in meq/L to measure the permeability index (PI) using (Equation 3).
The ratio of sodium concentration to calcium and magnesium concentrations is known as the Kelly ratio (KR; Kelly, 1963) given in Equation 4. This indication is often utilized to predict the appropriateness of water for irrigation. Irrigation water with a KR value below one is preferable since it contains fewer sodium ions. Water that has a KR value more than one has surplus sodium and should not be used for irrigation.
Increased soil alkalinity brought on by a high magnesium content in irrigation water inhibits crop growth and lowers crop yields (Song et al., 2023; Todd, 1980). Based on the magnesium absorption ratio (MAR)/Magnesium Hazard (MH) determined by Szabolcs and Darab (1964), the magnesium risk assessment is computed using Equation 5, where all values are given in meq/L.
To analyze the sodium hazard, Soluble Sodium Percentage (SSP) is crucial. Reduced soil permeability and stunted plant growth are two effects of increased SSP concentration in irrigation water. In the absence of chlorides, the soil becomes saline; in the presence of chlorides, sodium combines with carbonate to produce sodium carbonate. According to Rawat et al. (2018), neither situation is conducive to a growing plant. The following Equation 6 has been used to find the soluble sodium percentage:
Using ArcGIS 10.8, all of these quality indices have been shown spatially and tabulated in Table 3 which are the properties of irrigational groundwater that have been classified.
Table 3
| Parameters | Range | Suitability classification | References |
|---|---|---|---|
| EC (μS/cm) | < 250 | Low | Richards, 1954; Wilcox, 1955 |
| 250–750 | Medium | ||
| 750–2250 | High | ||
| >2250 | Very high | ||
| SAR | < 3 | Excellent | Ayers and Westcot, 1985; Mukhopadhyay et al., 2022 |
| 3–9 | Good | ||
| >9 | Permissible | ||
| PI | >75 | Perfectly suitable | Doneen, 1964 |
| 25–75 | Moderately suitable | ||
| < 25 | Unsuitable | ||
| Na% | < 20 | Excellent | Islam et al., 2018 |
| 20–40 | Good | ||
| 40–60 | Permissible | ||
| SSP | < 50 | Safe | Todd, 1980 |
| >50 | Unsuitable | ||
| KR | < 1 | Suitable | Kelly, 1963; Mukhopadhyay et al., 2022 |
| >1 | Unsuitable | ||
| Nitrate (mg/L) | < 45 | Suitable | Simsek and Gunduz, 2007 |
| >45 | Unsuitable | ||
| MAR/MH | < 50 | Suitable | Szabolcs and Darab, 1964 |
| >50 | Unsuitable | ||
| Cl (mg/L) | < 140 | Highly suitable | Simsek and Gunduz, 2007 |
| 140–350 | Suitable | ||
| RSC | < 1.25 | Good | Eaton, 1950 |
| 1.25–2.5 | Marginal | ||
| >2.5 | Unsuitable | ||
| Ph | 7–8 | Excellent | Simsek and Gunduz, 2007 |
| 6.5–7 | Good |
Classification of groundwater parameters for irrigation purpose.
All parameter units in meq/L except for EC (μmhos/cm), NO3 in mg/L, and pH and KR are dimensionless.
Groundwater quality analysis for irrigation was performed using graphical methods like Piper trilinear Diagram, the United States Salinity Laboratory (USSL) method, and the Wilcox Diagram (Dhar et al., 2015). The Piper diagram consists of two triangle plots and a lozenge-shaped area, depicting anion and cation proportions and overall geochemical properties (Wani et al., 2024). Primary groundwater ions include Ca2+, Na+, Cl−, Mg2+, , K+, , , and F−. The trilinear diagram displays these ions on different sides of the triangles (Piper, 1944). Groundwater with high soluble salt content is unsuitable for irrigation. A precise water quality assessment is crucial for developing and operating an irrigation system (Sangodoyin and Ogedengbe, 1991). The Wilcox diagram uses Na% with EC at 25 °C to categorize groundwater for irrigation (Wilcox, 1955). The total cation content is represented in equivalents per million, and the sodium percentage is calculated using Equation 7.
The USSL developed a graph in 1954 classifying irrigation water using specific conductance and SAR (U.S. Salinity Laboratory, 1954). This USSL Diagram, a scatter plot, displays salinity hazard (EC) on a logarithmic X-axis and sodium hazard (SAR) on the Y-axis. SAR is calculated using Equation 8.
Then, the main descriptive statistics [minimum, maximum, mean, 95% confidence interval, standard deviation (SD), and coefficient of variation (CV)] of the measured and calculated basic water quality indicators were computed. All computations were done using the Grapher software. To determine the water quality, groundwater quality analysis from an irrigation water perspective was also done using graphical methods such as the USSL technique, Piper trilinear Diagram using Grapher software, and Wilcox Diagram using Diagrammes (v 8.43) software.
2.4 Combination of groundwater quality and potential zones
By analyzing the two zoning maps, the areas in the Bargarh Canal Command Area were categorized as good, moderate, and poor in terms of the groundwater water quality index and potential zone, which allowed for the estimation of the associated safe yield potential. The overlap between the two zoning maps was evaluated by the utilization of the intersect tool found in ArcGIS 108's Analysis toolbox. The process of superimposing the groundwater potential map over the water quality index map allowed for the identification of nine distinct zones and the percentage of each class acquired allowed for the accurate extraction of water volumes needed to replace the various groundwater zones.
3 Results and discussion
3.1 Groundwater variability
Water-level measurements were collected from observation wells across the study area and Figure 1 presents the spatial distribution of all 86 groundwater observation wells across the study area. The figure also highlights the four representative wells (Agalpur, Kulunda, Hirakud, and Mahadevpali) selected for detailed temporal groundwater-level analysis. From these, four wells were selected based on data completeness, spatial representativeness, and hydrogeological diversity. These locations were analyzed using linear regression to evaluate temporal variations in groundwater level, as illustrated in Figures 2a–d. The four wells were selected because they provided the most complete and reliable hydro chemical records across the study period. They are also spatially well-distributed, representing upstream, midstream, and downstream parts of the basin. In addition, the wells lie in distinct hydrogeological settings—such as alluvial plains, weathered hard rock, and transition zones—ensuring that the sampled data capture the natural variability of the aquifer system. Together, these factors make the selected wells representative of overall groundwater conditions in the area.
Figure 2

Linear regression model for groundwater level variation and rainfall at (a) Agalpur, (b) Kulunda, (c) Hirakud, and (d) Mahadevpali for the period from 2003 to 2023.
Quarterly observed GWL (pre-monsoon, Monsoon, post-monsoon, and winter) from these four locations for the period from 2003 to 2023 shows a declining trend of groundwater level at Agalpur in all quarters except the pre-monsoon period. However, a rising trend of the level is observed in the rest of 03 quarters of the year. Similarly, at the Mahadevpali location, the groundwater level is observed to decline in all quarters except the monsoon season (Figure 2d). Hirakud and Kulunda show slightly decreasing groundwater levels in all quarters of the year as shown in Figures 2b, c.
3.2 Delineation of groundwater potential zone
Geomorphology, Land use/cover (LULC), soil type (ST), geology (GG), drainage density (DD), lineament density (LD), slope (SL), canal density (CD), topographic wetness index (TWI, Equation 9), and groundwater fluctuation (GF) are the 10 thematic layers that have been taken into account in an attempt to identify GWPZs. The thematic layers used in GWPZ delineation are provided in Supplementary Figures S1a–j and serve as the inputs for the weighted overlay analysis.
Where, As = specific catchment area, β = curvature slope.
Different thematic layers were reclassified into features, which were then allocated scores accordingly. Based on the hydrogeological significance of the 10 characteristics and their specific sub-features and their normalized score derived via Saaty's AHP (as shown in Table 4) in promoting the occurrence of groundwater in the study area, weights are allocated to them. Based on prior studies and expert opinion in hydrogeology, geomorphology, and soil water conservation engineering, weights were given to various components and their features that contribute to the watershed's groundwater potential (Sarkar et al., 2022).
Table 4
| SI no | Theme | Weight | Class | Area in % | Weight assigned | Normalized weight |
|---|---|---|---|---|---|---|
| 1 | Geology | 26.7 | Peninsular gneissic complex | 0.10 | 7 | 0.4118 |
| Lower Gondwana | 0.29 | 5 | 0.2941 | |||
| Migmatite | 94.80 | 3 | 0.1765 | |||
| Khondalite | 4.82 | 2 | 0.1176 | |||
| 2 | Lineament density (km/km2) | 20.46 | < 1 | 65.52 | 3 | 0.0968 |
| 1–2 | 12.42 | 6 | 0.1935 | |||
| 2–3 | 12.80 | 6 | 0.1935 | |||
| 3–5 | 9.25 | 8 | 0.2581 | |||
| 5–41 | 0.01 | 8 | 0.2581 | |||
| 3 | Geomorphology | 16.69 | WatBod | 9.02 | 7 | 0.3500 |
| Residual hill | 1.83 | 4 | 0.2000 | |||
| Pediment hill | 82.29 | 3 | 0.1500 | |||
| Active flood plain | 3.00 | 5 | 0.2500 | |||
| Valley fill | 3.86 | 1 | 0.0500 | |||
| 4 | Groundwater fluctuation | 10.59 | 1–2 | 28.52 | 9 | 0.3600 |
| 2–3 | 18.49 | 7 | 0.2800 | |||
| 3–5 | 30.60 | 5 | 0.2000 | |||
| 5–7 | 16.01 | 3 | 0.1200 | |||
| 7–9 | 6.38 | 1 | 0.0400 | |||
| 5 | Soil type | 8.04 | Vertisol | 14.12 | 5 | 0.2500 |
| Alfisol | 1.86 | 7 | 0.3500 | |||
| Inceptisols | 83.80 | 8 | 0.4000 | |||
| 6 | TWI (dimensionless) | 4.47 | 1–2 | 48.08 | 2 | 0.1000 |
| 2–3 | 29.05 | 5 | 0.2500 | |||
| 3–4 | 13.72 | 6 | 0.3000 | |||
| 4–24 | 9.15 | 7 | 0.3500 | |||
| 7 | Slope (degrees) | 4.8 | 1–2 | 33.07 | 8 | 0.3636 |
| 2–3 | 40.35 | 6 | 0.2727 | |||
| 3–4 | 21.33 | 5 | 0.2273 | |||
| 4–51 | 5.26 | 3 | 0.1364 | |||
| 8 | Canal density (km/km2) | 3.25 | 0–19 | 19.14 | 8 | 0.3333 |
| 19–40 | 30.96 | 7 | 0.2917 | |||
| 40–60 | 24.89 | 4 | 0.1667 | |||
| 60–84 | 19.52 | 3 | 0.1250 | |||
| 84–148 | 5.50 | 2 | 0.0833 | |||
| 9 | Drainage density (km/km2) | 2.8 | < 1 | 19.22 | 7 | 0.3684 |
| 1–2 | 25.97 | 5 | 0.2632 | |||
| 2–3 | 24.99 | 4 | 0.2105 | |||
| 3–4 | 20.87 | 2 | 0.1053 | |||
| 4–5 | 8.95 | 1 | 0.0526 | |||
| 10 | LULC | 2.2 | Water body | 3.64 | 7 | 0.1795 |
| Trees | 5.21 | 5 | 0.1282 | |||
| Flooded vegetation | 0.08 | 8 | 0.2051 | |||
| Crops | 76.74 | 9 | 0.2308 | |||
| Built area | 8.12 | 4 | 0.1026 | |||
| Bare ground | 0.25 | 2 | 0.0513 | |||
| Range land | 5.96 | 4 | 0.1026 |
Assigned weights and normalized weights for the individual features in groundwater potential zoning.
All AHP-derived weights and normalized weights presented in this table are dimensionless.
Pairwise comparisons of the individual features of each component were used to determine the normalized weights of the various aspects of the individual features. This pairwise comparison matrix (A1 matrix) with dimensions 10 × 10 was constructed to determine the normalized weight of every component that had an impact, as seen in Table 5.
Table 5
| Matrix | GG | LD | GM | GF | ST | TWI | SL | CD | DD | LULC | Normalized principal Eigen vector |
|---|---|---|---|---|---|---|---|---|---|---|---|
| GG | 1 | 2 | 3 | 4 | 5 | 6 | 7 | 8 | 5 | 3 | 0.267 |
| LD | 0.5 | 1 | 2 | 3 | 4 | 5 | 6 | 8 | 5 | 6 | 0.2046 |
| GM | 0.3333 | 0.5 | 1 | 4 | 5 | 5 | 3 | 3 | 5 | 6 | 0.1669 |
| GF | 0.25 | 0.3333 | 0.25 | 1 | 4 | 3 | 3 | 2 | 5 | 6 | 0.1059 |
| ST | 0.2 | 0.25 | 0.2 | 0.25 | 1 | 3 | 3 | 4 | 5 | 6 | 0.0804 |
| TWI | 0.1667 | 0.2 | 0.2 | 0.3333 | 0.3333 | 1 | 2 | 2 | 3 | 2 | 0.0447 |
| SL | 0.1429 | 0.1667 | 0.3333 | 0.3333 | 0.3333 | 0.5 | 1 | 3 | 3 | 5 | 0.048 |
| CD | 0.125 | 0.125 | 0.3333 | 0.5 | 0.25 | 0.5 | 0.3333 | 1 | 1 | 4 | 0.0325 |
| DD | 0.2 | 0.2 | 0.2 | 0.2 | 0.2 | 0.3333 | 0.3333 | 1 | 1 | 3 | 0.028 |
| LULC | 0.3333 | 0.1667 | 0.1667 | 0.1667 | 0.1667 | 0.5 | 0.2 | 0.25 | 0.3333 | 1 | 0.022 |
Pair-wise comparison matrix developed for AHP-based groundwater potential zoning.
Consistency ratio (CR) for GWPZ was found to be 9.7% which was found to be consistent. After all the layers were combined using ArcGIS's “weighted sum” overlay method, the groundwater potential zone (GWPZ) map of the study area was developed. The AHP-derived weights highlight the relative influence of each thematic parameter on groundwater potential within the study area. Geology (26.7%), receiving the highest weight, reflects its dominant control on aquifer properties such as primary porosity, weathering depth, and storage capacity; zones underlain by alluvium and highly fractured hard rock formations exhibit better groundwater occurrence. Lineament density (20.46%) follows closely, emphasizing the role of fractures and structural discontinuities in enhancing secondary porosity, facilitating groundwater movement, and creating preferential pathways for recharge. The next influential parameter is groundwater fluctuation (16.69%), which integrates seasonal recharge–discharge dynamics and validates the spatial response of the aquifer system, with smaller fluctuations commonly indicating better recharge conditions. Geomorphology (10.59%) also contributes significantly, as landforms such as pediplains, floodplains, and valley fills generally favor infiltration and storage compared to structural and denudational hills. Moderate influence is observed for soil type and LULC, which govern infiltration potential, evapotranspiration losses, and land–surface interactions. Parameters assigned lower weights—slope, topographic wetness index (TWI), canal density, and drainage density—act as secondary controls because the study area's relatively gentle terrain and canal network result in limited spatial variability; however, they still contribute to differentiating local recharge zones through runoff distribution, moisture accumulation, and seepage effects. Overall, the weightage pattern aligns with hydrogeological principles and is consistent with findings from similar AHP-based groundwater potential studies conducted in alluvial and hard-rock environments. The combination of attributes results in a GWPZ map as illustrated in Figure 3a. Thus, the study area has been divided into three groundwater potential zones such as poor, moderate, and good zones and also it was observed that the good, moderate, and poor potential zones cover 47.1, 48.7, and 4.14%, respectively. Groundwater potential zones range from good to moderate over the majority of the study region, except for a few isolated areas in the east. The relationship between AUC and prediction accuracy can be summarized as (38): poor (0.5–0.6); average (0.6–0.7); good (0.7–0.8); very good (0.8–0.9); and excellent (0.9–1). The evaluation of the overall quantity of groundwater in the study area given by GWPZ was validated using the ROC-AUC curve with a fairly good prediction accuracy of 0.718 as shown in Figure 3b.
Figure 3

(a) Groundwater potential zones map of the study area; (b) ROC curve for GWPZ.
3.3 Groundwater quality index/zone
Carbonate is the most variable component with a coefficient of variation (CV) of 3.74, with an average of 4.45 meq/L. It is followed by potassium and chlorine with a CV of 2.06 and 1.08, while the least variable parameter is pH 0.03. Furthermore, the average concentration of pH, EC, , , Cl−, , , Ca2+, Mg2+, Na+, K+, F−, SAR, RSC, %Na, KR, MH, SSP, and PI is 8.06, 823.54, 0.45, 289.6, 95.64, 41.34, 23.41, 33.12, 33.12, 59.27, 20.81, 0.45, 1.48, −0.77, 28.03, 0.63, 32.49, 36.58, and 49.63, respectively. Table 6 represents an analysis of all the descriptive statistical parameters with minimum, maximum, mean, 95% confidence interval, standard deviation, and coefficient of variation.
Table 6
| Parameter | Minimum | Maximum | Mean | 95% confidence interval | Standard deviation | Coefficient of variation |
|---|---|---|---|---|---|---|
| pH | 7.54 | 8.51 | 8.06 | 0.05 | 0.22 | 0.03 |
| EC | 287.00 | 2494.00 | 823.54 | 107.82 | 499.82 | 0.61 |
| 0.00 | 90.00 | 4.45 | 3.58 | 16.62 | 3.74 | |
| 55.00 | 740.00 | 289.60 | 32.68 | 151.48 | 0.52 | |
| Cl− | 12.00 | 562.00 | 95.64 | 22.30 | 103.39 | 1.08 |
| 0.00 | 218.00 | 41.34 | 8.09 | 37.52 | 0.91 | |
| 0.00 | 98.00 | 23.41 | 4.94 | 22.91 | 0.98 | |
| Ca2+ | 14.00 | 197.00 | 58.79 | 6.56 | 30.41 | 0.52 |
| Mg2+ | 2.00 | 134.00 | 33.12 | 6.08 | 28.18 | 0.85 |
| Na+ | 6.00 | 249.00 | 59.27 | 9.45 | 43.82 | 0.74 |
| K+ | 0.90 | 232.40 | 20.81 | 9.25 | 42.90 | 2.06 |
| F− | 0.05 | 2.44 | 0.45 | 0.08 | 0.39 | 0.86 |
| SAR | 0.22 | 3.97 | 1.48 | 0.18 | 0.82 | 0.55 |
| RSC | −12.58 | 4.70 | −0.77 | 0.55 | 2.54 | −3.31 |
| %Na | 8.65 | 53.63 | 28.03 | 2.00 | 9.28 | 0.33 |
| KR | 0.12 | 1.71 | 0.63 | 0.07 | 0.32 | 0.51 |
| MH | 3.85 | 90.54 | 32.49 | 3.69 | 17.11 | 0.53 |
| SSP | 10.91 | 63.11 | 36.58 | 2.46 | 11.42 | 0.31 |
| PI | 20.00 | 78.14 | 49.63 | 2.28 | 10.58 | 0.21 |
Descriptive statistical of water quality parameters.
All parameter units in meq/L except for EC (μmhos/cm), NO3 in mg/L, and pH and KR are dimensionless.
The water quality parameters, including Mg2+, Ca2+, , F−, , , pH, Na+, and K+ are examined at various observation stations located throughout the study area (Figures 4a–i). Spatial maps, generated using the IDW interpolation tool depict groundwater quality indices such as SAR, RSC, % Na, and PI as well as EC, , and Cl− (Figures 5a–j). The acceptable pH range for agricultural uses is 6.5–8.5. The study area's groundwater samples have pH values ranging from 7.54 to 8.51 (Figure 4g). The mean average value is 8.06 and thus, it may be deduced that the regional groundwater quality is slightly alkaline. This fluctuation in groundwater pH may be attributed to both natural and human-related factors. The value of F− as shown in Figure 4d is within the acceptable threshold (2 mg/L). The nitrate content, as depicted in Figure 5g, in groundwater at Chiplima is 68 mg/L, at Deogaon it is 64 mg/L, and at Hirakud it is 50 mg/L, all of which surpass the permissible limit of 45 mg/L (Simsek and Gunduz, 2007). Additionally, there are many other locations where the nitrate concentration also exceeds the limit. The groundwater quality is typically satisfactory, with electrical conductivity (EC) levels ranging from 287 to 2494 μs/cm (Figure 5b). The SAR values of the samples range from 0.22 to 3.97 (Figure 5h). A higher SAR value within the range of 3–9 implies a modest to significant sodium hazard. It is important to exercise caution when cultivating sensitive crops in such conditions. Similarly, the Na% ranges from 8.65 to 53.63, which falls within the acceptable level (Figure 5d; Ayers and Westcot, 1985). The Permeability Index is within the acceptable range of less than 60 (Figure 5c), making it appropriate for irrigation (Doneen, 1964). Permeability Index (PI) indicates that the maximum number of samples falls below 56.5 and above 25, which is classified as reasonably appropriate. Uchchabahal in Bargarh district, Ichhapur, and Karlajuri in Sonepur district have surpassed the maximum allowable level for Magnesium Hazard (Figure 5h). Similarly, the areas of Gorbhaga, Kodabahal, and Rusuda in Bargarh district, as well as Batemura and Hirakud in Sambalpur district, have a higher level of KR (Figure 5f), which suggests that they are not suitable for irrigation. The Soluble Sodium Percentage (SSP) in the groundwater of Kodabahal in Bargarh district and Hotapala in Sambalpur district is beyond the permissible limit (Figure 5e).
Figure 4

Spatial distribution maps of irrigation water quality: (a) Magnesium; (b) Calcium; (c) Carbonate; (d) Fluoride; (e) Bicarbonate; (f) Sulfate; (g) pH; (h) Sodium; (i) Potassium of the study area. All parameter units in meq/L except for EC (μmhos/cm), NO3 in mg/L, and pH and KR are dimensionless.
Figure 5

Spatial distribution maps of irrigation water quality: (a) EC; (b) SAR; (c) PI; (d) Na%; (e) SSP; (f) KR; (g) Nitrate; (h) MH; (i) Chlorine; (j) RSC of the study area. All parameter units in meq/L except for EC (μmhos/cm), NO3 in mg/L, and pH and KR are dimensionless.
Based on an evaluation of their hydrogeological significance in the study region, 10 thematic layers EC, SAR, PI, Na%, SSP, KR, nitrate, MH/MAR, chlorine, RSC, and their respective features were selected. Elevated nitrate concentrations are attributed primarily to agricultural fertilizer leaching, canal seepage, and return flow from paddy fields, consistent with findings by Rawat et al. (2018). High Magnesium Hazard (MH) corresponds to areas with gneissic formations rich in Mg-bearing minerals, while increased Kelly's Ratio (KR) and SSP values are associated with evaporation concentration and irrigation water reuse.
Anthropogenic influences, particularly unlined irrigation canals and fertilizer overuse, were also considered. Using Saaty's AHP, we got the normalized weights of the various qualities. For the GWQI calculation, appropriate weights are assigned to the influencing attributes and their corresponding attributes as presented in Table 7. Figure 6a illustrates the subset of 50 wells for which complete hydrochemical data were available and used in the Groundwater Quality Index (GWQI) assessment. These wells represent the functional water-quality monitoring network used for the irrigation suitability analysis.
Table 7
| SI no | Theme | Weight | Class | Area in % | Weight assigned | Normalized weight |
|---|---|---|---|---|---|---|
| 1 | Electrical conductivity | 20.79 | 288.94–694.19 | 27.98 | 3 | 0.1579 |
| 694.19–909.74 | 27.79 | 3 | 0.1579 | |||
| 909.74–1151.16 | 32.25 | 4 | 0.2105 | |||
| 1151.16–1539.16 | 9.42 | 4 | 0.2105 | |||
| 1539.16–2487.60 | 2.56 | 5 | 0.2632 | |||
| 2 | SAR | 13.22 | 0.22–1.20 | 22.18 | 8 | 0.3636 |
| 1.20–1.55 | 33.66 | 5 | 0.2273 | |||
| 1.55–1.95 | 23.42 | 4 | 0.1818 | |||
| 1.95–2.49 | 16.52 | 3 | 0.1364 | |||
| 2.49–3.93 | 4.22 | 2 | 0.0909 | |||
| 3 | PI | 10.52 | 43.87–46.74 | 11.62 | 7 | 0.4118 |
| 46.74–48.82 | 20.25 | 4 | 0.2353 | |||
| 48.82–50.70 | 29.92 | 3 | 0.1765 | |||
| 50.70–52.78 | 18.12 | 2 | 0.1176 | |||
| 52.78–56.5 | 20.09 | 1 | 0.0588 | |||
| 4 | Na% | 17.67 | 8.78–22.58 | 7.08 | 9 | 0.45 |
| 22.58–26.61 | 28.85 | 5 | 0.25 | |||
| 26.61–30.18 | 34.55 | 3 | 0.15 | |||
| 30.18–35.14 | 22.22 | 2 | 0.1 | |||
| 35.14–48.32 | 7.3 | 1 | 0.05 | |||
| 5 | SSP | 8.82 | < 50 | 98.06 | 8 | 0.6667 |
| >50 | 1.94 | 4 | 0.3333 | |||
| 6 | KR | 7.66 | < 1 | 96.48 | 8 | 0.89 |
| >1 | 3.52 | 1 | 0.1111 | |||
| 7 | Nitrate | 6.01 | 0.03–10.2 | 23.04 | 2 | 0.0952 |
| 10.2–17.97 | 25.68 | 3 | 0.1429 | |||
| 17.97–25.56 | 23.1 | 4 | 0.1905 | |||
| 25.56–33.33 | 18.24 | 5 | 0.2381 | |||
| 33.33–47.20 | 9.94 | 7 | 0.3333 | |||
| 8 | MH | 5.86 | < 50 | 97.48 | 8 | 0.8888 |
| >50 | 2.52 | 2 | 0.2 | |||
| 9 | Chlorine | 4.3 | 12.34–76.91 | 39.15 | 7 | 0.4118 |
| 76.91–117.81 | 32.69 | 4 | 0.2353 | |||
| 117.81–180.23 | 22.45 | 3 | 0.1765 | |||
| 180.23–300.76 | 4.74 | 2 | 0.1176 | |||
| 300.76–561.20 | 0.97 | 1 | 0.0588 | |||
| 10 | RSC | 5.15 | < 1.25 | 92.4 | 8 | 0.4705 |
| 1.25–2.5 | 6.32 | 5 | 0.2941 | |||
| 2.5 | 1.28 | 4 | 0.2352 |
Assigned and normalized weights for the individual features of the 10 attributes for groundwater quality index.
All parameter units in meq/L except for EC (μmhos/cm), NO3 in mg/L, and pH and KR are dimensionless.
Figure 6

(a) Groundwater Irrigation Quality Index map of the study area; (b) ROC curve for GWQI.
The Pair-wise comparison matrix reveals the linear correlation between various physical and chemical variables and the influence of each parameter on the overall hydro-chemical data as presented in Table 8.
Table 8
| Matrix | EC | PI | Na% | SAR | SSP | KR | Nitrate | MH | Chloride | RSC | Normalized principal eigenvector |
|---|---|---|---|---|---|---|---|---|---|---|---|
| EC | 1 | 7 | 9 | 1 | 1 | 1 | 5 | 1 | 1 | 9 | 0.2079 |
| PI | 0.1429 | 1 | 3 | 5 | 5 | 1 | 1 | 1 | 1 | 1 | 0.1322 |
| Na% | 0.1111 | 0.3333 | 1 | 3 | 1 | 5 | 1 | 5 | 2 | 1 | 0.1052 |
| SAR | 1 | 0.2 | 0.3333 | 1 | 9 | 9 | 1 | 7 | 8 | 1 | 0.1767 |
| SSP | 1 | 0.2 | 1 | 0.1111 | 1 | 5 | 1 | 7 | 1 | 1 | 0.0882 |
| KR | 1 | 1 | 0.2 | 0.1111 | 0.2 | 1 | 1 | 7 | 5 | 1 | 0.0766 |
| Nitrate | 0.2 | 1 | 1 | 1 | 1 | 1 | 1 | 3 | 1 | 1 | 0.0601 |
| MH | 1 | 1 | 0.2 | 0.1429 | 0.1429 | 0.1429 | 0.3333 | 1 | 9 | 1 | 0.0586 |
| Chloride | 1 | 1 | 0.5 | 0.125 | 1 | 0.2 | 1 | 0.1111 | 1 | 1 | 0.0430 |
| RSC | 0.1111 | 1 | 1 | 1 | 1 | 1 | 1 | 1 | 1 | 1 | 0.0515 |
Pair-wise comparison matrix for AHP based groundwater quality index.
CR of GWQI was found to be 9.1%. Based upon the above analysis EC was found to have the highest influence of 20.79% on groundwater quality zoning followed by SAR with 13.22%. The influence of PI and Na percentage is found to be 17.67 and 10.52%, respectively. Similarly, the influences of SSP, KR, nitrate, MH chlorine, and RSC on groundwater quality were 8.82, 7.66, 6.01, 5.86, 4.3 and 5.15%, respectively. The watershed groundwater water quality index (GWQI) map for irrigation purposes was constructed after all the layers were combined using ArcGIS's “weighted sum” overlay method. The spatial distribution of the Groundwater Quality Index (GWQI) reveals clear variations in irrigation water suitability across the study area, with 50.78% of the wells classified under good quality, 45.20% under moderate quality, and only 4.02% under poor quality zone. Regions exhibiting desirable GWQI values correspond to zones with lower electrical conductivity (EC), reduced sodium hazard (SAR and Na%), and favorable ionic balance, indicating limited anthropogenic influence and relatively stable hydrochemical evolution. Conversely, pockets of moderate to poor GWQI are associated with elevated salinity, higher residual sodium carbonate (RSC), and increased concentrations of major ions, which may be linked to intensive agricultural return flows, prolonged canal seepage mixing, or geogenic mineral dissolution. These patterns align with findings from similar hydrochemical assessments in canal-command regions, where evapotranspiration and irrigation practices significantly modulate groundwater chemistry. Overall, the GWQI analysis provides a robust representation of spatial water quality gradients, supporting informed agricultural water-use planning. The accuracy of prediction has been validated using the ROC-AUC curve, which shows a good performance prediction score of 0.736 (Figure 6b). Nevertheless, it is essential to conduct routine inspections while effectively managing agricultural practices (Dhar et al., 2015; Dhembare, 2012). Further, it was found out that Jabda, Gulunda, and Charda of Sonapur district and Kumbhari, Tonugaon, and Khuntpalli of Bargarh district have poor groundwater quality and the rest area are of moderate to good zone. Similarly, Baghapali, Chinchida, Shukutapalli of Bargarh and Chandajhuri, Phulmuthi of Sonapur district have poor groundwater quality index.
Additionally, the groundwater quality basing upon EC and SAR has been evaluated by USSL diagram as shown in Figure 7. This nomograph often evaluates the suitability of water for irrigation (Islam et al., 2018; Khodapanah et al., 2009). The majority of the water samples fall into the C2-S1 and C3-S1 zones, suggesting a medium to high salinity danger and a low alkali hazard, respectively. While the alkali danger is minimal and the saline hazard is significant, a small number of samples were discovered in the C4-S1 zone in the Sonapur district and Baghapalli in the Bargarh district (Figure 7). Thus, the majority of the research area's groundwater samples show low sodium and moderate salinity hazards, making them appropriate for use in agriculture.
Figure 7

Classification of irrigation water by USSL diagram.
The Piper class scatter plot (Todd, 1980) depicted in Figure 8 illustrates a distribution of 8 classes with an equal number of samples in each class. It is evident that anions are not dominant but cations are Ca-type and mixed type. Therefore, Ca-Mg-HCO3, Ca-HCO3, and mixed forms of water are the most common. Ion exchange processes, which occur when water flows through aquifers, could have been the cause (Saxena et al., 2004).
Figure 8

Piper trilinear diagram showing the groundwater quality of the command area.
Figure 9 shows the Wilcox diagram, which represents the relationship between Sodium Percentage (Na%) and electrical conductivity (EC) to classify irrigation water suitability. Classification results show that most samples are acceptable for irrigation as they are in the good to permitted or outstanding to good range.
Figure 9

Classification of irrigation water Wilcox diagram of command area.
3.4 Intersection of groundwater potential zone and quality index
An effort has been made to delineate feasible zones for sustainable groundwater extraction by superimposing groundwater quality maps on the potential map of the study area. Since anthropogenic and natural activities have an impact on groundwater quality and the recharge process affects potential zones, it was necessary to overlap groundwater quality zones over potential zones to evaluate the resource's appropriateness for irrigation. Thus, nine combinations of quality and quantity of groundwater could be developed as shown in Figure 10. Out of these combinations, the areas having good groundwater potential with good quality water cover only 23.15% area (327.8 km2) of the study region. Similarly, 46.5% area (658.4 km2) has either good quality groundwater with moderate potential or moderate quality with good potential. About 22.5% area of the study region (318.6 km2) has moderate groundwater potential with moderate quality. The groundwater from this pocket should be used cautiously taking the soil type and crop tolerance into consideration. It is interesting to note that 3.86% area of the study region (54 km2) has moderate to good groundwater potential but, with poor quality water, which implies that the groundwater from this pocket should not be tapped for irrigation purposes.
Figure 10
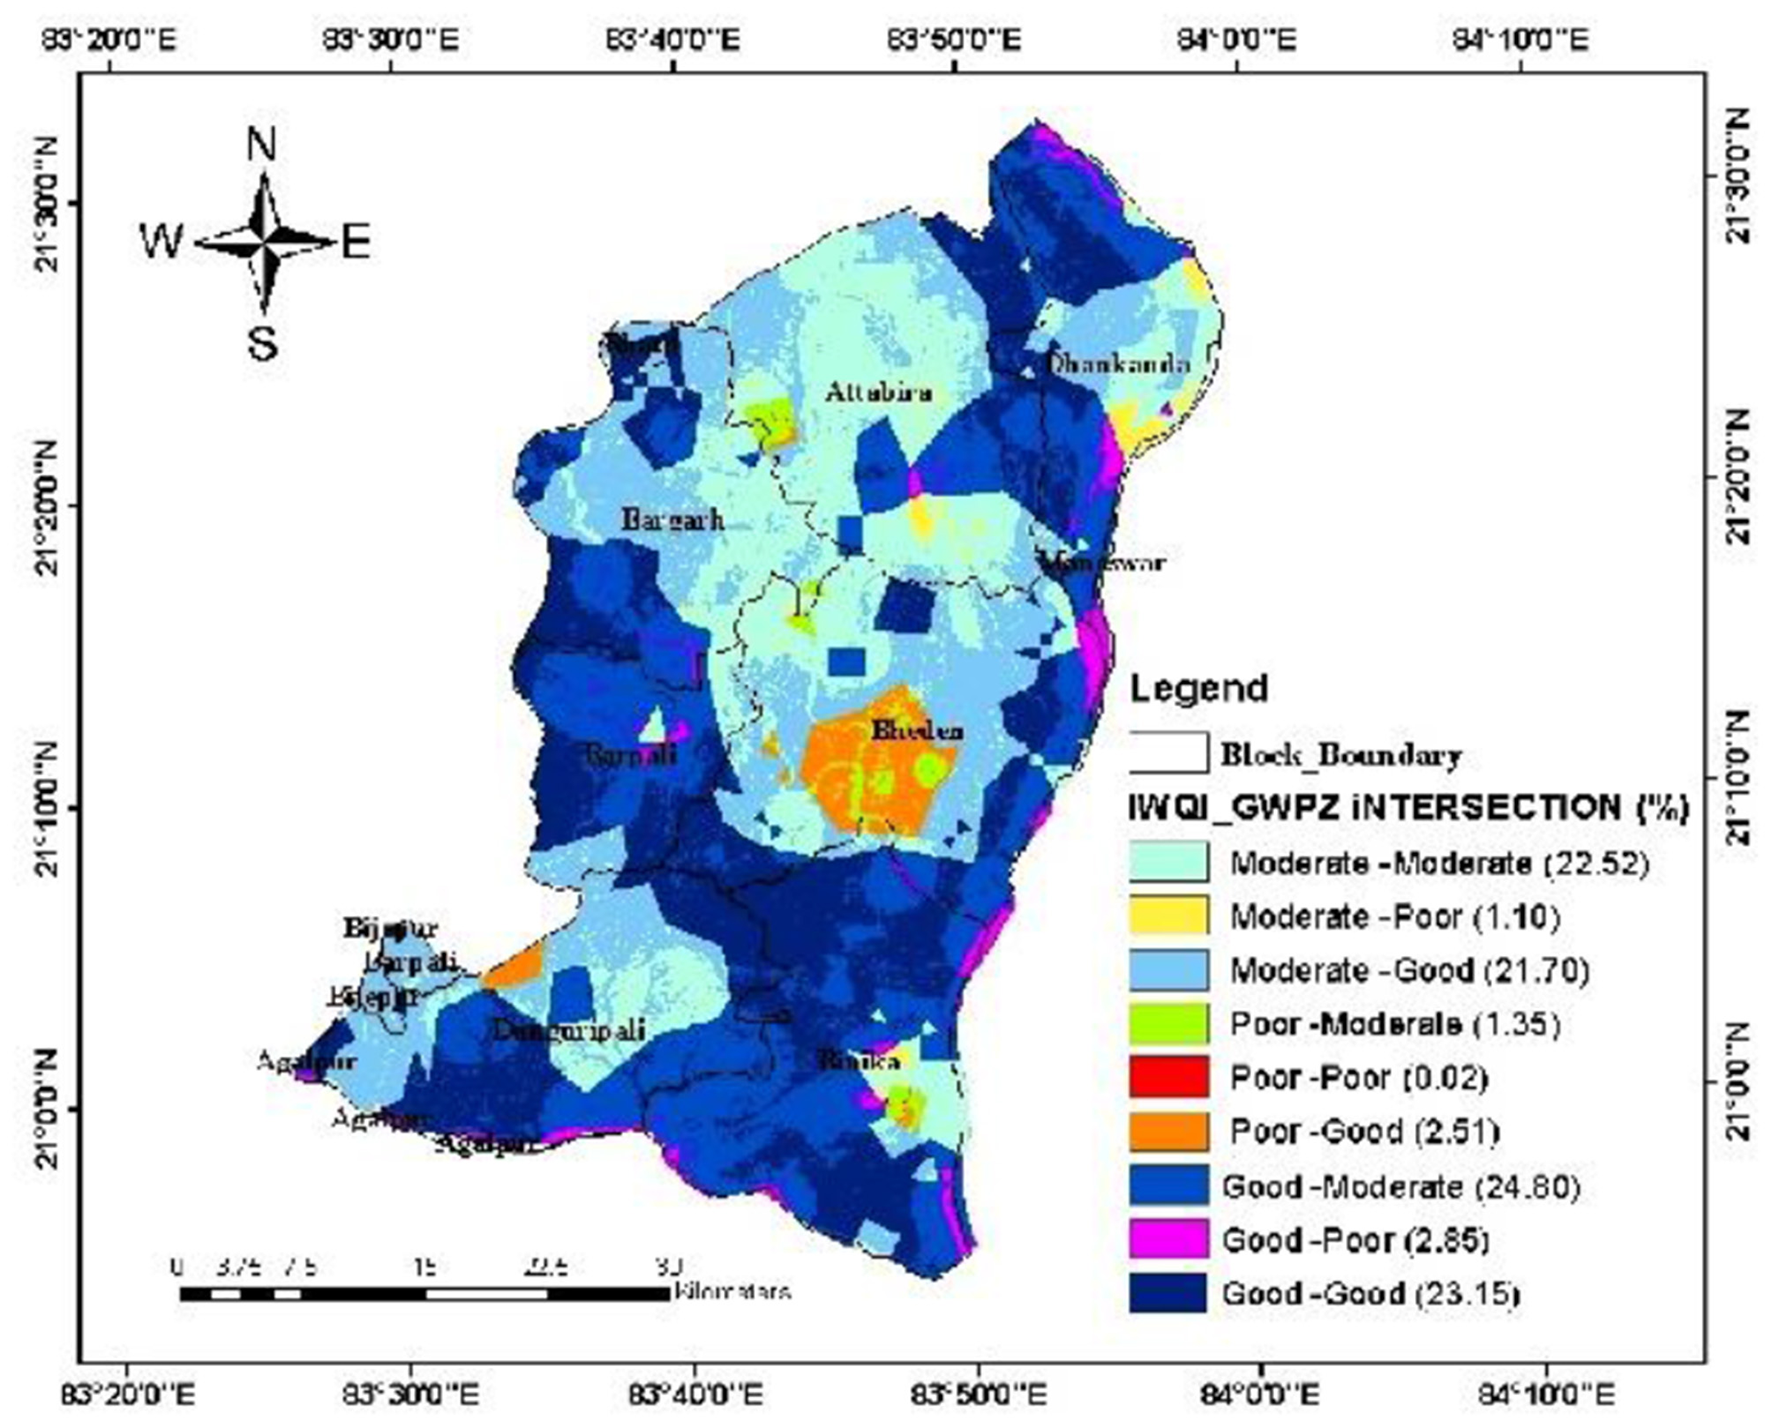
Combination of groundwater quality and potential zones of the study area.
The integrated overlay of GWPZ and GWQI effectively reflects the combine impact of groundwater quantity and quality, offering a more comprehensive view of resource suitability for irrigation and long-term sustainability. The analysis reveals that some areas identified as having good groundwater potential also show moderate or poor quality, highlighting regions with sufficient availability but reduced usability—a frequent issue in canal-fed agricultural systems with high evapotranspiration and solute accumulation. On the other hand, areas with both good potential and quality are identified as priority zones for sustainable extraction and groundwater-based irrigation management. This integrated method underscores significant discrepancies between aquifer potential and hydrochemical conditions, facilitating more focused interventions like controlled pumping, conjunctive use, and soil salinity management. Such dual-criteria frameworks have gained recognition in recent hydrogeological research for fostering resilient and evidence-based groundwater governance.
Zones showing high groundwater potential but poor water quality are mainly associated with the gently sloping alluvial plains and weathered–fractured hard-rock terrains, where higher infiltration enhances storage but also increases the dissolution of minerals such as carbonates, chlorides, and bicarbonates. Local agricultural return flows and prolonged irrigation practices further elevate salinity and sodium hazards. Areas exhibiting good groundwater potential but poor water quality present important management challenges. Although these zones can yield substantial quantities of groundwater, the degraded quality limits their suitability for irrigation and domestic use. Effective management should therefore focus on implementing treatment or remediation measures, regulating pumping to prevent further deterioration, and promoting controlled or restricted extraction based on quality thresholds. Integrating quality-based zoning into groundwater management plans can help ensure that high-yield aquifers are utilized sustainably without compromising long-term water security.
While policymakers must prioritize sustainable extraction practices in areas with good groundwater potential and quality, implementing strict regulations is crucial for zones with moderate potential or quality to prevent overexploitation of resources. Although institutional frameworks should be established to monitor and manage groundwater resources effectively in regions where quality or quantity is conceded, public awareness campaigns and educational programs are necessary to inform all stakeholders about responsible water use. Despite the need for incentives to adopt water-efficient irrigation techniques and crop diversification in areas with limited groundwater resources, collaborative efforts between government agencies, local communities, and agricultural sectors are essential for ensuring equitable access and long-term sustainability across all regions.
4 Conclusion
Through this study, we evaluated the quantity and quality of groundwater in the Bargarh Canal command area to verify the suitability of groundwater for irrigation. The study revealed that 47.10% area of the canal command possesses good groundwater potential followed by 48.7% area under moderate and only 4.14% area under poor groundwater potential. The prediction accuracy of 71.8% corroborates the finding.
To further describe the water quality, besides U.S. Salinity Laboratory (USSL) diagram and the Wilcox diagram, the Piper trilinear diagram has been used to examine the hydro-chemical facies of the groundwater samples. In addition, we created a thorough Groundwater Quality Index (GWQI) by combining these several water quality measures and categorization techniques. The resultant score divided the research area into three quality zones: good (50.78%), intermediate (45.20%), and bad (4.02%), giving a simplified picture of the total water quality. The excellent accuracy of 73.6% for the WQI classification confirmed the reliability of the assessment. A notable aspect of the study was the delineation of combination zones that integrated both groundwater potential and quality information.
These findings highlight potential challenges in groundwater management, as areas with good extraction potential may not always correspond to high water quality which may follow comprehensive groundwater assessment strategies that consider both quantity and quality parameters. The results provided here can certainly serve the development and implementation of optimal management plans for several important domains such as irrigation water quality monitoring, sustainable abstraction from aquifers, crop production planning, land use planning, or protection of aquifers. Future work should integrate advanced GIS–MCDA and machine-learning models to better predict changes in groundwater potential and quality. Continuous monitoring and climate-responsive assessments will help identify emerging risks in high-potential but poor-quality zones. Implementing managed aquifer recharge (MAR) and evaluating sustainable extraction strategies can further support long-term groundwater resilience in the region.
Conclusively, the study offers a strong scientific basis for managing groundwater sustainably in the Bargarh Canal command region. These may help planners evolve a sustainable strategy for the exploitation of potable groundwater quality for agricultural purposes, which will in turn ensure overall socio-economic development and environmental sustainability of the area.
Statements
Data availability statement
The original contributions presented in the study are included in the article/Supplementary material, further inquiries can be directed to the corresponding author.
Author contributions
PM: Investigation, Writing – original draft. JP: Project administration, Resources, Supervision, Writing – review & editing. DD: Writing – review & editing. AS: Project administration, Resources, Software, Writing – review & editing. SR: Project administration, Resources, Supervision, Writing – review & editing. LS: Writing – review & editing. SD: Writing – review & editing. AS: Writing – review & editing. AM: Writing – review & editing.
Funding
The author(s) declared that financial support was not received for this work and/or its publication.
Acknowledgments
The authors express their gratitude to the Central Groundwater Board (CGWB) of the Southeast Region (SER) and National remote Sensing Centre (NRSC), Hyderabad for supplying the essential data for this study. Sincere gratitude is extended for the essential hardware and software support provided by the Hydrology Simulation Laboratory of the College of Agricultural Engineering & Technology at the Odisha University of Agriculture and Technology, Bhubaneswar.
Conflict of interest
The author(s) declared that this work was conducted in the absence of any commercial or financial relationships that could be construed as a potential conflict of interest.
Generative AI statement
The author(s) declared that generative AI was used in the creation of this manuscript. The authors acknowledge that an AI language model was used solely to assist with language editing, and citation organization during manuscript preparation. All scientific content, interpretations, results, and conclusions are the authors' own. The authors take full responsibility for the integrity and accuracy of the manuscript.
Any alternative text (alt text) provided alongside figures in this article has been generated by Frontiers with the support of artificial intelligence and reasonable efforts have been made to ensure accuracy, including review by the authors wherever possible. If you identify any issues, please contact us.
Publisher’s note
All claims expressed in this article are solely those of the authors and do not necessarily represent those of their affiliated organizations, or those of the publisher, the editors and the reviewers. Any product that may be evaluated in this article, or claim that may be made by its manufacturer, is not guaranteed or endorsed by the publisher.
Supplementary material
The Supplementary Material for this article can be found online at: https://www.frontiersin.org/articles/10.3389/frwa.2025.1674770/full#supplementary-material
Abbreviations
AHP, analytic hierarchy process; AUC, area under the curve; BCCA, Bargarh Canal command area; CI, consistency index; CGWB, Central Groundwater Board; CR, consistency ratio; DEM, Digital Elevation Model; EC, electrical conductivity; ESP, exchangeable sodium percentage (note: ESP appears only in soil-related context; Wilcox diagram uses Na%); GIS, geographic information system; GWPZ, groundwater potential zone; GWQI, groundwater quality index; KR, Kelly's ratio; LULC, land use/land cover; MH, magnesium hazard; MCDA, multi criteria decision analysis; Na%, sodium percentage; NRSC, National Remote Sensing Centre; PI, permeability index; ppm, parts per million; RSC, residual sodium carbonate; ROC, receiver operating characteristic; SAR, sodium adsorption ratio; SSP, soluble sodium percentage; TDS, total dissolved solids; TWI, topographic wetness index; USSL, United States Salinity Laboratory; WQI, water quality index.
References
1
Adimalla N. Qian H. (2023). Groundwater quality and contamination: an application of GIS. Environ. Earth Sci.82:423. doi: 10.1007/s12665-023-11109-5
2
Ahmed S. N. Sahoo S. K. Baitharu I. (2024). Assessment of irrigation suitability of water in Hirakud reservoir and Bargarh main canal, Odisha, India: a multivariate analysis. Water Supply24, 2009–2023. doi: 10.2166/ws.2024.120
3
Ayers R. S. Westcot D. W. (1985). Water Quality for Agriculture, Vol. 29. Rome: Food and Agriculture Organization of the United Nations, 174.
4
Balaji K. Janani N. Selvaperumal A. Ramachandran J. Arthi T. Arunadevi K. et al . (2025). Geospatial assessment of groundwater quality in the Noyyal basin, Tamil Nadu, India using GIS and geostatistics. Plant Sci. Today12, 1–9. doi: 10.14719/pst.6134
5
Binley A. Hubbard S. S. Huisman J. A. Revil A. Robinson D. A. Singha K. et al . (2015). The emergence of hydrogeophysics for improved understanding of subsurface processes over multiple scales. Water Resour. Res.51, 3837–3866. doi: 10.1002/2015WR017016
6
Brindha K. Kavitha R. (2015). Hydrochemical assessment of surface water and groundwater quality along Uyyakondan channel, South India. Environ. Earth Sci.73, 5383–5393. doi: 10.1007/s12665-014-3793-5
7
Central Ground Water Board (CGWB) (2022). Groundwater Year Book—India 2021–2022. New Delhi: Ministry of Water Resources, River Development and Ganga Rejuvenation, Government of India.
8
Dhar A. Sahoo S. Dey S. Sahoo M. (2014). Evaluation of recharge and groundwater dynamics of a shallow alluvial aquifer in central Ganga basin, Kanpur (India). Nat. Resour. Res.23, 409–422. doi: 10.1007/s11053-014-9251-y
9
Dhar A. Sahoo S. Mandal U. Dey S. Bishi N. Kar A. (2015). Hydro-environmental assessment of a regional groundwater aquifer: Hirakud command area (India). Environ. Earth Sci.73, 4165–4178. doi: 10.1007/s12665-014-3703-x
10
Dhembare A. J. (2012). Assessment of water quality indices for irrigation of Dynaneshwar dam water, Ahmednagar, Maharashtra, India. J. Environ. Sci. Eng.54, 348–352.
11
Doneen L. D. (1964). Water Quality for Agriculture.Davis, CA: Department of Irrigation, University of California, Davis.
12
Eaton F. M. (1950). Significance of carbonates in irrigation waters. Soil Sci.69, 123–134. doi: 10.1097/00010694-195002000-00004
13
Ehya F. Saeedi F. (2019). Assessment of groundwater quality in the Garmez area (Southeastern Khuzestan Province, SW Iran) for drinking and irrigation uses. Carbonates Evaporites34, 1443–1454. doi: 10.1007/s13146-018-0481-7
14
Eldaw E. Huang T. Mohamed A. K. Mahama Y. (2021). Classification of groundwater suitability for irrigation using AHP and GIS in North Kurdufan Province, Sudan. Appl. Water Sci.11:126. doi: 10.1007/s13201-021-01443-z
15
Freeze R. A. Cherry J. A. (1979). Groundwater.Englewood Cliffs, NJ: Prentice-Hall.
16
Gorgij A. D. Vadiati M. (2014). Determination of groundwater quality based on important irrigation indices using analytical hierarchy process method. Environ. Earth Sci.72, 176–185.
17
Ierodiaconou D. Laurenson L. Leblanc M. Stagnitti F. Duff G. Salzman S. et al . (2005). The consequences of land use change on nutrient exports: a regional scale assessment in south-west Victoria, Australia. J. Environ. Manage.74, 305–316. doi: 10.1016/j.jenvman.2004.09.010
18
Islam A. T. Shen S. Haque M. A. Bodrud-Doza M. Maw K. W. Habib M. A. (2018). Assessing groundwater quality and its sustainability in Joypurhat District of Bangladesh using GIS and multivariate statistical approaches. Environ. Dev. Sustain.20, 1935–1959. doi: 10.1007/s10668-017-9971-3
19
Jha M. K. Chowdary V. M. Chowdhury A. (2010). Groundwater assessment in Salboni Block, West Bengal (India) using remote sensing, GIS, and multi-criteria decision analysis techniques. Hydrogeol. J.18, 1713–1728. doi: 10.1007/s10040-010-0631-z
20
Kavurmaci M. (2016). Evaluation of groundwater quality using a GIS-MCDA-based model: a case study in Aksaray, Turkey. Environ. Earth Sci.75, 1–17. doi: 10.1007/s12665-016-6074-7
21
Kelly W. P. (1963). Use of saline irrigation water. Soil Sci.95, 385–391. doi: 10.1097/00010694-196306000-00003
22
Khodapanah L. W. Sulaiman W. N. Khodapanah N. (2009). Groundwater quality assessment for different purposes in Eshtehard District, Tehran, Iran. Eur. J. Sci. Res.36, 543–553.
23
Krishnamurthy J. Mani A. Jayaraman V. Manivel M. (2000). Groundwater resources development in hard rock terrain—an approach using remote sensing and GIS techniques. Int. J. Appl. Earth Obs. Geoinf.2, 204–215. doi: 10.1016/S0303-2434(00)85015-1
24
Li J. Heap A. D. (2014). Spatial interpolation methods applied in environmental sciences: a review. Environ. Model. Softw.53, 173–189. doi: 10.1016/j.envsoft.2013.12.008
25
Machiwal D. Jha M. K. Mal B. C. (2018). Integrated groundwater potential and quality assessment using AHP and GIS. Environ. Earth Sci.77:612.
26
Mishra A. P. Singh S. Jani M. Singh K. A. Pande C. B. Varade A. M. (2024). Assessment of water quality index using Analytic Hierarchy Process (AHP) and GIS: a case study of a struggling Asan River. Int. J. Environ. Anal. Chem.104, 1159–1171. doi: 10.1080/03067319.2022.2032015
27
Mogaji K. A. Omosuyi G. O. Adelusi A. O. Lim H. S. (2016). Application of GIS-based evidential belief function model to regional groundwater recharge potential zones mapping in hard rock geologic terrain. Environ. Process.3, 93–123. doi: 10.1007/s40710-016-0126-6
28
Mukhopadhyay B. P. Chakraborty A. Bera A. Saha R. (2022). Suitability assessment of groundwater quality for irrigational use in Sagardighi block, Murshidabad district, West Bengal. Appl. Water Sci.12:38. doi: 10.1007/s13201-021-01565-4
29
Naghibi S. A. Pourghasemi H. R. Abbaspour K. (2018). A comparison between ten advanced and soft computing models for groundwater qanat potential assessment in Iran using R and GIS. Theor. Appl. Climatol.131, 967–984. doi: 10.1007/s00704-016-2022-4
30
Panda S. N. Raul S. K. Hollaender H. (2014). Sustainability of rice-dominated cropping systems in the Hirakud canal command, Orissa, India. Irrig. Drain.57, 93–104. doi: 10.1002/ird.351
31
Piper A. M. (1944). A graphic procedure in the geochemical interpretation of water analyses. Eos Trans. Am. Geophys. Union25, 914–928. doi: 10.1029/TR025i006p00914
32
Raghunath H. M. (1987). Groundwater, 2nd Edn. New Delhi: Wiley Eastern.
33
Rawat K. S. Singh S. K. Gautam S. K. (2018). Assessment of groundwater quality for irrigation use: a peninsular case study. Appl. Water Sci.8, 1–24. doi: 10.1007/s13201-018-0866-8
34
Richards L. A. (1954). Diagnosis and Improvement of Saline and Alkali Soils. Handbook No. 60. Washington, DC: United States Department of Agriculture. doi: 10.1097/00010694-195408000-00012
35
Saaty T. L. (1980). The Analytic Hierarchy Process.Columbus, OH: McGraw-Hill International. doi: 10.21236/ADA214804
36
Sangodoyin A. Y. Ogedengbe K. (1991). Subsurface water quality and quantity from the standpoint of irrigation and livestock. Int. J. Environ. Stud.38, 251–262. doi: 10.1080/00207239108710670
37
Saraf A. K. Choudhury P. R. (1998). Integrated remote sensing and GIS for groundwater exploration and identification of artificial recharge sites. Int. J. Remote Sens.19, 1825–1841. doi: 10.1080/014311698215018
38
Sarkar B. Islam A. (2019). Assessing the suitability of water for irrigation using major physical parameters and ion chemistry: a study of the Churni River, India. Arab. J. Geosci.12, 1–16. doi: 10.1007/s12517-019-4827-9
39
Sarkar B. Ullah M. Sarkar M. (2022). Environmental and economic sustainability through innovative green products by remanufacturing. J. Clean. Prod.332:129813. doi: 10.1016/j.jclepro.2021.129813
40
Saxena V. K. Mondal N. C. Singh V. S. (2004). Evaluation of hydrogeochemical parameters to delineate fresh groundwater zones in coastal aquifers. J. Appl. Geochemistry6, 245–254.
41
Sehlaoui H. Hassikou R. Moussadek R. Zouahri A. Douaik A. Dakak H. (2020). Evaluation of water quality for agricultural suitability in the Benslimane region, Morocco. Environ. Monit. Assess.192:587. doi: 10.1007/s10661-020-08530-9
42
Simsek C. Gunduz O. (2007). IWQ index: a GIS-integrated technique to assess irrigation water quality. Environ. Monit. Assess.128, 277–300. doi: 10.1007/s10661-006-9312-8
43
Solomon S. Quiel F. (2006). Groundwater study using remote sensing and GIS in the central highlands of Eritrea. Hydrogeol. J.14, 1029–1041. doi: 10.1007/s10040-006-0096-2
44
Song Y. Zhang Q. Melack J. M. Li Y. (2023). Groundwater dynamics of a lake–floodplain system: role of groundwater flux in lake water storage subject to seasonal inundation. Sci. Total Environ.857:159414. doi: 10.1016/j.scitotenv.2022.159414
45
Srivastava S. K. (2019). Assessment of groundwater quality for the suitability of irrigation and its impacts on crop yields in the Guna district, India. Agric. Water Manag.216, 224–241. doi: 10.1016/j.agwat.2019.02.005
46
Sundaray S. K. Nayak B. B. Bhatta D. (2009). Environmental studies on river water quality with reference to suitability for agricultural purposes: Mahanadi river estuarine system, India—a case study. Environ. Monit. Assess.155, 227–243. doi: 10.1007/s10661-008-0431-2
47
Suryawanshi S. L. Singh P. K. Kothari M. Singh M. Yadav K. K. Gupta T. (2023). Spatial and decision-making approaches for identifying groundwater potential zones: a review. Environ. Earth Sci.82:463. doi: 10.1007/s12665-023-11149-x
48
Szabolcs I. Darab C. (1964). “The influence of irrigation water of high sodium carbonate content on soils,” in Proceedings of the 8th International Congress of ISSS, Vol. II (Bucharest).
49
Todd D. K. (1980). Groundwater Hydrology, 2nd Edn. Hoboken, NJ: John Wiley and Sons.
50
U.S. Salinity Laboratory (1954). Diagnosis and Improvement of Saline and Alkali Soils. Washington, DC: U.S. Department of Agriculture.
51
Verma A. Yadav B. K. Singh N. B. (2021). Hydrochemical exploration and assessment of groundwater quality in part of the Ganga-Gomti fluvial plain in northern India. Groundw. Sustain. Dev.13:100560. doi: 10.1016/j.gsd.2021.100560
52
Wani A. M. L. Abunada Z. Yenilmez F. Muhammetoglu A. Muhammetoglu H. (2024). Comparative assessment of hydrochemical characterization and groundwater quality for irrigation in an autochthonous karst aquifer with the support of GIS: case study of Altinova, Turkey. Environ. Earth Sci.83:237. doi: 10.1007/s12665-024-11548-8
53
Wilcox L. V. (1955). Classification and Use of Irrigation Waters.Washington, DC: United States Department of Agriculture.
54
Yesilnacar E. Topal T. A. (2005). Landslide susceptibility mapping: a comparison of logistic regression and neural networks methods in a medium-scale study, Hendek region (Turkey). Eng. Geol.79, 251–266. doi: 10.1016/j.enggeo.2005.02.002
55
Yildiz S. Karakuş C. B. (2020). Estimation of irrigation water quality index using an optimum AHP model: a case study. Environ. Dev. Sustain.22, 4771–4786. doi: 10.1007/s10668-019-00405-5
56
Zewdie M. M. Kasie L. A. Bogale S. (2024). Groundwater potential zone delineation using GIS and AHP techniques in the upper parts of Chemoga watershed, Ethiopia. Appl. Water Sci.14:85. doi: 10.1007/s13201-024-02119-0
Summary
Keywords
analytical hierarchy process, groundwater, groundwater potential zone, groundwater quality, groundwater quality index
Citation
Mohapatra P, Paul JC, Das DM, Sahu AP, Raul SK, Singh LK, Devi SR, Singha AK and Mohanty AK (2026) Spatial analysis of groundwater quality and potential for irrigation using hydrogeological and water quality parameters: insights from Bargarh Canal command area. Front. Water 7:1674770. doi: 10.3389/frwa.2025.1674770
Received
30 July 2025
Revised
27 November 2025
Accepted
30 November 2025
Published
02 January 2026
Volume
7 - 2025
Edited by
Gabriella Balacco, Politecnico di Bari, Italy
Reviewed by
Maria Rosaria Alfio, Politecnico di Bari, Italy
Aekesh Kumar, National Institute of Hydrology (Roorkee), India
Updates
Copyright
© 2026 Mohapatra, Paul, Das, Sahu, Raul, Singh, Devi, Singha and Mohanty.
This is an open-access article distributed under the terms of the Creative Commons Attribution License (CC BY). The use, distribution or reproduction in other forums is permitted, provided the original author(s) and the copyright owner(s) are credited and that the original publication in this journal is cited, in accordance with accepted academic practice. No use, distribution or reproduction is permitted which does not comply with these terms.
*Correspondence: Laishram Kanta Singh, kanta_lai@yahoo.co.in; Priyanka Mohapatra, priyanka.rs21@ouat.ac.in
ORCID: Priyanka Mohapatra orcid.org/0009-0002-2108-5608; Sanjay Kumar Raul orcid.org/0000-0002-2389-5893
Disclaimer
All claims expressed in this article are solely those of the authors and do not necessarily represent those of their affiliated organizations, or those of the publisher, the editors and the reviewers. Any product that may be evaluated in this article or claim that may be made by its manufacturer is not guaranteed or endorsed by the publisher.