 Linfeng Han
 Ling Cheng
 Tao Yu2
- 1National Engineering Research Center for Inland Waterway Regulation, School of River and Ocean Engineering, Chongqing Jiaotong University, Chongqing, China
- 2Key Laboratory of Ministry of Education for Hydraulic and Water Transport Engineering, School of River and Ocean Engineering, Chongqing Jiaotong University, Chongqing, China
- 3Pinglu Canal Group Co., Ltd., Nanning, China
The Pinglu Canal is a cross-basin canal project. The Qinjiang River, serving as a vital tributary of the Pinglu Canal, exhibits a significant elevation differential between its riverbed and the canal bed. This geomorphological disparity exerts a substantial influence on both hydraulic dynamics and navigational parameters within the confluence zone. This study investigates the effects of hydrodynamic conditions—specifically, flow velocity characteristics, lateral velocity distribution, and flow regime—at the confluence section of the tributary of the Qinjiang River. The aim is to ensure navigational safety in the connecting segment of the tributary inflow. Through a 1:50 scale river engineering model experiment, systematic optimization and comparative analyses are conducted using iterative combinations of energy dissipation configurations. This approach aims to address the identified deficiencies related to elevated transverse flow velocities and unstable hydrodynamic patterns in the preliminary design. Subsequent validation through a 1:100 scale undistorted physical model quantitatively confirms the recommended scheme’s efficacy in sediment flux interception at tributary confluences. The findings demonstrate that the implementation of stepped stilling basins and sedimentation basins in the confluent reach of the Qinjiang tributary achieves superior remediation efficacy. This engineering configuration enhances navigational flow conditions within the canal while concurrently provides substantial sediment interception capacity for the tributary. These results offer valuable insights for analogous confluence rehabilitation projects in fluvial systems.
1 Introduction
The Pinglu Canal, an important part of China’s New Western Land-Sea Corridor and about 140 km long, has many tributaries along its alignment. The system comprises the original Shaping River, the Qinjiang River, and canals that traverse the watershed, constituting a cross-basin canal network, as shown in Figure 1. The canal’s inland waterway section, about 100.5 km long, is made up of the cascade reservoir reaches of Madao, Qishi, and Youth hubs. The whole canal is constructed according to the standard of inland waterway class I. The waterway is navigable to 3,000-ton ships, and the hubs are built with one-time double-lane 5,000-ton locks. The construction of the Pinglu Canal will significantly alleviate the constraints on navigation capacity within the Xi River system. Additionally, it will optimize the allocation of interregional resources and enhance industrial synergy between the southwestern hinterlands of China and its coastal economic hubs. This hydraulic infrastructure thus holds strategic significance in mitigating regional economic disparity between eastern and western China through enhanced maritime connectivity.
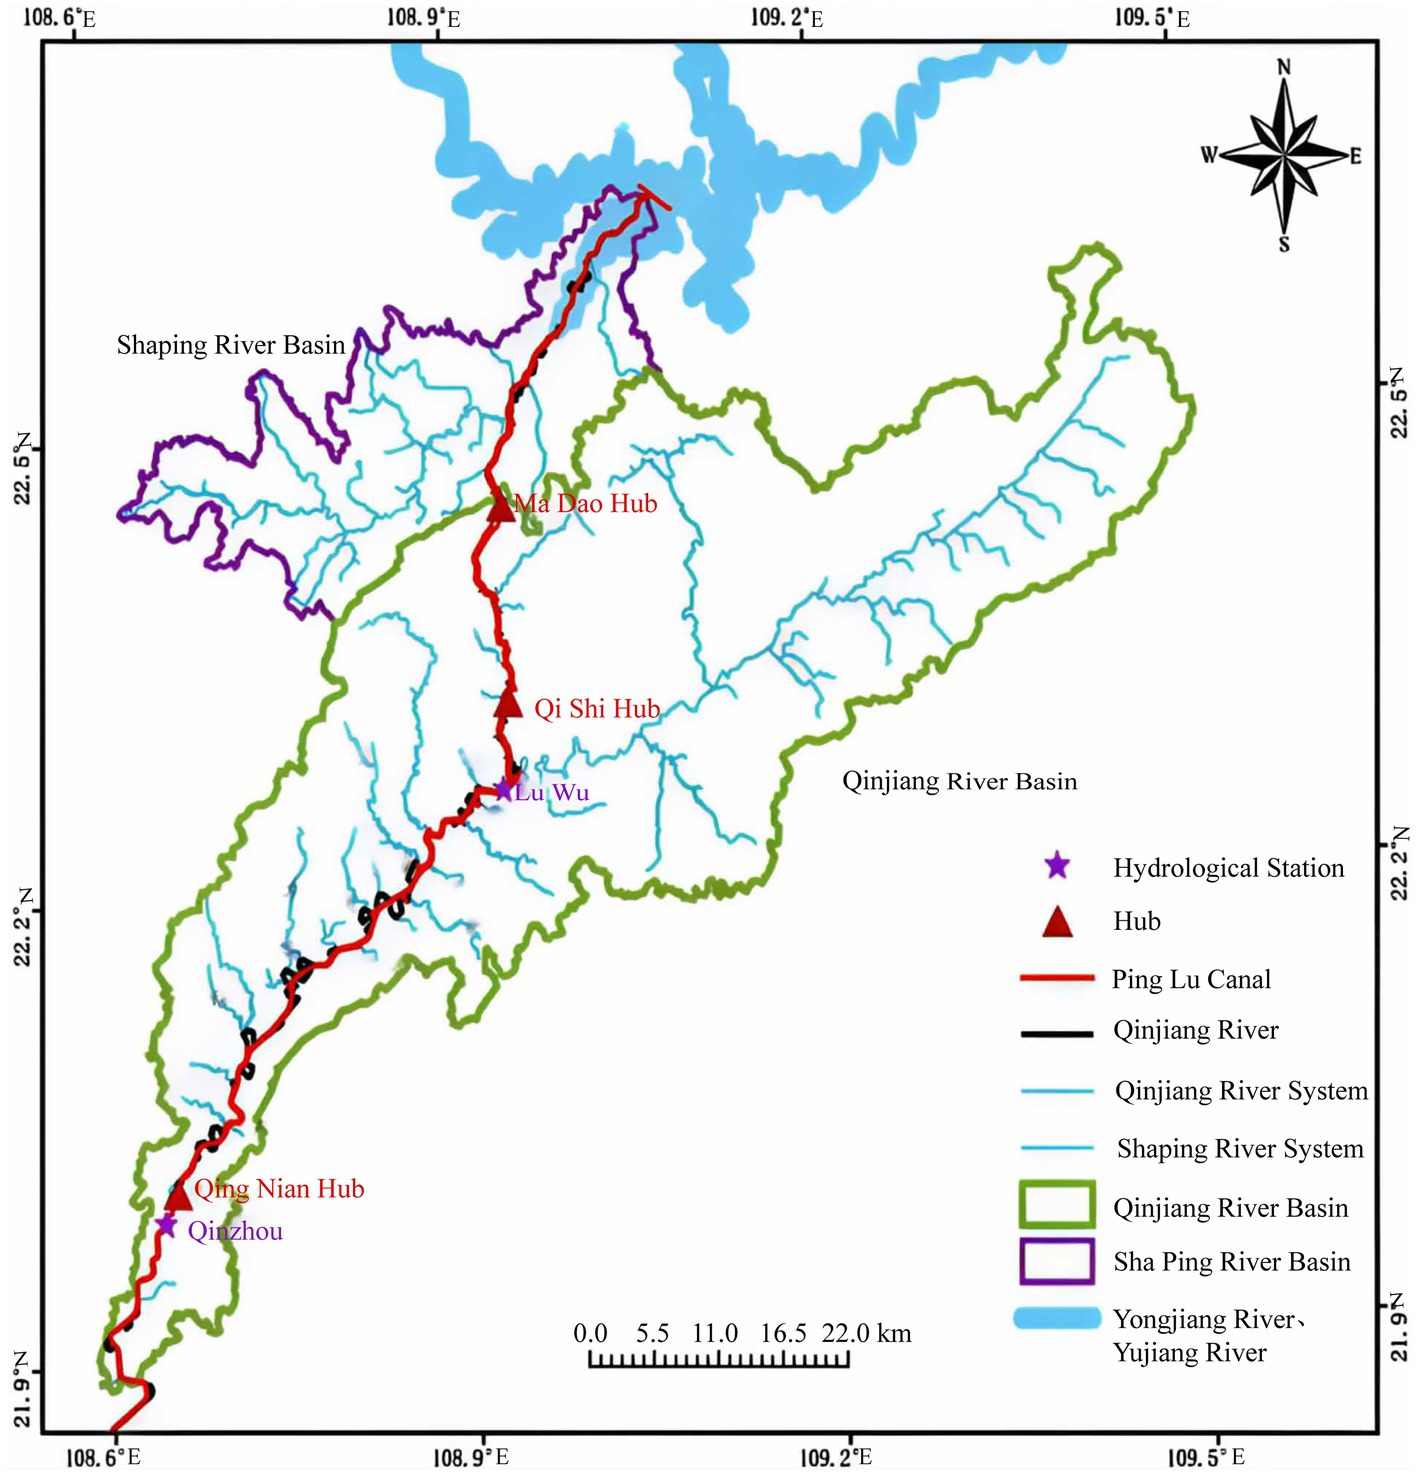
Figure 1. Inter-basin relationship map for the Pinglu Canal.
To preserve the Liuqin Expressway Qinjiang Bridge, the alignment design of the Pinglu Canal included a channel realignment at the original confluence of the Qinjiang River. This approach effectively avoids high-angle tributary convergence into the canal. As one of the main tributaries of the Pinglu Canal, the Qinjiang River has a maximum bottom elevation difference of 16.7 meters between its main stream and tributaries at the confluence section. This elevation difference is larger than that of any other tributary of the Pinglu Canal. Such a characteristic will lead to the exceedance of the allowable transverse flow velocity in some parts of the confluence area, thereby exerting a severe impact on the navigation function of the canal, as shown in Table 1 (De Serres et al., 1999). Transverse flow velocities exceeding permissible thresholds have been observed, substantially compromising the canal’s navigation functionality. When a tributary converges with the mainstream, the interaction between the two water currents induces significant alterations in hydrodynamic parameters, including flow velocity, direction, and water level. This interaction frequently results in the formation of complex flow structures, such as vortices and backflows (Liu et al., 2012a, 2012b; Wang et al., 2007; Riley, 2013).
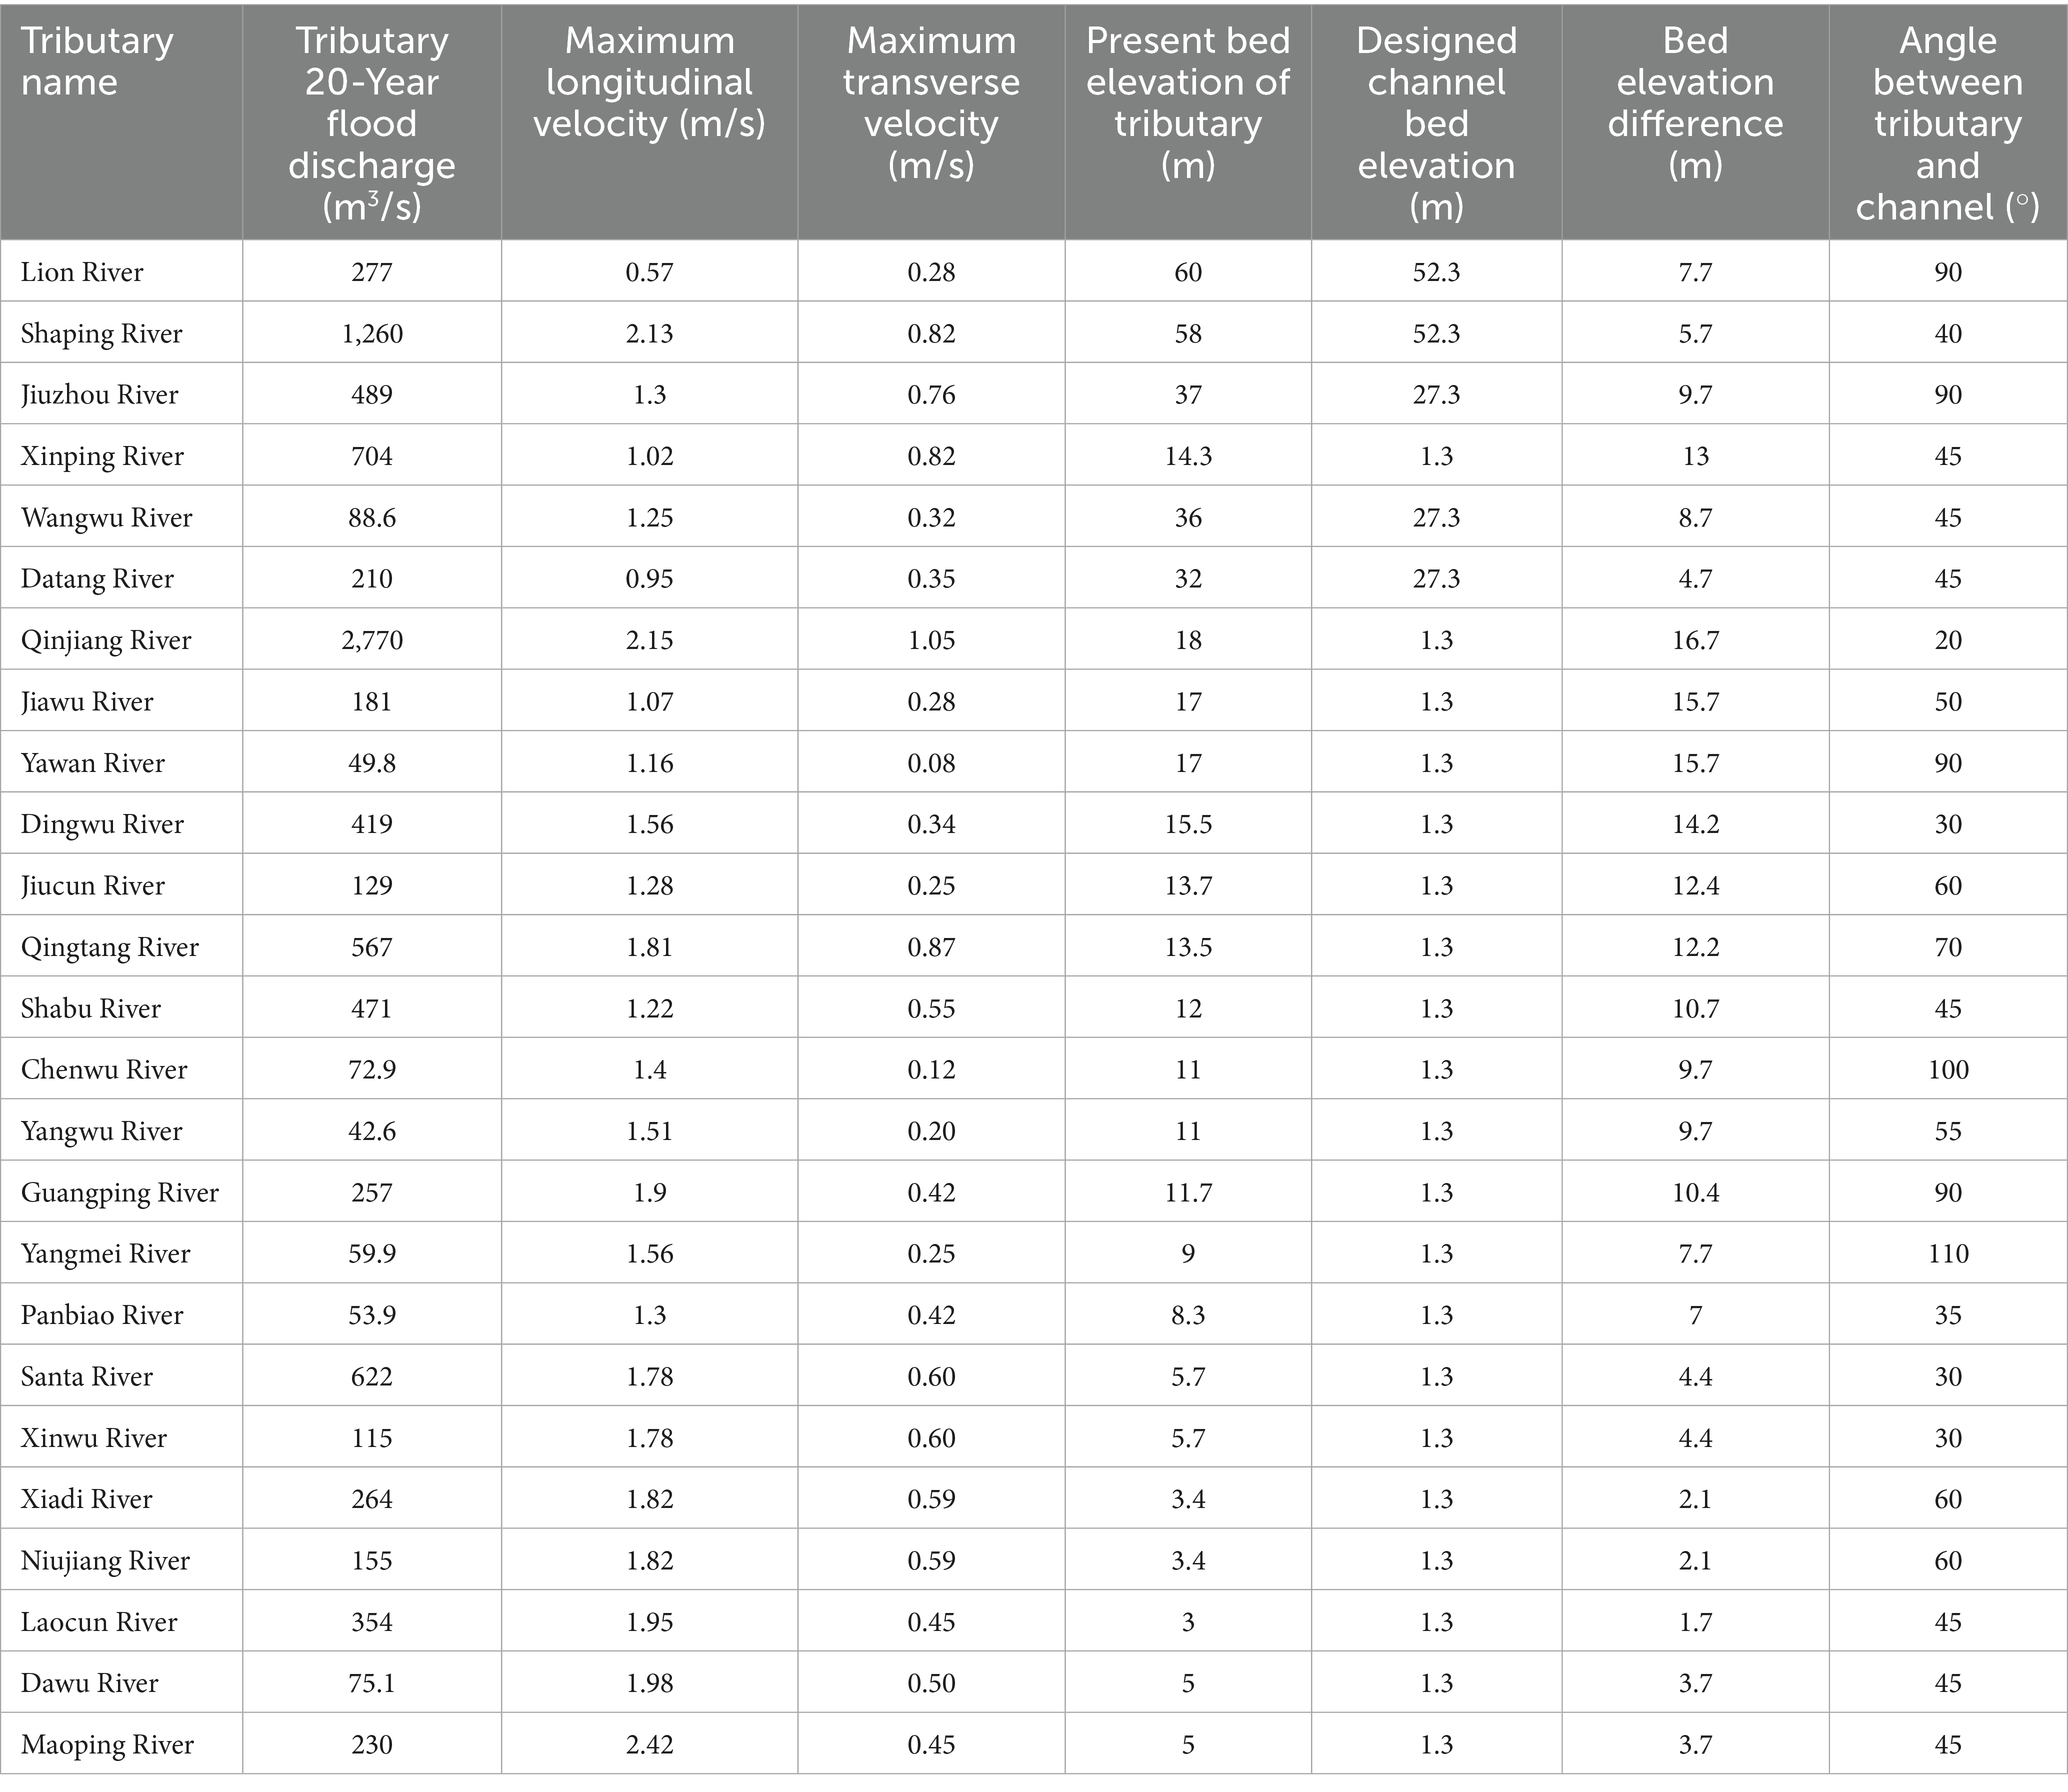
Table 1. Statistics on confluences of main tributaries to the Pinglu Canal.
In the study of confluence hydrodynamic characteristics, Biron et al. (2002) revealed that the lateral gradient of water surface elevation induces pronounced water surface tilting downstream of a river confluence, which was closely linked to the lateral asymmetry in bed morphology. At the discordant confluence, the bed discordance intensifies the turbulence intensity, leading to the occurrence of significant fluid upwelling in the confluence area (Canelas et al., 2022; Sukhodolov et al., 2017; Bradbrook et al., 2001). Rhoads and Kenworthy (1995) conducted investigations into the lateral velocity distributions downstream of small-scale asymmetrical confluences. Their research revealed that low-flow hydrodynamics undergo systematic reconfiguration as the momentum flux ratio between confluent streams increases. Boyer et al. (2006) demonstrated that bed discordance induces significant intensification of secondary flow circulation, yielding asymmetric shear layer distribution. In most hydraulic projects, due to constraints imposed by topographical conditions and inflow requirements, sole reliance on a single energy dissipation methodology frequently results in incomplete flood discharge efficiency (Tu and Renjie, 2019). Liu et al. (2012a, 2012b) demonstrated that within a composite energy dissipation system, the flow preconditioned by flaring gate piers establishes a stabilized hydraulic jump in the stilling basin, enhancing energy dissipation efficiency by 10–20% relative to a conventional single-basin configuration. Zhang et al. (2009a, 2009b) proposed that the energy dissipation efficiency of a combined energy dissipator (stilling basin + trajectory bucket) is approximately 30% higher than that of a single stilling basin. However, the matching between hydraulic jump length and trajectory bucket height must be controlled. Wei (2013) demonstrated that diversion walls effectively guide high-velocity flows toward the central zone of the stilling basin, forming helical turbulent flow patterns. The proposed configuration demonstrated a 15–25% improvement in energy dissipation efficiency relative to conventional stilling basins. Concurrently, the maximum scour depth downstream of composite energy dissipators decreased to 50–60% of those recorded in traditional systems. It is evident that the combined and coordinated use of multiple energy dissipation structures can achieve optimal energy dissipation efficiency.
To improve the navigable flow conditions at the confluence and mitigate excessive transverse flow velocities, it is imperative to implement flow energy dissipation measures while intercepting sediment transport from tributaries into the confluence zone. Pagliara et al. (2008) demonstrated that ramps under submerged flow conditions can effectively dissipate energy, providing a reference for energy dissipation measures at tributary-confluence flows. Yu et al. (2022) investigated the navigational flow conditions in the downstream approach channel of the Baise Water Control Project’s navigation facilities, revealing a nonlinear relationship between the length of the stilling basin and the flood discharge. Their study demonstrated that the energy dissipation efficiency improved significantly after capacity expansion. El-Saie et al. (2024) conducted a three-dimensional numerical modeling study. Their results demonstrated that the modified stilling basin significantly enhanced turbulence intensity through geometric optimizations, such as stepped floor additions. This improvement achieved a 15–20% higher energy dissipation rate compared to traditional designs. Ma et al. (2011) conducted physical model simulations of tributary confluence reaches. Controlled experiments were performed to assess lateral flow velocity suppression by spur dikes, stilling basins, and sediment retention basins. The study proposed a combined spur dike-stilling basin configuration, effectively mitigating lateral impacts during tributary inflow into the main navigation channel while reducing sediment deposition. When designing stilling basins, moderate slope gradients should be implemented on their upstream faces. Controlled slope modifications maintain energy dissipation efficiency while moderately enhancing sediment discharge capacity (Bantacut et al., 2022). Raju et al. (1999) conducted physical experiments and numerical simulations to compare sediment removal efficiency under varying operational conditions. Their findings demonstrated a positive correlation between sedimentation basin efficiency and hydraulic retention time. However, excessive flow velocity (inducing intensified turbulence) or suboptimal basin design (e.g., short-circuiting phenomena) markedly reduced removal rates.
In this study, a physical river model test was employed, with comprehensive consideration of the actual engineering conditions and environmental requirements in the Qinjiang River confluence area. To optimize the navigable flow conditions at the main-tributary confluence of the inter-basin canal, multiple comparative analyses were conducted using a combined multi-method governance approach, and the most suitable energy dissipation combination was selected. Meanwhile, for the final layout scheme that meets the navigational requirements, a flume model was used to verify the sediment retention effect. This verification ensures that the scheme also achieves the function of intercepting sediment from the tributary, thereby enabling the reach in the confluence area to attain the remediation effect of safe navigation.
2 Methods
2.1 Study area
The Qinjiang River joins the Pinglu Canal at Luwu Town with a confluence angle of about 20°. The confluence point is approximately 6.6 km upstream of the Qishi Hub and 49.7 km downstream of the Qingnian Hub. The mainstream of Qinjiang River is 195 km long with an average gradient of 0.32‰. The drainage basin encompasses a total area of 2,391 km2, characterized by a rainfall catchment area of 2,230.8 km2. Within this hydrological system, 12 tributaries have individual catchment areas exceeding 50 km2. Among these, four major tributaries—Nalong Stream, Jiuzhou River, Taiping Stream, and Xinping Stream—exhibit catchment areas that each surpass 100 km2. The Qinjiang River demonstrates a mean annual discharge of 64.37 m3/s, corresponding to a long-term average annual runoff volume of 2.03 billion cubic meters. The basin exhibits an annual runoff depth of 900 mm, with the maximum annual precipitation recorded at 1,683 mm, as determined by multi-decadal hydrological observations. At the river mouth of the Qinjiang River tributary, the water depth is 0.45 m, and the river surface width is 75 m. During the flood season, the near - shore flow velocity is 0.03 m/s, and the average sediment concentration is 0.915 g/L. The median grain size of the bed sediment is 0.18 mm on average, and that of the shore sediment is 0.165 mm on average. In the dry season, the average river width is about 60 m, and the water depth is about 2 m. The river bed slope is about 0.4 per thousand. The main channel flow velocity is 0.202 m/s, and the near - shore flow velocity is 0.029 m/s. The water body’s sediment concentration is 0.45 g/L. The particle size of the bed sediment ranges from 0.3 μm to 700 μm, and that of the shore sediment ranges from 0.3 μm to 500 μm. The total annual sand transport of the Qinjiang River tributaries in a typical year is as follows: 335,200 tons during years of abundant water, 385,900 tons in years of flat water, and 308,100 tons in years of dry water. The annual bed load sediment transport volumes are 10,100 tons in flood years, 11,600 tons in years of level water, and 920,000 tons in years of dry water.
The canal alignment along the mainstem of Qinjiang River essentially follows the thalweg of the watercourse, extending over a total length of 48.5 km. Through engineered interventions such as channel widening, meander cutoff rectification, and strategic dredging, the waterway has been hydrotechnically configured to meet the prescribed navigation channel dimensions of 80 m (channel bed width) × 6.7 m (design water depth) × 360 m (minimum curvature radius), thereby complying with inland waterway classification standards. The canal has a bottom elevation of 1.7 m and a bottom width of 80 m, with side slopes at a ratio of 1:2. According to the terrain on both banks, berms of different elevations are set up, with their width fixed at 3 m. Empirical thresholds derived from prior hydraulic investigations prescribe that lateral flow velocities should be constrained to ≤0.3 m/s, longitudinal velocities to ≤2.5 m/s, and maximum hydraulic gradients to ≤2.0‰ in canal confluence zones.
2.2 River engineering model test design and verification
The experimental model was constructed as an undistorted fixed-bed system with a scale ratio of 1:50. The design complied with fundamental river engineering modeling principles for flow similarity, achieving geometric, gravitational (Froude similarity), frictional (Manning equivalence), and continuity (mass conservation) similitude criteria.
The model scope includes the canal’s confluence with the Qinjiang River, with a tributary length of about 2.0 km. The main canal is 1.5 km upstream of the confluence and 1.5 km downstream of the tributary, totaling 3.0 km. There are 258 cross-sections: 195 in the tributary (15 m apart) and 63 in the main canal (50 m apart, with denser spacing near the confluence and meanders). Based on field measurements, the comprehensive roughness coefficient for this river reach ranges from 0.03 to 0.04. According to the resistance similarity criterion, the roughness scale ratio (where λh represents the vertical scale ratio), and thus the model roughness coefficient is determined to be 0.016 to 0.021. In hydraulic calculations, the roughness coefficient for a rough concrete mortar surface typically ranges from 0.016 to 0.018. To meet the required model roughness, localized gravel roughening was applied to specific sections of the model.
The model was designed to ensure a rational distribution of flow within the system. The inlet section features sufficient length and sinuosity to facilitate appropriate flow adjustments prior to entering the test section during various operational periods. The outlet section is designed with a relatively straightened configuration to ensure similarity in flow dynamics at the downstream boundary of the model. Under low-flow conditions, the thalweg of the tributary shows a minimum water depth of approximately 4 meters, which corresponds to a prototype-to-model scale ratio of 5 cm. This dimensional specification ensures the modeled water depth satisfies the critical threshold of 1.5 cm required to mitigate surface tension interference in physical hydraulic modeling. Based on an analysis of experimental data, the tributary flow velocity during low-flow periods ranges from 0.5 to 2.5 m/s, with a minimum water depth of approximately 4 m, resulting in a scaled model Reynolds number of ReM = 2000. This scaling ratio ensures the flood-condition model flow maintains ReM > 1,000, satisfying the turbulence initiation criterion for open-channel flows. Given that all hydrological configurations in this study represent flood scenarios in tributary systems, the model has been confirmed to satisfy the turbulence similarity criteria required for dynamic similitude in hydraulic model testing. Detailed experimental parameters are systematically presented in Table 2.
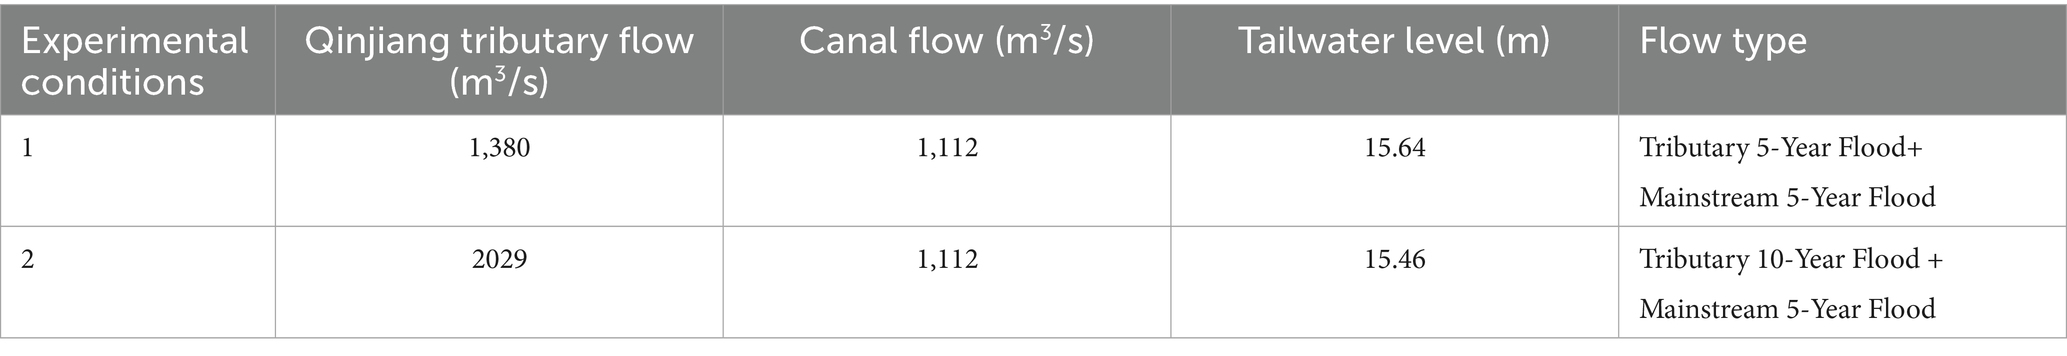
Table 2. Model experimental conditions.
The physical model was constructed using primary geomorphic data derived from a 1:1000-scale topographic map of the river channel, surveyed in September 2020 (China Geodetic Coordinate System 2000, National Vertical Datum 1985). This was referenced with hydraulic surveying data from a 1:2000-scale topographic map acquired in November 2021. It was achieved through the strategic placement of 148 cross-sectional profiles, the spatial distribution of which is detailed in Figure 2. Cross-sectional layouts in the Qinjiang tributary were implemented with 0.3 m spacing intervals, while canal sections were configured at 1 m intervals. In the confluence zones between the mainstem and tributaries, an optimized spacing of 0.36 m was applied. A monitoring network comprising 25 gauges was systematically deployed throughout the study area, with one gauge installed per tributary cross-section. To enhance hydraulic monitoring, three gauges (left, center, right) were installed per canal cross-section to ensure precise water level measurement and capture bank-to-thalweg gradients. The gauge spacing was maintained between 250 m and 400 m, averaging 350 m (7.0 m in model scale).
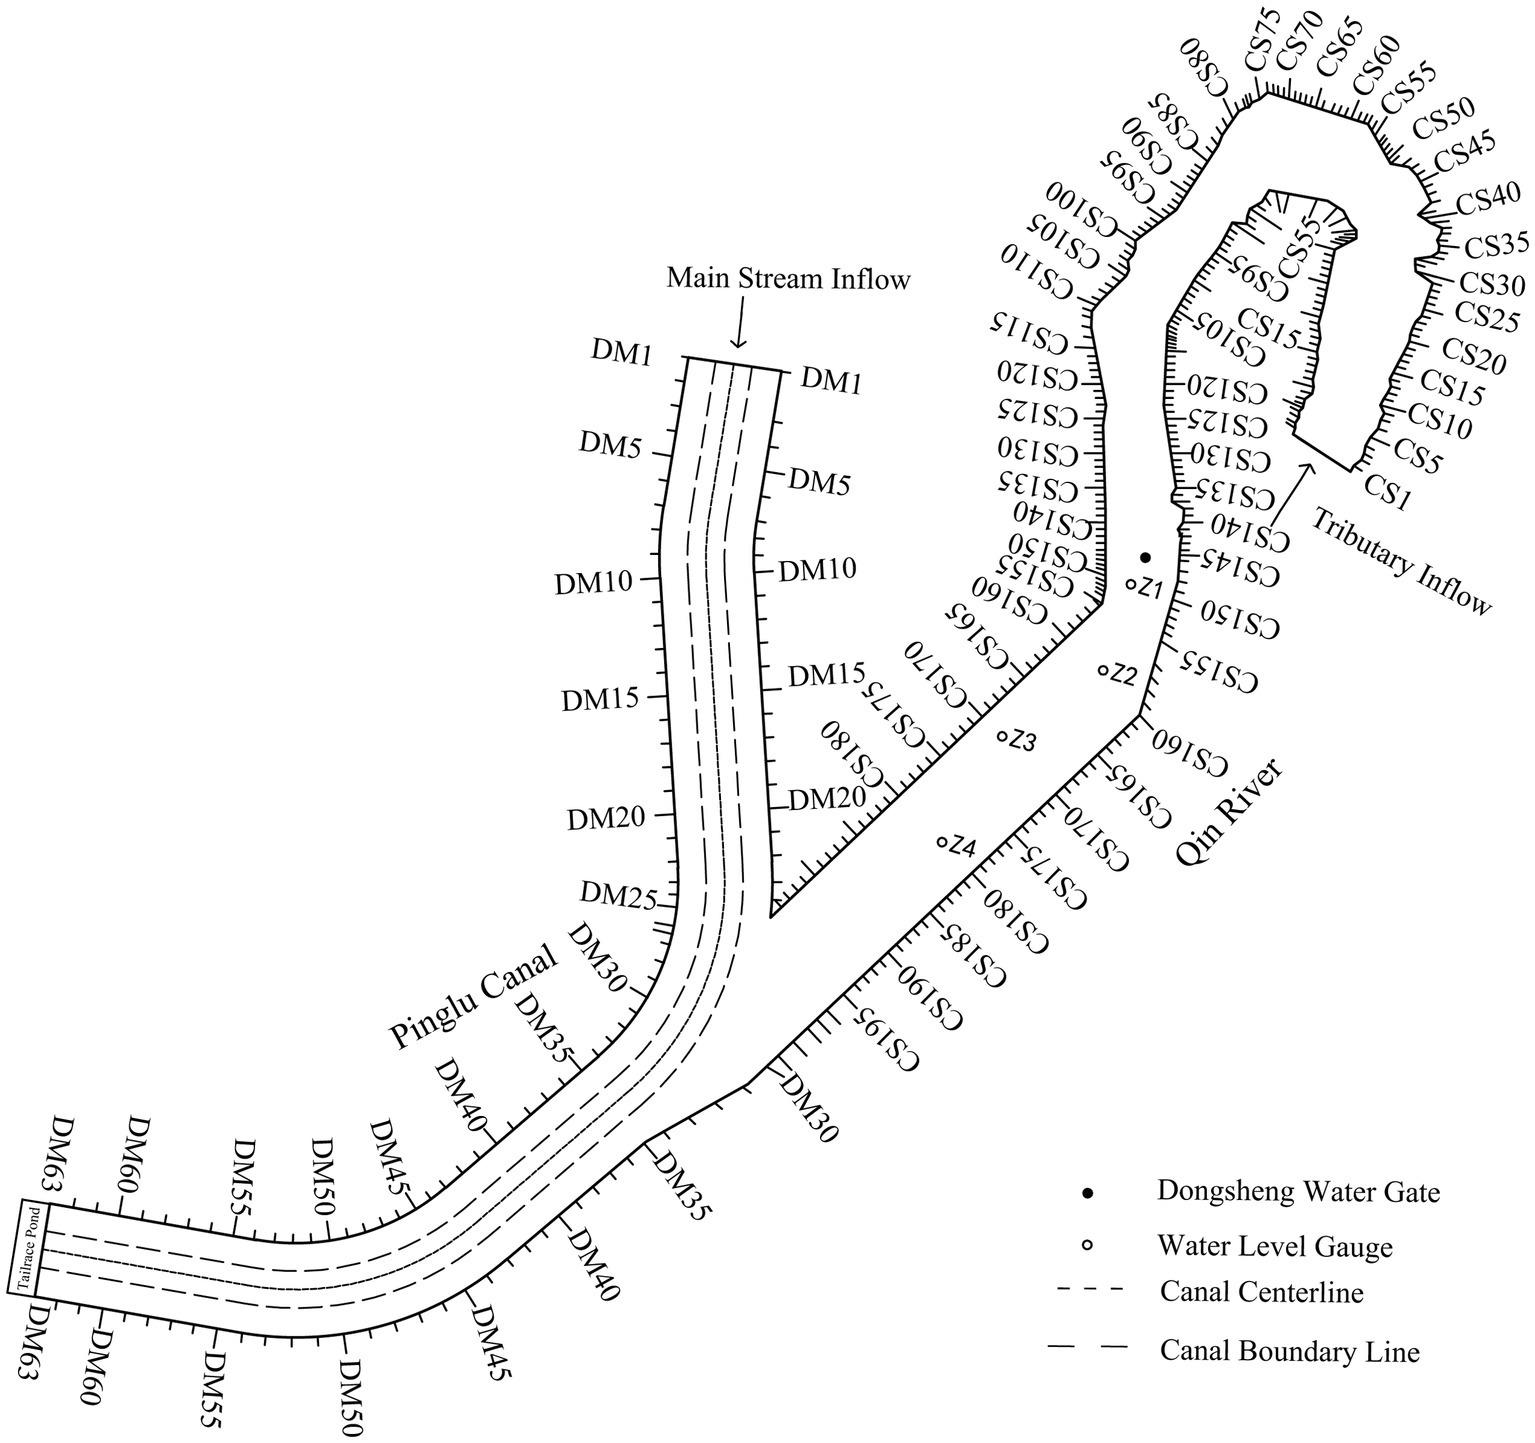
Figure 2. Layout of the Qinjiang River confluence model.
The traverse survey was conducted using a total station, with alignment verification performed via a theodolite and steel tape. The triangular closure error of the plane control network was maintained below ±5′′. Positional and elevation plotting errors for cross-sections were constrained to <0.5 mm. Installation tolerances were rigorously controlled, with horizontal deviations limited to ±1.0 cm and vertical deviations to ±0.5 mm. The flow control system comprises a reservoir, pump units, electric motors, electromagnetic flow meters, and computer-integrated control software, achieving a maximum discharge capacity of 300 L/s. Water levels were monitored using a precision gauge needle, with a measurement accuracy of 0.1 mm.
The model experiment was verified through water-level testing to ensure similar flow conditions. Four water gauges were deployed downstream of the Dongsheng Sluice Gate in the prototype Qinjiang River channel. Instantaneous water surface profiles were monitored using field-measured low-flow discharge data (62.0m3/s) recorded at the canal-river confluence in August 2022. Model validation experiments comparing prototype and model water surface profiles demonstrated strong agreement, with high consistency in longitudinal slope alignment. Verification results are summarized in Table 3. Quantitative comparison analysis showed that both water level deviations and flood stage discrepancies remained within ±0.05 m and did not exceed the ±0.10 m threshold, indicating strong similarity in resistance characteristics between the model and prototype. This alignment satisfies the similarity criteria for fixed-bed river engineering models. Consequently, the validated model demonstrates adequate fidelity to support subsequent investigations into hydrodynamic behavior assessments and engineered mitigation scheme evaluations.
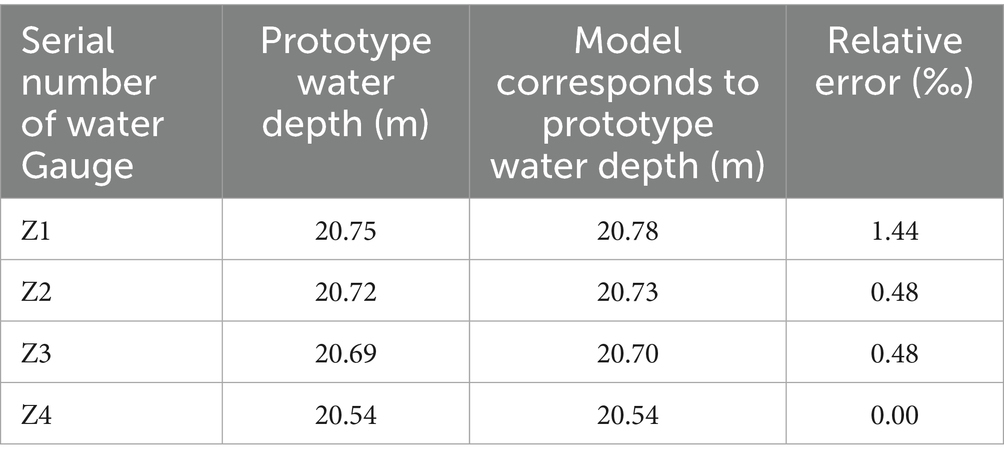
Table 3. Model water level verification results.
2.3 Flume model design
The sediment transport experimental model was designed in accordance with the gravity similarity criterion, utilizing an undistorted geometric scale of 1:100. The experimental model was constructed entirely with plexiglass materials exhibiting a roughness coefficient (n) ranging from 0.0068 to 0.0079. Through scale conversion, this corresponds to prototype roughness values between 0.01197 and 0.0139, which closely aligns with typical concrete roughness coefficients (0.012–0.014). The dimensional scaling of all structural components strictly adhered to geometric similarity principles, ensuring reliable hydraulic similarity between the model and prototype.
The configuration of this flume model mainly consists of the following hydraulic components: a collection tank, a flow-stabilizing screen, an inflow channel, a steep slideway, a stagnation pool, a stepped weir, a sedimentation tank, and a backwater system. The centrifugal pump transports water from an underground reservoir to a header tank. An upstream approach channel, equipped with a rectification section and flow straightening screens, is installed to ensure uniform inflow conditions. Water flows into a 10-meter-long flume designed to simulate natural river channels, subsequently passing through a steep chute into a hydraulic jump-type stilling basin for energy dissipation. The discharged flow is recirculated through the tailwater return system back to the underground reservoir, thereby completing a closed hydraulic circuit. All components of the physical model, including hydraulic structures and conveyance systems, were precision-fabricated from polymethyl methacrylate.
The experimental flume system measured 28 m in length, 0.56 m in width, and 0.7 m in height, comprising three vertically arranged components from base to apex. The basal section was equipped with height-adjustable bearing supports incorporating rotary gear mechanisms. The intermediate section contained the primary steel frame structure that simultaneously provided rigid support for the upper glass flume assembly and interfaced with the underlying bearing system to enable precise slope adjustment. The uppermost section consisted of a modular glass flume fabricated from transparent panels measuring 3.3 m × 0.552 m × 0.008 m (length × width × thickness), with these standardized glass modules constituting both the sidewalls and basal plane of the hydraulic conveyance structure. The flume inlet is equipped with a three-stage flow-conditioning grid for flow regime adjustment. The tailgate system comprises two configurations: a hinged type and a sluice gate type, enabling coarse and fine flow regulation, respectively. The installation error of the flume glass panels is maintained within ±0.2 mm, with a total flume length tolerance of ±0.5 mm and structural deformation limited to ±0.3 mm. Field photographs of the 28-meter flume are presented in Figure 3. The flume is equipped with dual water supply-return systems. The small pump delivers a flow rate range of 0–45 L/s, while the large pump provides 0–85 L/s, both featuring adjustable inlet valves for flow regulation.
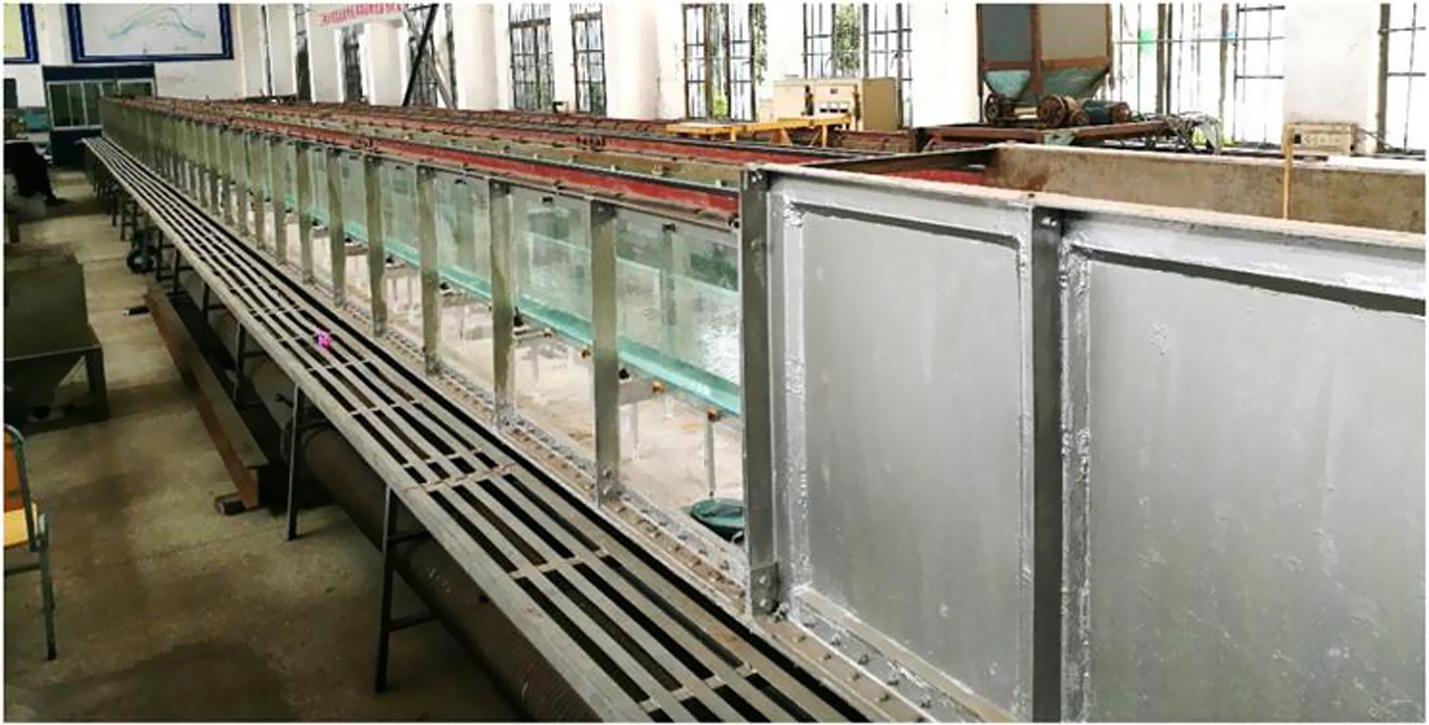
Figure 3. Field photograph of the flume exterior.
These systems can operate independently or concurrently. For this study, the small pump system was employed for water supply and return. The flume system employed an Emerson EV2000 series variable frequency drive (VFD) for flow regulation, with technical specifications including: frequency precision of ±0.01% at maximum frequency and frequency resolution of 0.01 Hz. Flow measurement was achieved using a Toshiba electromagnetic flowmeter demonstrating ±0.2% measurement accuracy across a velocity range of 0.3–10 m/s. This instrument was integrated into a closed-loop control system through continuous real-time data transmission to the water circulation control unit. All critical hardware components were interconnected through a centralized computerized automation framework, enabling synchronized system operation and precision-controlled experimental parameter modulation.
The hydraulic model test was supplied with water by a pump and its matched motor unit. The flow delivered by the pump exhibited significant fluctuations due to mechanical vibrations and bend-induced disturbances. After being pressurized by the booster pump, the water entered a rectangular head tank, where a flow-stabilizing screen was installed to mitigate flow oscillations. A rectangular sharp-crested weir was installed at the tank outlet, with its width matching that of the head tank. Given the intense turbulence within the stilling basin, sediment particles (d50 > 0.5 mm) significantly compromised sediment discharge efficiency, while smaller particles (d50 < 0.5 mm) exacerbated undesirable deposition patterns. To optimize sediment transport similarity and maintain measurable scour-deposition dynamics, the experiment ultimately adopted well-graded coarse sands (d50 = 1.2 ± 0.3 mm) that are representative of natural riverine conditions.
2.4 Improved measures
The Pinglu Canal Project increased the channel discharge capacity by widening and deepening the original Qinjiang River channel. However, the significant elevation difference of approximately 16.7 m between the Qinjiang River and the canal bed, combined with high inflow discharge during flood seasons, creates a substantial hydraulic gradient across the interbasin trunk and tributary systems. This pronounced gradient poses navigational constraints on canal operations. The 1:50 scale river engineering model experiment incorporates graded slope adjustments on the tributary to address the pronounced elevation difference between the main canal and tributary beds. The experimental protocol employs phased deployment of stilling basins integrated with auxiliary energy-dissipating devices, serving to counteract both the kinetic energy of tributary inflows and hydrodynamic disturbances at the main canal confluence interface. The systematic implementation of these hydraulic interventions optimizes the hydrodynamic conditions governing navigation, resulting in significant enhancement of the canal’s navigability.
2.4.1 Measure I: layout of 6% ramps
Based on the model design, the tributary reach is graded from cross-section CS162 (riverbed elevation 18.0 m) at a 6% slope ratio down to CS176 (riverbed elevation 1.7 m). Downstream of CS176, the riverbed elevation maintains a constant level of 1.7 m, with both banks sloped at a 1:2 ratio. The channel incorporates two to three intermediate berms, as shown in Figure 4.
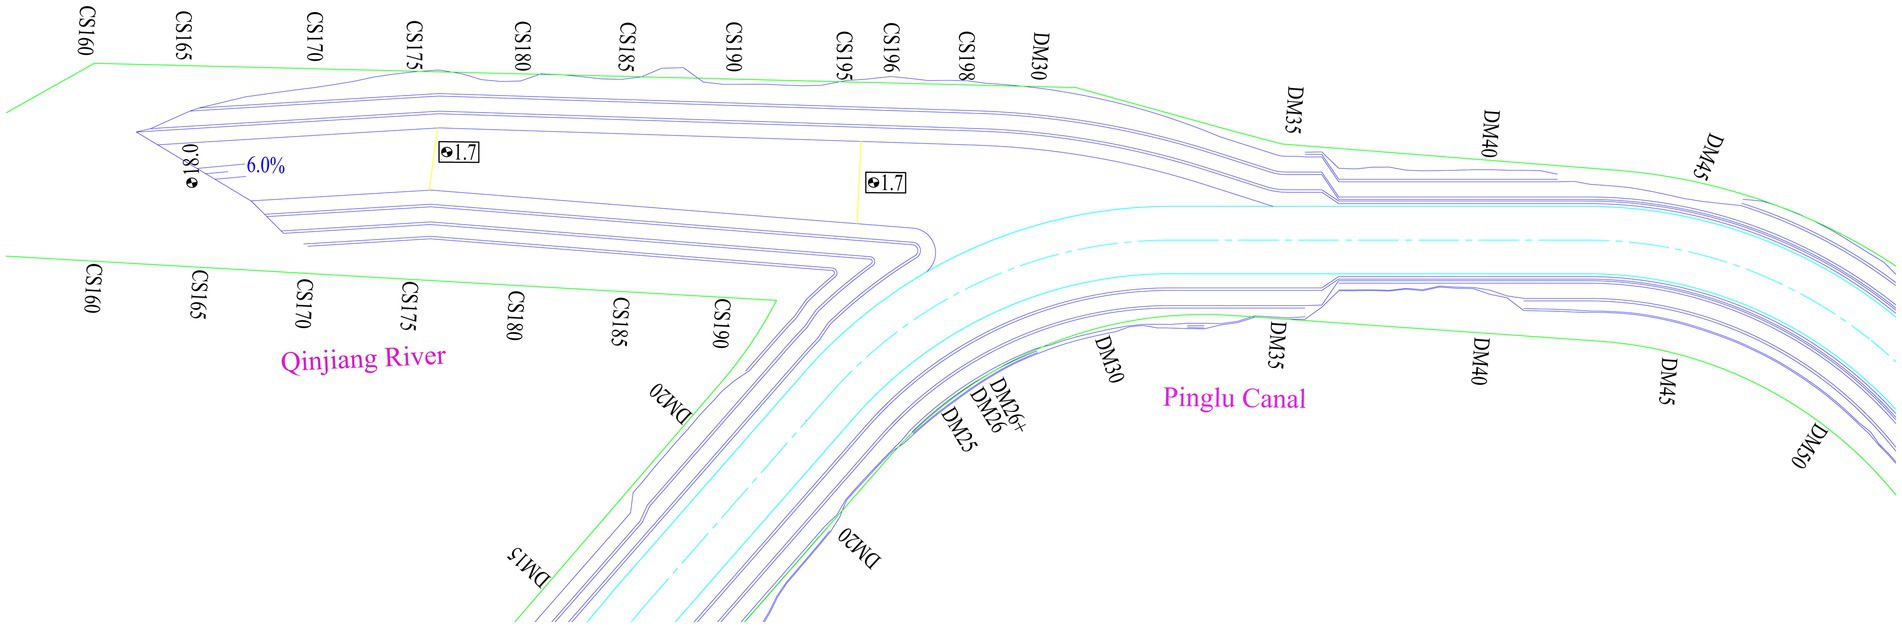
Figure 4. Measure I model test layout.
2.4.2 Measure II: three-stage stilling basin
Based on Measure I, the area at the bottom of the slope between cross-sections CS162 and CS176 was renovated and reconfigured into a stepped stilling basin, while the original bank slopes on both sides were retained. The longitudinal profile of the stilling basin is depicted in Figure 5.
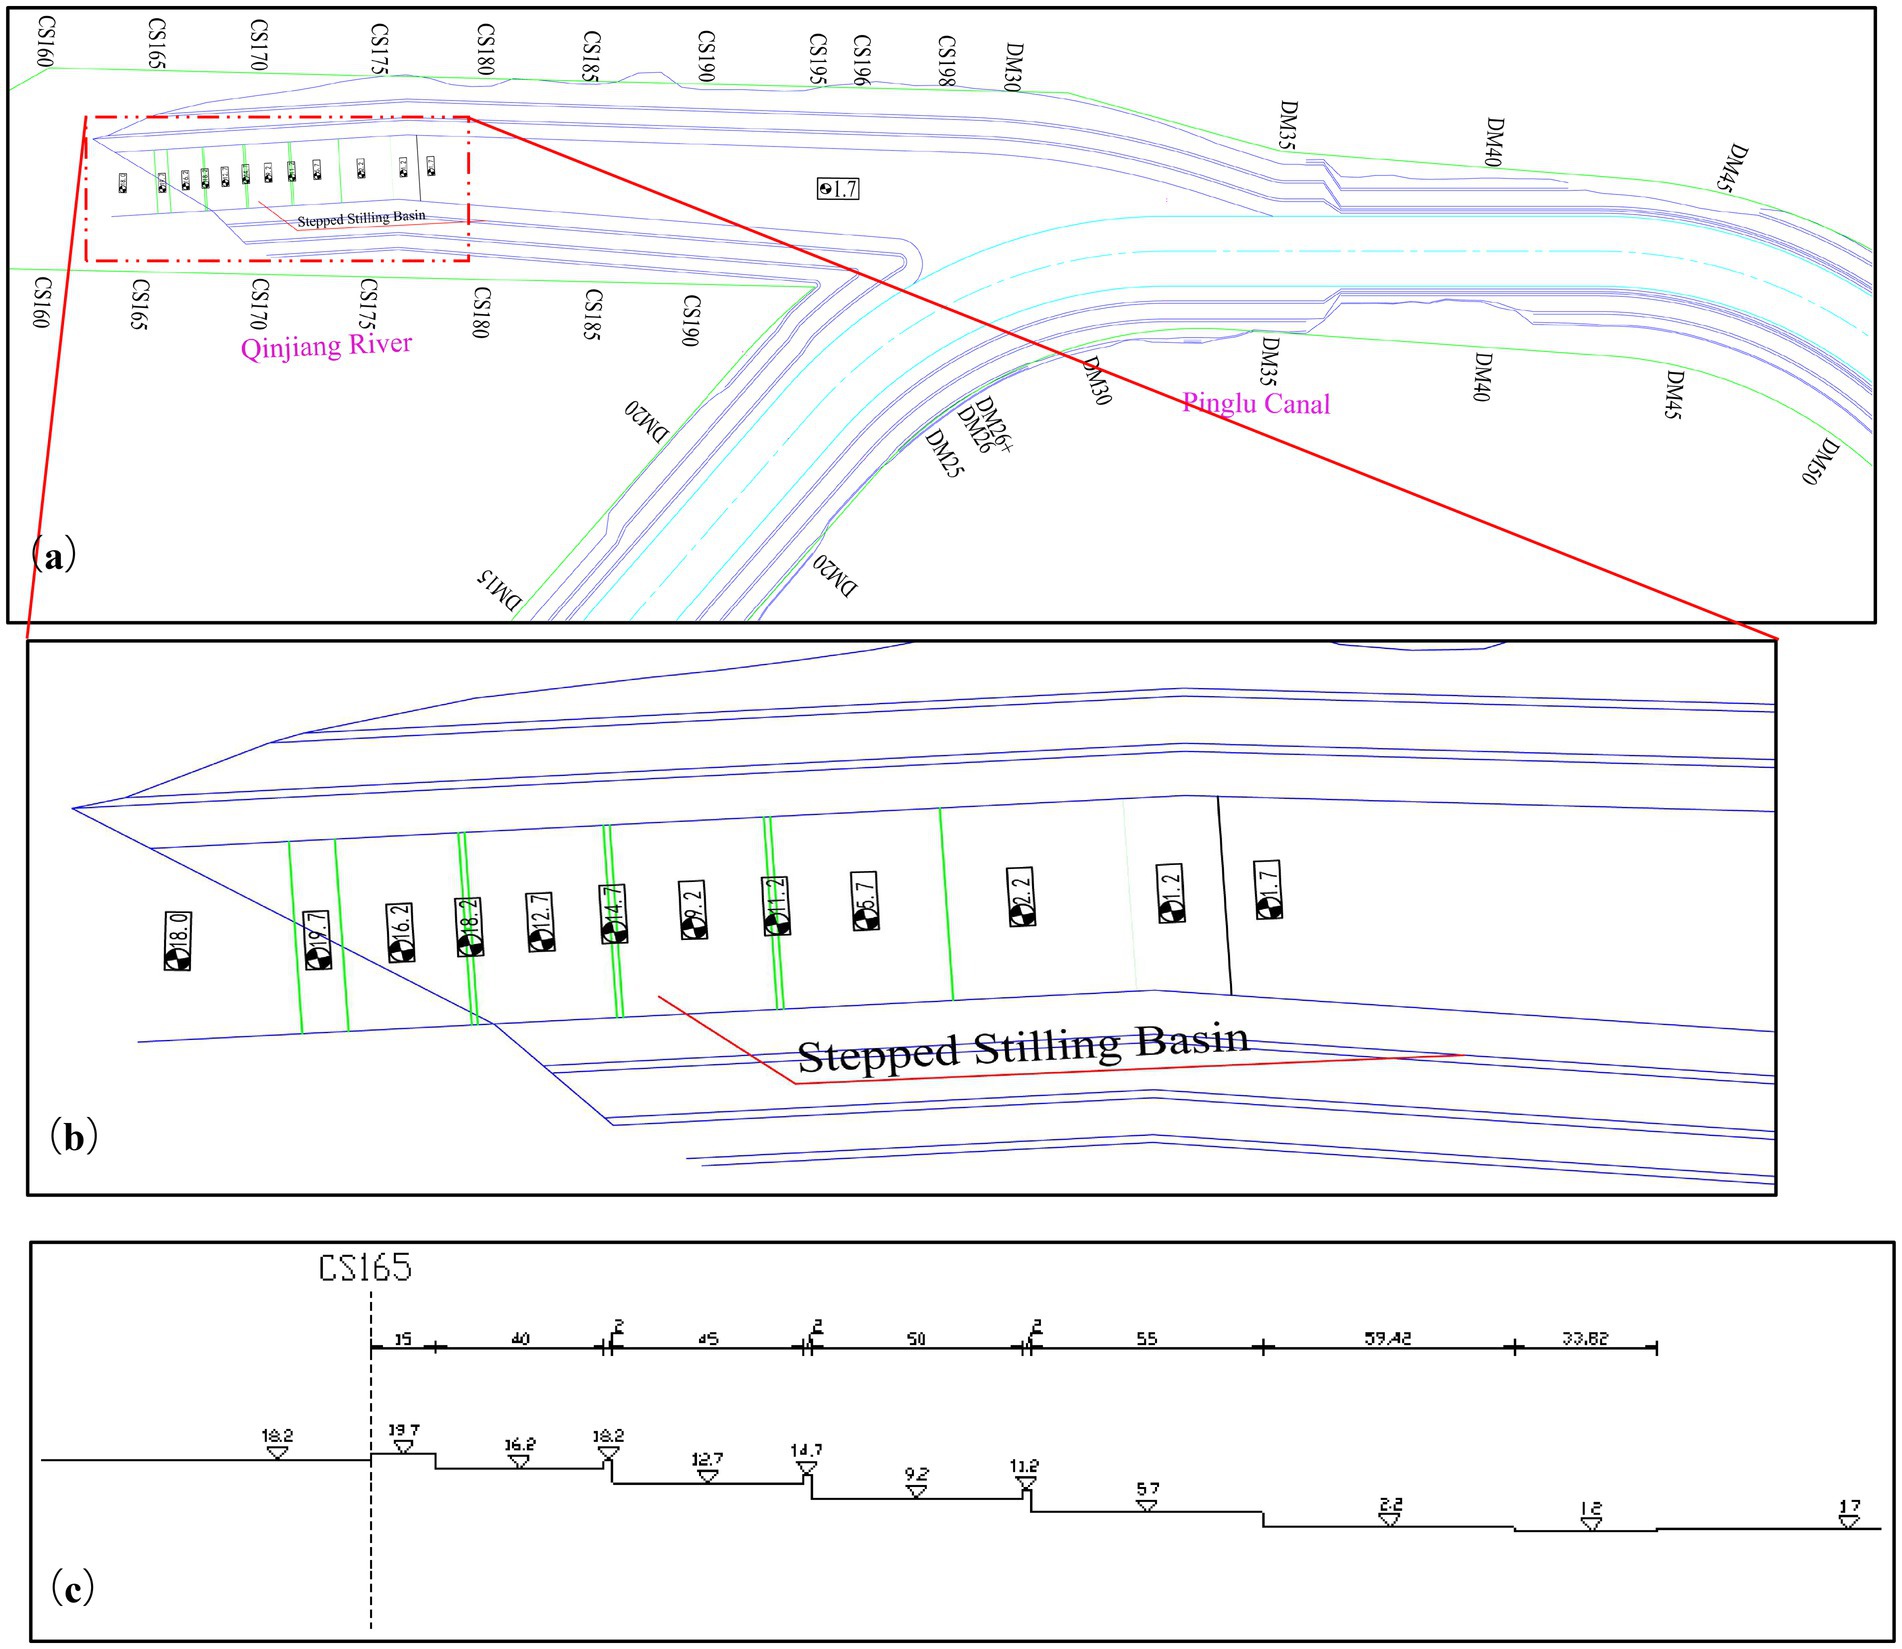
Figure 5. Layout of model experiment for measure II, (a) plan view, (b) enlarged view, (c) Longitudinal section of three-stage stilling basin.
The stilling basin extends from cross-section CS165 to CS179, featuring a width of 73.35 m and a total length of 280.86 m. At cross-section CS167, a first-level step is located 15 m downstream, with an elevation of 19.7 m and a length of 40 m, culminating in a bottom elevation of 16.2 m. The second-level step, extending 2 m in length, has an elevation of 18.2 m, followed by a second stilling basin measuring 45 m in length, with a bottom elevation of 12.7 m. The third-level step, also 2 m long, has an elevation of 14.7 m, while the corresponding third stilling basin is 50 m long with a bottom elevation of 9.2 m. The fourth-level step, again measuring 2 m in length, has an elevation of 11.2 m, followed downstream by a platform that is 55 m long with a bottom elevation of 5.7 m. Downstream of this platform is a secondary step platform measuring 59.5 m in length with a bottom elevation of 2.2 m. Further downstream, a desilting basin spans 33.82 m in length with a bottom elevation of 1.2 m, connecting to the canal bottom, which has an elevation of 1.7 m.
2.4.3 Measure III: 1.5% gradient slope + two-stage stilling basin + two-stage energy dissipation steps + desilting basin
To optimize the design of the aforementioned stepped stilling basin model (referred to as Measure II), adjustments were made to the first-stage step and first-stage stilling basin within the model: they were reconfigured into a gentle slope design (Saleh and Khassaf, 2024; Peterka, 1964). Specifically, cross-section CS165 was graded downward to an elevation of 17.2 m at a slope of 1.5% toward the downstream direction, while the remaining steps and stilling basins were kept unchanged, as illustrated in Figure 6.
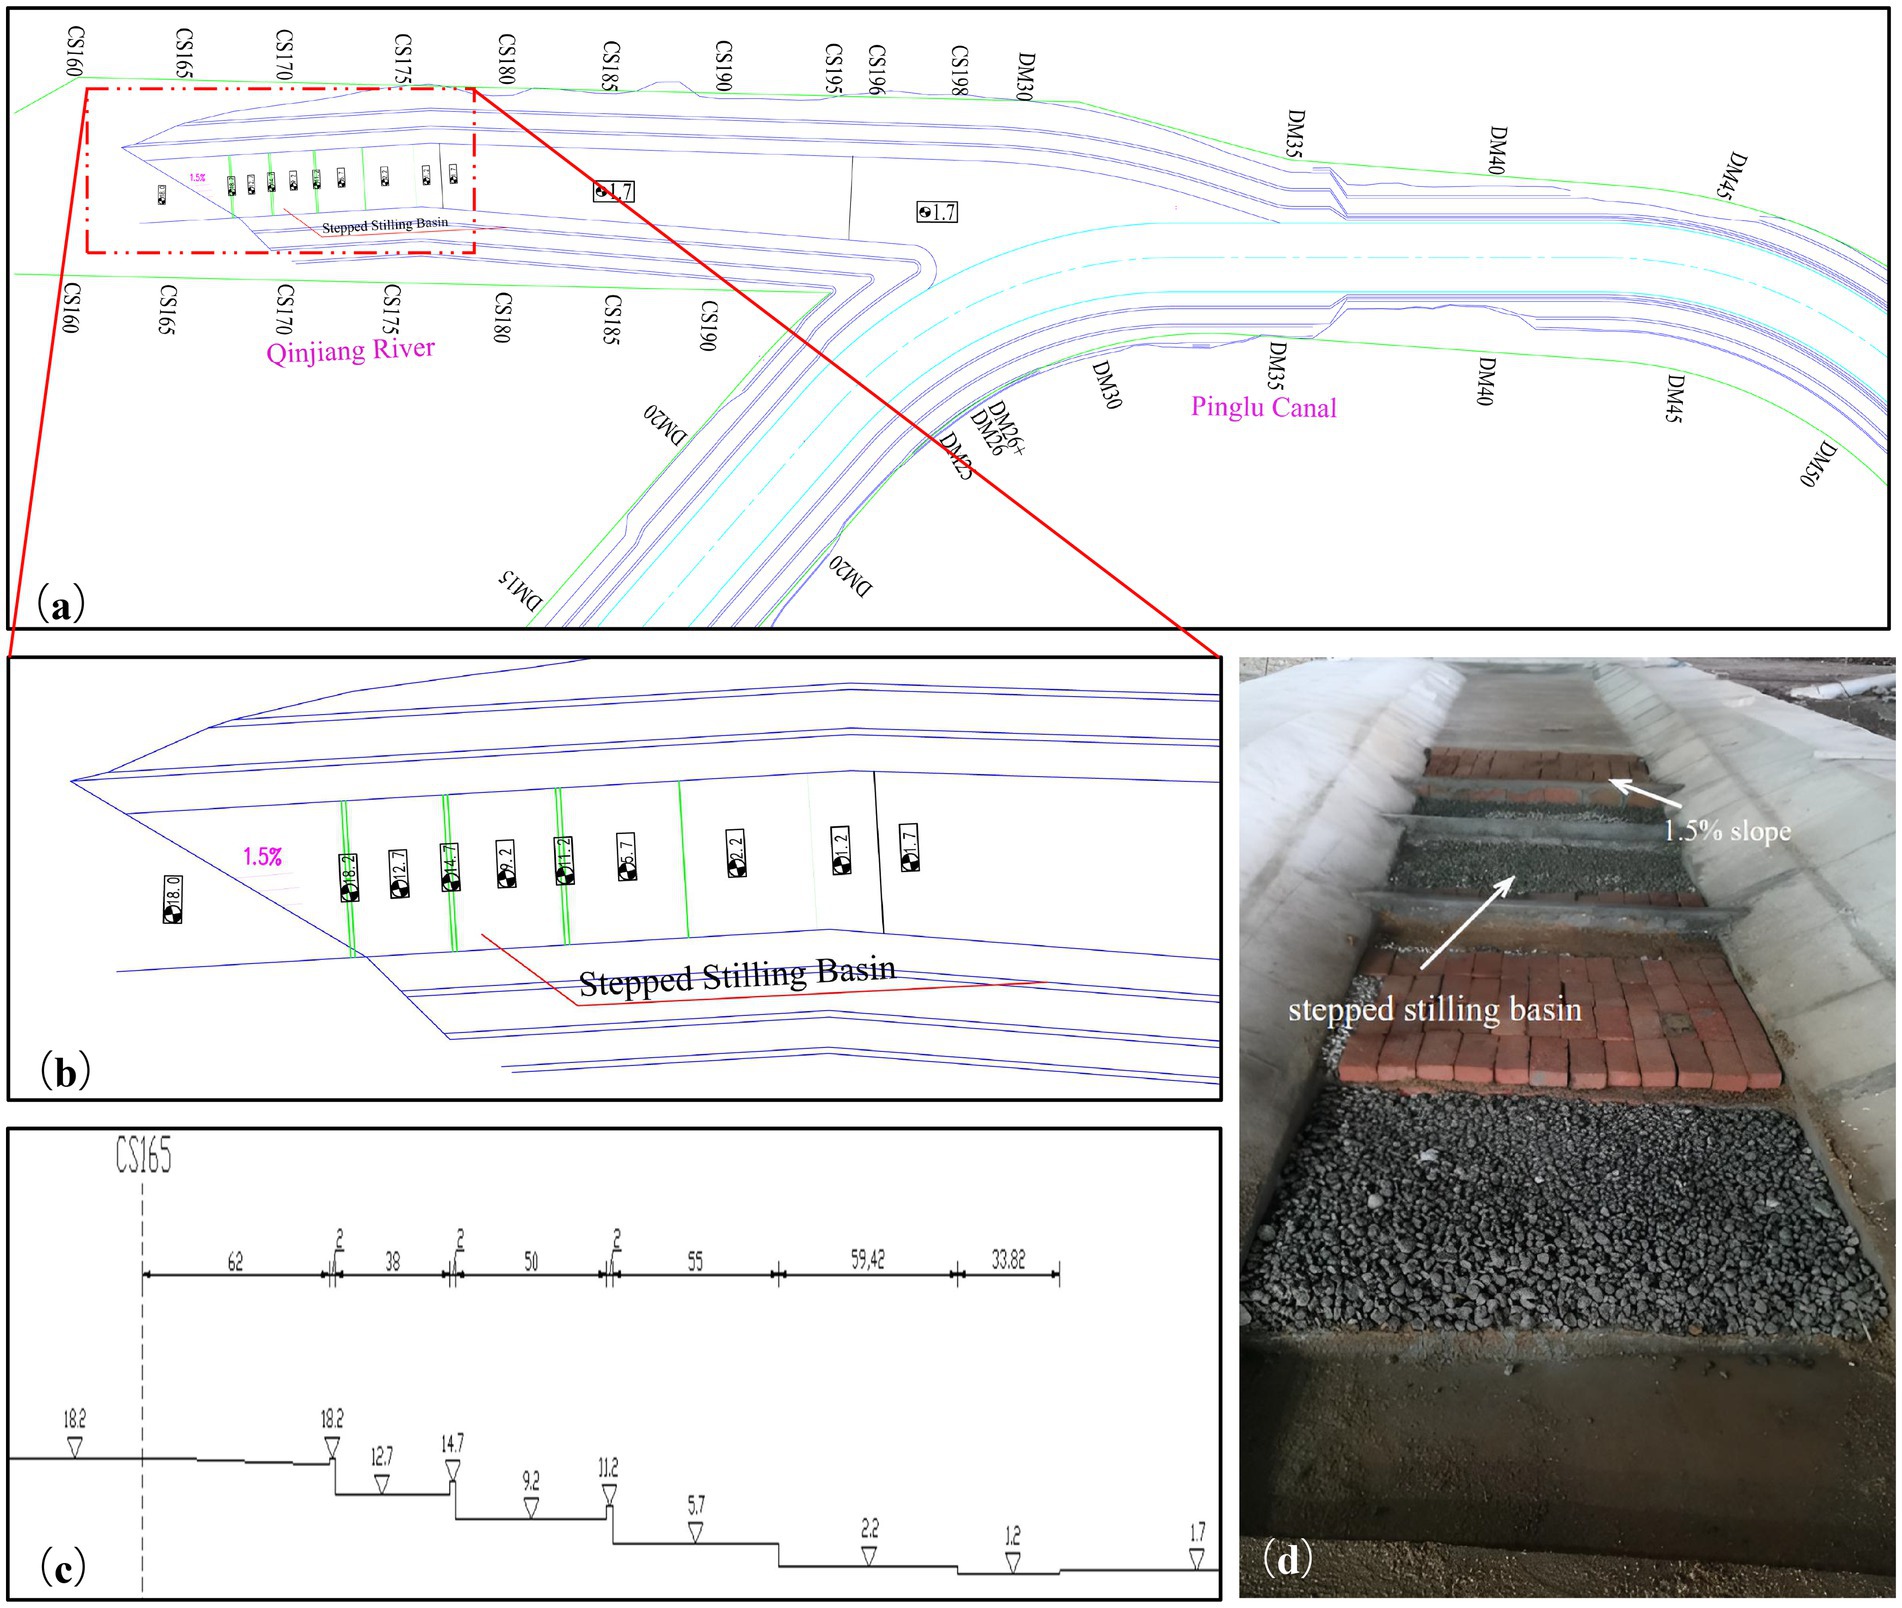
Figure 6. Layout of model experiment for measure III, (a) plan view, (b) enlarged view, (c) longitudinal section of two-stage stilling basin + two-stage energy-dissipation steps +desilting basin, (d) site layout plan.
2.4.4 Measure IV: 1.5% slope + two-stage stilling basin + two-stage steps +desilting basin + 10 rows of dentoid baffle pier
Building upon the baseline design comprising a 1.5% slope gradient and stepped stilling basin, ten rows of dentoid baffle pier (five units per row) are installed consecutively across cross-sections CS181 to CS186 to optimize hydraulic energy dissipation and flow alignment, as illustrated in Figure 7.
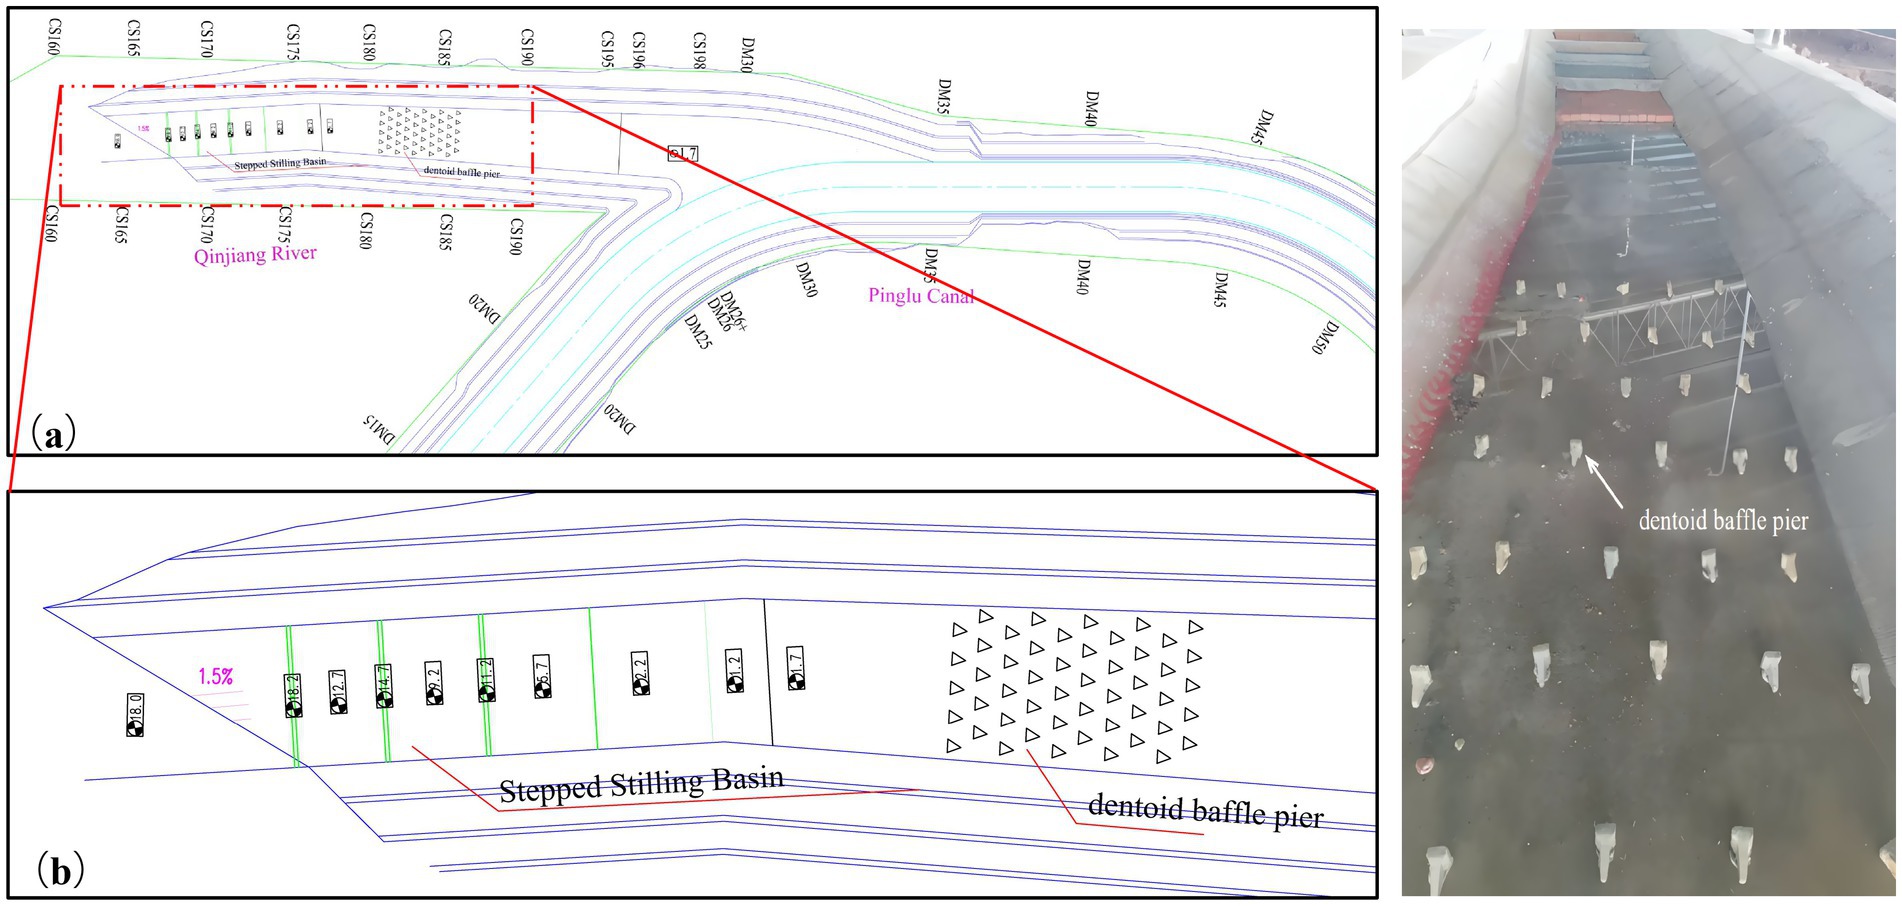
Figure 7. Layout of model test for measure IV, (a) plan view, (b) enlarged detail, (c) site layout plan.
3 Results
3.1 Flow velocity characteristics
After implementing a gentle slope (Measure I) in the confluence section of the Qinjiang River, the experimental results revealed a significant reduction in flow velocity. As shown in Figure 8, under Experimental Condition 1 (mainstream flow rate of 1,112 m3/s, tributary stream flow rate of 1,380 m3/s), the velocity in the navigation channel from cross-section DM27 to DM35 in the confluence zone was analyzed. The maximum water velocity was 1.67 m/s at cross-section DM35, and the minimum was 0.56 m/s at cross-section DM27. The resultant flow velocities in the confluence reach were observed to remain below 2 m/s. The centerline of the navigation channel at the mainstream-tributary confluence zone showed a sharp angular alignment relative to the direction of tributary inflow in the physical model. Moreover, complex hydrodynamic conditions were not observed within the navigation channel under the tested flow regimes.
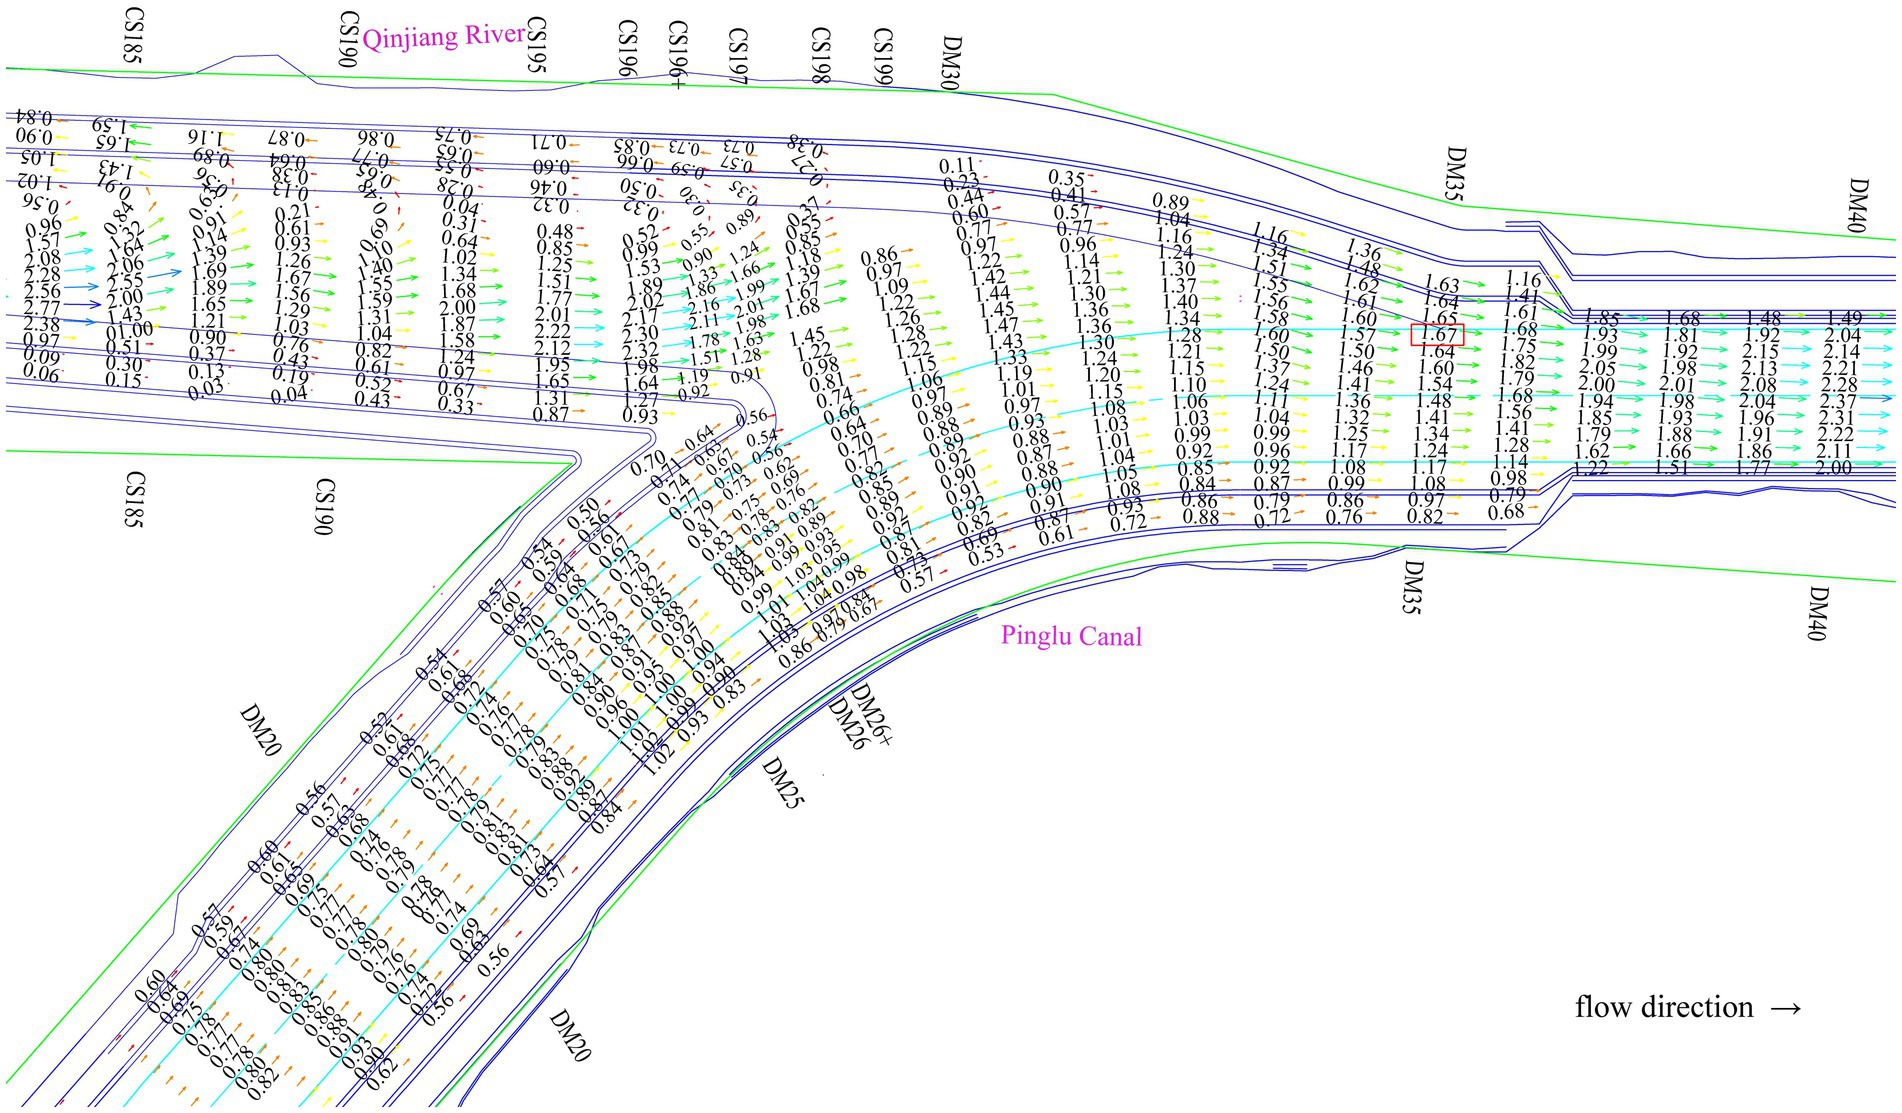
Figure 8. Distribution of resultant velocity at the confluence section for experimental condition 1 of measure I (m/s).
Following the arrangement of stilling basins and the energy dissipation treatment of the tributary (Measure II), experimental results indicated that under Experimental Condition 1 (mainstream flow rate of 1,112 m3/s and tributary flow rate of 1,380 m3/s), the resultant velocity in the navigation channel had significantly improved. The flow velocities within the navigation channel of the confluence area all remained below 2 m/s. Furthermore, the intersection angle between the channel centerline in the main-tributary confluence zone and the tributary inflow direction was relatively small. No complex flow patterns were observed in the channel, as illustrated in Figure 9a. For Experimental Condition 2 (mainstream flow rate of 1,112 m3/s, tributary flow rate of 2029 m3/s), the resultant velocity in the navigation channel at the confluence zone exhibited a significant increase. This increase reached a peak of 2.04 m/s at the centerline of the DM35 cross-section due to the enhanced tributary inflow. Furthermore, the angle between the centerline of the navigation channel in the confluence area and the direction of the tributary inflow remained relatively large, resulting in a complex flow pattern within the navigation channel, as shown in Figure 9b.
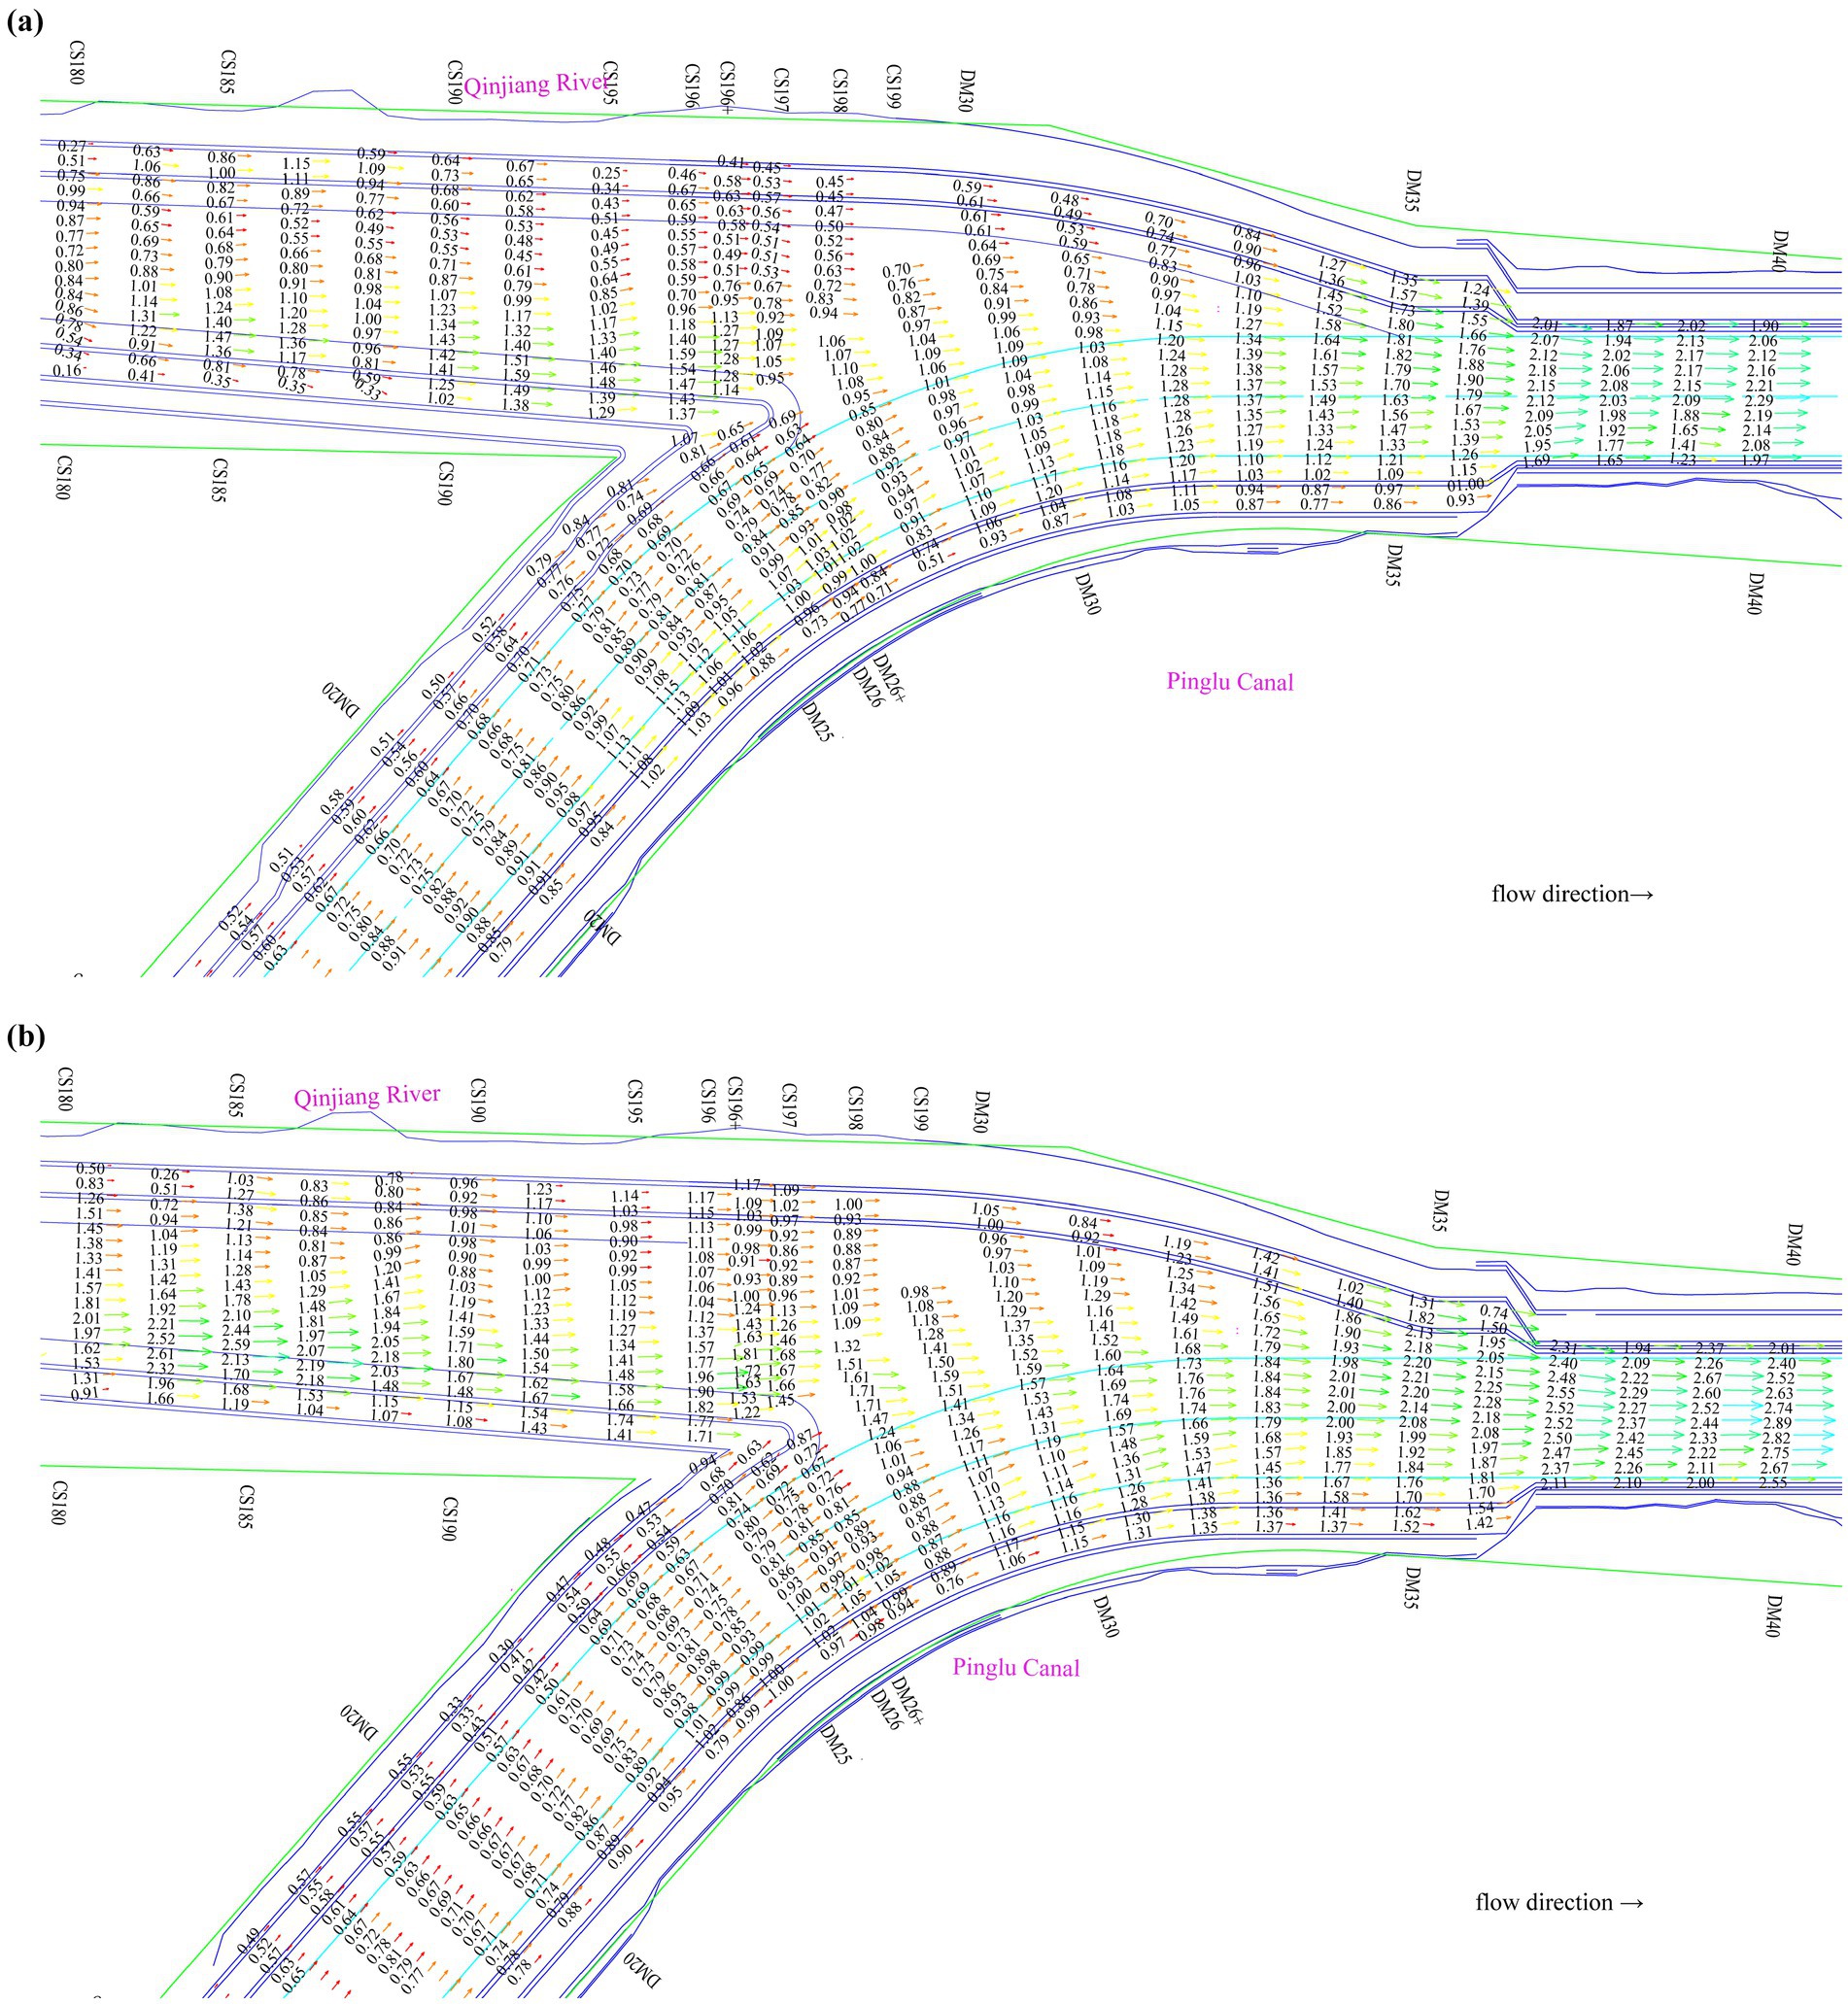
Figure 9. Distribution of resultant velocity at the confluence section for measure II, (a) experimental condition 1 (b) experimental condition 2 (m/s).
After modifying the first tier of the stilling basin to a gentle slope with a gradient of 1.5% (Measure III), the flow conditions were improved under Experimental Condition 1. The maximum combined velocity in the confluence area of the navigation channel reached 1.56 m/s, while the overall flow velocity maintained compliance with the 2 m/s regulatory threshold. The angle between the centerline of the navigation channel in the confluence area and the inflow direction from the tributary was relatively small, which resulted in the absence of complex flow patterns within the navigation channel, as illustrated in Figure 10a. Under Experimental Condition 2, the resultant velocity in the confluence zone’s channel was slightly higher. The maximum value of 2.04 m/s occurred at the centerline of section DM35. However, the angle between the navigation channel centerline and the direction of the inflow from the tributary was relatively small, as shown in Figure 10b.
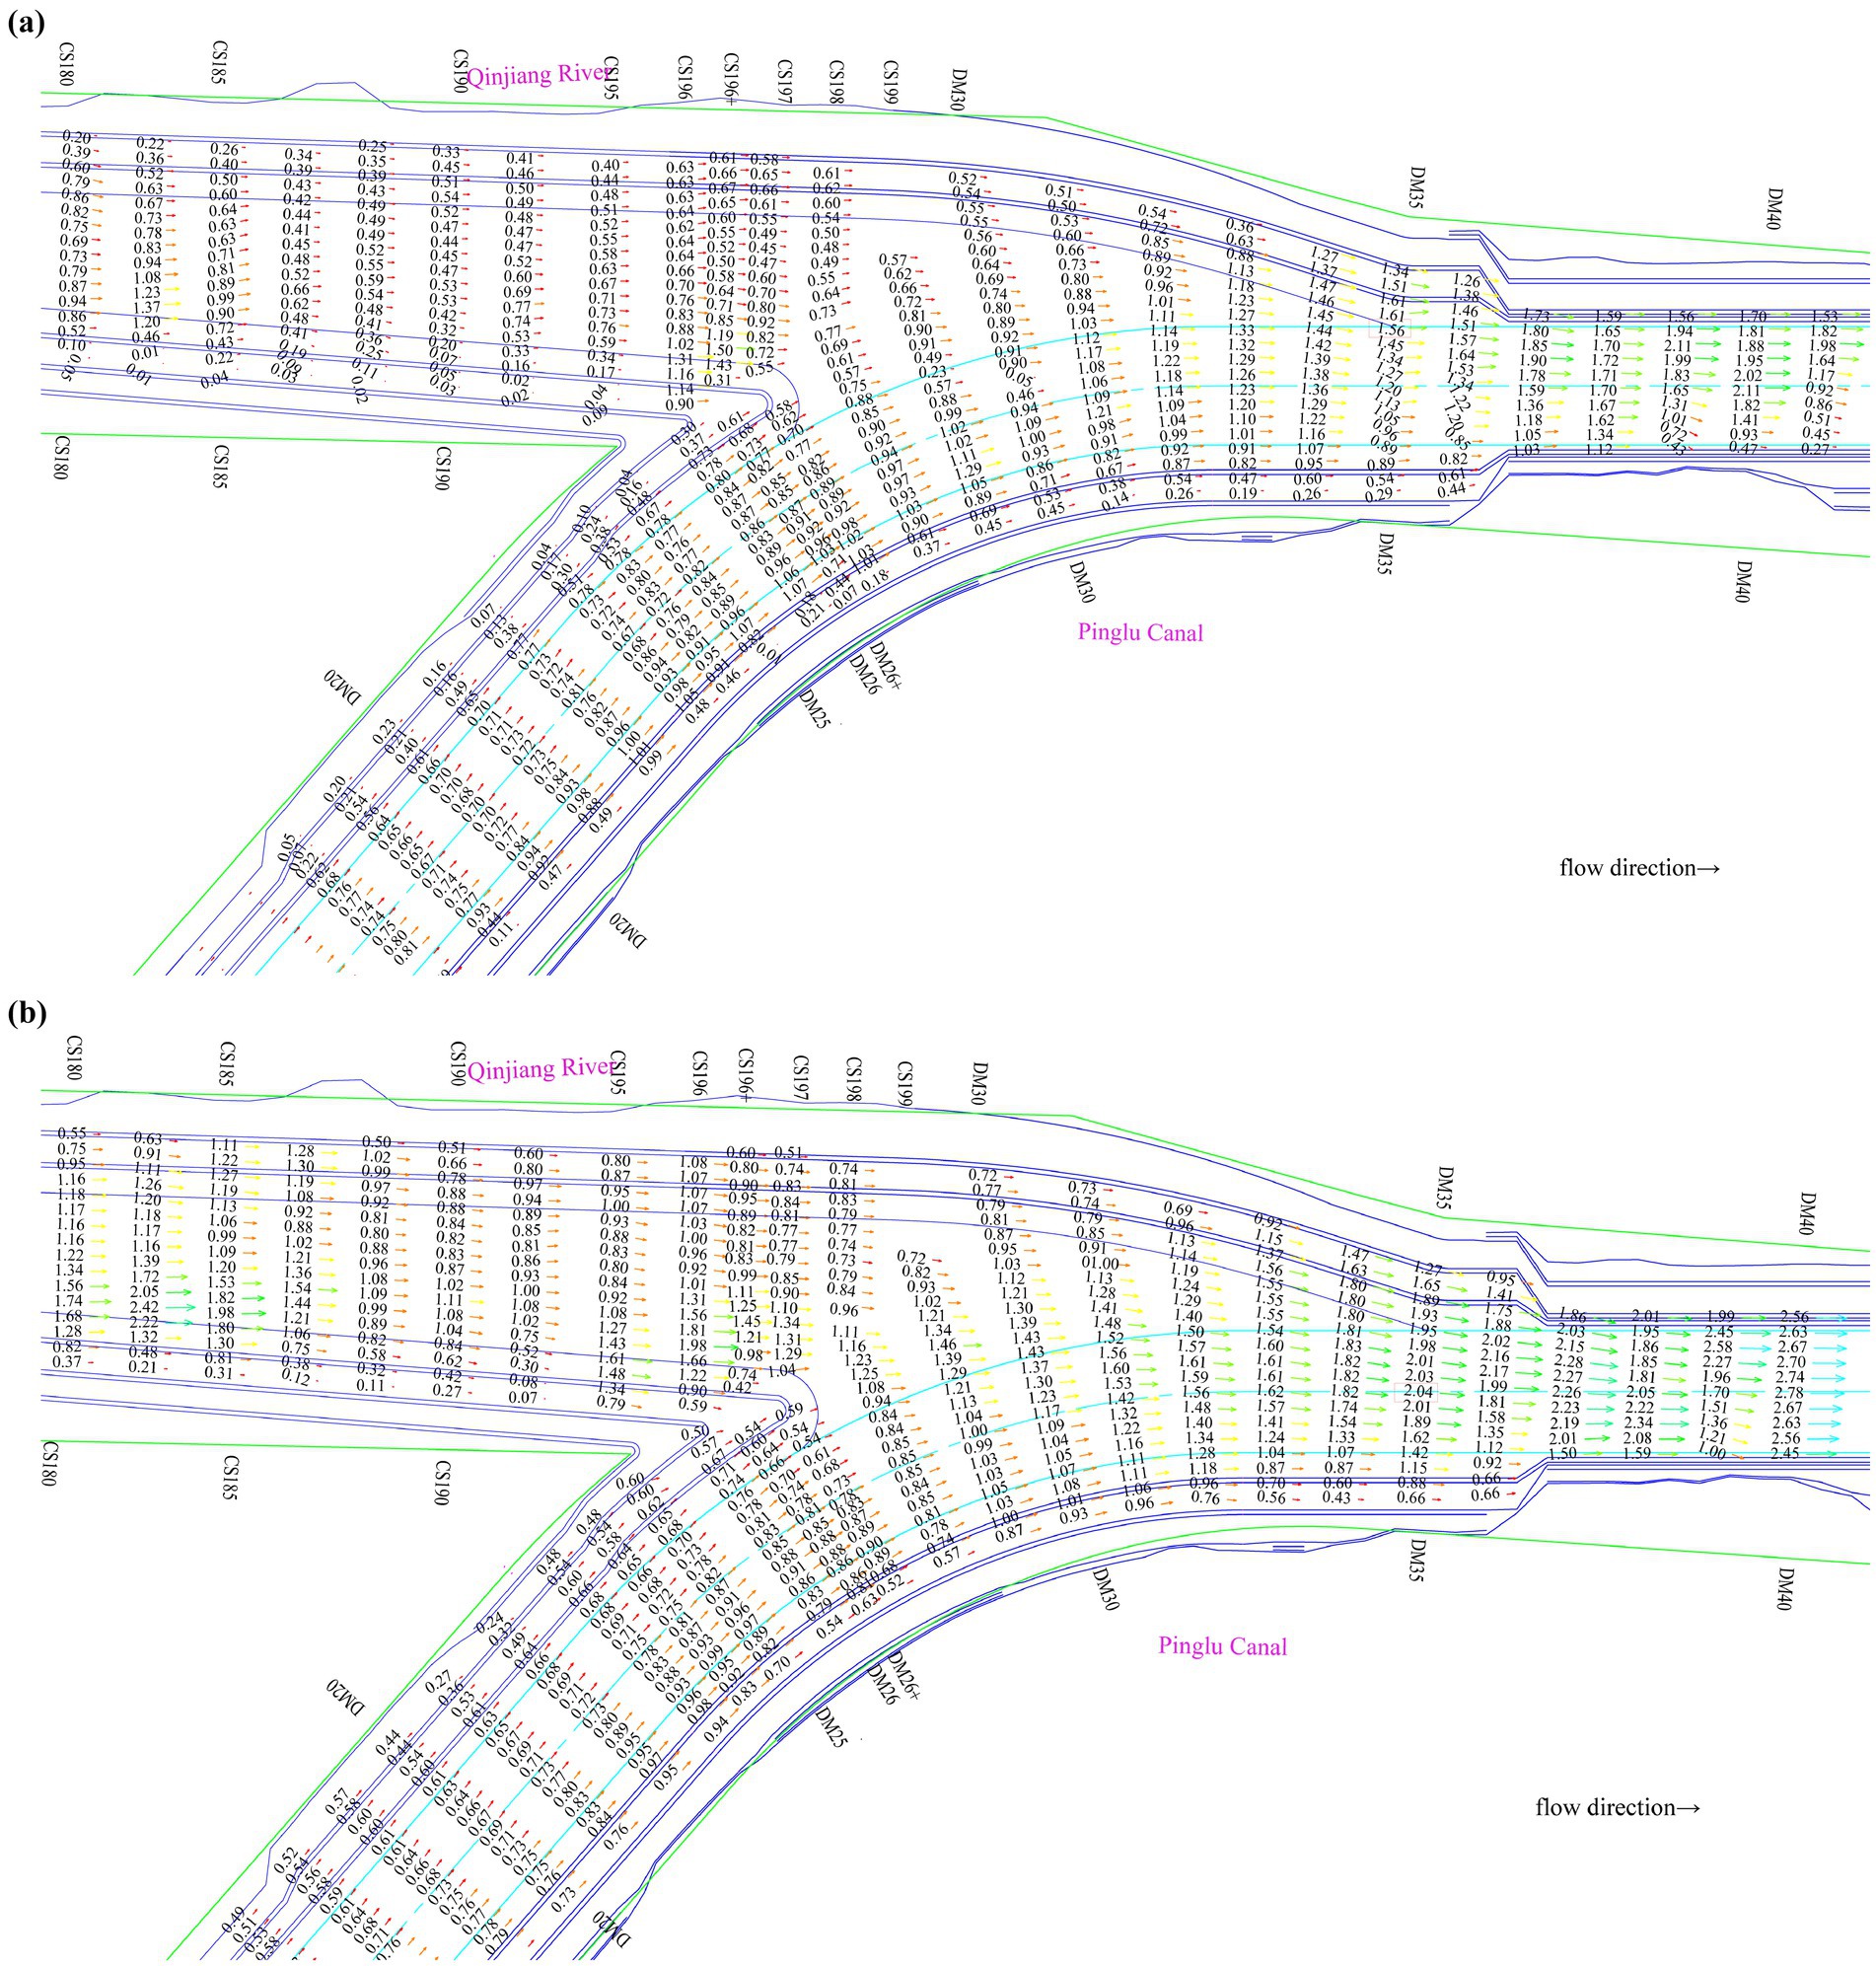
Figure 10. Distribution of resultant velocity at the confluence section for measure III, (a) experimental condition 1 (b) experimental condition 2 (m/s).
The measured data indicated a slight increase in the resultant velocity within the confluence zone of the navigation channel after adding the energy-dissipation pool piers (Measure IV). The maximum resultant velocity was 2.15 m/s, recorded near the left boundary of the navigation channel at cross-section DM35. However, the angle between the centerline of the navigation channel at the main and tributary-stream confluence and the flow direction of the tributary was small. Besides, there were no complicated flow patterns in the channel, as shown in Figure 11.
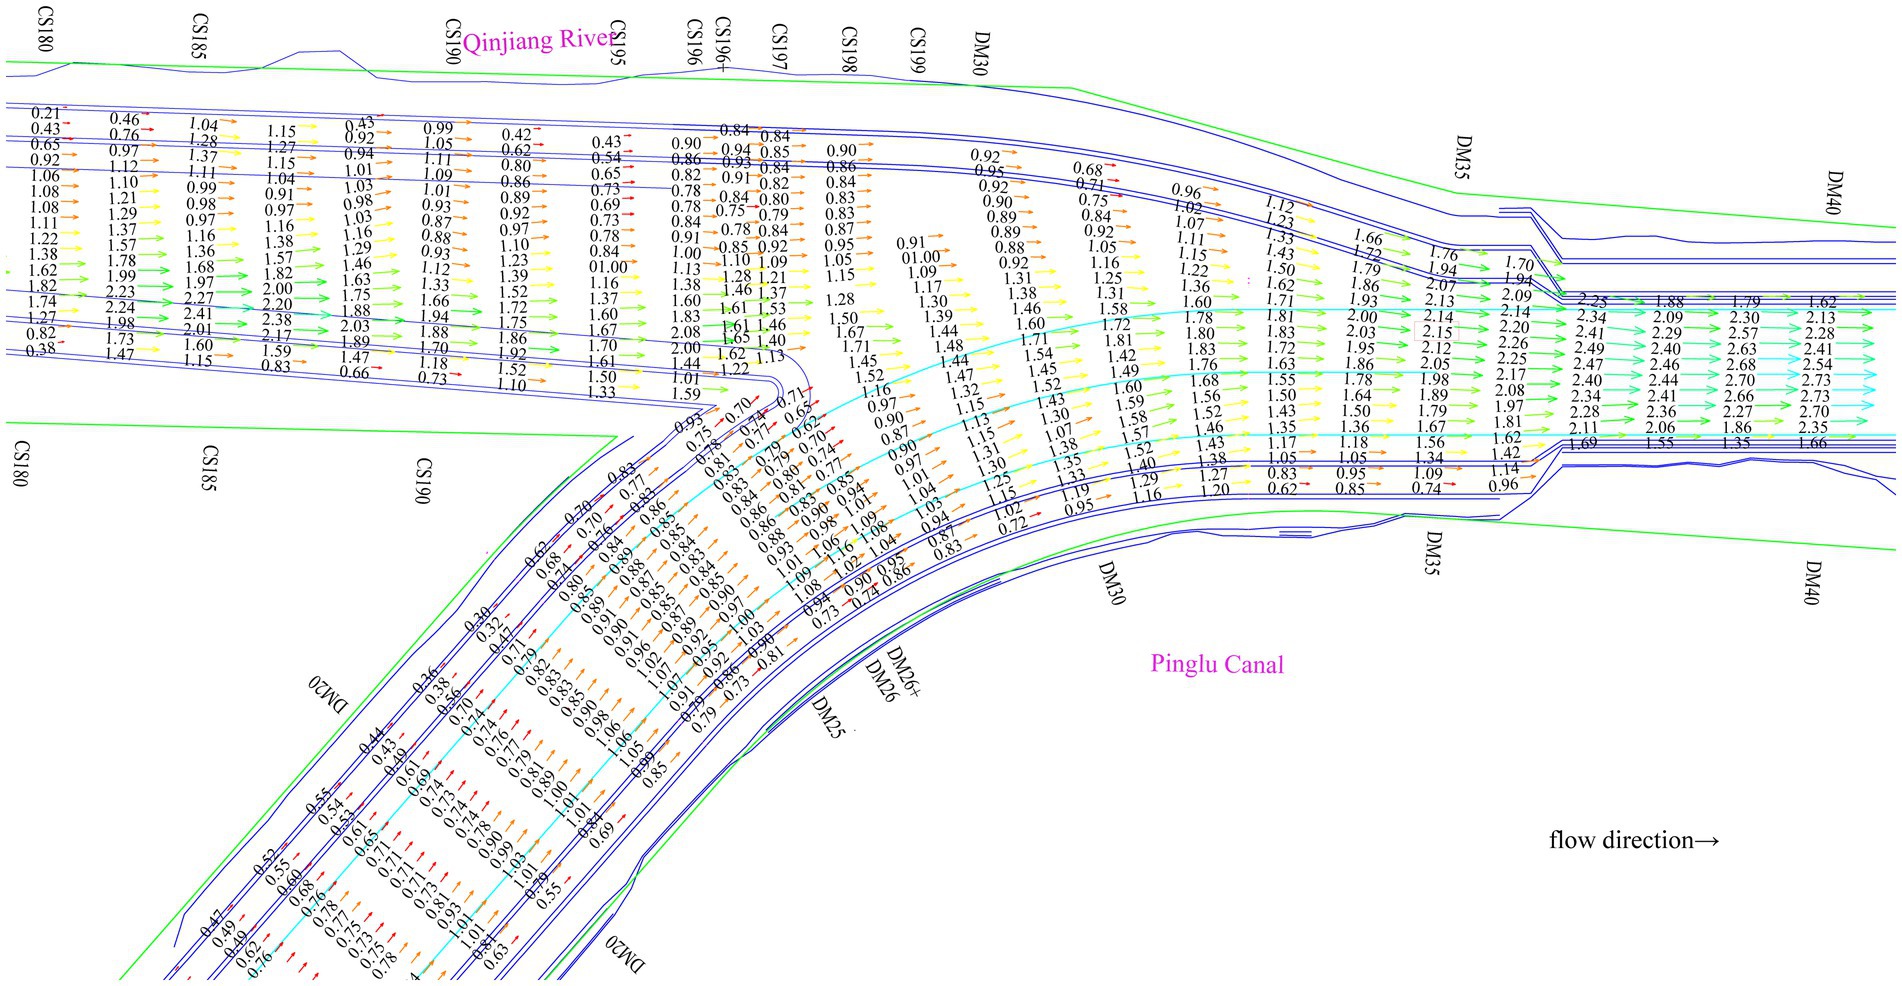
Figure 11. Distribution of resultant velocity at the confluence section for experimental condition 2 of measure IV (m/s).
3.2 Lateral velocity distribution
Regarding the lateral velocity distribution in the river reach at the confluence, the physical river model test results showed that when the main stream discharge is Q = 1,112 m3/s and the tributary discharge is Q = 1,380 m3/s, there were areas exceeding the standard value within the navigation channel under the layout of Measure I. Among these areas, the maximum lateral velocity was 0.4 m/s, which occurred on the left side of the navigation channel in the cross-section DM32-DM33 and presented a semi-elliptical distribution. The lateral scale of this semi-elliptical area was approximately 24.99 m, and the longitudinal scale was approximately 48 m, as illustrated in Figure 12. Under Measure II, the stilling basin effectively dissipated the energy of tributary inflow into the canal, resulting in a significant reduction of lateral flow velocities within the confluence zone navigation channel. The measured values demonstrated complete compliance with regulatory thresholds, with the maximum velocity of 0.24 m/s recorded at the left boundary of the DM32 cross-section in the navigation channel, as visualized in Figure 13a. For Measure III under these Experimental Conditions 1, the measurement results showed that the maximum transverse flow velocity reached 0.27 m/s, occurring to the left of the navigation channel centerline at cross-section DM36. This velocity complied with the navigation requirements, as illustrated in Figure 14a.
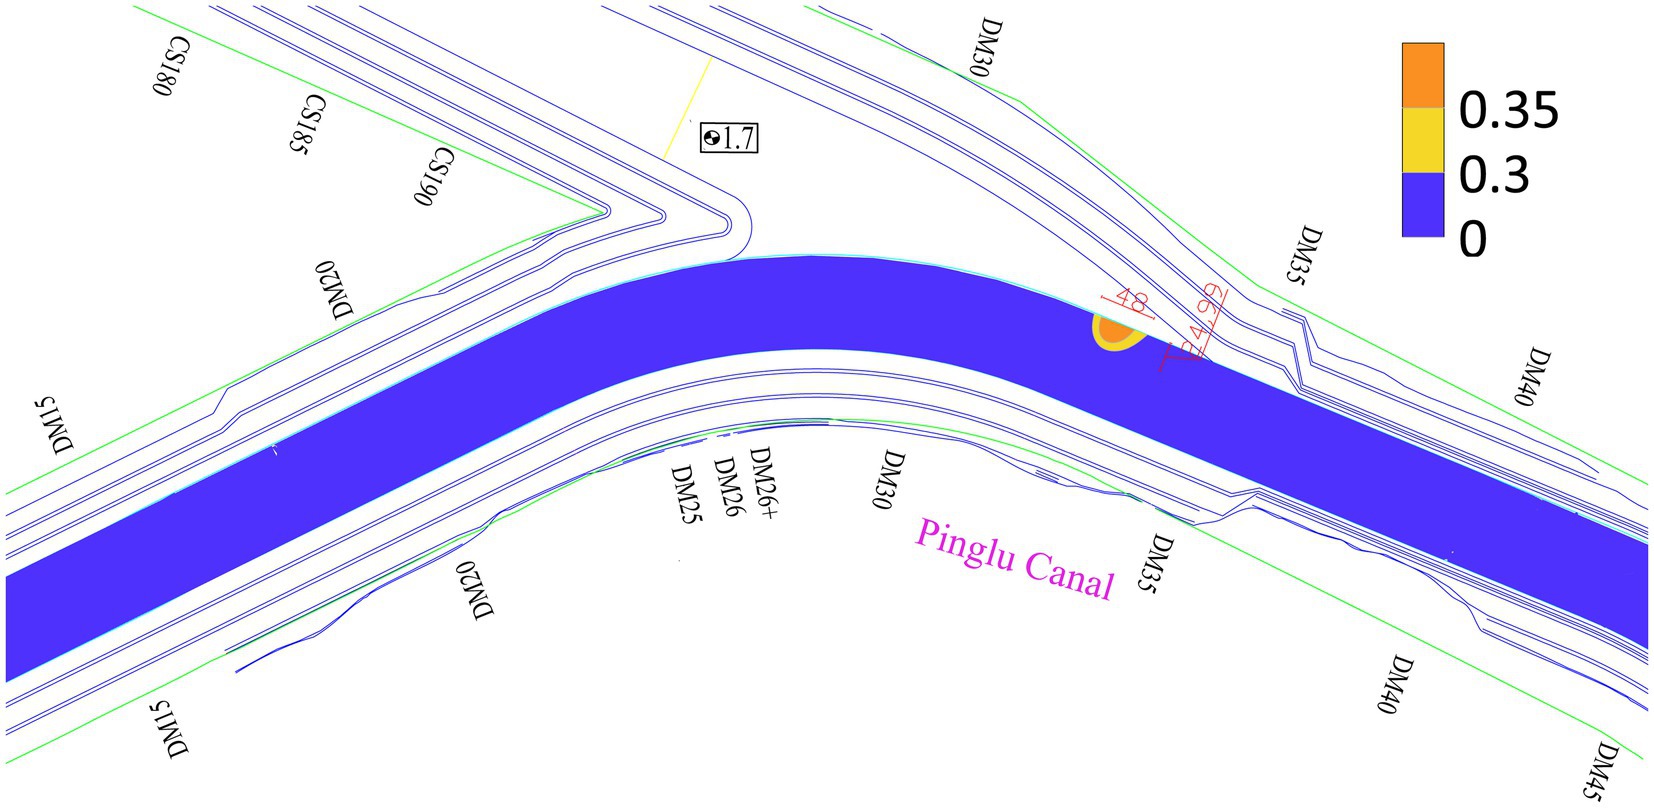
Figure 12. Ateral velocity distribution for experimental condition 1 of measure I (m/s).
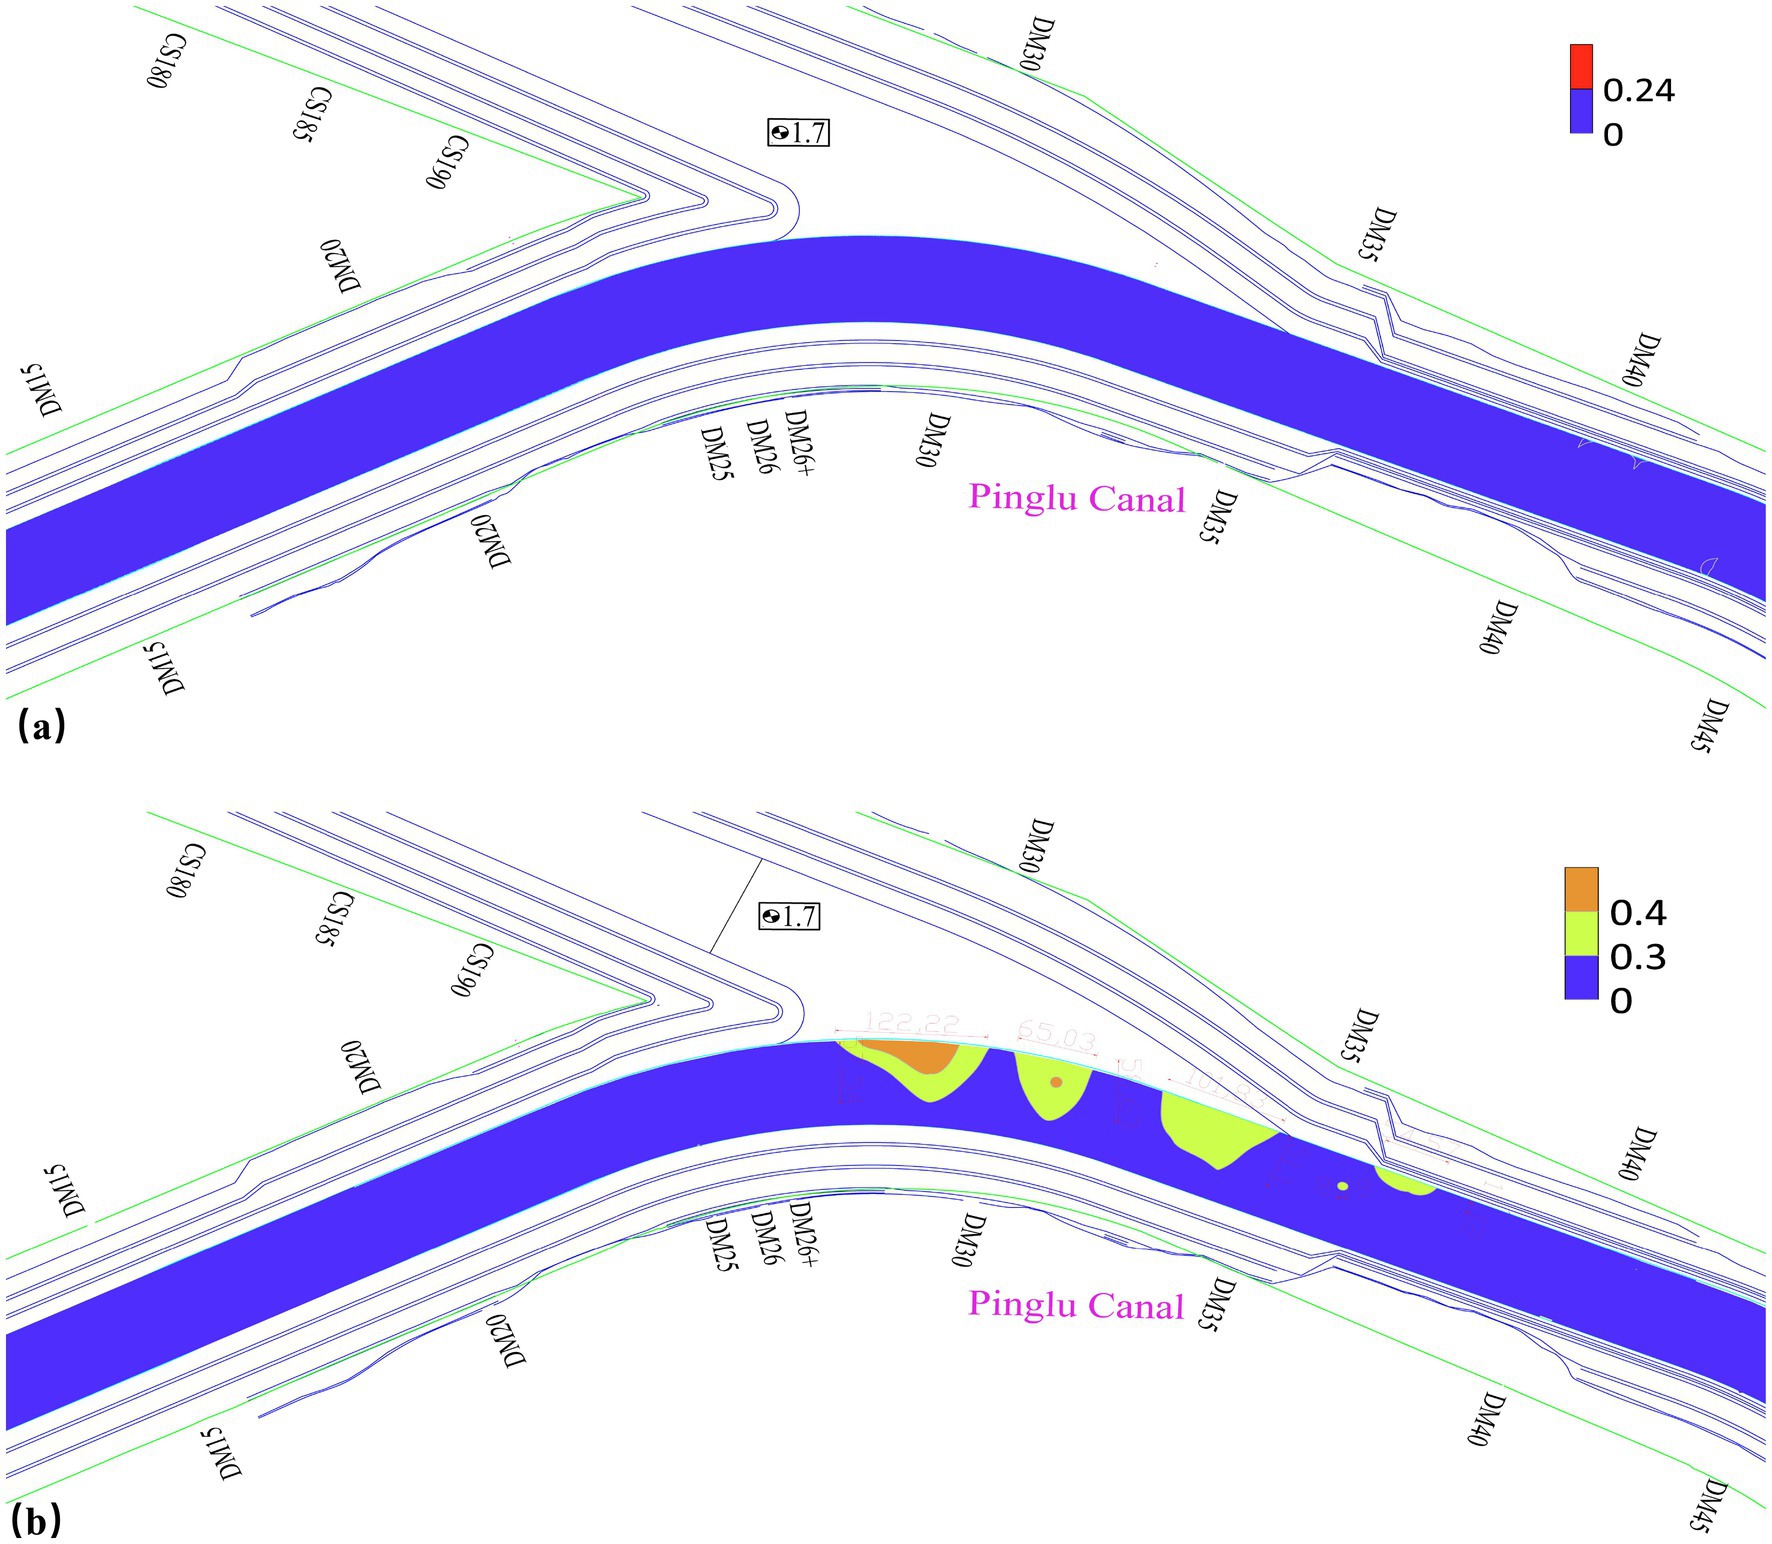
Figure 13. Lateral flow velocity distribution for improvement measure II, (a) experimental condition 1, (b) experimental condition 2 (m/s).
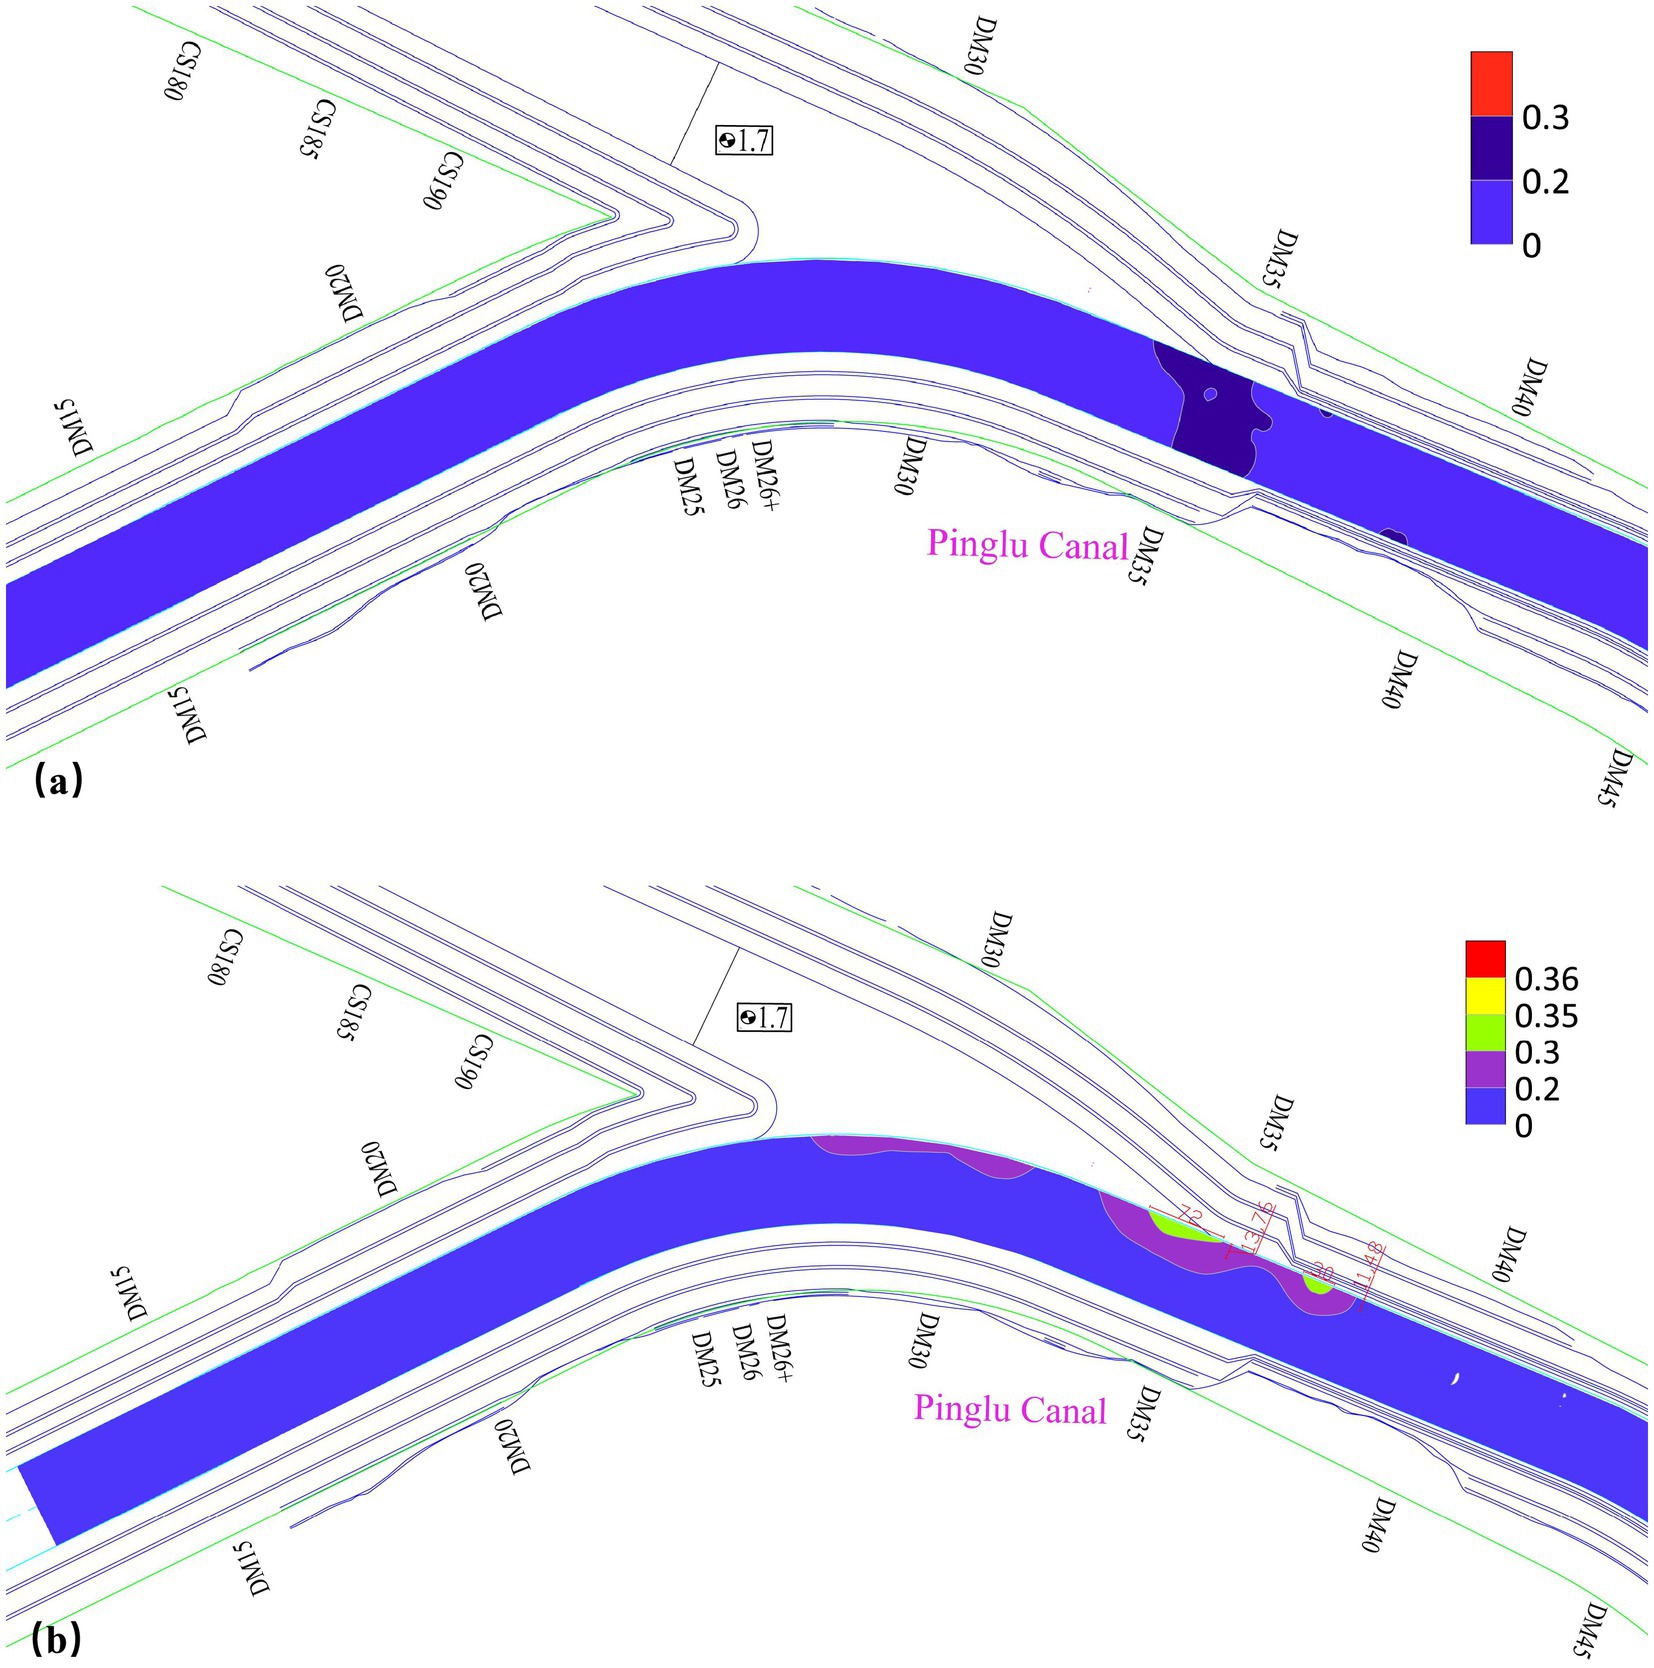
Figure 14. Lateral flow velocity distribution for improvement measure III, (a) experimental condition 1, (b) experimental condition 2 (m/s).
Under Experimental Condition 2 (with a main stream discharge of 1,112 m3/s and a tributary discharge of 2029 m3/s), multiple areas at the main-tributary confluence under the layout of Measure II exhibited lateral velocities exceeding the standard value of 0.3 m/s, indicating the presence of excessively high lateral velocities. Specifically, between cross-sections DM28 and DM29, the lateral flow velocity exceeded the standard value near the left side of the navigation channel. The maximum lateral flow velocity in this area reached 0.46 m/s, with the transverse extent exceeding the standard value being approximately 57.54 m and the longitudinal extent being about 122.22 m. At cross-sections DM31-DM32, near the left side of the navigation channel centerline, similar observations of transverse velocities exceeding the standard value were noted. The maximum lateral flow velocity in this area was 0.38 m/s, observed both on the left side and along the centerline of the navigation channel. The transverse extent that exceeded the standard value measured 58.63 m, while the longitudinal extent was 65.03 m. In the areas adjacent to the left boundary of the navigation channel, specifically between cross-sections DM33 to DM34 and DM36 to DM37, the lateral flow velocity limits were exceeded. However, all exceedances remained below 0.4 m/s, as illustrated in Figure 13b. Under the layout of Measure III, despite improvements in both the flow regime and the mitigation of excessive lateral flow velocities, two zones remained where lateral velocities exceeded permissible limits. These zones were situated between cross-sections DM34-DM35 and DM36-DM37, with lateral extents of approximately 13.78 m and 11.4 m, and longitudinal extents of approximately 72 m and 30 m, respectively. Both zones lay within the navigation channel adjacent to the left boundary of the waterway. The maximum lateral velocity of 0.35 m/s was identified near the left side of the channel centerline at cross-section DM34, as illustrated in Figure 14b. In the lateral velocity distribution results, under Condition 2 with Measure III implemented, the maximum lateral velocity was 0.28 m/s, which was located at the left boundary of the channel between cross-sections DM28 and DM29. There were no areas exceeding the standard value in the confluence zone channel. The problem of excessive lateral velocity had been significantly improved, and ships could navigate safely, as validated in Figure 15.
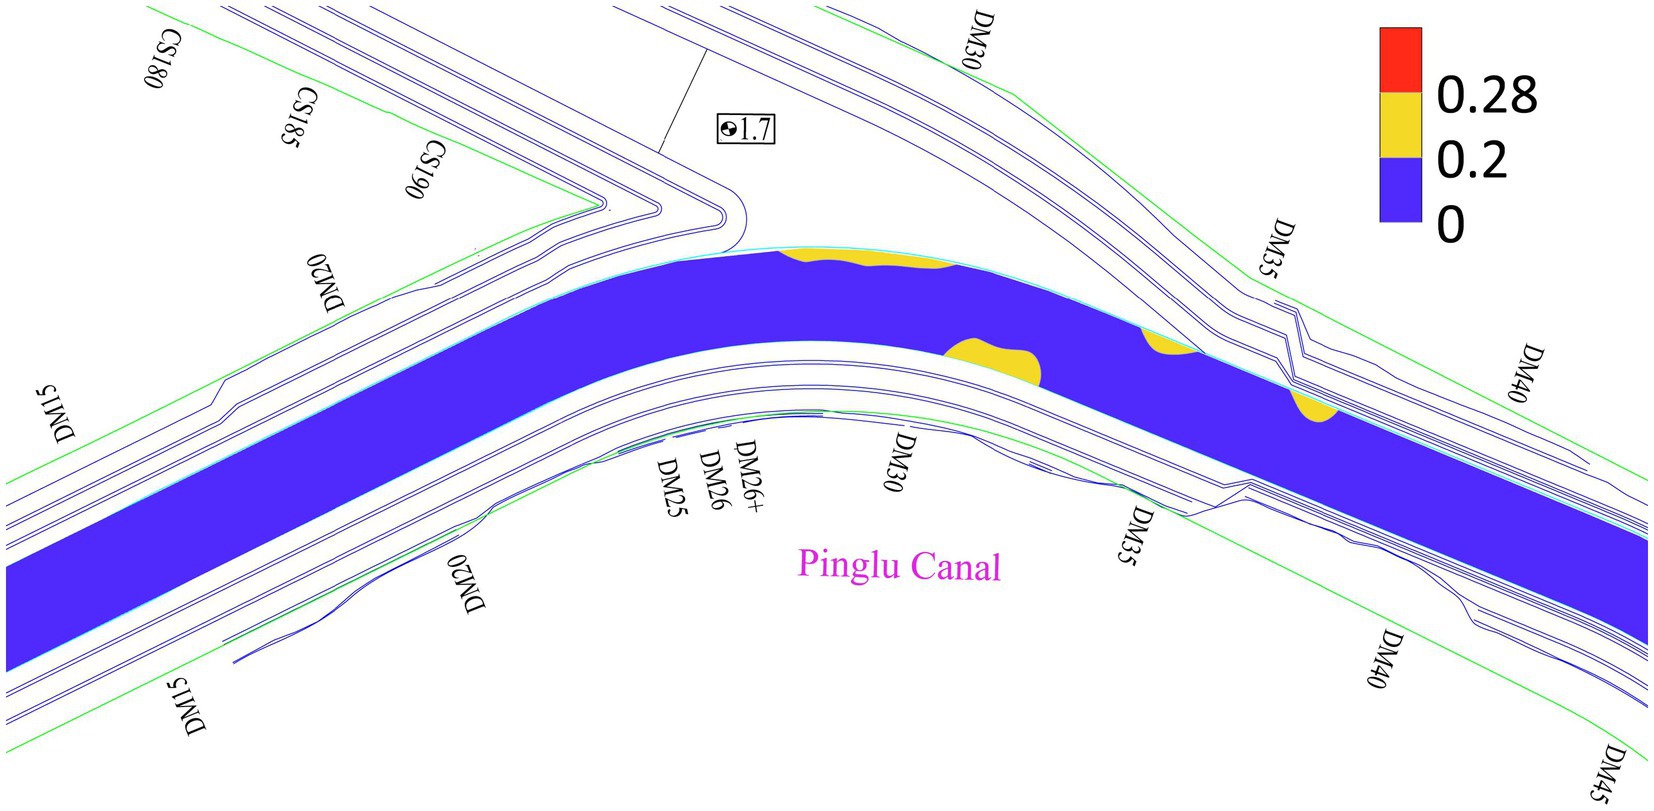
Figure 15. Lateral velocity distribution for experimental condition 2 of measure IV (m/s).
3.3 Water level fluctuations
Cross-sections DM26 and DM36 that exhibited significant water level fluctuations were selected for hydrodynamic analysis within the confluence zone. Under the layout of Measure I, the measured fluctuation differentials reached 33.54 cm (DM26) and 33.63 m (DM36). The navigation channel exhibited stabilized hydraulic conditions, with maximum water level oscillations remaining within typical operational thresholds. Additionally, the flow patterns demonstrate favorable hydrodynamic stability. As illustrated in Figure 16, under Experimental Condition 1 (mainstream flow of 1,112 m3/s and tributary flow of 1,380 m3/s), the tributary water level difference was approximately 7.5 m. The longitudinal ratios of the water surface drop in the upstream confluence area, confluence area itself, and downstream confluence area were 0.21 ‰, 0.43 ‰, and 0.21 ‰, respectively. These values were significantly lower than the navigational current condition standard of 2.0 ‰.
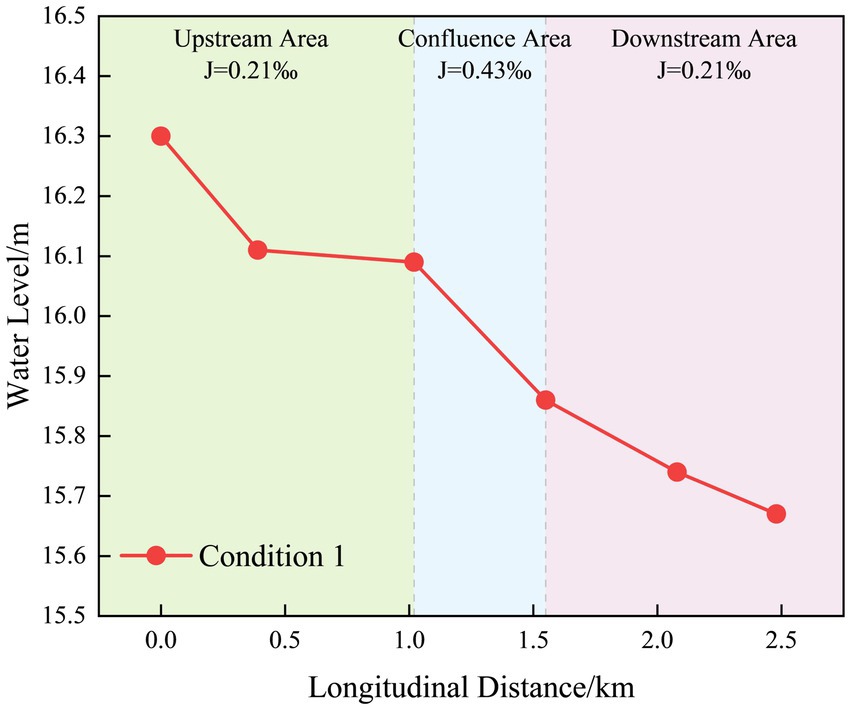
Figure 16. Longitudinal variation of water surface slope for measure I.
When Measure II with its specific layout was implemented under Experimental Condition 1, the water level fluctuation difference at cross-section DM26 was approximately 44.72 cm, while that at cross-section DM36 was approximately 44.84 cm. The flow pattern in the navigation channel was good and relatively stable. The water level drop between the tributary and the mainstream under this condition was approximately 7.5 m, corresponding to a riverbed drop of 16.3 m. The longitudinal water surface gradients upstream of the confluence, within the confluence area, and downstream of the confluence were measured at 0.30‰, 0.28‰, and 0.43‰, respectively, as illustrated in Figure 17a. In comparison to Experimental Condition 1, Experimental Condition 2 featured observation points established at identical cross-sections. The recorded water level fluctuation at DM26 was approximately 55.90 cm, while at DM36, it reached 89.68 cm. These results indicated a greater fluctuation and a more disordered flow pattern. Under Condition 2, the water level drop between the tributary and the mainstream was approximately 8 meters, corresponding to a riverbed drop of 16.3 meters. The longitudinal water surface gradients upstream of the confluence, within the confluence area, and downstream of the confluence were measured at 0.22‰, 0.41‰, and 0.27‰, respectively, as illustrated in Figure 17b.
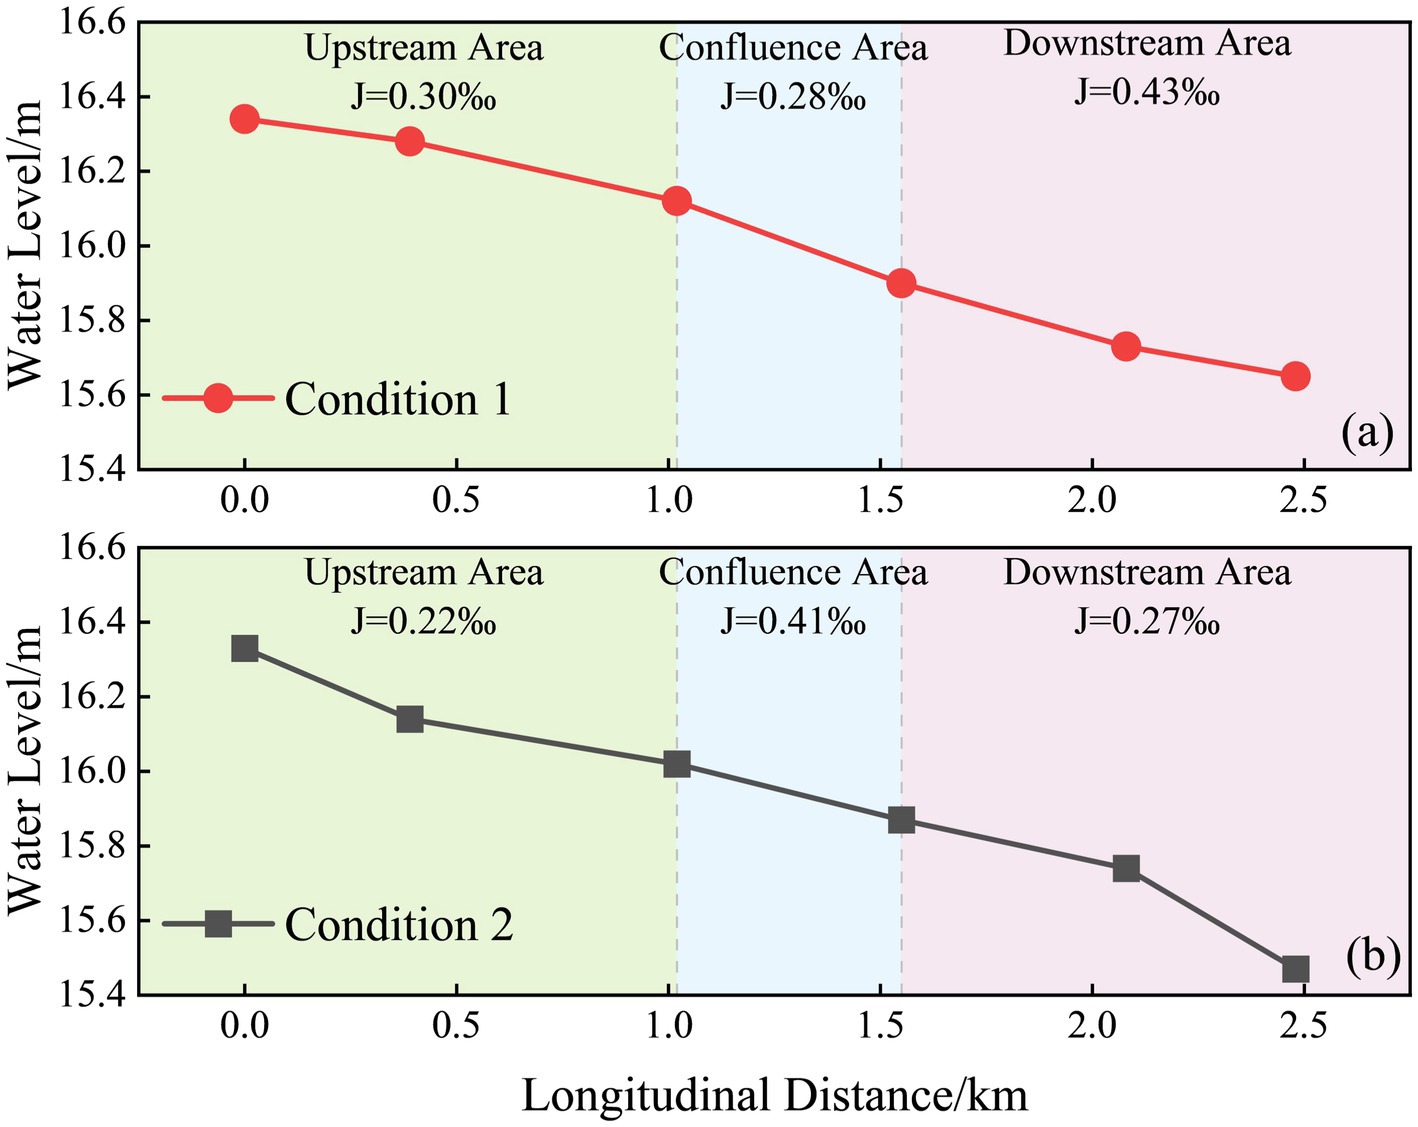
Figure 17. Longitudinal variation of water surface slope for measure II, (a) experimental condition 1, (b) experimental condition 1.
When Measure III with its specific layout was implemented under Experimental Condition 1, the water level fluctuation differentials measured approximately 33.54 cm at DM26 and 44.72 cm at DM36. The flow regime within the navigation channel exhibited favorable stability. Under this experimental condition, the tributary-mainstream water level differential measured approximately 5.2 m (with a corresponding riverbed elevation drop of 16.3 m). The longitudinal water surface gradients in the mainstream were quantified as 0.27‰ upstream of the confluence zone, 0.34‰ within the confluence zone, and 0.24‰ downstream of the confluence zone, as illustrated in Figure 18a. Compared with Experimental Condition 1, the water level fluctuation differentials at cross-sections DM26 and DM36 under Experimental Condition 2 were measured as approximately 55.90 cm. The hydraulic flow regime within this navigation channel satisfied the safe navigation requirements for representative vessel types. This test condition demonstrated a tributary-mainstream water level differential of approximately 5.2 m, corresponding to a riverbed elevation drop of 16.3 m. The longitudinal water surface gradients in the mainstream were quantified as 0.15‰ upstream of the confluence zone, 0.60‰ within the confluence zone, and 0.34‰ downstream of the confluence zone, as illustrated in Figure 18b.
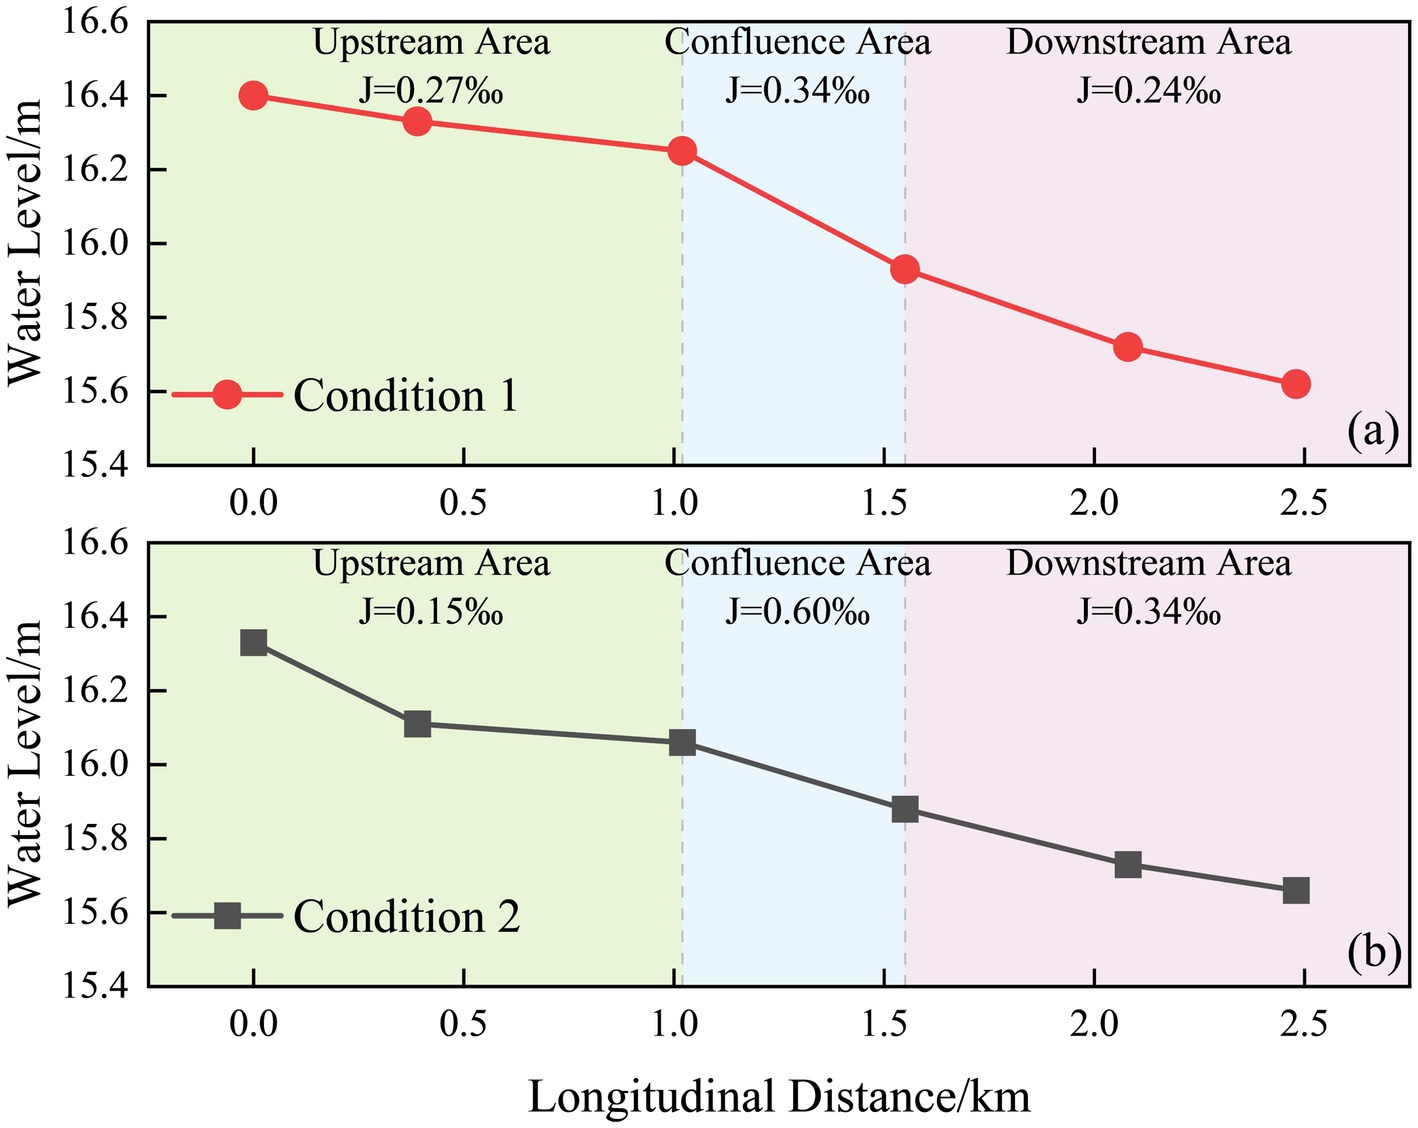
Figure 18. Longitudinal variation of water surface slope for measure III, (a) experimental condition 1, (b) experimental condition 2.
When Measure IV with its specific layout was implemented under Experimental Condition 2, the water level fluctuation amplitudes at cross-sections DM26 and DM36 were measured as approximately 44.72 cm and 44.84 cm, respectively. The flow regime within the navigation channel demonstrated favorable hydrodynamic characteristics with relatively stable performance. The water level differential between the tributary and main channel measured approximately 5.5 m. Longitudinal water surface gradients of 0.13‰, 0.66‰, and 0.32‰ were observed in the upstream reach, confluence zone, and downstream reach of the main channel tributary junction, respectively, as presented in Figure 19.
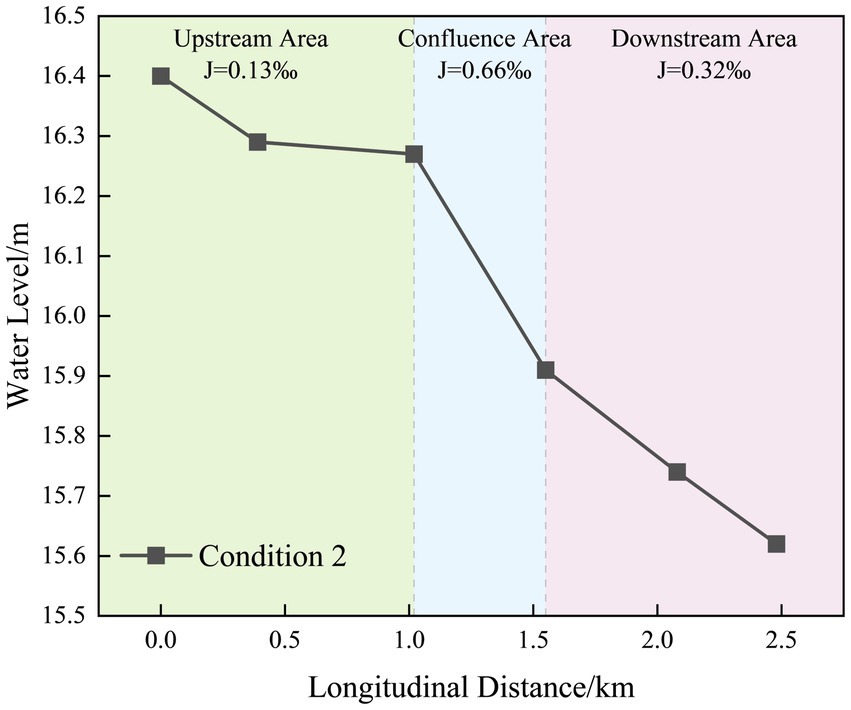
Figure 19. Longitudinal variation of water surface slope for measure IV.
3.4 Comparative analysis of measure implementation effectiveness
When the tributary section is sloped from the original mud surface at 18.0 m to 1.7 m with a 6% gradient, the resultant velocity distribution is uniform across all cross-sections in the confluence area channel. Additionally, the slope of the water surface is significantly lower than the standard. However, there are still some areas where the lateral flow velocity fails to meet the specification requirements. For instance, at cross-sections DM32-DM33, a lateral flow velocity of 0.4 m/s is observed on the left side of the navigation channel, which exceeds the specification limit of 0.3 m/s. Therefore, to improve control effectiveness and ensure adherence to these standards, further optimization is essential.
Under Measure II and experimental Condition 1 (concurrent 5-year return period floods in both tributary and canal systems), the configuration scheme of the three-stage flood detention basin meets the regulatory standards for the flow velocity in the waterway and the water surface slope of the main channel. However, under Condition 2 (a 5-year tributary flood superimposed with a 10-year canal discharge), the measured lateral flow velocities and resultant hydrodynamic patterns exceed permissible limits for ship navigation safety. This evidences the insufficiency of the current optimization scheme in meeting standardized navigational safety criteria.
The design featuring a 1.5% slope, two-tier stilling basins, two-tier energy dissipation steps, and a desilting basin (Measure III) under experimental condition 1 produces flow conditions and water surface gradients in the confluence area of the navigation channel that comply with navigation standards. After modifying the first-tier stilling basin to a gentler slope, the flow velocity under experimental condition 2 is somewhat reduced and the flow pattern within the tributary became more stable. The issue of excessive transverse flow velocity is significantly improved. However, there are still some small areas where the transverse flow velocity exceeds the standard values (the maximum transverse flow velocity is 0.35 m/s). Therefore, Measure III fulfills the navigation requirements under the conditions of a 5-year event in a tributary and a 5-year encounter in the main stream. Additionally, it essentially meets the navigation requirements for a 10-year encounter in the tributary coupled with a 5-year encounter in the main stream.
Under Measure IV and the condition where the tributary experiences a 10-year return period flood and the main stream undergoes a 5-year return period flood, the addition of new stilling tooth piers results in minor water surface fluctuations (<0.5 m) within the tributary. Additionally, there are no areas where the transverse flow velocity exceeds the standard value; therefore, the issue of excessive transverse flow velocity has been resolved. Considering that the arrangement of energy dissipation piers downstream of the desilting basin would adversely affect sediment dredging operations in the tributary during later maintenance phases. Additionally, the backwater effect induced by these energy dissipation piers during flood events would increase construction complexity. Furthermore, based on the navigational flow requirements for the canal reach spanning from the Qinjiang River estuary to the Qingnian Junction, the 5-year flood recurrence standard for the Qinjiang tributary has been determined to be more aligned with practical hydrological conditions. Therefore, Measure III is recommended as the preferred solution. The comprehensive rehabilitation outcomes are systematically summarized in Table 4.
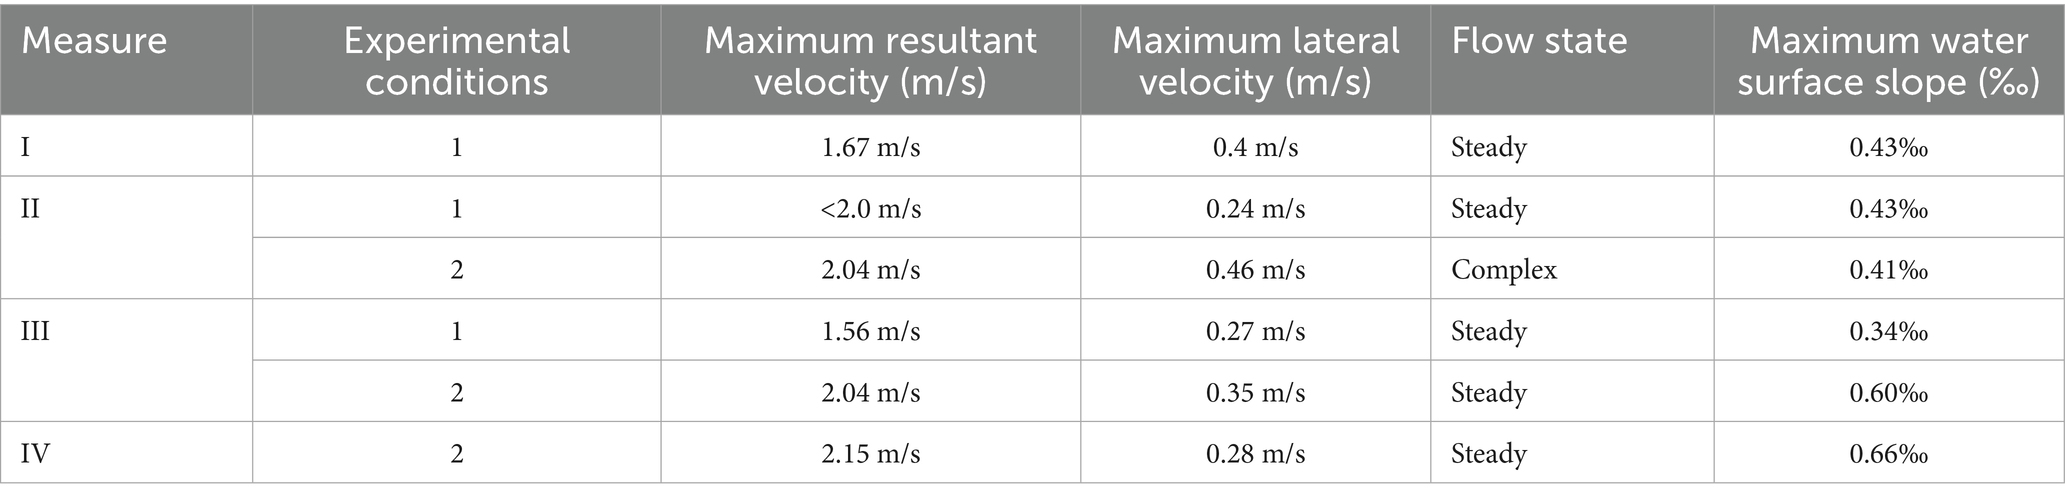
Table 4. Summary of the regulation results at the confluence section of Qinjiang River and Pinglu Canal.
3.5 Sediment trapping efficiency analysis of the recommended solution
When sediment-laden flows pass through river confluence areas, the decreased flow velocity and reduced sediment-carrying capacity can lead to substantial sediment deposition. This process may elevate water levels in the main channel and increase the risk of levee overtopping during flood events (Bilal et al., 2020; Leite Ribeiro et al., 2012). At present, a flume sediment retention model is used to study the sediment interception performance of the Qinjiang Tributary after the recommended scheme (Measure III) is implemented in the tributary; this research holds significant importance for the normal navigation of the canal.
This study investigates the sediment retention efficiency of an integrated hydraulic system, which combines a 1.5% gradient slope, a two-stage stilling basin, two-stage energy dissipation steps, and a desilting basin in a tributary of the Qinjiang River. This configuration aims to mitigate the impacts of sediment transport on navigation safety at the confluence with the main channel. A 10-cm-thick layer of test sand was placed at the top of the sloped section to simulate sediment trapping performance of the composite energy dissipators under different tributary flood conditions. Observations were then made of sediment movement in the stilling basin and settling basin. Sediment transport characteristics for each operational scenario are shown in Figure 20.
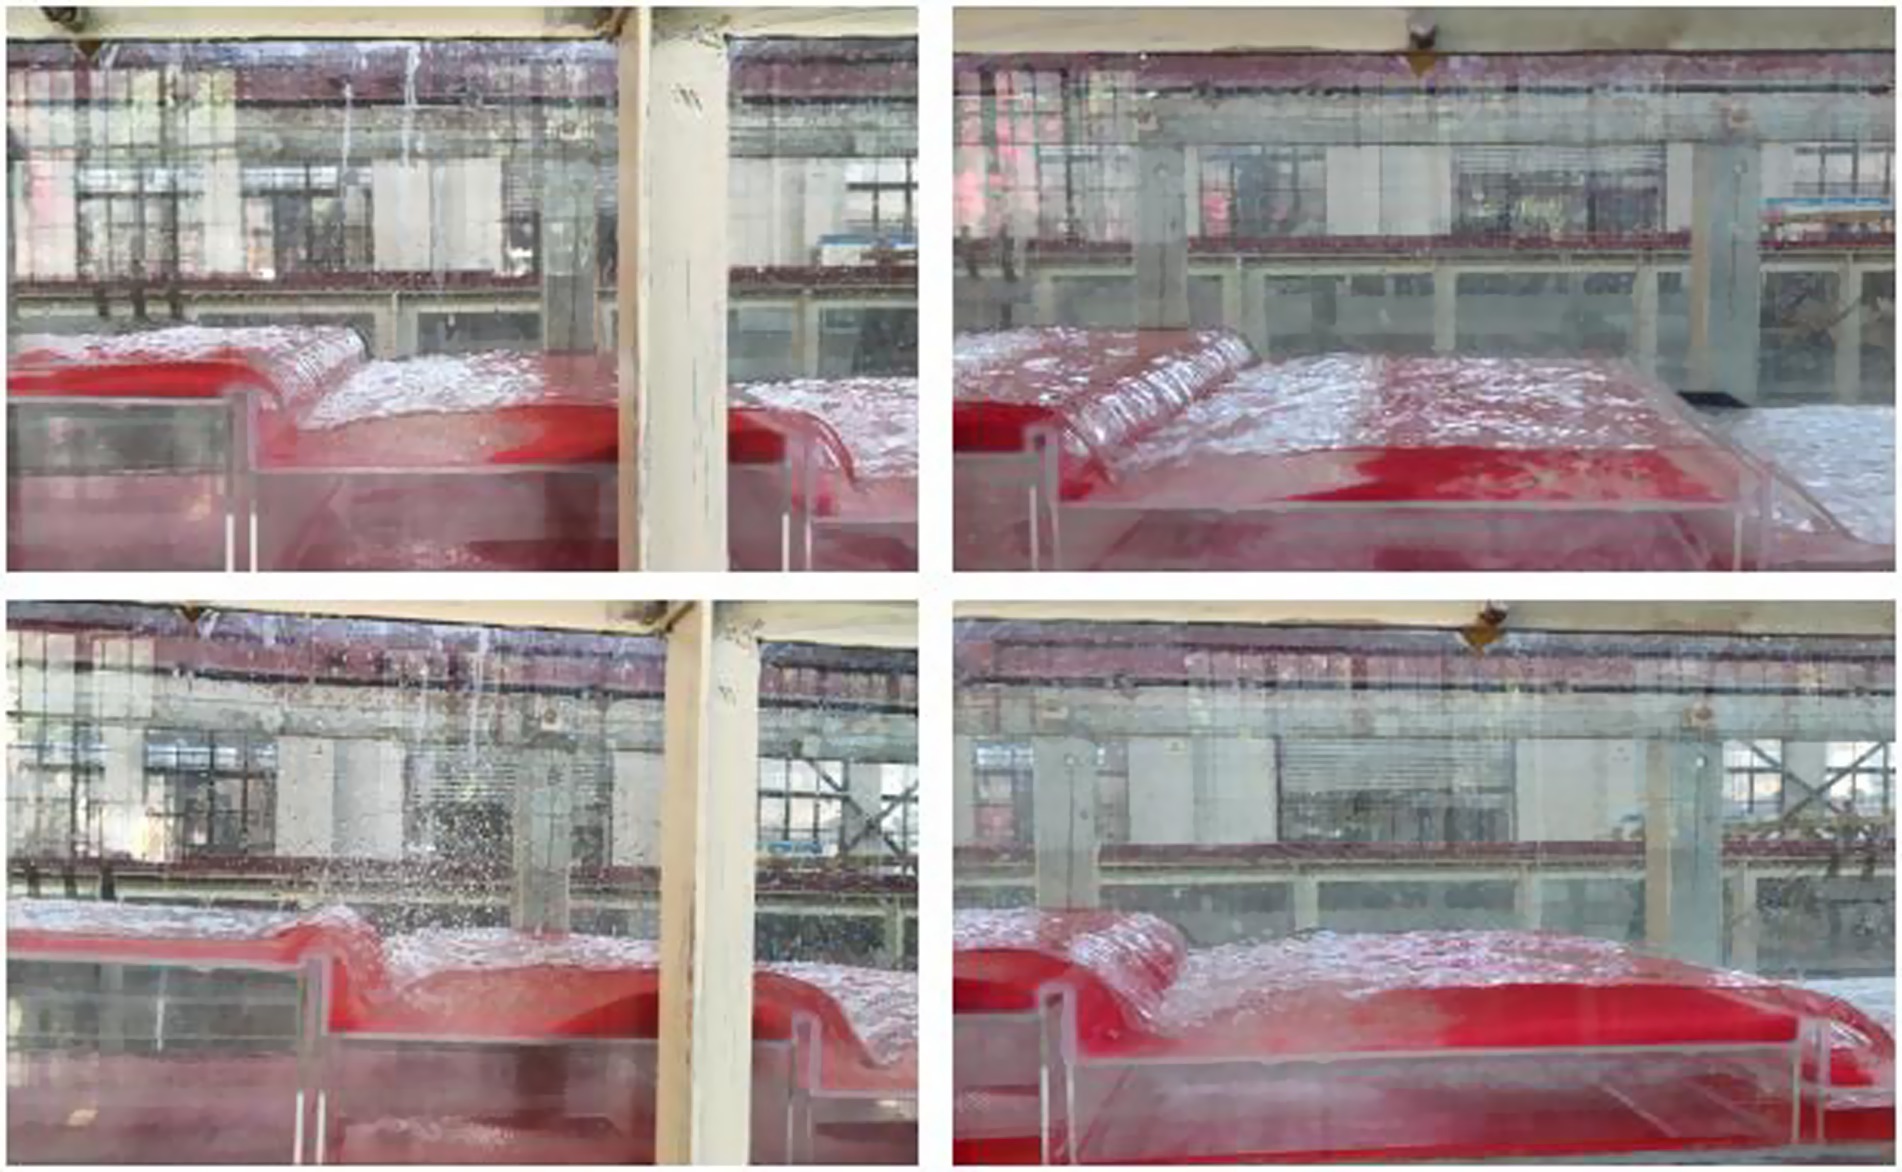
Figure 20. Process schematic of sediment simulation in the two-stage stilling basin under measure III.
As evidenced by the figure, the stilling basin and settling basin exhibit markedly distinct patterns of sediment deposition, demonstrating that variations in discharge exert a significant hydrodynamic influence on sediment retention characteristics. Under the 5-year recurrence interval condition (Condition 1), sediment deposition primarily occurs along the sloped channel section and within the two-stage stilling basins, with significant sediment retention being observed in the primary stilling basin. Minimal sediment transport is detected near the desilting basin, where only trace amounts of sediment accumulate. Under this experimental condition, the upstream exhibits greater sediment thickness compared to the downstream, demonstrating significantly effective sediment interception performance. Under the 10-year recurrence interval condition (Condition 2), sediment deposition occurs throughout the sloping apron, primary stilling basin, and settling basin. The secondary stilling basin demonstrates an enhanced capacity for sediment interception, with partial deposition occurring within the settling basin itself. Under this experimental condition, the downstream sediment load exceeds the five-year recurrence level, but is effectively intercepted by the sedimentation basin with a trapping efficiency of 96.4%. The results demonstrate that Design Measure III, which includes a 1.5% gradient slope, a two-stage stilling basin, two-tiered energy dissipation steps, and a desilting basin, effectively retains sediment in the tributary of the Qinjiang River under both operational scenarios. This configuration ensures that sediment deposition in the tributary does not compromise navigational flow conditions at the confluence (Figure 21).
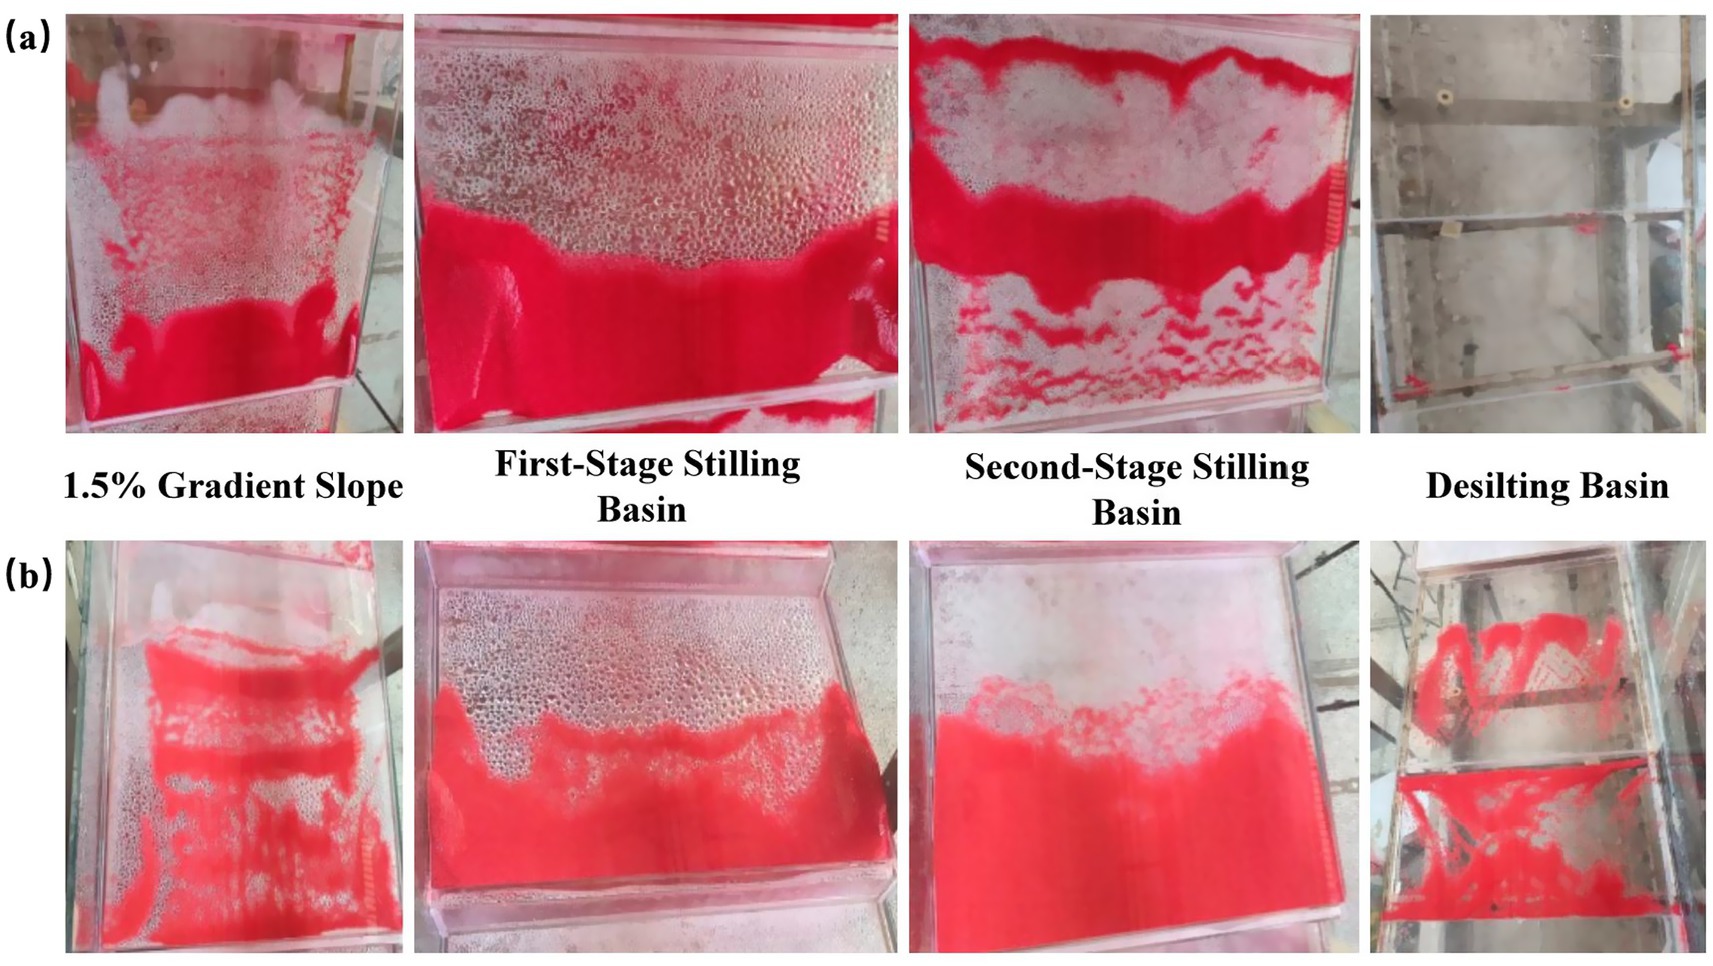
Figure 21. Schematic diagram of sediment interception effectiveness for the recommended solution (measure III): (a) experimental condition 1, (b) experimental condition 2.
4 Discussion
This study investigates the confluence of the Qinjiang tributary with the Pinglu Canal, focusing on hydrodynamic disturbances and sediment retention at this steep-gradient confluence characterized by significant elevation differences between the tributary and canal beds. The research aims to address navigation safety hazards arising from these hydraulic phenomena. Through comparative analysis of four sets of measures (Measures I–IV) under two typical flood scenarios, Measure III is identified as the final recommended scheme. This study further reveals the coupling relationship between the hydraulic characteristics of the confluence section with a significant elevation difference and the design of combined energy dissipation structures.
The study also measured the flow velocity and water depth in the four regions of the gentle slope, stilling basin, steps, and sedimentation basin arranged in Measure III during the flume model test phase. Due to the 1.5% slope gradient present in the tributary channel, the flow experiences a diffusion effect within the gentle slope section. Upon entering the first-stage stilling basin, the basin walls impose significant resistance on the flow, resulting in the main current being constrained to the central region of the basin. At the junction between the stilling basin and the energy-dissipating step, a distinct head difference induces a deflection energy dissipation phenomenon, subsequently forming a highly turbulent vortical flow pattern. This flow disturbance, initiated by the wall resistance, persists throughout the entire test section, ultimately manifesting as a velocity distribution characteristic where velocities near the side walls are significantly lower compared to the central region. To ensure the representativeness and accuracy of the data, monitoring points were established at cross-sections with significant changes in surface flow patterns in each region along the flow direction during the experiment. The flow velocity at the center position of each cross-section was measured multiple times and averaged as the basic data for energy analysis, as shown in Figure 22. The water depth was directly measured using a ruler, as shown in Figure 23.
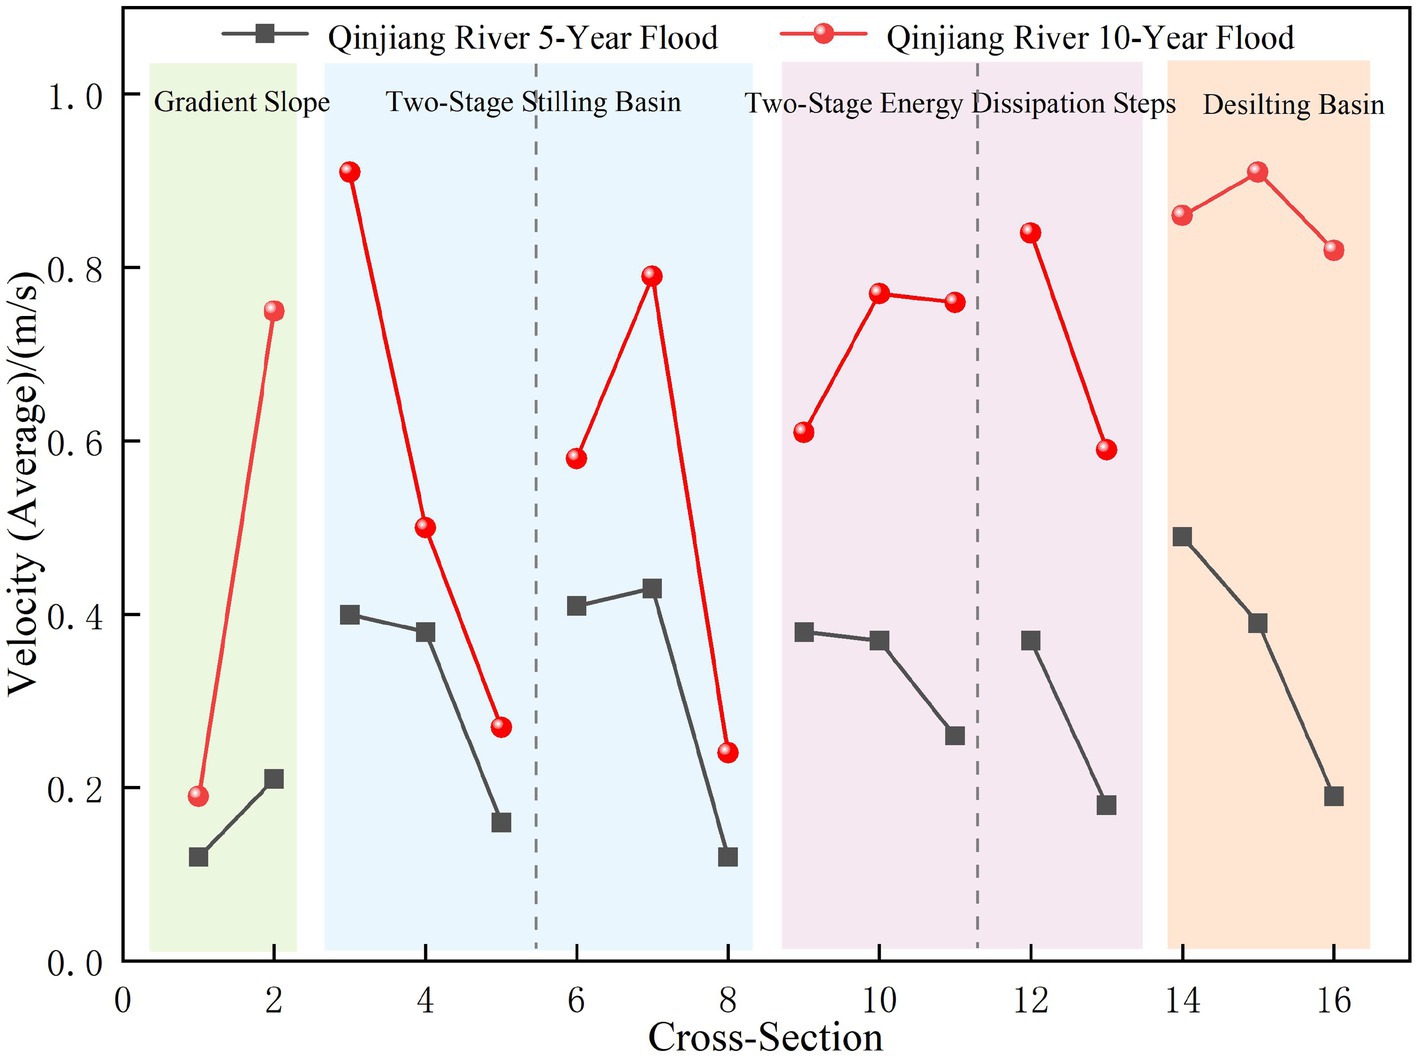
Figure 22. Flow velocity variation trend diagram.
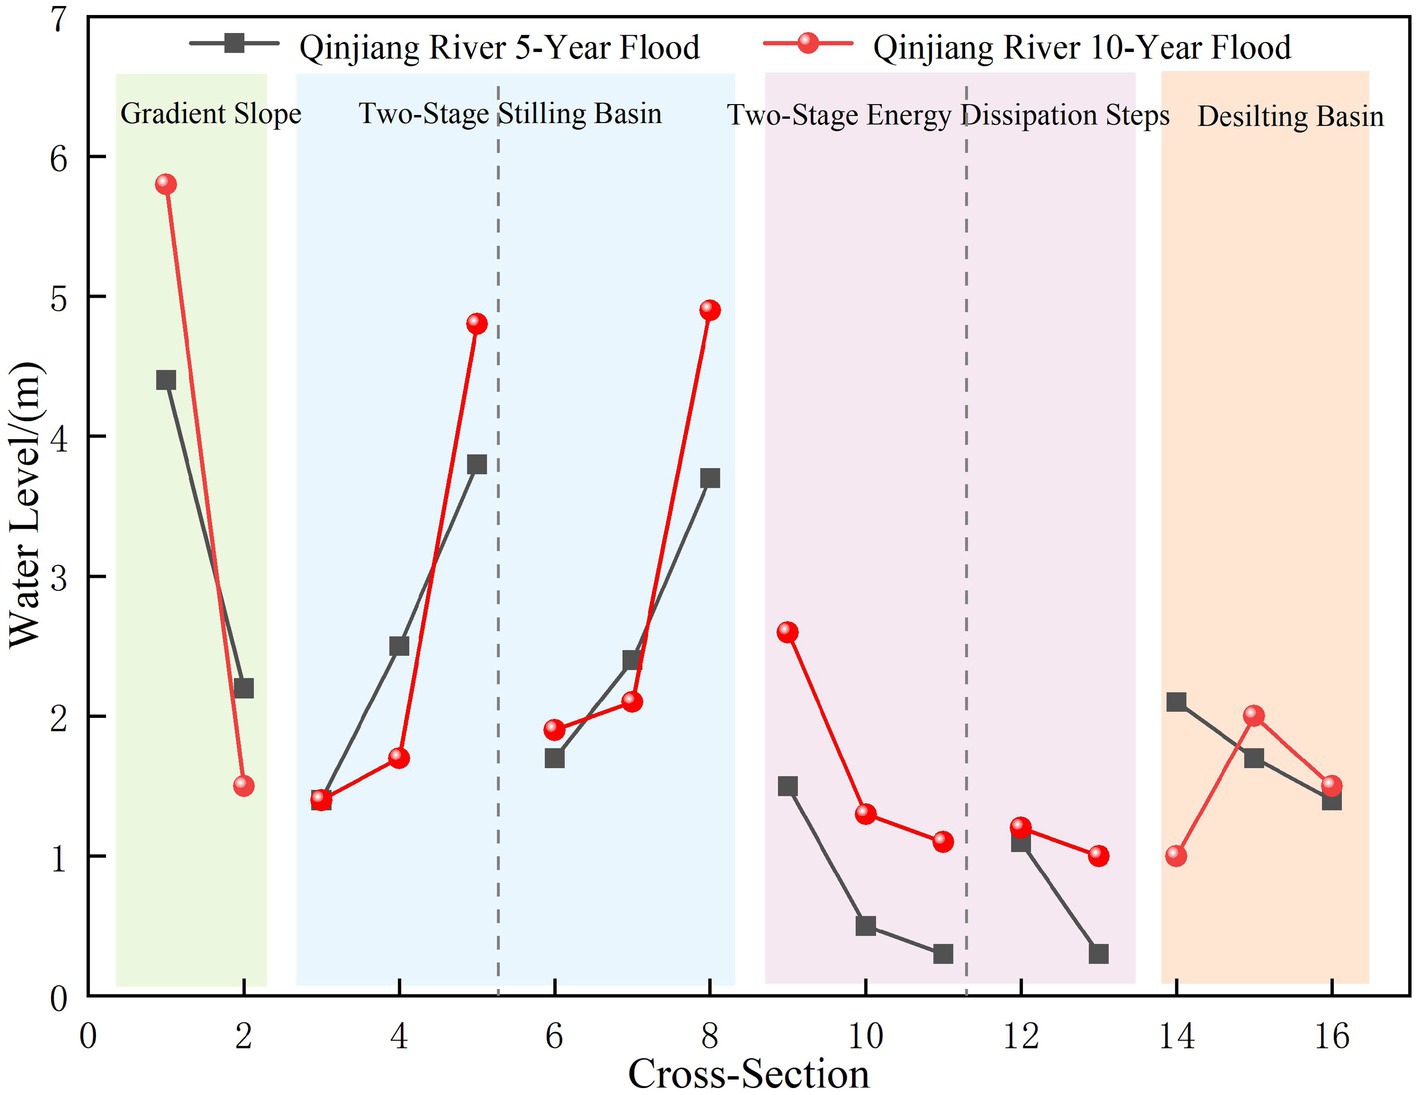
Figure 23. Water depth variation trend diagram.
From the perspective of energy conversion and dissipation, the water flow in various zones of Measure III exhibits phased characteristics: upon entering the gentle slope section, the position head (potential energy) gradually converts into the velocity head (kinetic energy). When entering the first-stage stilling basin, high-velocity flow interacts with the basin structure, where the head difference triggers ski-jump energy dissipation. A portion of the flow detaches from the main water body to form a jet, dissipating partial energy through air friction. Simultaneously, the mainstream remains confined to the center of the stilling basin, minimally affected by the basin’s divergent geometry, with kinetic energy loss primarily concentrated in the jet region. Furthermore, the water level at the terminus of the first-stage stilling basin exceeds that of the second-stage basin, triggering rapid conversion of potential energy to kinetic energy during flow descent. Upon entering the second-stage stilling basin, high-velocity flow directly impacts the basin floor, generating intense impact turbulence and turbulent vortices that dissipate substantial kinetic energy as heat. The stepped design of the second-stage basin prolongs the flow path and enhances internal turbulent mixing, thereby amplifying energy dissipation; this zone constitutes the primary kinetic energy loss region in Measure III. Within the stepped section, flows impact the step floors to form surface rollers, dissipating kinetic energy through vigorous turbulent mixing. Subsequently, rapid flow diffusion occurs in the desilting basin where increased cross-sectional area and intensified turbulence facilitate prompt energy dissipation.
To quantitatively evaluate the energy dissipation effect of Measure III, using the riverbed section at the confluence area as the reference plane, two key control sections were selected: the initial cross-section (Cross-Section 1, located at the starting point of the gentle slope section, where the potential energy is the sum of the total riverbed elevation difference and water depth) and the section after the sedimentation basin (Cross-Section 16, located at the end of the sedimentation basin outlet). Based on the total energy formula for sections derived from the Bernoulli equation ( where E is the total head, Z is the elevation head, is the pressure head, and is the velocity head). The pressure P is set to atmospheric pressure. The total heads at these two sections under flood conditions with five-year return period (Condition 1) and ten-year return period (Condition 2) were calculated, respectively. Subsequently, the energy dissipation efficiency was quantified by the difference in total head, as shown in Table 5.
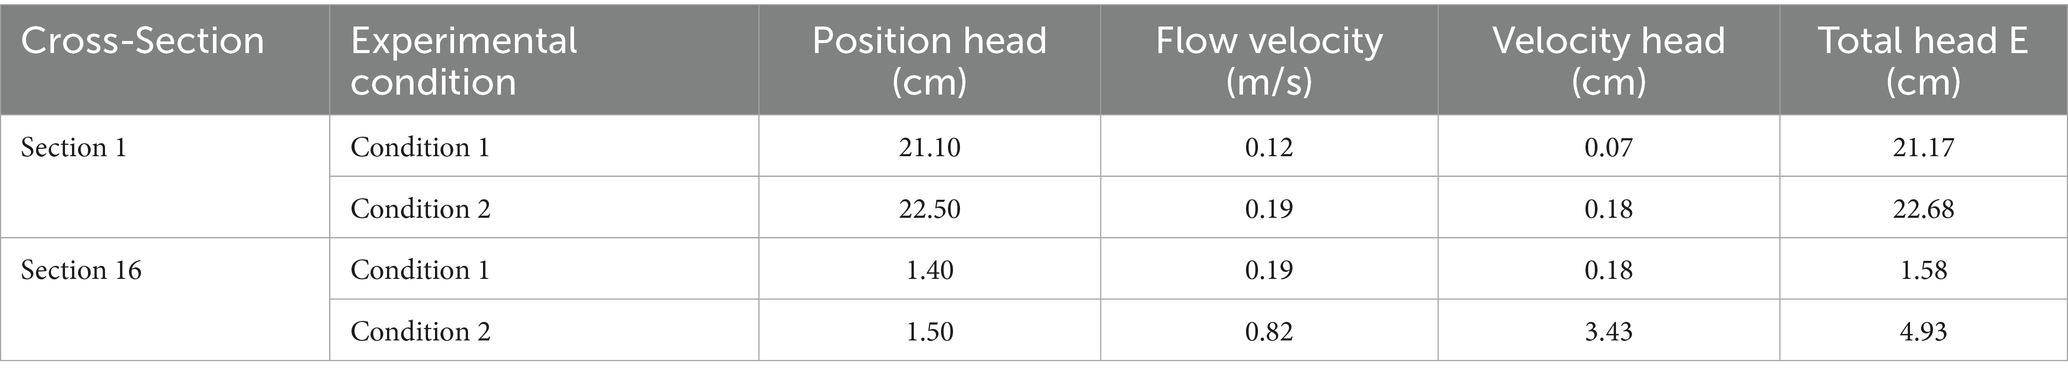
Table 5. Energy dissipation calculation and analysis table for measure III.
According to quantitative calculations based on the Bernoulli equation, the total head differences for Measure III under Condition 1 and Condition 2 are 16.24 cm and 17.75 cm, respectively. The total energy dissipation rates reach 76.71 and 78.26%. These results indicate that Measure III effectively dissipates the surplus energy of the tributary flood. In particular, the synergistic effect of the two-stage energy dissipation pools and energy dissipation steps plays a key role. This combination significantly reduces the kinetic energy of the flow.
The breakthrough of Measure III lies in establishing a synergistic system comprising a 1.5% gradient slope, two-stage stilling basin, two-stage energy-dissipation steps, and desilting basin. Compared to the 6% steep slope, the 1.5% mild slope significantly attenuates flow acceleration along the course, thereby providing a low-initial-energy foundation for subsequent energy-dissipation structures. The two-stage stilling basin progressively dissipates the shear stress between tributary and main canal flows through multistage energy dissipation involving “water reflow-impact-turbulence” mechanisms. This process effectively suppresses lateral circulation generation in the confluence zone (Bejestan and Hemmati, 2008). The desilting basin, however, intercepts part of the bedload sediment in advance, thereby avoiding alterations in riverbed morphology and interference with flow velocity distribution at the confluence zone caused by sediment deposition (Eghlidi et al., 2020). Collectively, these components establish a closed-loop functional chain: slope-controlled velocity reduction → stilling basin flow stabilization → desilting basin bed preservation. This integrated approach effectively overcomes the limitations of single energy-dissipation structures in Measures I (gradient slope installation) and II (stilling basin deployment), while demonstrating greater economic feasibility than Measure IV with additional energy-dissipation blocks. The sediment interception results demonstrate that Measure III’s composite energy-dissipation structural advantage becomes more pronounced. The two-stage stilling basin creates a low-velocity environment conducive to sediment settling by reducing flow velocity. Meanwhile, the desilting basin’s volumetric design and flow trajectory guidance capture unsettled sediments, preventing their entry into the main canal. This staged trapping mechanism effectively addresses the challenges of extensive sediment transport distance and widespread deposition range characteristic of high-drop tributaries. This study pioneers a dual-stage framework employing iterative optimization in a 1:50 scale river model coupled with validation in a 1:100 scale flume model. Phase I rapidly identifies Measure III as the optimal structural system balancing flow velocity control and regime stability through comparative analysis of Measure I-IV combinations, effectively resolving core issues of excessive transverse velocity and unstable flow regimes. Phase II verifies the sediment interception efficacy of the recommended Measure III solution using the 1:100 scale physical flume model. This study pioneers the spatial optimization of Measure III using a two-stage stilling basin with desilting basin configuration, achieving synergistic interaction between the structures: the upstream stilling basins stabilize flow to create a low-turbulence sedimentation environment for the desilting basin (Babaali et al., 2019), while the downstream desilting basin intercepts sediment to prevent deposition from compromising energy dissipation efficiency (Zare and Doering, 2012). This integrated design not only satisfies navigation flow requirements at the Pinglu Canal-Qinjiang tributary confluence, but also enhances sediment capture efficiency, ultimately providing a unified solution that concurrently addresses navigation flow control and sediment deposition management. The proposed solution effectively mitigates the risk of sediment deposition-induced water level rise and levee overtopping in the main channel identified by Rhoads and Johnson (2018), establishing itself as a representative case for addressing flow velocity exceedance and sediment deposition at high-drop canal confluences using integrated energy-dissipation facilities. Furthermore, this qualitative screening followed by targeted verification methodology not only enhances solution optimization efficiency but also ensures result reliability, while providing a methodological framework for model testing design in analogous hydraulic engineering projects.
In summary, this study pioneers a case investigation at the Pinglu Canal-Qinjiang tributary confluence. Through systematic model testing and optimization analysis, the effectiveness of the 1.5% mild slope + two-stage stilling basins + two-stage energy-dissipation steps + desilting basin configuration was demonstrated. The findings not only provide reliable guidance for the Pinglu Canal’s construction, but also deepen the fundamental understanding of hydraulic and sediment transport characteristics at high-drop interbasin canal confluences. This research focuses on flow velocity control, flow regime stabilization, and sediment interception during the design phase of the engineering solution. However, it does not address maintenance challenges during operational stages. Key parameters such as sedimentation rate in the desilting basin, dredging frequency, and dredging methods (e.g., mechanical dredging or hydraulic flushing) remain unquantified. Furthermore, the long-term performance degradation of Measure III’s two-stage stilling basins—potentially caused by sediment abrasion and concrete deterioration—may compromise energy dissipation efficiency, necessitating durability assessments and lifecycle maintenance cost analysis. Subsequent studies will integrate numerical simulations with prototype monitoring to refine the design and develop comprehensive long-term operation strategies, thereby advancing sustainable development of interbasin canal technologies.
5 Conclusion
The experimental study uses a fixed-bed river engineering physical model to investigate the impact of the significant bed elevation difference at the convergence of the Pinglu Canal and Qinjiang River on navigation flow conditions. Optimization measures implemented to address initial design limitations effectively reduce transverse velocities in the confluence zone, achieving compliance with navigational standards. The findings are summarized as follows:
The confluence of the Qinjiang tributary has a large elevation difference between the main and tributary riverbeds and a high tributary discharge. Under experimental conditions with a 5-year flood event for both the main and tributary streams, a gentle slope is applied (the tributary section is graded from the original mud surface at 18.0 m with a 6% slope to 1.7 m). However, the lateral flow velocity in the confluence zone maintains a high magnitude, with peak values attaining 0.4 m/s. When employing solely three-tiered stepped-stilling basins as the flow energy dissipation measure, experimental simulations under combined discharge conditions (tributary discharge with a 10-year recurrence interval and main channel discharge with a 5-year recurrence interval) indicate a maximum lateral flow velocity of 0.46 m/s within the canal waterway. This velocity substantially exceeds critical thresholds across navigation zones. Both hydraulic designs fail to meet navigational safety requirements for vessel traffic under specified flow regimes.
To improve navigational flow conditions at the high-head confluence reach between the canal and the Qin River while retaining sediment within the tributary mouth, a systematic attenuation of tributary inflow energy is prioritized. Consequently, the remediation design integrates sequentially-arranged stepped-stilling basins and a desilting basin at strategically optimized locations, synergistically addressing energy dissipation and sediment deposition. Iterative comparative optimization of structural configurations is conducted to refine hydraulic performance. The experimental findings demonstrate that slope-cutting treatment implemented in the Qinjiang tributary estuary reach, combined with a composite energy dissipation system, significantly enhances flow regulation. The system configuration integrates two-stage stilling basins, two-tiered steps, and a desilting basin. This integrated approach exhibits superior performance in hydraulic control compared to conventional methods. This comprehensive approach effectively reduces tributary flow velocity and enhances sediment deposition, thereby stabilizing the hydrodynamic characteristics in the confluence zone. The intervention minimizes water surface fluctuations and maintains transverse flow velocities within the permissible range for navigational requirements, as specified by relevant maritime standards.
The hydrodynamic characteristics in trans-basin confluence areas of main and tributary channels exhibit significant complexity, exerting direct impacts on navigational safety. The implementation of energy dissipation facilities such as stilling basins and desilting basin demonstrates practical application value in regulating navigational flow conditions within confluence zones. This engineering approach provides valuable scientific insights and practical references for similar trans-basin canal regulation projects, thereby enhancing design methodologies and operational safety in inter-basin waterway systems.
Data availability statement
The raw data supporting the conclusions of this article will be made available by the authors, without undue reservation.
Author contributions
LH: Methodology, Conceptualization, Writing – review & editing. LC: Writing – original draft, Investigation, Software. TY: Formal analysis, Data curation, Writing – review & editing. SY: Funding acquisition, Writing – review & editing. JH: Writing – review & editing, Validation.
Funding
The author(s) declare that financial support was received for the research and/or publication of this article. This work was supported by National Key Research and Development Program of China (Grant no.: 2023YFB2604700), Guangxi Science and Technology Major Project (Grant no.: AA23023009), and Joint Cultivation Base for Graduate Students in Civil and Hydraulic Engineering established by Chongqing Jiaotong University & Sichuan Communication Surveying & Design Institute Co., Ltd. (Grant No.: JDLHPYJD2020026).
Conflict of interest
JH was employed by the Pinglu Canal Group Co., Ltd.
The remaining authors declare that the research was conducted in the absence of any commercial or financial relationships that could be construed as a potential conflict of interest.
Correction note
A correction has been made to this article. Details can be found at: 10.3389/frwa.2025.1715739.
Generative AI statement
The authors declare that no Gen AI was used in the creation of this manuscript.
Any alternative text (alt text) provided alongside figures in this article has been generated by Frontiers with the support of artificial intelligence and reasonable efforts have been made to ensure accuracy, including review by the authors wherever possible. If you identify any issues, please contact us.
Publisher’s note
All claims expressed in this article are solely those of the authors and do not necessarily represent those of their affiliated organizations, or those of the publisher, the editors and the reviewers. Any product that may be evaluated in this article, or claim that may be made by its manufacturer, is not guaranteed or endorsed by the publisher.
References
Babaali, H., Mojtahedi, A., Soori, N., and Soori, S. (2019). Numerical modeling of flow in USBR II stilling basin with end adverse slope. Int. J. Environ. Ecol. Eng. 13, 62–68.
Bantacut, A. Y., Azmeri, A., Jemi, F. Z., Ziana, Z., and Muslem, M. (2022). An experiment of energy dissipation on USBR IV stilling basin–alternative in modification. J. Water Land Dev. 22, 68–72. doi: 10.24425/jwld.2022.140781
Bejestan, M. S., and Hemmati, M. (2008). Scour depth at river confluence of unequal bed level. J. Appl. Sci. 8:1770. doi: 10.3923/jas.2008.1766.1770
Bilal, A., Xie, Q., and Zhai, Y. (2020). Flow, sediment, and morpho-dynamics of river confluence in tidal and non-tidal environments. J Mar Sci Eng 8:591. doi: 10.3390/jmse8080591
Biron, P. M., Richer, A., Kirkbride, A. D., Roy, A. G., and Han, S. (2002). Spatial patterns of water surface topography at a river confluence. Earth Surf. Process. Landf. 27, 913–928. doi: 10.1002/esp.359
Boyer, C., Roy, A. G., and Best, J. L. (2006). Dynamics of a river channel confluence with discordant beds: flow turbulence, bed load sediment transport, and bed morphology. J. Geophys. Res. Earth 111:458. doi: 10.1029/2005JF000458
Bradbrook, K. F., Lane, S. N., Richards, K. S., Biron, P. M., and Roy, A. G. (2001). Role of bed discordance at asymmetrical river confluences. J. Hydraul. Eng. 127, 351–368. doi: 10.1061/(ASCE)0733-9429(2001)127:5(351)
Canelas, O. B., Ferreira, R. M., and Cardoso, A. H. (2022). Hydro-morphodynamics of an open-channel confluence with bed discordance at dynamic equilibrium. Water Resour. Res. 58:e2021WR029631.
De Serres, B., Roy, A. G., Biron, P. M., and Best, J. L. (1999). Three-dimensional structure of flow at a confluence of river channels with discordant beds. Geomorphology 26, 313–335. doi: 10.1016/S0169-555X(98)00064-6
Eghlidi, E., Barani, G. A., and Qaderi, K. (2020). Laboratory investigation of stilling basin slope effect on bed scour at downstream of stepped spillway: physical modeling of javeh RCC dam. Water Resour. Manag. 34, 87–100. doi: 10.1007/s11269-019-02395-5
El-Saie, Y., Saleh, O., Refeat, M., Ali, A., and El-Tohamy, E. (2024). Performance of using advanced Stilling Basin as an energy dissipation by using three-dimensional numerical model. EIJEST 46, 1–10.
Leite Ribeiro, M., Blanckaert, K., Roy, A. G., and Schleiss, A. J. (2012). Flow and sediment dynamics in channel confluences. J. Geophys. Res. Earth 117:2171. doi: 10.1029/2011JF002171
Liu, T. H., Chen, L., and Fan, B. L. (2012a). Experimental study on flow pattern and sediment transportation at a 90 open-channel confluence. Inte. J. Sediment Res. 27, 178–187. doi: 10.1016/S1001-6279(12)60026-2
Liu, L., Zhang, J., Yu, F., and Zhang, F. (2012b). Experimental study of hydraulic characters of the flaring gate pier and stilling basin united energy dissipator with high water head and large discharge. J. Hydroelectric Eng. 31, 49–55.
Ma, D. G., Liu, X., Zhao, J. Q., Liu, X. F., and Li, S. X. (2011). The research of navigation flow conditions and improvement measures on entrance area and connecting reach of Dahua lock in Hongshui River. Adv. Mater. Res. 250, 3624–3629.
Pagliara, S., Das, R., and Palermo, M. (2008). Energy dissipation on submerged block ramps. J. Irrig. Drain. Eng. 134, 527–532. doi: 10.1061/(ASCE)0733-9437(2008)134:4(527)
Peterka, A. J. (1964). Hydraulic design of stilling basins and energy dissipators. New York, NY: United States Department of the Interior, Bureau of Reclamation.
Raju, K. R., Kothyari, U. C., Srivastav, S., and Saxena, M. (1999). Sediment removal efficiency of settling basins. J. Irrig. Drain. Eng. 125, 308–314. doi: 10.1061/(ASCE)0733-9437(1999)125:5(308)
Rhoads, B. L., and Johnson, K. K. (2018). Three-dimensional flow structure, morphodynamics, suspended sediment, and thermal mixing at an asymmetrical river confluence of a straight tributary and curving main channel. Geomorphology 323, 51–69. doi: 10.1016/j.geomorph.2018.09.009
Rhoads, B. L., and Kenworthy, S. T. (1995). Flow structure at an asymmetrical stream confluence. Geomorphology 11, 273–293. doi: 10.1016/0169-555X(94)00069-4
Riley, J. (2013). The fluvial dynamics of confluent meander bends (Doctoral dissertation). Champaign, IL: University of Illinois at Urbana-Champaign.
Saleh, L. A., and Khassaf, S. I. (2024). Evaluating the hydraulic performance of USBR II Stilling Basin with rough bed. Tikrit J. Eng. Sci. 31, 93–104. doi: 10.25130/tjes.31.3.9
Sukhodolov, A. N., Krick, J., Sukhodolova, T. A., Cheng, Z., Rhoads, B. L., and Constantinescu, G. S. (2017). Turbulent flow structure at a discordant river confluence: asymmetric jet dynamics with implications for channel morphology. J. Geophys. Res. Earth 122, 1278–1293. doi: 10.1002/2016JF004126
Tu, H. W., and Renjie, C. Z. (2019). “Research on flood discharge, energy dissipation, and operation mode of sluice gate for low-head and large-discharge hydropower stations” in Sustainable and safe dams around the world/un monde de barrages durables et sécuritaires. eds. J. P. Tournier, T. Bennett, and J. Bibeau (London: CRC Press), 11–20.
Wang, X. G., Yan, Z. M., and Guo, W. D. (2007). Three-dimensional simulation for effects of bed discordance on flow dynamics at Y-shaped open channel confluences. J. Hydrodynamics, Ser. B 19, 587–593. doi: 10.1016/S1001-6058(07)60157-7
Wei, W. R. (2013). Experimental study on hydraulic characteristics of X-shape flaring gate pier and deflecting Stilling Basin united energy Dissipator. Appl. Mech. Mater. 376, 279–283. doi: 10.4028/www.scientific.net/AMM.376.279
Yu, K., Han, C., Han, K., Zhao, J., and Yu, Z. (2022). “Experimental study on navigation flow condition of downstream Approach Channel of navigation facilities of Baise water conservancy project” in Smart Rivers. eds. K. S. Adu-Manu, F. A. Katsriku, and J. D. Abdulai (Singapore: Springer Nature), 1471–1480.
Zare, H. K., and Doering, J. C. (2012). Energy dissipation and flow characteristics of baffles and sills on stepped spillways. J. Hydraul. Res. 50, 192–199. doi: 10.1080/00221686.2012.659840
Zhang, C., Tang, H., Chen, D., Wang, S., and Han, J. (2009a). “Experimental research on the length of 3D hydraulic jump in joint energy Dissipator,” in Advances in Water Resources and Hydraulic Engineering: Proceedings of 16th IAHR-APD Congress and 3rd Symposium of IAHR-ISHS (2037–2040). Berlin: Springer Heidelberg.
Keywords: Pinglu Canal, navigational flow conditions, energy dissipation facilities, model test, sediment retention
Citation: Han L, Cheng L, Yu T, Yang S and He J (2025) Impacts of navigable flow conditions at the confluence of main and tributary streams of a cross-basin canal with high drop geomorphology—a case study of the confluence section of Qinjiang River in Pinglu Canal. Front. Water. 7:1676582. doi: 10.3389/frwa.2025.1676582
Edited by:
Michael Nones, Polish Academy of Sciences, PolandReviewed by:
Yongjun Fang, Zhejiang University of Water Resources and Electric Power, ChinaJulio Isaac Montenegro Gambini, Delft University of Technology, Netherlands
Copyright © 2025 Han, Cheng, Yu, Yang and He. This is an open-access article distributed under the terms of the Creative Commons Attribution License (CC BY). The use, distribution or reproduction in other forums is permitted, provided the original author(s) and the copyright owner(s) are credited and that the original publication in this journal is cited, in accordance with accepted academic practice. No use, distribution or reproduction is permitted which does not comply with these terms.
*Correspondence: Linfeng Han, bGluZl9oYW5AMTYzLmNvbQ==