 Michaela Graf1†
 Thorsten Haas1†
 Attila Teleki1André Feith1
 Martin Cerff2Wolfgang Wiechert2
 Katharina Nöh2
 Tobias Busche3,4
 Jörn Kalinowski3
 Ralf Takors1*
- 1Institute of Biochemical Engineering, University of Stuttgart, Stuttgart, Germany
- 2Institute of Bio- and Geosciences, IBG-1: Biotechnology, Forschungszentrum Jülich GmbH, Jülich, Germany
- 3Center for Biotechnology, Bielefeld University, Bielefeld, Germany
- 4Institute for Biology-Microbiology, Freie Universität Berlin, Berlin, Germany
Increasing the growth rate of the industrial host Corynebacterium glutamicum is a promising target to rise productivities of growth coupled product formation. As a prerequisite, detailed knowledge about the tight regulation network is necessary for identifying promising metabolic engineering goals. Here, we present comprehensive metabolic and transcriptional analysis of C. glutamicum ATCC 13032 growing under glucose limited chemostat conditions with μ = 0.2, 0.3, and 0.4 h–1. Intermediates of central metabolism mostly showed rising pool sizes with increasing growth. 13C-metabolic flux analysis (13C-MFA) underlined the fundamental role of central metabolism for the supply of precursors, redox, and energy equivalents. Global, growth-associated, concerted transcriptional patterns were not detected giving rise to the conclusion that glycolysis, pentose-phosphate pathway, and citric acid cycle are predominately metabolically controlled under glucose-limiting chemostat conditions. However, evidence is found that transcriptional regulation takes control over glycolysis once glucose-rich growth conditions are installed.
Introduction
Corynebacterium glutamicum, discovered in 1957 as a soil bacterium, has gained prominent acceptance in industry for the production of amino acids, organic acids, and even proteins (Hermann, 2003; Wendisch et al., 2006; Freudl, 2017). Beside the broad availability of fine-tuned tools to genetically engineer the strain, C. glutamicum offers intrinsic features which are of high interest for use in industrial production. In particular, the robustness for large-scale application is one of its outstanding traits (Vertès et al., 2012).
However, a putative drawback lies in the somewhat reduced growth rates compared to other hosts such as Escherichia coli. With about 0.4 h–1 wild-type (WT) C. glutamicum shows only moderate growth in synthetic media in classical batch cultivations (Blombach et al., 2013; Grünberger et al., 2013; Graf et al., 2018; Haas et al., 2019) compared to about 0.7–0.8 h–1 maximum growth rate of other prokaryotes such as E. coli, 1.7 h–1 for the putative future competitors Vibrio natriegens (Hoffart et al., 2017) and Geobacillus LC300 with 2.15 h–1 (Long et al., 2017). Relatively low space-time yields compared to other hosts may be the consequence. Therefore, several authors have tried to boost the growth of C. glutamicum applying growth evolution studies aiming for a “natural” selection of a faster growing C. glutamicum strain (Pfeifer et al., 2017; Wang et al., 2018; Graf et al., 2019). As a result, several gene mutations were identified serving as putative targets for metabolic engineering toward higher growth under controlled conditions.
Besides these efforts to accelerate the growth rate, other studies aimed to at understand growth regulation of C. glutamicum deciphering potential limitations to improve growth coupled productivities (Grünberger et al., 2013; Unthan et al., 2014). More precisely, the cell’s intrinsic regulation was analyzed by employing tools from the systems biology toolbox, i.e., metabolomics, transcriptomics, fluxomics, and proteomics. An essential prerequisite for these “omics” disciplines is the establishment of highly reproducible and stable experimental cultivation environments (Hoskisson and Hobbs, 2005; Bull, 2010). Therefore, continuous bioprocess setups are commonly used since they make it possible to grow a cell population in a metabolic steady state by limiting one growth substrate, e.g., the carbon source. Manipulation of the dilution rate translates to an adjustment of limiting substrate supply whereby the growth rate of the investigated strain can be ultimately set to a precise rate. With regard to C. glutamicum WT ATCC 17965, continuous chemostat processes were performed by Cocaign-Bousquet et al. (1996) to examine growth kinetics and glucose consumption at μ = 0.1–0.55 h–1. Their results hinted at the presence of a secondary transport system for glucose beside the phosphotranferase system (PTS) which was confirmed by two different groups later (Ikeda et al., 2011; Lindner et al., 2011). Silberbach et al. (2005) were among the first to perform systems biology analysis on C. glutamicum ATCC 13032 by analyzing the cell’s transcriptional and proteomic response to ammonium limitation at two different growth rates. They identified growth rate dependent expression of ribosomal proteins and of F0F1 subunits of ATP-synthase. Another study with a systems biology viewpoint was recently performed by Noack et al. (2017) conducting chemostat cultivations to record the proteomic response of C. glutamicum WT ATCC 13032 within a broad range of growth rates (μ = 0.05–0.35 h–1). Under the tested glucose-limited growth conditions, Noack et al. (2017) concluded that metabolic fluxes within C. glutamicum’s central carbon metabolism are likely more affected by concentrations of local substrates and allosteric metabolite effectors than by the concentration of enzymes. Recently, another systems biology study was performed in traditional non-substrate limited batch cultivations to investigate determinants of global regulation orchestrating the growth of C. glutamicum (Haas et al., 2019). The so-called growth modulon was discovered by investigating transcriptional dynamics of strains in batch cultivation. Growth control was observed to be well distributed within a tightly networked system of transcriptional regulators controlling different branches of central metabolism.
Based on these recent systems biology insights, the current study tries to broaden knowledge about the strain’s metabolic, transcriptional, and fluxomic response to different growth rates. Accordingly, we continuously cultivated C. glutamicum under glucose-limited growth conditions setting dilution rates of 0.2, 0.3, and 0.4 h–1, applying the same strain as Haas et al. (2019). We analyzed whether the transcriptional regulatory response identified in glucose-rich batch cultures is similar to the one operational under chemostat conditions at similar growth rates. Thereof we investigated how comparable transcriptional data of batch and continuous culture are. In other words we wonder: How similar are regulatory patterns of C. glutamicum growing with equal rates but under different nutrient availability?
Materials and Methods
Bacterial Strain and Pre-culture Cultivation
All cultivations of this study were performed with the WT strain C. glutamicum ATCC 13032 obtained from the American Type Culture Collection (ATCC, Manassas, VA, United States). Cells from a glycerol stock working cell bank were spread on 2 × tryptone-yeast extract (2 × TY) medium (Sambrook, 2001) agar plates and incubated for 48–60 h at 30°C. Thereof, extracted colonies served to inoculate 5 mL sterile 2 × TY medium in glass reaction tubes and were incubated for 8 h at 30°C on a bench-top rotary shaker (Infors HT, Bottmingen, Switzerland) at 120 rpm. Subsequently, individual shaking flasks filled with 50 mL of sterile CGXII minimal medium (Grünberger et al., 2013) supplemented with 40 g L–1 glucose were inoculated with the pre-culture content of one glass reaction tube, respectively. Shaking flask pre-cultures were incubated overnight at 30°C and 120 rpm.
Continuous Bioreactor Cultivations
Bioreactor Setup
Continuous chemostat processes with C. glutamicum were conducted in a 3 L steel bioreactor (KLF 2000, Bioengineering, Switzerland) equipped with process control (Lab view 2010, National Labs). Cooling and heating elements and a temperature sensor (Pt100, Bioengineering, Switzerland) ensured constant cultivation temperature of 30°C. Mixing was realized with a six blade Rushton turbine. A pressure probe (PR-35 X HT, KELLER Druckmesstechnik, Jestetten, Germany) and an automatic exhaust valve were installed at the head of the reactor to regulate pressure (1.5 bar). For aeration, compressed air was channeled through a mass flow controller (MFC GFC171S, Analyt-MTC GmbH, Müllheim, Germany) and filtered aseptically (Midisart® 2000, Sartorius Stedim Biotech, Goettingen, Germany) before entering the bioreactor. Dissolved oxygen was monitored by an amperometric pO2 electrode (InPro 6800, Mettler-Toledo, Germany) and pH with a conventional pH probe (405-DPAS-SC-K8S, Mettler-Toledo, Germany). Molar fractions of oxygen and carbon dioxide in the exhaust gas were measured by a sensor (BCP-O2/CO2, BlueSens, Germany).
To enable continuous processes in chemostat mode at fixed dilution rates (D, h–1) equaling the growth rate (μ, h–1; see section “Determination of Kinetic Parameters”), the advanced controller scheme described in Graf et al. (2019) was employed. Thereby, a defined reaction volume in the bioreactor was maintained and constant feed and harvest rates were ensured. Prior to all cultivations, the reactor was sterilized with 1 mol L–1 K2HPO4/KH2HPO4 buffer (pH 7) for 20 min at 121°C. Prior removal of the buffer, the drain of the reactor was sterilized in situ with pure steam for 10 min.
Chemostat Processes at μ = 0.2, 0.3, 0.4 h–1
All chemostat processes started with an initial batch cultivation. Therefore, sterile CGXII minimal medium (Grünberger et al., 2013) supplemented with 12 g D-glucose L–1 was pumped from a stirred sterile medium feed reservoir (later employed for continuous mode) into the sterile bioreactor until a volume of 1.4 L was reached. The required amount of C. glutamicum biomass from pre-culture shaking flaks (see section “Bacterial Strain and Pre-culture Cultivation”) was harvested and resuspended in 100 mL 9 g NaCl L–1 solution yielding an inoculation biomass density of 0.3 gCDW L–1 and a cultivation volume of 1.5 L. During batch and continuous cultivation, pH was controlled at 7.4 by automatically adding 25% (v/v) NH4OH solution. In batch mode, pO2 was maintained above 30% by 50 rpm stepwise increase of the impeller speed (initial: 250 rpm) and analogous rise of aeration rate by 0.15 L min–1 (initial: 0.15 L min–1). Antifoam agent (Struktol® J 647, Schill + Seilacher, Hamburg, Germany) was manually added when necessary. After about 7.5 h of exponential growth, the sharp increase of the pO2 signal indicated glucose depletion.
Thereupon, the continuous mode was initiated by starting the control regime (Graf et al., 2019), adding antifoam agent constantly and fixing impeller speed and aeration rate to 700 rpm and 1 L min–1, respectively. During the course of one continuous experiment, dilution rates of D = 0.2, 0.3, and 0.4 h–1 were sequentially installed. Constant antifoam concentrations were achieved by increasing related feed rates proportionally (80, 120, 160 μL h–1). Sampling of each growth rate was performed after at least five residence times (RTs), i.e., 25, 16.67, 12.5 h, respectively. Accordingly, the achievement of a metabolic steady state of the culture was ensured (Zamboni et al., 2009). Sampling comprised withdrawing biosuspension for biomass determination [optical density (OD600) and cell dry weight (CDW) measurements], providing cell-free filtrates for extracellular metabolite analyses, and determining total inorganic carbon (TIC) and organic carbon (TOC) as described in the Supplementary Material section “Analysis of Exometabolome.” Moreover, intracellular metabolome and transcriptome samples were taken and analyzed as described in the same Supplementary Material sections “Sampling, Quenching, and Extraction for Absolute Quantification of Intracellular Pool Concentrations” and “Flux Estimation,” respectively. Non-labeled intracellular pools were measured by HILIC-based QQQ-MS/MS analysis (see Supplementary Material section “LC-MS-Based Quantification of Intracellular Pool Concentrations and 13C-Labeling Dynamics”) and absolutely quantified by isotope dilution mass spectrometry (IDMS) with a constant addition of (U-13C)-labeled C. glutamicum extracts (see Supplementary Material section “Generation of Fully 13C-Labeled C. glutamicum extracts for IDMS”). Apart from transcriptome samples, conventional and metabolome samples were withdrawn 3× in 1.5 h intervals at each growth rate. Continuous chemostat processes at D = 0.2, 0.3, and 0.4 h–1 were conducted in biological triplicates following the described scheme.
13C-Labeling Experiment
The 13C-carbon labeling experiment (CLE) in chemostat mode (D = 0.4 h–1) was initiated with a batch cultivation as described in section “Chemostat Processes at μ = 0.2, 0.3, 0.4 h–1,” but aiming for a working volume of 1.2 L instead of 1.5 L. Therefore, 1.1 L sterile CGXII minimal medium (Grünberger et al., 2013) supplemented with 12 g D-glucose L–1 was retrieved from the sterile feed reservoir and stirrer speed and aeration were set to 600 rpm and 0.8 L min–1, respectively.
Unlimited batch growth prevailed for 7.45 h (μ = 0.42 h–1) until glucose was depleted from the medium. The continuous mode was started by feeding fresh supplemented CGXII medium with a dilution rate of 0.4 h–1 while keeping the working volume constant (1.2 L) and constantly feeding 200 μL h–1 antifoam agent to prevent excessive foaming. After 12.5 h equaling five RTs, online measurements of O2 and CO2 in the exhaust gas indicated a metabolic steady state of the culture. Conventional sampling was performed as described in Supplementary Material section “Analysis of Exometabolome.” After five more RTs (12.5 h), the CGXII medium feed containing non-labeled (U-12C)-D-glucose was switched to labeled CGXII feed containing 67% (U-13C)-D-glucose and 33% (1-13C)-D-glucose according to the previously performed tracer design (see section “A priori Tracer Design”). After four RTs (10 h), samples for intracellular isotopologue metabolome analyses were withdrawn (see Supplementary Material section “Sampling, Quenching, and Extraction for Quantification of 13C-Isotopic Labeling Dynamics”) as a stationary isotopic enrichment in C. glutamicum’s intracellular metabolites was expected at this time. Isotopic distributions of 13C-labeled and non-labeled intracellular pools of analog samples were quantified by HILIC-based QTOF-HRMS analysis (see Supplementary Material section “LC-MS-Based Quantification of Intracellular Pool Concentrations and 13C-Labeling Dynamics”). For technical replicates of this measurement, intracellular metabolome samples were withdrawn 30, 20, and 10 min before reaching four RTs, and 10 min afterward.
Transcriptome Analysis
Transcriptome sampling was performed by withdrawing 1 mL biosuspension from the bioreactor, centrifuging at 20,817 × g and 4°C for 30 s (5430 R, Eppendorf, Hamburg, Germany), discarding the supernatant and immediately quenching the biomass pellet in liquid nitrogen. Extraction and isolation of RNA from the samples, whole transcriptome sequencing, read mapping, and raw read count calculation was performed as described in Haas et al. (2019). The raw sequencing data have been deposited in the ArrayExpress database at EMBL-EBI under accession number E-MTAB-9371. Transcript data analysis was performed using R version 3.5.0. Raw read counts were normalized using the Relative Log Expression function of the DESeq2 (Love et al., 2014) package. Differential gene expression was determined using the maSigPro (Nueda et al., 2014) package in “generalized linear model” mode. Clustering of the genes according to expression trend was performed through hclust as implemented in maSigPro.
13C-Metabolic Flux Analysis: Modeling and Computational Procedures
Metabolic Network Model for 13C-MFA
The metabolic network model of C. glutamicum WT was taken from Kappelmann et al. (2016) and slightly modified for experimental design and flux fitting (see Supplementary Material section “13C-MFA”). The models were composed according to the workflow described in Nöh et al. (2015) and formulated in FluxML format (Beyß et al., 2019). The models contain the major pathways of central carbon metabolism such as glycolysis, pentose phosphate pathway (PPP), anaplerotic reactions, tricarboxylic acid (TCA) cycle, and all pathways for amino acid synthesis. In addition, protocatechuic acid (PCA) oxidation into the TCA cycle was taken into account (Unthan et al., 2014). A lumped biomass equation was formulated representing the cellular composition (Eggeling and Bott(eds), 2005). Transport reactions were considered for glucose, PCA and carbon dioxide (CO2). Carbon atom transitions were formulated for each reaction. For reactions with C-symmetric reactants (in the TCA cycle and lysine synthesis), scrambling reactions were introduced and for each variant equal fluxes assumed. The metabolic model used for flux fitting comprises 45 balanced intracellular and 4 non-balanced extracellular metabolite pools, connected through 87 metabolic reactions (22 bidirectional and 65 unidirectional). The model has 27 degrees of freedom (7 net and 20 exchange fluxes), whereas the network model used for tracer design was slightly simpler (22 free parameters, 5 net fluxes, and 17 exchange fluxes). Full model specifications are provided in the Supplementary Data FluxML Files.
A priori Tracer Design
To determine an informative, yet cost efficient tracer mixture for the CLE at D = 0.4 h–1, an experimental design study was performed using the high-performance simulation framework 13CFLUX2 (Möllney et al., 1999; Weitzel et al., 2013). To this end, a measurement configuration was formulated on the basis of a previous 13C-tracer quantification study (Feith et al., 2019), and six glucose tracers were considered [(U-12C)-, (U-13C)-, (1-13C)-, (1,2-13C)-, (6-13C)-, and (5,6-13C)-D-glucose]. The model used for the design as well as the assumed measured fragments and rates including their corresponding expected errors are detailed in the Supplementary Material section “Model Setup.”
External Rate Estimation
For the CLE at D = 0.4 h–1, extracellular biomass-specific rates (growth rate μ, glucose consumption rate rGLC, CO2-production rate rCO2, PCA uptake rate rPCA) were estimated using an ODE-based bioprocess model adapted from Cerff et al. (2013) (see details in Supplementary Material section “Bioprocess Model Used for External Rate Estimation”). Model parameters were estimated using weighted least squares regression. Standard deviations of model parameters were estimated using Monte-Carlo simulations (1,000 runs with random initial parameter values). Estimates of biomass-specific rates including their errors were used for 13C-metabolic flux analysis (13C-MFA). The bioprocess model was implemented in Matlab (Mathworks, Natick, MA, United States). Monte Carlo simulations were performed with custom Matlab scripts.
Intracellular Flux Estimation
After measurements became available, metabolic fluxes were estimated by minimizing the variance-weighted sum of squared residual (SSR) between the simulated quantities and the measurements, i.e., the extracellular biomass specific rates (Supplementary Table 3) and mass isotopomer distributions (MIDs; see Supplementary Material section “Flux Estimation”). Prior to 13C-MFA, raw MIDs were corrected for natural isotope abundance using the ICT-toolbox (Jungreuthmayer et al., 2016). Corrected MIDs were derived for the sample taken at t = 10.17 h after introduction of 13C-label. MID standard deviations were set to 2.5 mol%, based on analytical experience and supported by the analysis of four samples drawn in the isotopic quasi-stationary regime (9.67–10.17 h after introduction of 13C-tracer). In total 170 measurements (164 labeling data for 28 metabolites and 6 biomass-specific extracellular rates) were used to determine 55 model parameters (27 free fluxes and 28 measurement group scale factors).
Flux estimation was performed using 13CFLUX2 using the optimizer LINCOA (Powell, 2015) and the NAG optimization toolbox (National Algorithms Group, Oxford, United Kingdom). To minimize the risk of suboptimal local regression solutions, a multi-start heuristic was applied combining gradient-free (LINCOA) and gradient-based (NAG) optimizers, which was initialized 1,000 times from random starting flux distributions. The set of fluxes that resulted in the minimum weighted deviation between experimentally observed (MID and extracellular rates) and simulated data was reported as best flux estimate for the in vivo flux distribution. Statistical analysis was performed according to the method described in Wiechert et al. (1997), yielding simultaneous flux confidence intervals.
Determination of Kinetic Parameters
Growth Rate
According to the continuous mass balance (cf. Eq. 1 in Supplementary Material section “Bioprocess Model Used for External Rate Estimation”) and under the assumption of metabolic stationarity of the culture, the set dilution rate D (in h–1) equals the exponential growth rate μ (in h–1) of the culture:
Metabolic steady states were ensured by employing the controller scheme described in Graf et al. (2019).
Biomass Specific Glucose Consumption Rate and Biomass-Glucose Yield
According to the continuous glucose mass balance (cf. Eq. 2 in Supplementary Material section “Bioprocess Model Used for External Rate Estimation”) and under the assumption of metabolic stationarity of the culture, the biomass-specific glucose consumption rate qGLC (in g gCDW–1 h–1) is:
where cGLC,feed (in g L–1) is the glucose concentration of the feed medium and cX (in g L–1) is the biomass concentration of the culture. Residual glucose in cell free biosuspension samples was below the detection limit and was therefore neglected in the calculation.
Furthermore, the biomass-glucose yield (YX,GLC) was determined by:
Respiratory Rates
Biomass-specific respiratory rates (qO2, qCO2) were calculated by dividing volumetric oxygen consumption or carbon dioxide emission rates by the biomass concentration determined at set dilution rate (cf. Eq. 9 in Supplementary Material section “Bioprocess Model Used for External Rate Estimation”). The carbon dioxide emission rate was corrected by TIC-measurements using a total carbon-analyzer (Multi N/C 2100s, Analytik Jena, Jena, Germany).
Results
Chemostat Cultivations at μ = 0.2, 0.3, and 0.4 h–1
Continuous Processes and Kinetic Parameters
Three biological replicates (A–C, Figure 1) were conducted in chemostat mode employing CGXII minimal medium (Grünberger et al., 2013) supplemented with 12 g D-glucose L–1. After about 7.5 h batch phase [μmax = (0.44 ± 0.01) h–1] the continuous mode was started with a dilution rate D = 0.2 h–1 (process time = 0), which was increased to 0.3 h–1 after ca. 28 h and to D = 0.4 h–1 after ca. 49 h. Three independent samples for OD, CDW, filtrate TC/TIC, metabolome, and transcriptome were withdrawn after five RTs within 1.5 h-intervals to monitor the respective metabolic steady-states at D = 0.2, 0.3, and 0.4 h–1.
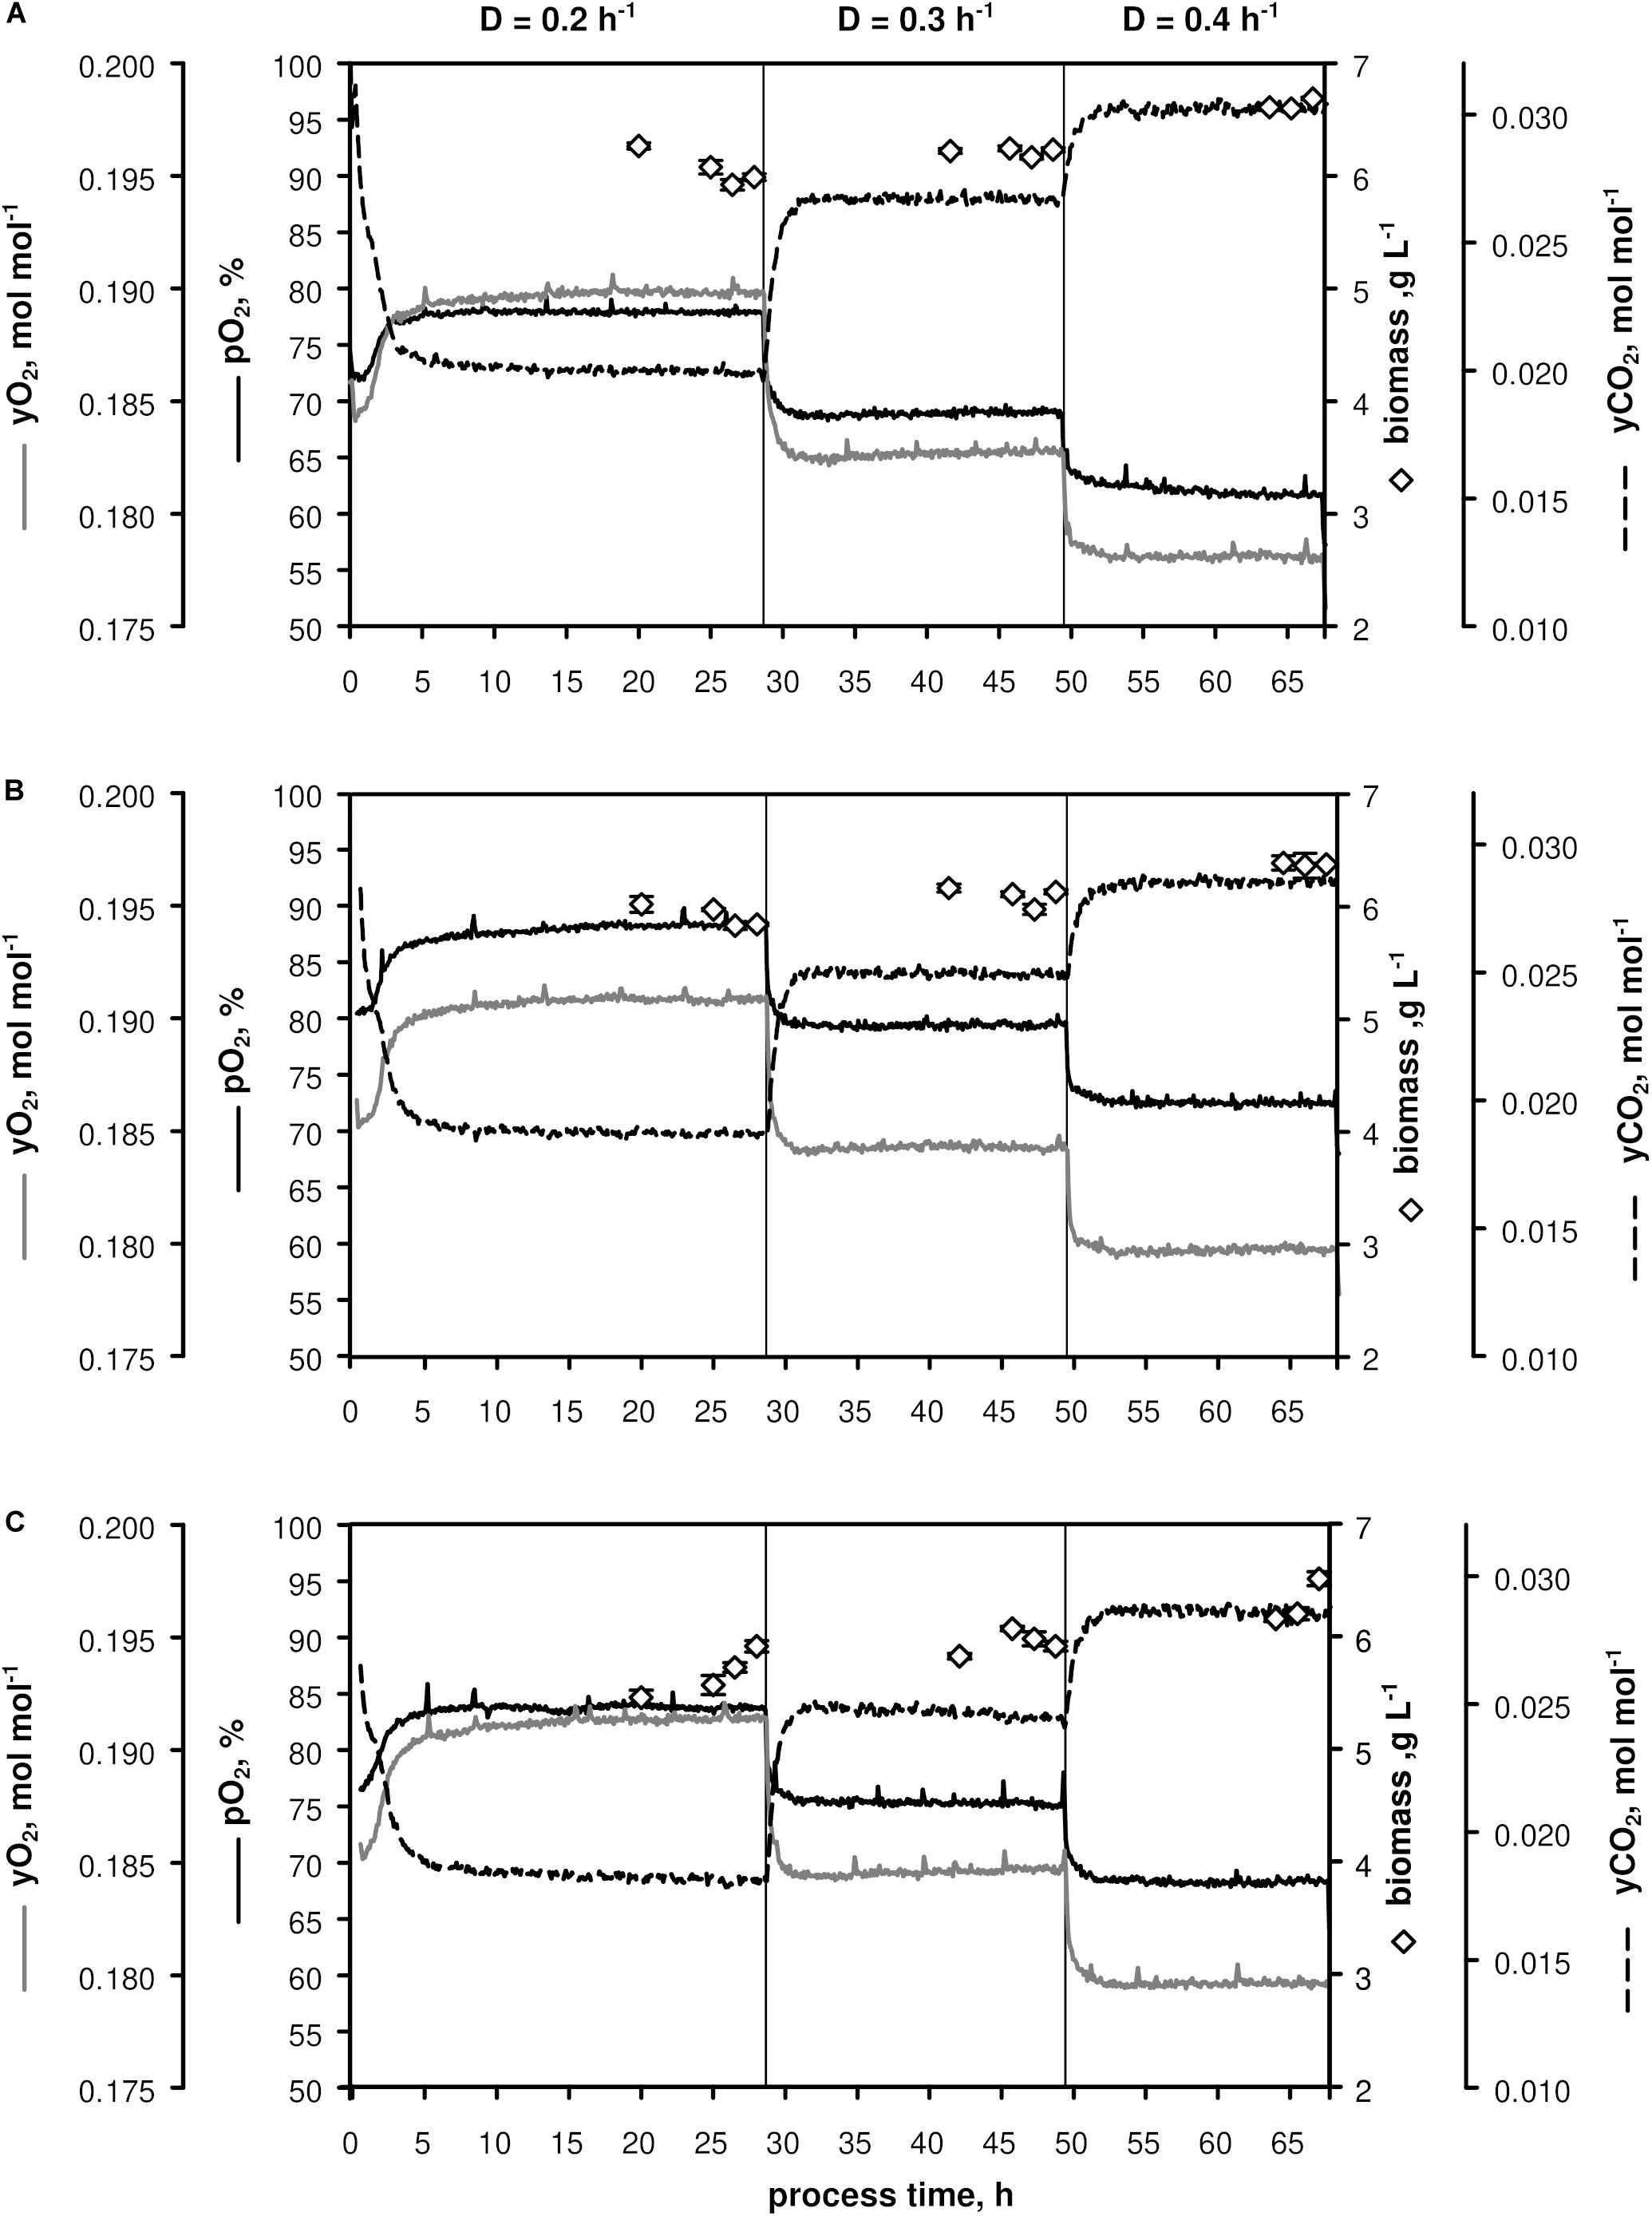
Figure 1. Process parameters of triplicate chemostats (A–C) with C. glutamicum WT: dissolved oxygen (pO2), off-gas molar oxygen (yO2) and carbon dioxide (yCO2), biomass concentration (black diamonds). The dilution rate (D) was set to 0.2, 0.3, and 0.4 h– 1 and sampling was performed after five residence times. Stirrer speed and aeration remained at 700 min– 1 and 0.67 vvm, respectively. Depicted standard deviations of biomass measurements were calculated from three technical replicates per sample.
As illustrated in Figure 1, only minor differences occurred between the triplicates mirroring slightly varying feed glucose concentrations (cGLC,feed = 12.47 ± 0.35 g L–1). Biomass levels elevated from 5.87 ± 0.13 to 6.43 ± 0.18 g L–1 with rising D. By analogy, glucose-to-biomass yields rose from 0.47 ± 0.01 to 0.52 ± 0.00 g gCDW–1 (Table 1) which caused partially growth coupled changes of qGLC, qO2, and qCO2. Respiratory quotients (RQ) remained at 1. All carbon balances closed well with 99 ± 1, 98 ± 2, and 96 ± 3% for the growth rates μ = 0.2, 0.3, and 0.4 h–1, respectively (data not shown). No residual glucose or C. glutamicum typical by-products such as acetate or pyruvate (Yokota and Lindley, 2005; Han et al., 2008a), lactate or alanine (Blombach et al., 2013) were detectable in biomass-free filtrates analyzed with non-targeted HILIC-QTOF-HRMS (Feith et al., 2019). The growth decoupled maintenance parameters mS = (0.44 ± 0.04) mmol D-glucose gCDW–1 h–1 and the growth coupled real glucose-to-biomass yield 1/YXGLC,real = 9.73 ± 0.08 mmol gCDW–1 (Pirt, 1982) are illustrated in Figure 2.
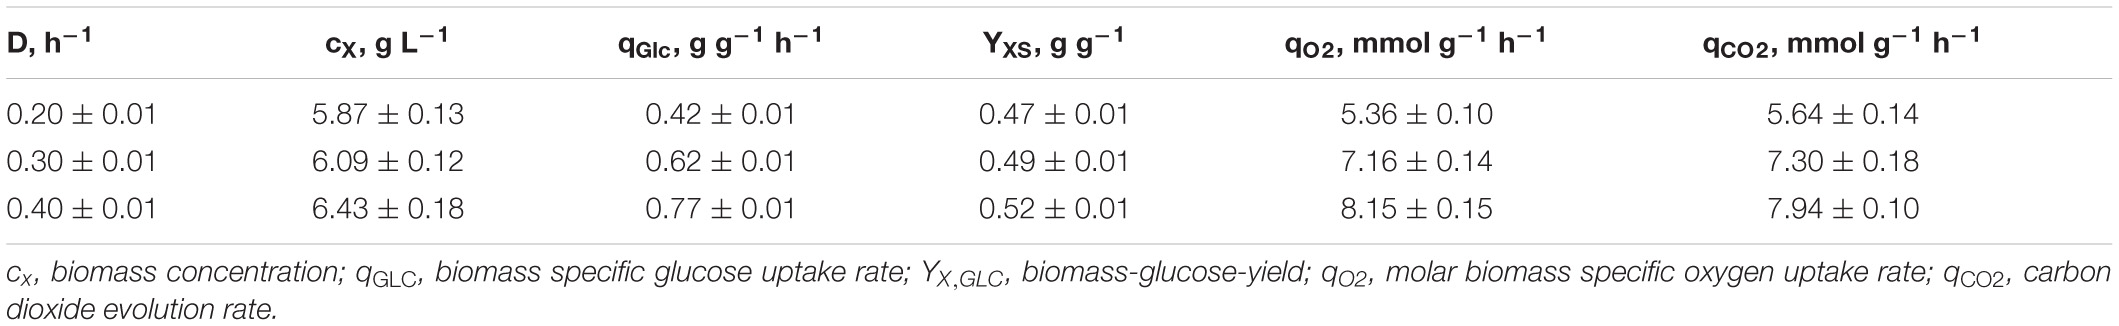
Table 1. Listing of kinetic process parameters ± standard deviation calculated from three individual chemostat processes (A, B, C; Figure 1) with C. glutamicum cultivated in CGXII medium supplemented with (12.47 ± 0.35) g D-glucose L–1.
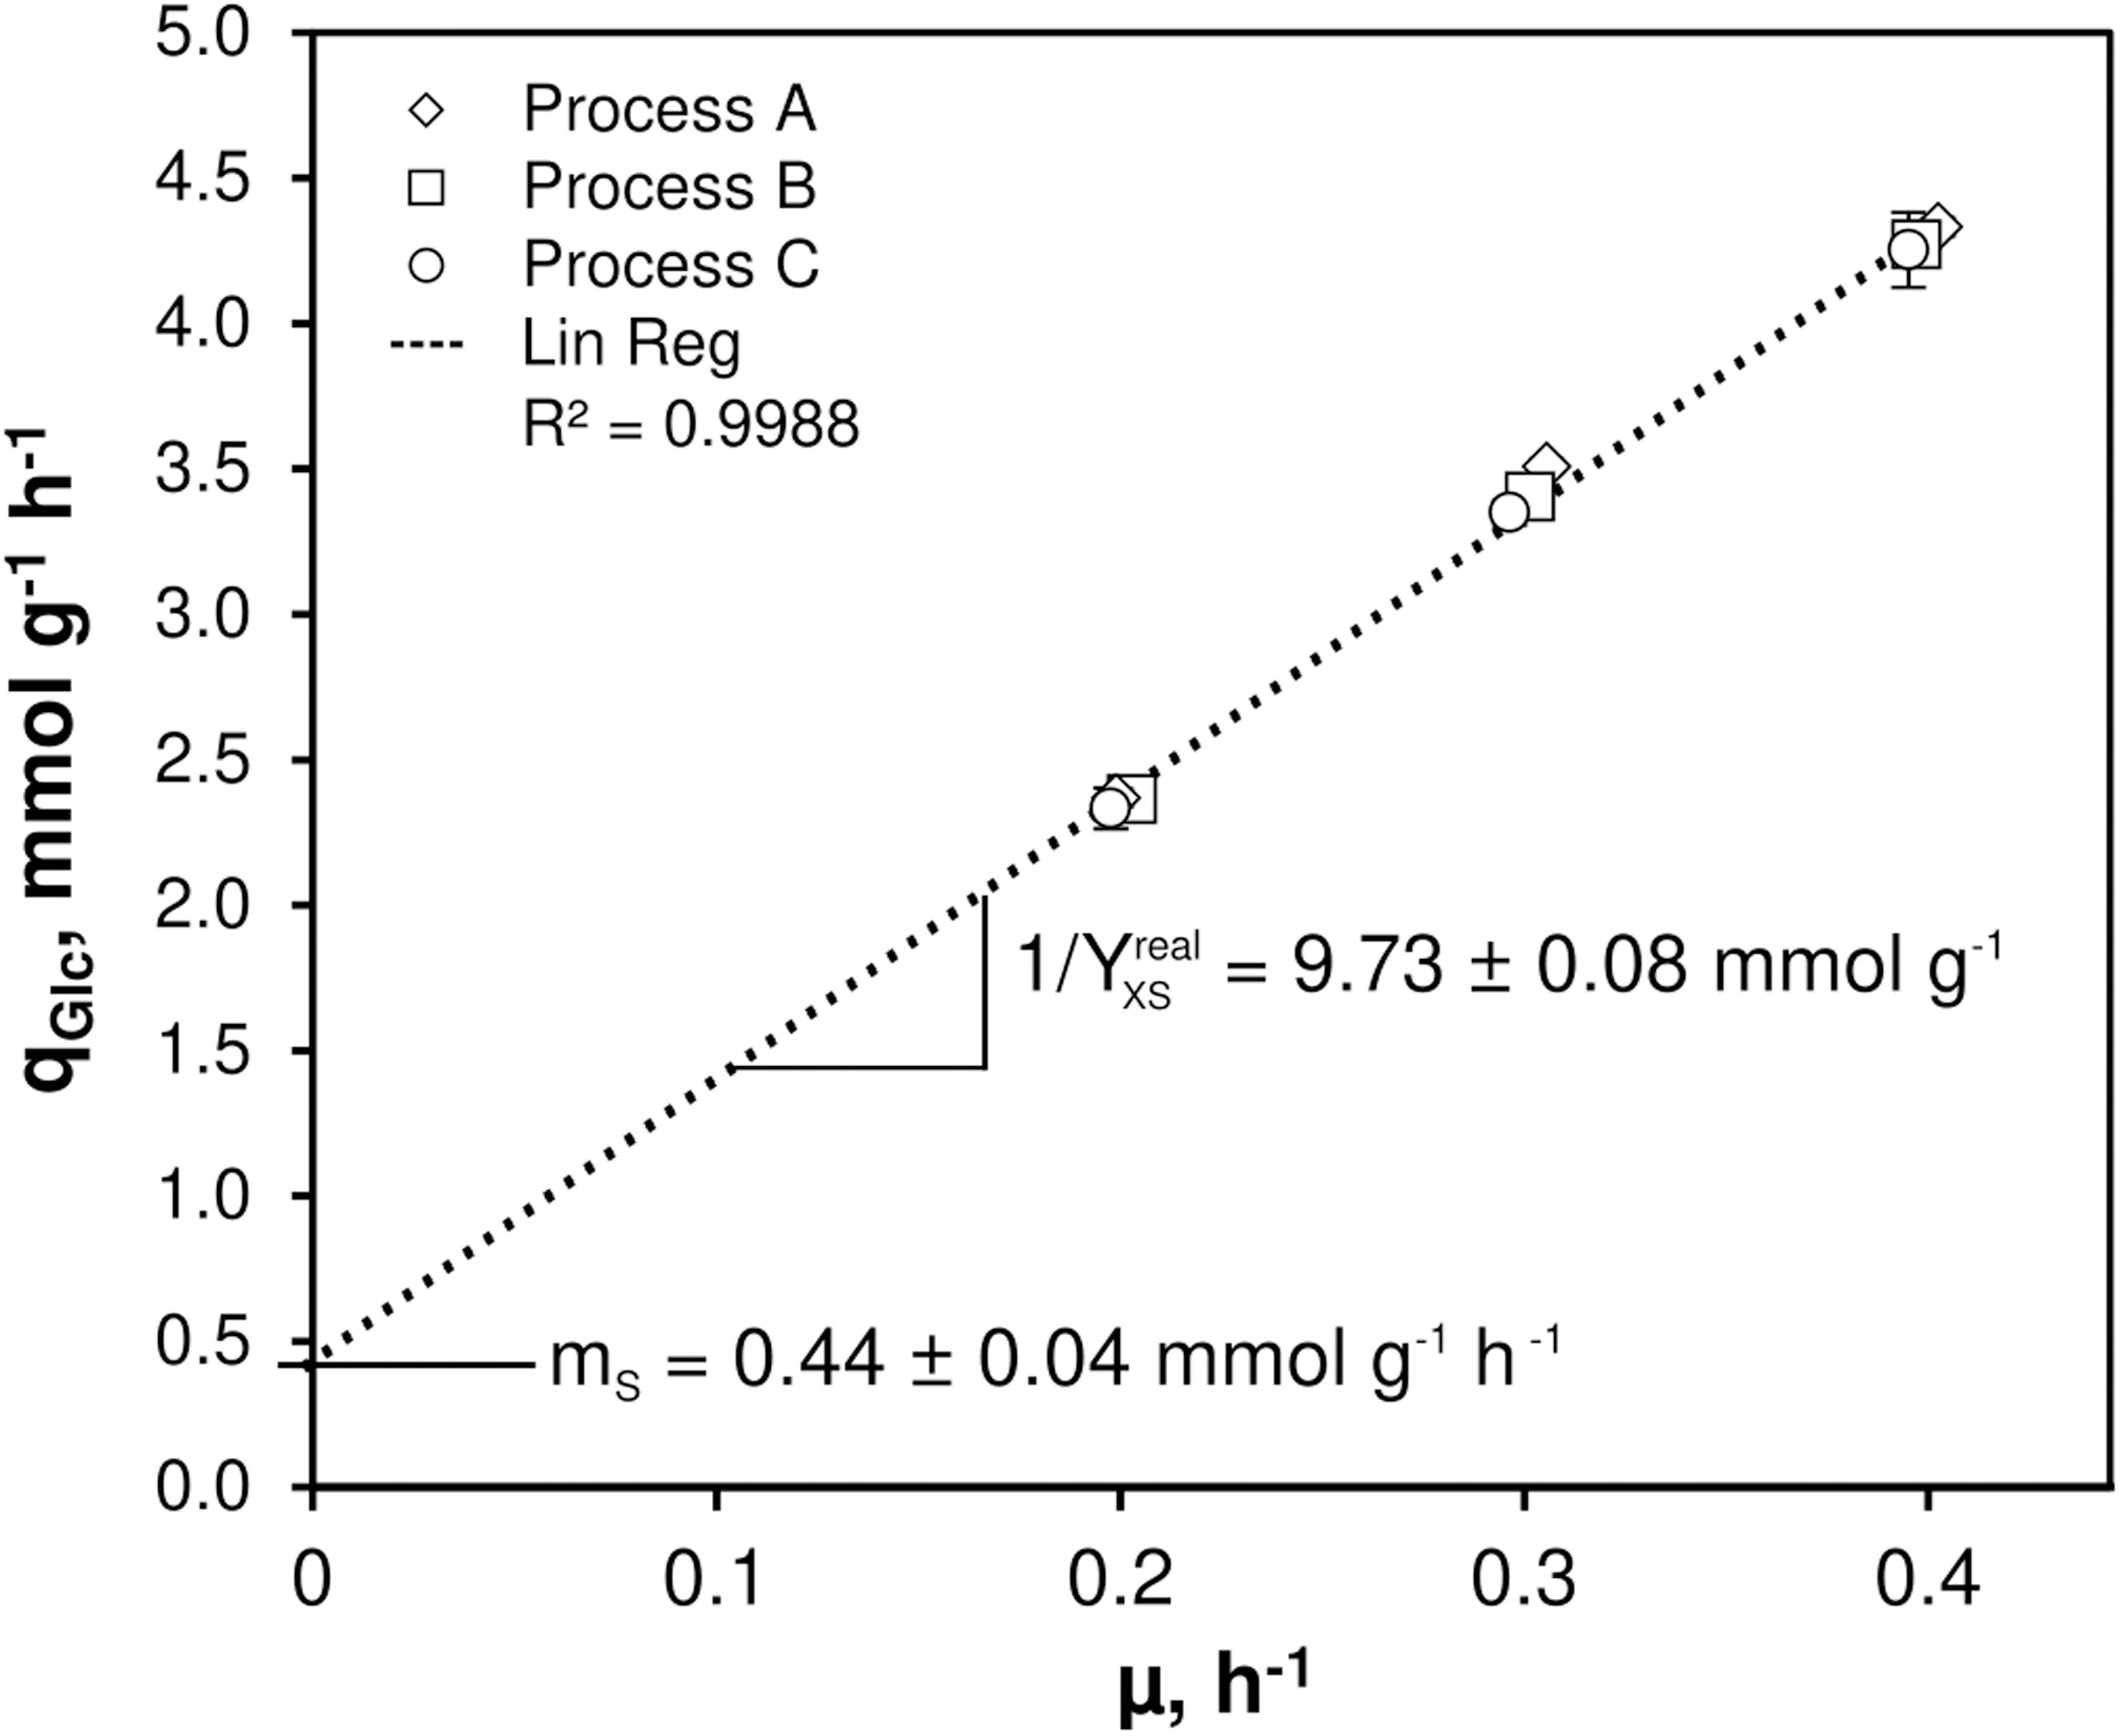
Figure 2. Determination of non-growth rate associated maintenance parameter (mS) and growth rate associated maintenance parameter (1/Yreal,xGLC) for C. glutamicum WT. Growth rates (μ) and corresponding glucose consumption rates (qGLC) derived from three individual continuous chemostat processes (A, B, C) built the basis for the linear regression revealing mS and 1/Yreal,xGLC as indicated. The strain was cultivated in CGXII minimal medium supplemented with 30 mg PCA L– 1 and 12 g D-glucose L– 1 as carbon source. Mean values ± standard deviations were calculated from three technical replicates per growth rate installed in each process.
Metabolomics
To account for slightly increasing biomass concentrations, the volumes of extraction solution were adjusted for each sample yielding equal amounts of extracted biomass. Mean values and variances are listed in the Supplementary Material Excel File reflecting the analysis of technical and biological replicates (see Figure 1). As indicated in Table 2, biomass specific pools ranged between 0.01 μmol gCDW–1 [L-asparagin (ASN)] and 250 μmol gCDW–1 [L-glutamate (GLU)]. Very good reproducibility of pool sizes was found in biological replicates with low standard errors between 2 and 8%. Few exceptions are the cumulated citrate/isocitrate (CIT/ICIT) and L-proline (PRO) pools revealing standard errors of 13 and 25% at μ = 0.2 h–1. Noteworthy, most pool sizes changed proportionally with growth assigning μ = 0.2 h–1 either minimum or maximum contents (see Figures 3, 4 and Supplementary Figure 1). The majority of metabolite pools increased with rising μ resulting in 1.2 to 11 times higher concentrations at μ = 0.4 h–1 compared to μ = 0.2 h–1.
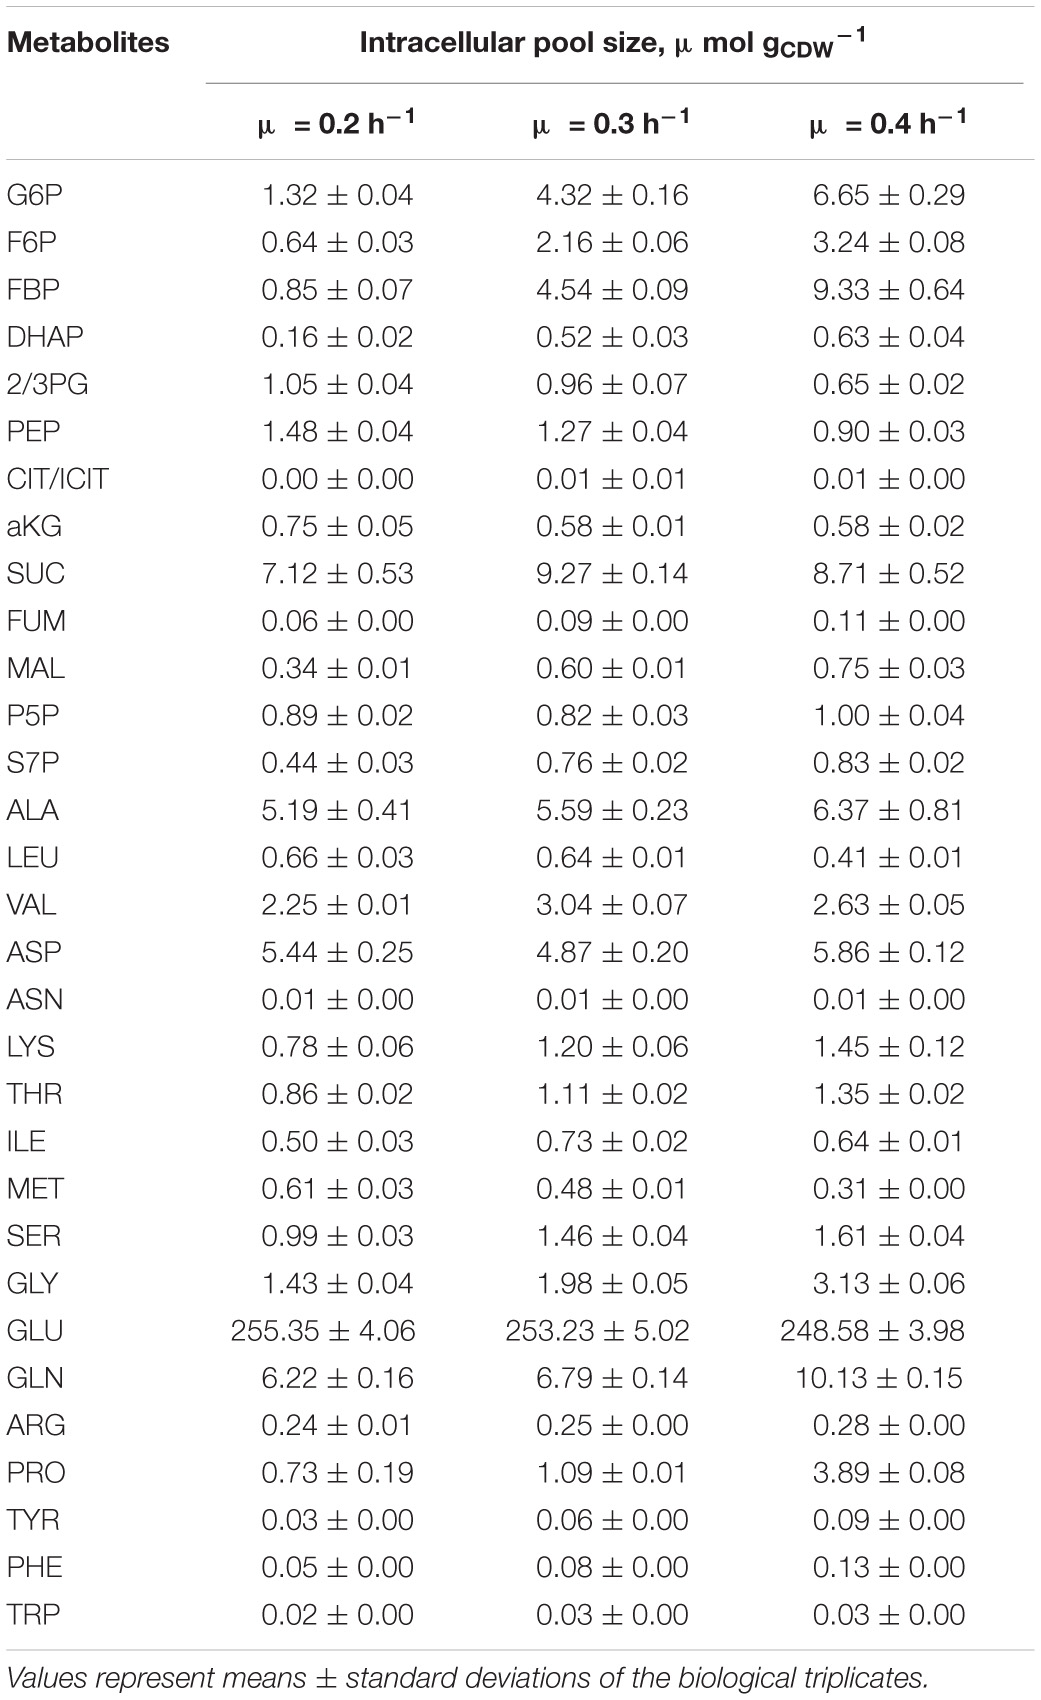
Table 2. Biomass specific metabolite pool concentrations obtained with the fast-centrifugation treatment and hot-water-extraction from three biological replicates of C. glutamicum cultures cultivated in chemostat mode (processes A, B, C) at growth rates of 0.2, 0.3, and 0.4 h–1 (Figure 1).
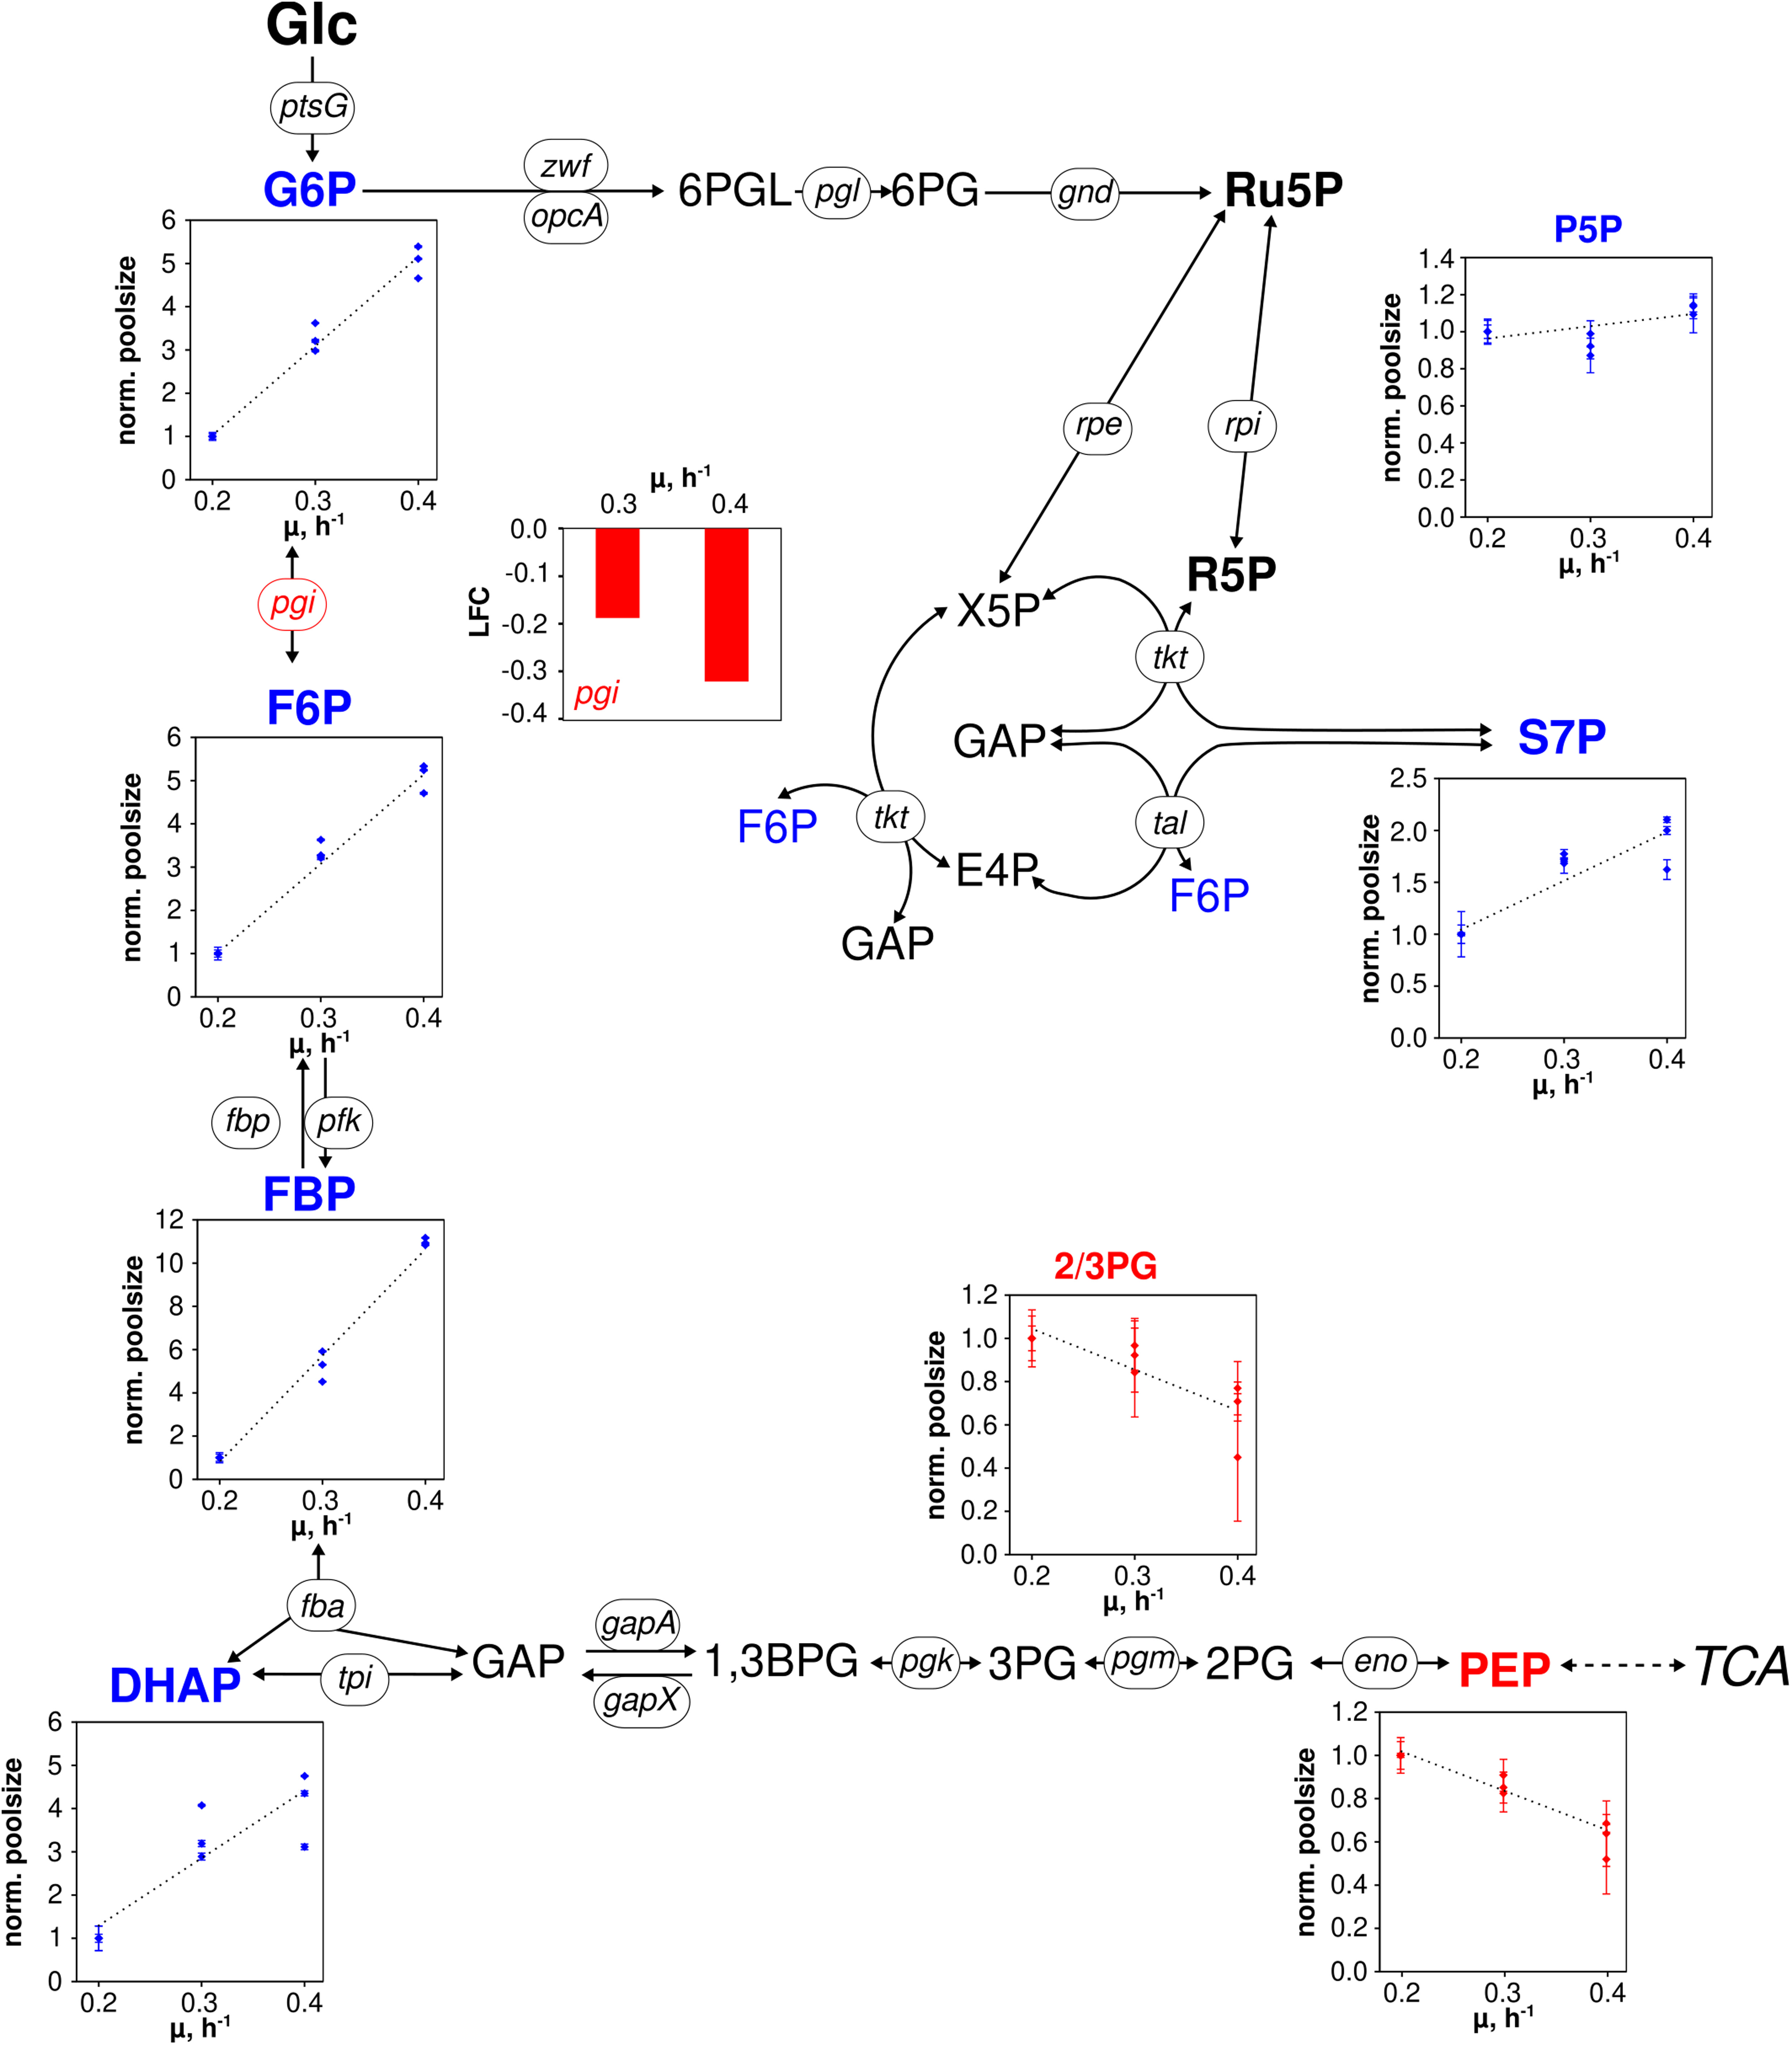
Figure 3. Metabolic and transcriptional response in glycolysis and pentose phosphate pathway of C. glutamicum WT to different growth rates (μ = 0.2, 0.3, 0.4 h– 1) installed in three independent chemostat processes. Depicted intracellular metabolite concentrations were normalized to respective values determined at μ = 0.2 h– 1; values represent the mean of three technical replicates ± standard deviation. Gene expression was normalized to the expression level determined at μ = 0.2 h– 1 and is depicted as log fold change (LFC); genes are shown in italic writing. Color code: red, decreasing concentration/expression; blue, increasing concentration/expression.
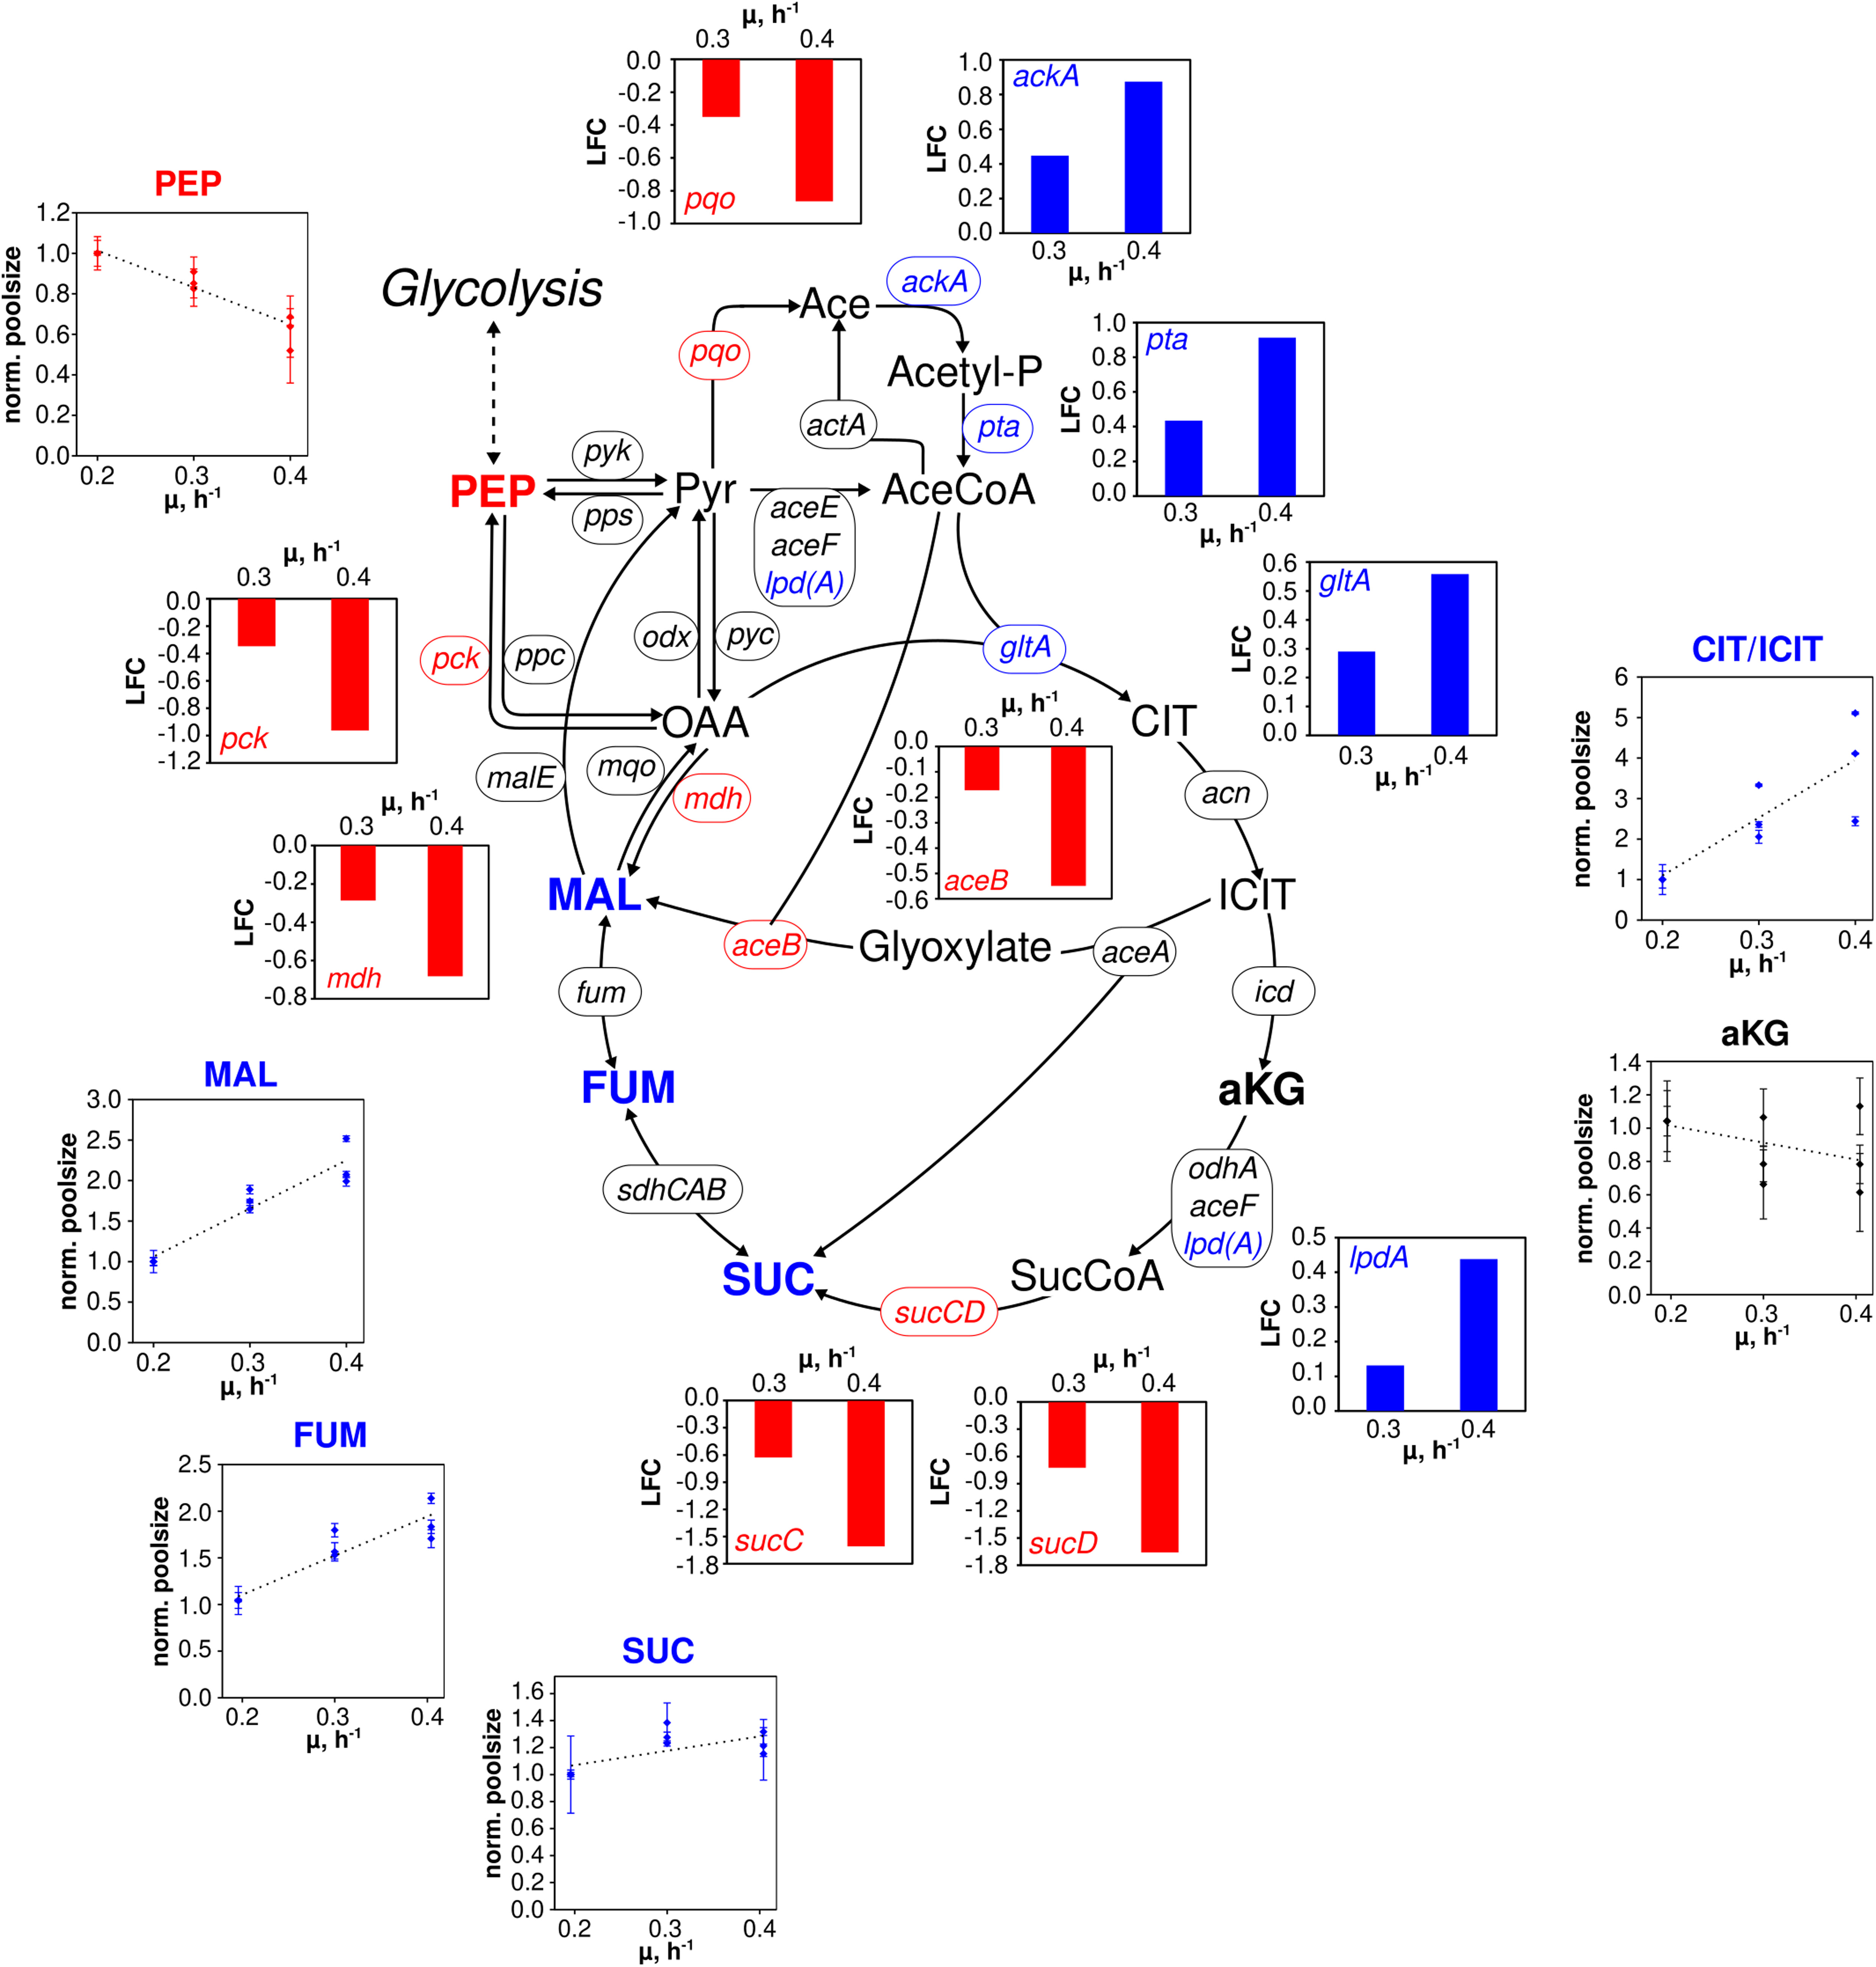
Figure 4. Metabolic and transcriptional response in the TCA cycle of C. glutamicum WT to different growth rates (μ = 0.2, 0.3, 0.4 h– 1) installed in three independent chemostat processes. Depicted intracellular metabolite concentrations were normalized to respective values determined at μ = 0.2 h– 1; values represent the mean of three technical replicates ± standard deviation. Gene expression was normalized to the expression level determined at μ = 0.2 h– 1 and is depicted as log fold change (LFC); genes are shown in italic writing. Color code: red, decreasing concentration/expression; blue, increasing concentration/expression.
To be precise, metabolites of upper glycolysis [glucose 6-phosphate (G6P), fructose 6-phosphate (F6P), fructose 1,6-bisphosphate (FBP), dihydroxyacetone phosphate (DHAP)] linearly increased 5- to 11-fold from μ = 0.2 to 0.4 h–1 which is contrasted by intermediates of lower glycolysis [pool of 2-/3-phosphoglyceric acid (2/3PG), phosphoenolpyruvate (PEP)] decreasing about 40% in pool size (Figure 3). In PPP, the summed pool of pentose 5-phosphate sugars (P5P), i.e., ribose 5-phosphate and ribulose 5-phosphate, showed comparably stable pool concentrations (10% decrease at μ = 0.3 h–1, 10% increase at μ = 0.4 h–1 compared to pool at μ = 0.2 h–1), whereas sedoheptulose 7-phosphate (S7P) revealed a steady rise.
In the TCA cycle (Figure 4), remaining trends are observed for alpha ketoglutarate (aKG) and succinate (SUC). In contrast, fumarate (FUM) and L-malate (MAL) showed linear increases between 1.5- and 2-fold over μ. By trend, amino acids, building blocks of protein synthesis, predominately showed rising pool sizes with increasing growth (Supplementary Figure 1). Few exceptions were L-aspartate (ASP), ASN, and GLU which persisted and L-leucine (LEU) and L-methionine (MET) with even decreased concentrations.
Transcriptomics
Metabolic studies were complemented by transcript analysis identifying differentially expressed genes (DEGs) at μ = 0.2, 0.3, and 0.4 h–1. Noteworthy, the low growth rate served as reference. In total, 547 DEGs were found grouping in 257 with rising and 290 with decreasing DEGs (Figure 5). By trend, rather proportional correlations with μ were identified.
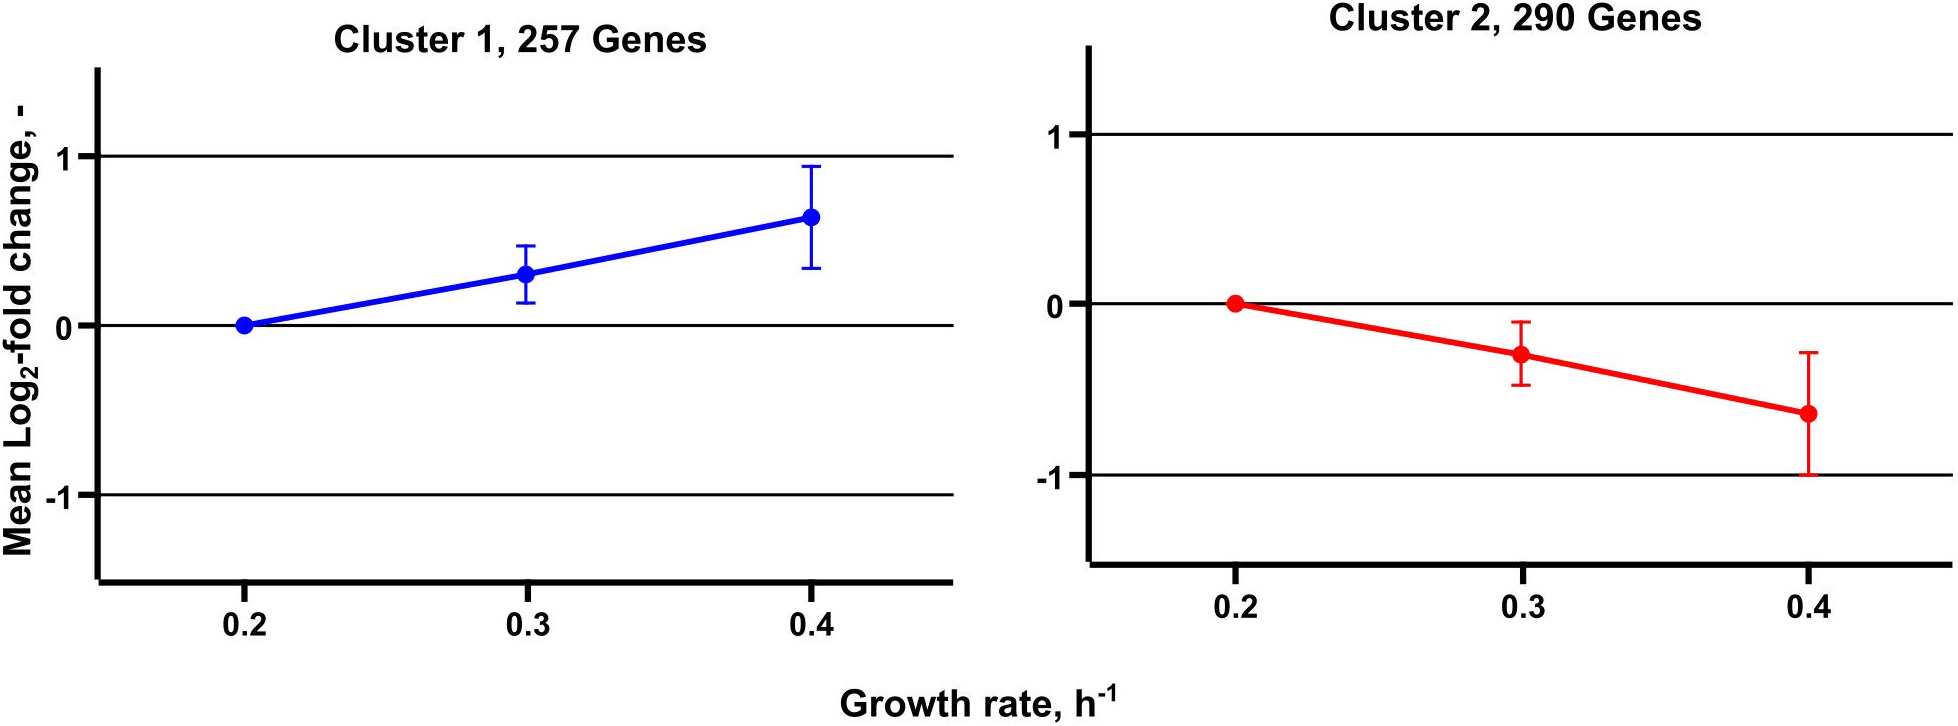
Figure 5. Median expression profiles of differentially expressed genes obtained from transcriptome analysis of C. glutamicum cells grown in chemostat cultivation. A total of 257 genes are grouped in cluster 1 and show an increasing trend, 290 genes are grouped in cluster 2 and show a decreasing expression trend.
Differentially expressed genes assigned to genes coding for central metabolism reactions are considered in Figures 3 and 4. Figure 3 comprises reactions of glycolysis and PPP. Notably, only pgi was identified as DEG mirroring that expression levels of all other genes persisted despite growth rise from 0.2 to 0.4 h–1. In case of pgi falling expression levels with increasing growth were detected.
By analogy, of the 28 genes presented in Figure 4 comprising the “extended TCA cycle,” 18 (64%) did not reveal any transcription dynamics with changing growth. Only four were up and six downregulated. Downregulation occurred for genes coding for the formation of MAL, PEP, pyruvate, acetate, and SUC via reducing expression levels of aceB, mdh, pck, pqo, sucC, and sucD, respectively. In particular, sucC and sucD showed strongest log fold changes (logFCs) with logFC = −1.5 whereas the majority of other DEGs reduction was −0.5 ≤ LFCmax ≤ −1. For comparison, upregulation of ackA, pta, gltA, and lpdA was less pronounced revealing 0.4 ≤ LFCmax ≤ 0.9. Those genes somehow encode the pathway from acetate to citrate.
Further transcript analysis focused on genes encoding glucose uptake and regulation in C. glutamicum (Figure 6). Noteworthy, published data of Haas et al. (2019) serve as reference. The expression profiles mirror transcript dynamics of the same strain in the same synthetic medium after its exposure to glucose limitation (highlighted in red in Figure 6). By trend, iolT1 (coding for glucose specific EII permease; Ikeda et al., 2011; Lindner et al., 2011) and glk (encoding glucokinase; Park et al., 2000) showed rising expression with growth in chemostat mode although glk levels in continuous culture were below those of all batch studies. On contrary, iolT1 expression in chemostat was stronger than in batch cultures. By analogy iolT2, the second glucose permease (Ikeda et al., 2011; Lindner et al., 2011), also revealed high expression levels in continuous culture but falling levels with rising growth rate. The same holds true for ppgK (polyphosphate glucokinase, Lindner et al., 2010) which phosphorylates glucose to G6P utilizing poly-phosphate pools. iolR, ramA, cg3388, and sugR are putative regulator genes. iolR is the known regulator of iolT1 (Klaffl et al., 2013), whereas cg3388 may exert control on iolT2 (Brinkrolf et al., 2006). sugR represents a transcriptional regulator of sugar metabolism which is likely to be controlled by ramA, a “master” regulator in C. glutamicum (Cramer and Eikmanns, 2007; Shah et al., 2018). Interestingly, all putative regulators disclosed only moderate expression changes with ramA showing the lowest expression level at all.
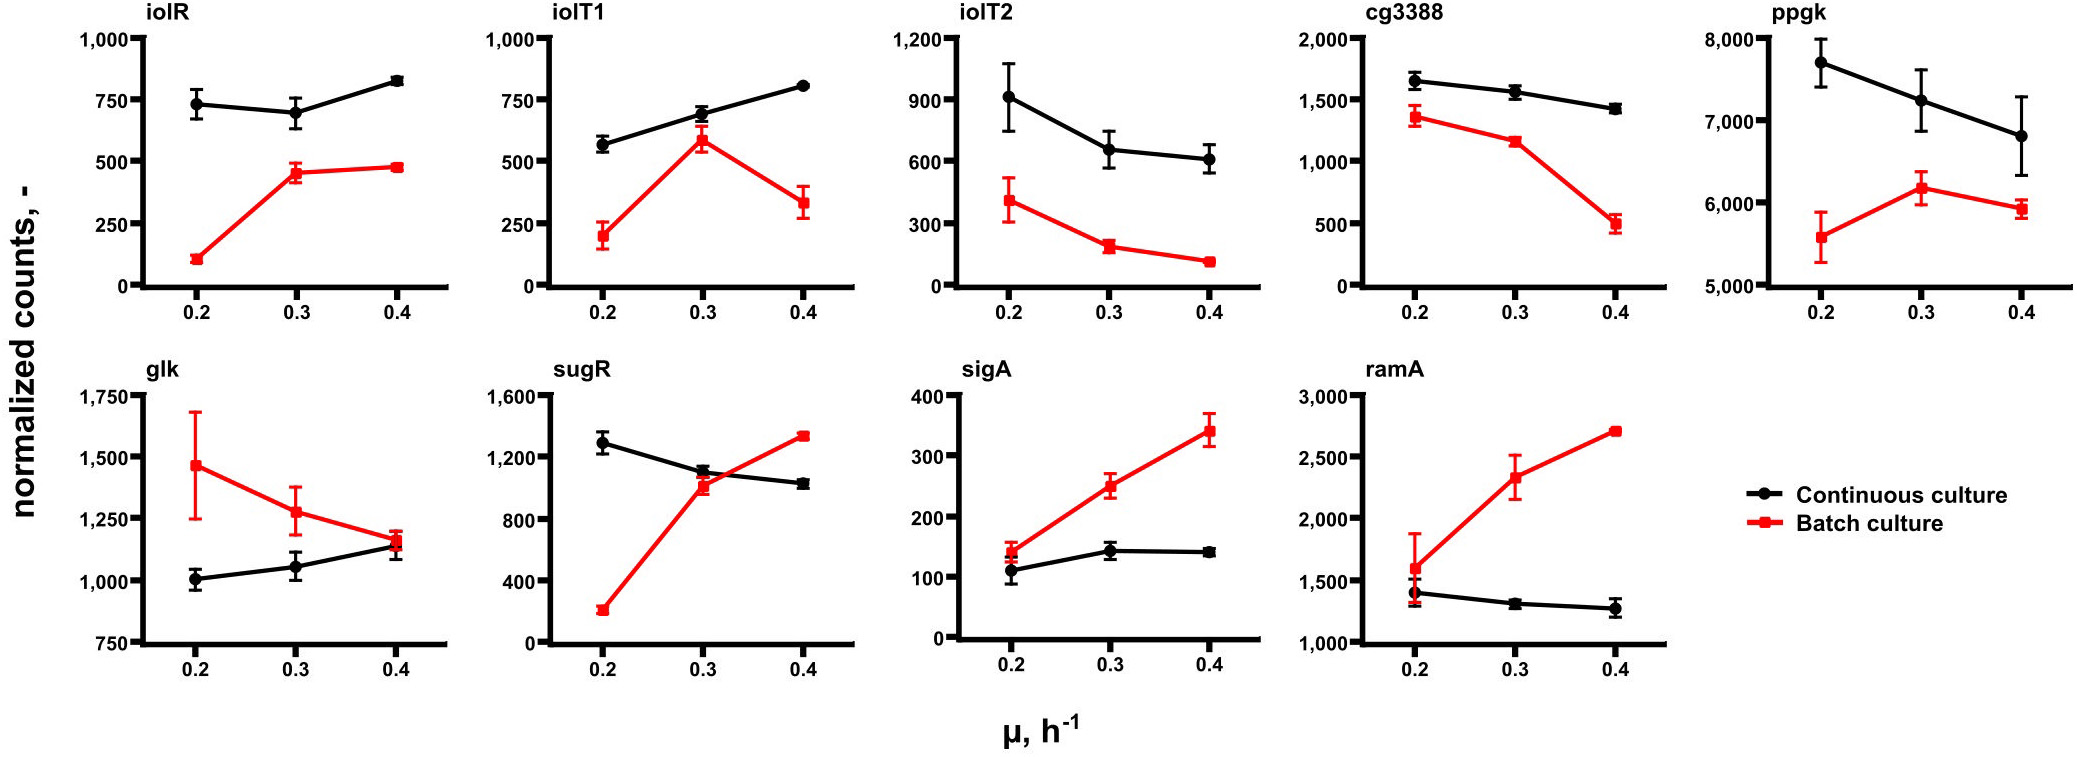
Figure 6. Gene expression levels of a selection of genes coding for glucose uptake and regulation in C. glutamicum. Samples were taken at μ = 0.2, 0.3, and 0.4 h– 1 in continuous (chemostat) runs (black) and in batch mode (red). Data of the latter are taken from Haas et al. (2019) reflecting the acceleration of growth of the same strain in the same medium after preceding glucose limitation.
13C-Labeling Experiment at μ = 0.4 h–1
To further investigate the intracellular flux distribution at μ = 0.4 h–1 – the maximum growth rate typically observed under non-limited glucose batch conditions in minimal medium – a CLE was performed in chemostat mode after a non-labeled metabolic steady-state was installed by switching to 13C-labeled feed [mixture of 33% (1-13C)- and 67% (U-13C)-D-glucose, see section “A priori Tracer Design”]. Figure 7 illustrates the CLE that ran with the same operating conditions as shown in Figure 1.
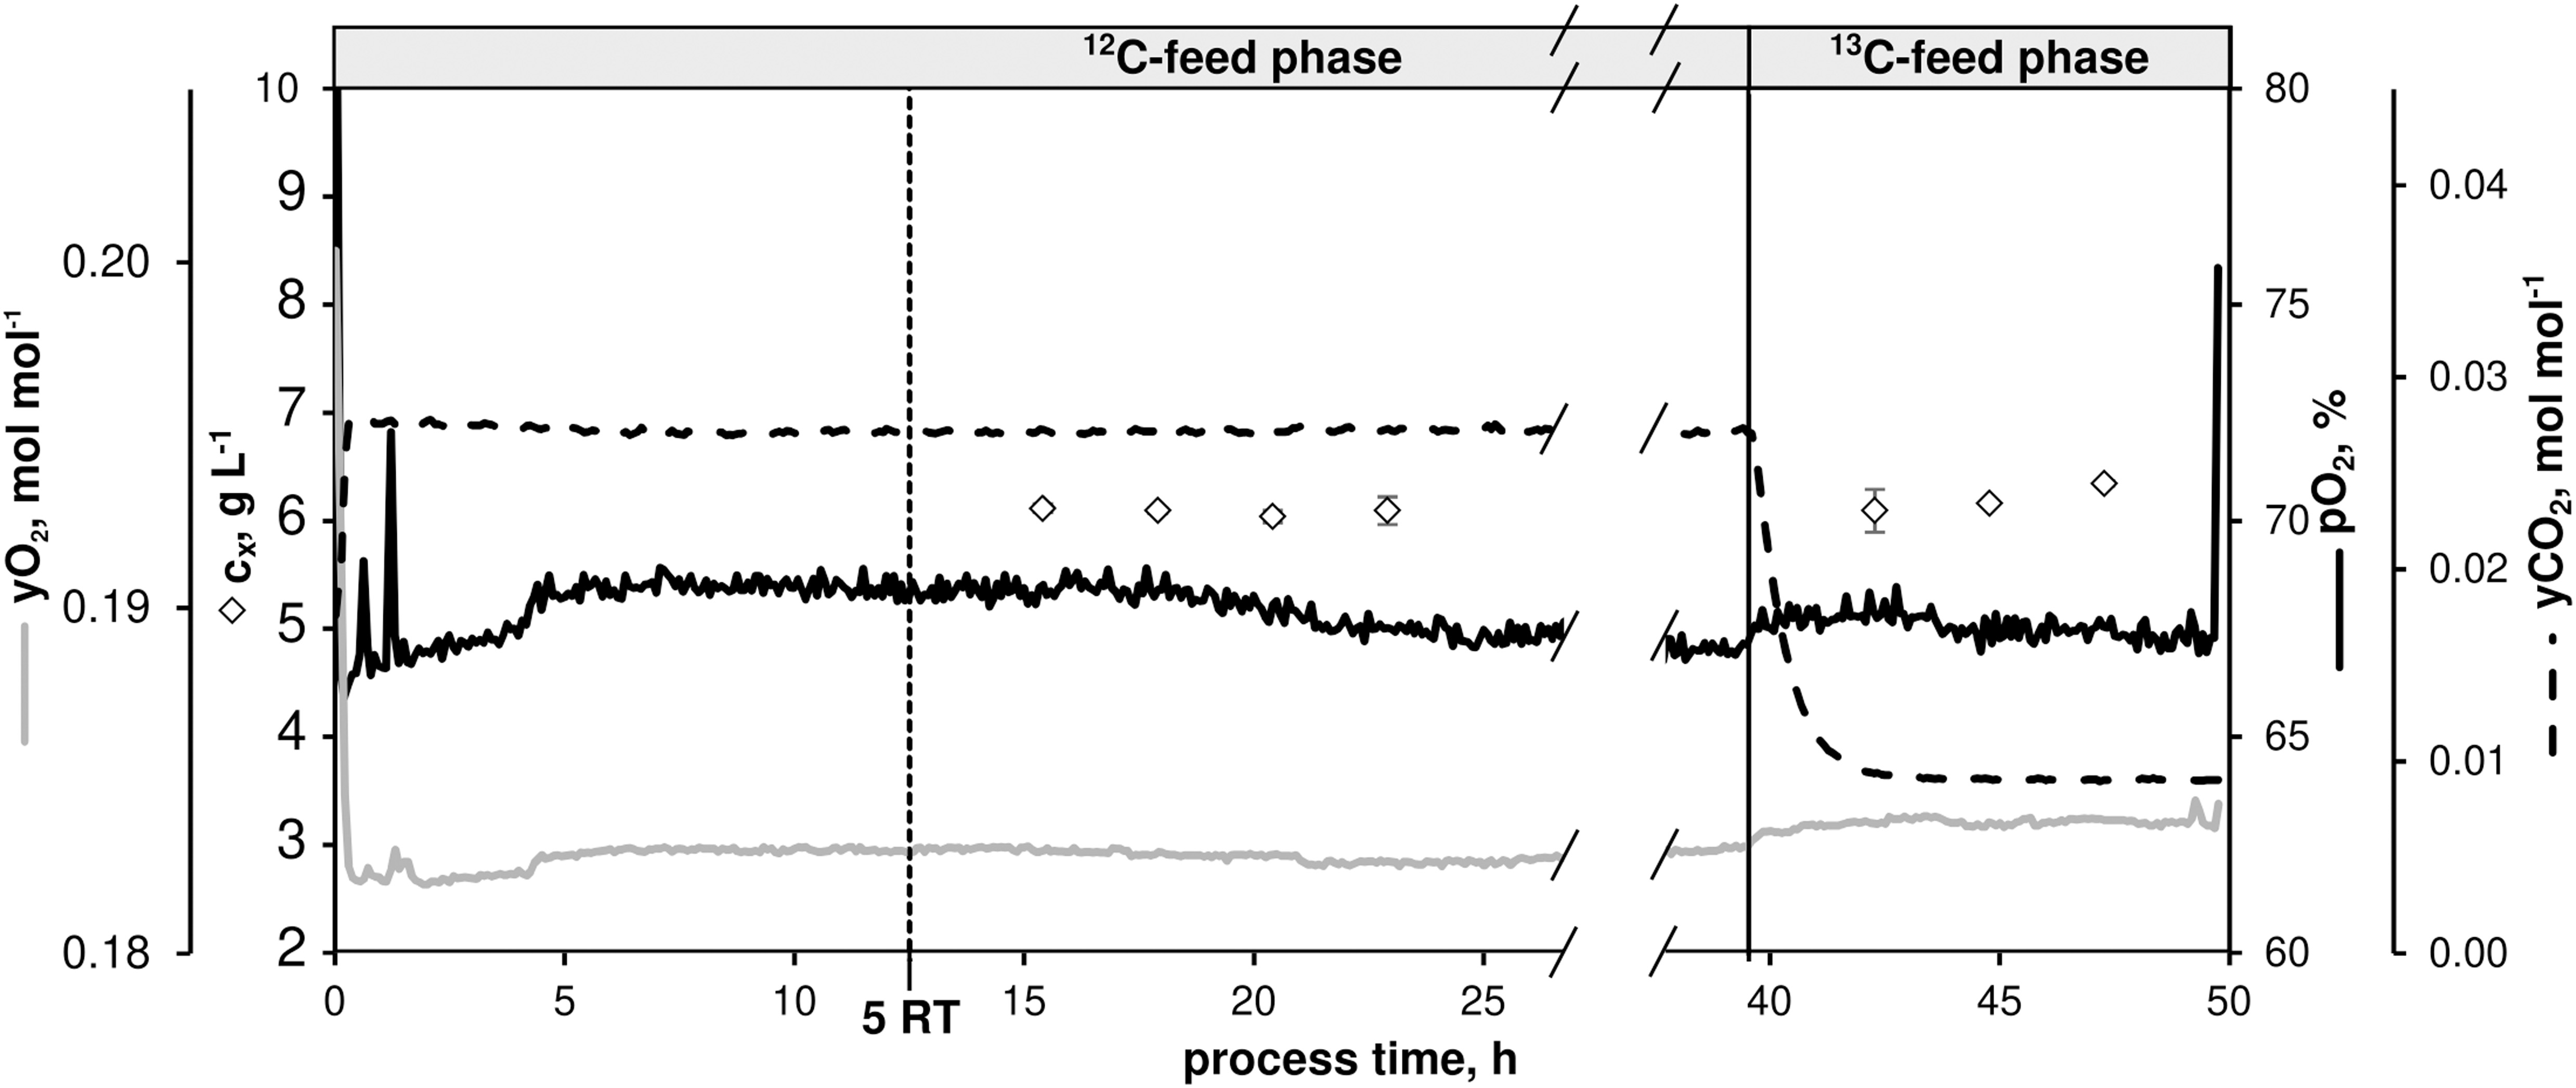
Figure 7. Process parameters of the continuous 13C-labeling experiment with C. glutamicum WT: dissolved oxygen (pO2), off-gas molar oxygen (yO2) and carbon dioxide (yCO2), biomass concentration (black diamonds). The dilution rate (D) was set to 0.4 h– 1. Sampling in the 12C-phase was initiated after five residence times (RT, 12.5 h). After 39.5 h, feed was switched to isotopic CGXII medium containing a 12 g D-glucose L– 1 mixture [67% (U-13C)-D-glucose and 33% (1-13C)-D-glucose]. Residual process parameters were kept constant. Depicted standard deviations of biomass measurements were calculated from three technical replicates per sample.
After five RTs, non-labeled metabolic steady-state was reached (biomass concentration cX = 6.09 ± 0.03 g L–1, pO2 = 67%, yO2 = 0.18 mol mol–1, yCO2 = 0.03 mol mol–1) as evidenced by four fold sampling revealing low standard deviations (Figure 2 and Table 3). A fully closed carbon balance was measured for this phase of the experiment (no data shown).
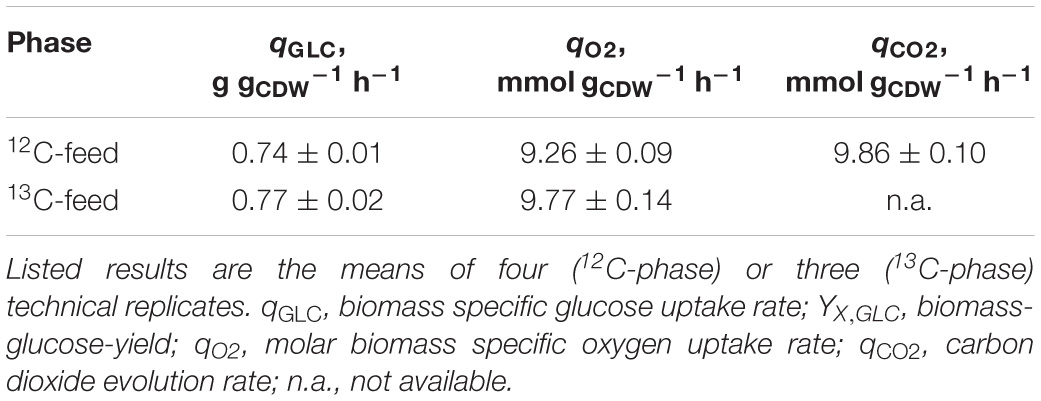
Table 3. Kinetic process parameters from the 13C-labeling experiment with C. glutamicum (Figure 7) using CGXII minimal medium supplemented with 12 g D-glucose L–1 [13C-phase: 67% (U-13C)-D-glucose and 33% (1-13C)-D-glucose] at a dilution rate of 0.4 h–1.
As indicated in Figure 7, 13C-labeled feeding started after 39.5 h causing dropping yCO2 signals as a well-known interference between newly produced isotopic CO2 and near-infrared exhaust gas measurements. Because of slightly higher glucose feed concentrations in the labeling phase compared to the non-labeled period (11.88 ± 0.20 g L–1 vs. 11.32 ± 0.10 g L–1), cX values proportionally increased to 6.20 ± 0.11 g L–1. However, microbial kinetics remained constant compared to the non-labeled state (Table 3). Labeling samples were taken after 3.8 RTs in 10 min intervals to document the expected isotopic stationarity. Sample processing followed the protocol given in the Supplementary Material sections “Sampling, Quenching, and Extraction for Quantification of 13C-Isotopic Labeling Dynamics” and “LC-MS-Based Quantification of Intracellular Pool Concentrations and 13C-Labeling Dynamics.”
Biomass-specific extracellular rates were furthermore estimated using a bioprocess model (see Supplementary Material section “Bioprocess Model Used for External Rate Estimation”). The rate of glucose consumption was estimated to be rGLC = 4,130 ± 150 μmol gCDW–1 h–1, the specific growth rate as μ = 0.40 ± 0.03 h–1, CO2 production and PCA uptake rates were determined as rCO2 = 8,240 ± 760 μmol gCDW–1 h–1 and rPCA = 13 ± 1 μmol gCDW–1 h–1, respectively.
From these rates and the (corrected) MIDs, extracellular and intracellular fluxes were estimated with the 13C-MFA model at hand (see section “Metabolic Network Model for 13C-MFA”), following the procedure described in section “External Rate Estimation.” For the best fit obtained, measured and simulated data agreed very well (Supplementary Figures 3,4), as indicated by a SSR of approximately 31. Therewith the SSR was lower than the maximally acceptable SSR of 114 at 95% significance level. The estimated absolute fluxes including flux standard deviations are provided in the Supplementary Table 2.
Figure 8 shows the central metabolic carbon fluxes, normalized to glucose consumption rate vGLC = 4,086 μmol gCDW–1 h–1 for the specific growth rate μ = 0.41 ± 0.02 h–1. Two-thirds (66.4 ± 7.6%) of the incoming glucose flux were metabolized via the EMP pathway through G6P isomerase (reaction pgi), whereas one-third (31.6 ± 7.6%) of the glucose was metabolized via the PPP through G6P dehydrogenase and phosphogluconate dehydrogenase (gnd) to regenerate nicotinamide adenine dinucleotide phosphate (NADPH) and accomplish P5P-precursor production for nucleotides and amino acids. A considerable portion of the input flux, namely 25.1 ± 1.2%, was utilized for acetyl-CoA precursors, e.g., the synthesis of fatty acids and to satisfy the demand for biomass. A relatively high proportion (58.3 ± 4.2%) of the incoming glucose was channeled into the TCA cycle via citrate synthase (gltA) to generate ATP via the respiratory chain and to satisfy the demand of amino acids of the ASP and GLU branches, whereas the contribution of the PCA flux to the TCA cycle via the β-keto-adipate pathway was negligibly small (vPCA = 0.3 ± 0.0%). Best fit results suggest that the anaplerotic net flux mainly goes through pyc, which channels 31.3% of the glucose uptake flux into the TCA cycle via oxaloacetate (OAA). In C. glutamicum, three reactions in central carbon metabolism, namely, isocitrate dehydrogenase (icd), gnd, and malic enzyme (mez) contribute to regeneration of NADP+ to NADPH (Marx et al., 1996). According to the flux map (Figure 8), gnd (1,290 ± 309 μmol gCDW–1 s–1) and icd (2,380 ± 169 μmol gCDW–1 s–1) contribute in a roughly 1:2 proportion to NADPH generation. Because the TCA cycle contributes 1 NADPH molecule per CIT molecule and the oxidative PPP contributes 2 NADPH molecules per G6P molecule, flux estimations suggest that NADPH demands were equally met by icd (48% of NADPH) and the lumped reactions of the oxidative PPP (52% of NADPH), recognizing that the contribution of mez is negligible. From the flux map in Figure 8 it follows that the total relative flux of NADPH synthesis is approximately 121.5% of the glucose consumption rate. Assuming the coefficient for NADPH required for growth to be 14,849 μmol gCDW–1 (Neidhardt et al., 1990), NADP+ has to be regenerated at a relative rate of 149.0%, leaving a gap of 27.5% molar flux relative to the glucose consumption rate. Notice that the net mez flux is statistically non-identifiable (Supplementary Table 2). A value of approximately 1,144 μmol gCDW–1 s–1 suffices to close the gap, whereas any larger value results in excess NADPH production. Finally, the analysis showed that the total carbon flux into the biomass and CO2 was 65.6 and 34.4%, respectively, where 1 mol of glucose was converted into 2.06 mol CO2. Therewith, trends of relative fluxes are similar to those reported by previous studies at slightly higher specific growth rates (μ = 0.42, 0.46 h–1) and glucose uptake rates (vGLC = 4,800, 5,100 μmol gCDW–1 h–1) conducted under batch conditions (Becker et al., 2011; Wang et al., 2018; see Supplementary Figure 5). Accordingly, biomass yields per glucose obtained in these studies are comparable with this study (YX,GLC = 0.49 and 0.50 g gCDW–1, respectively; see also Eq. 10 in Supplementary Material section “Bioprocess Model Used for External Rate Estimation”).
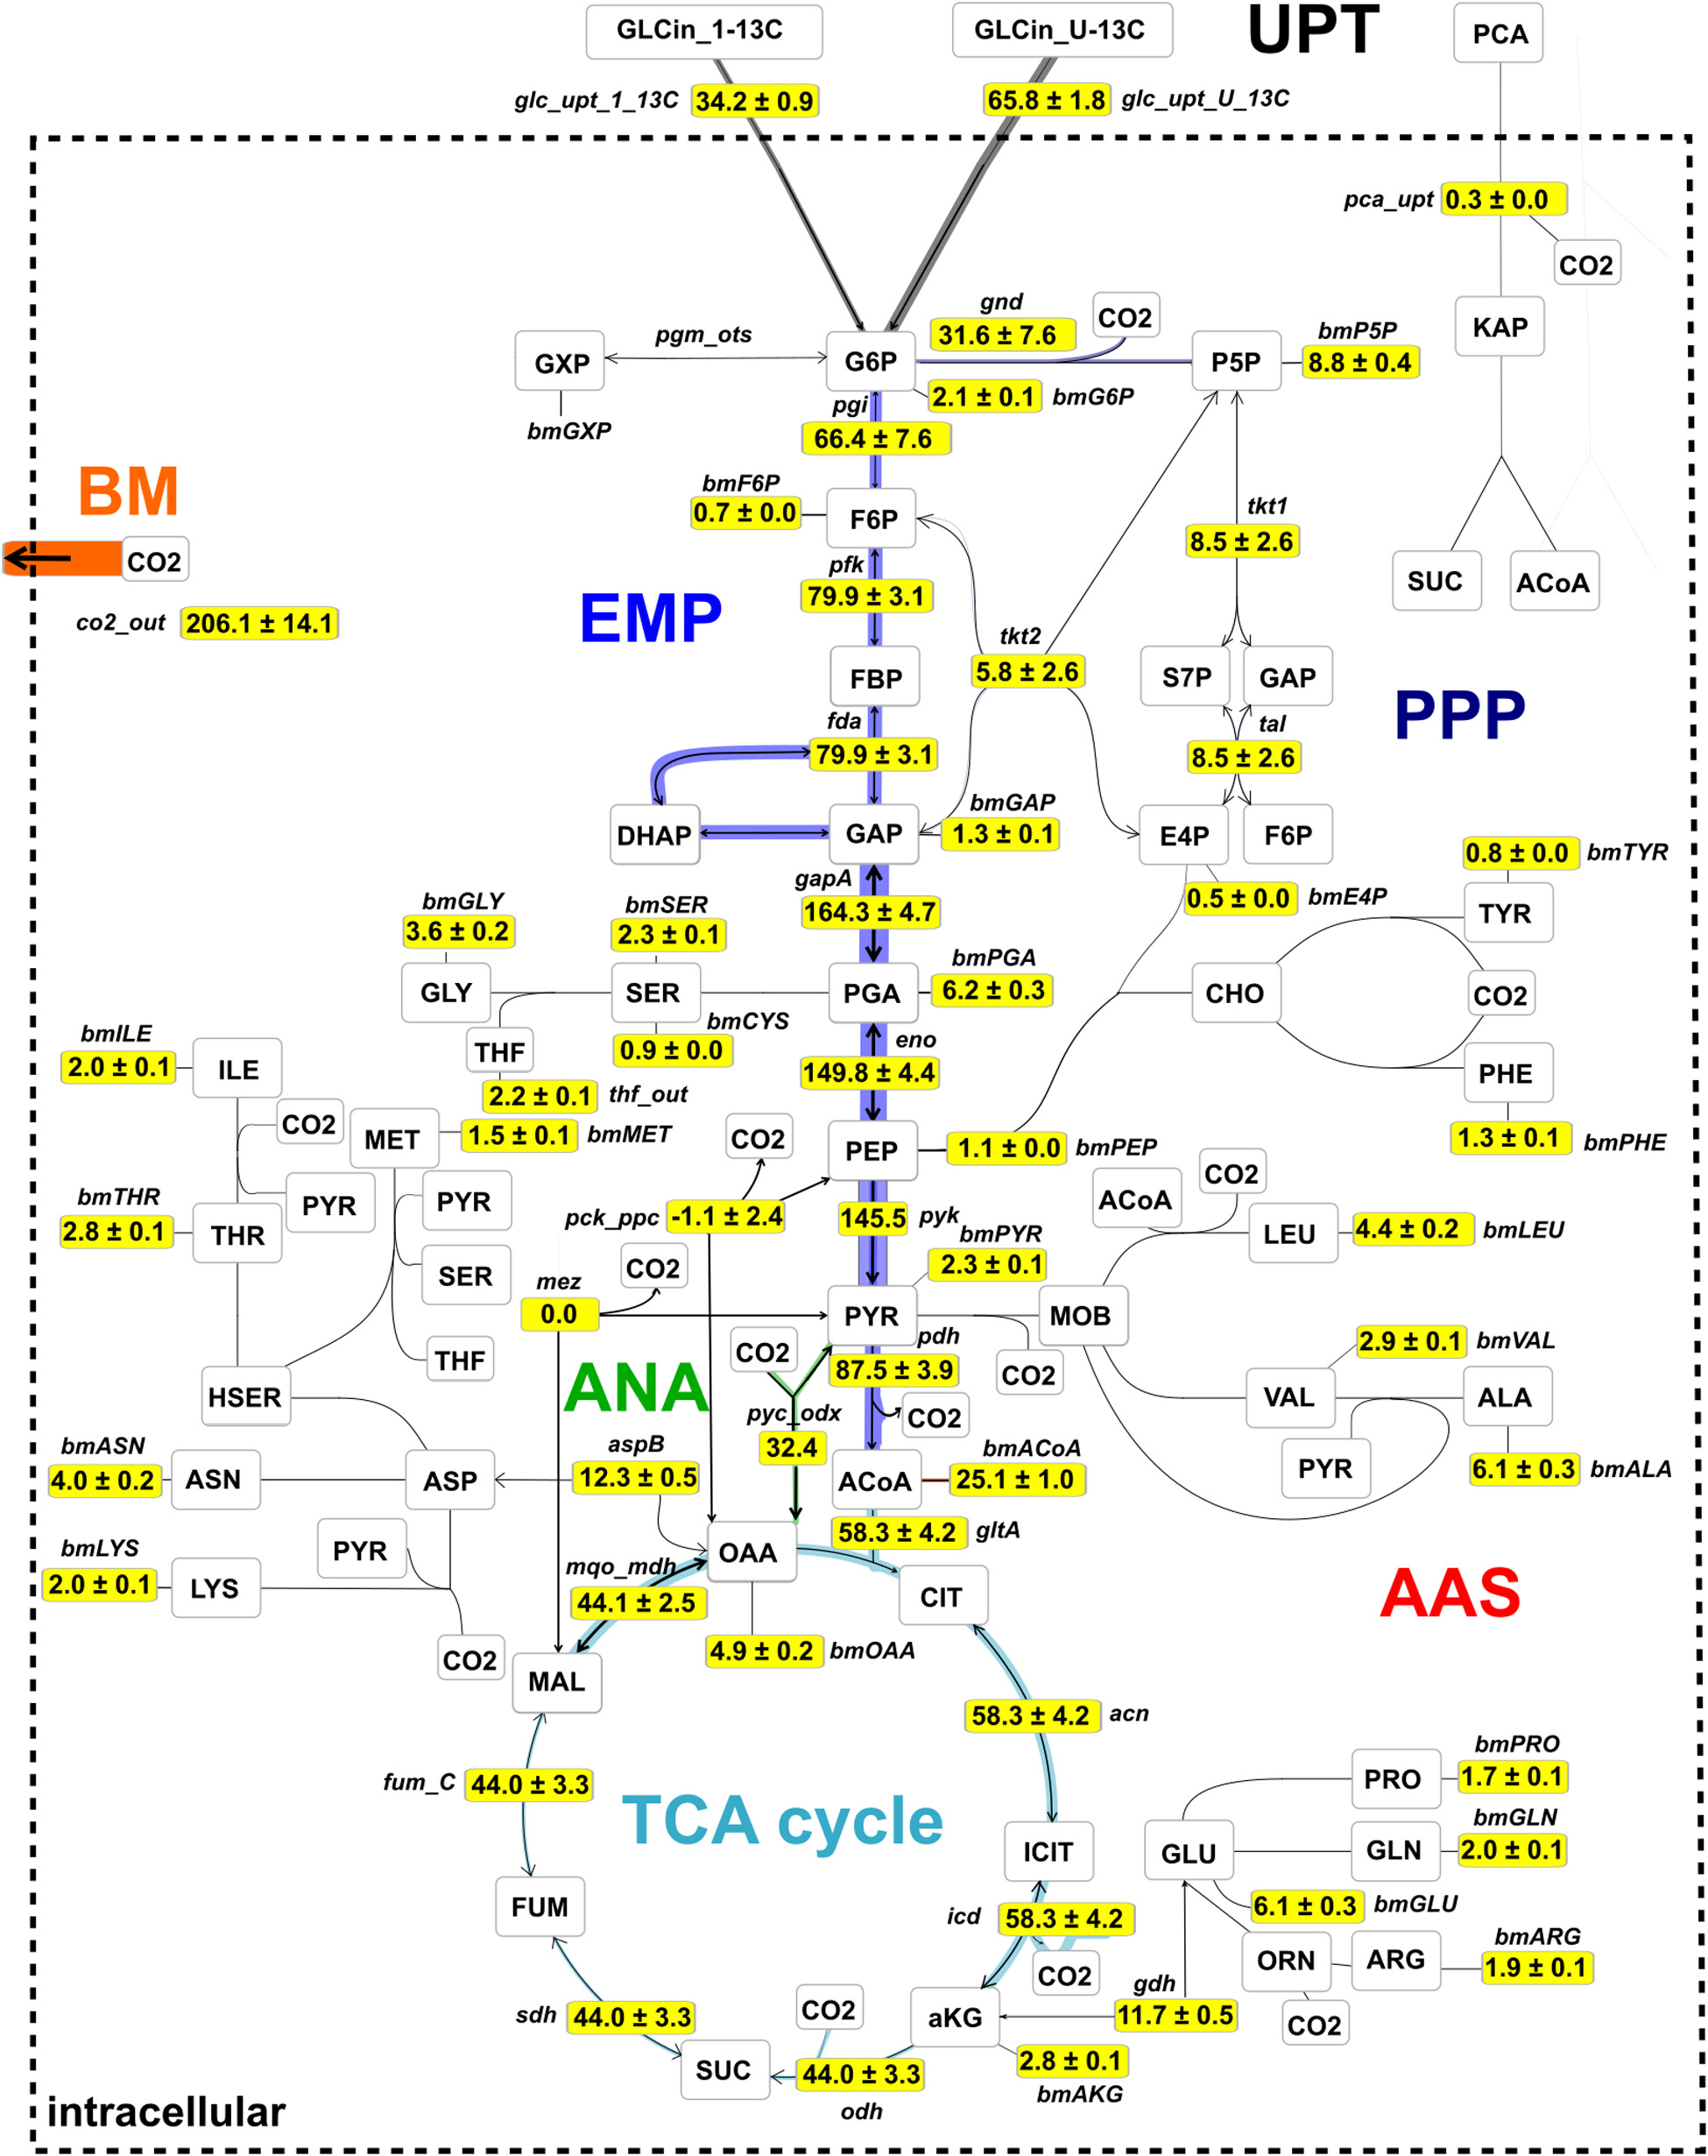
Figure 8. Metabolic flux map for C. glutamicum WT cultivated under continuous conditions at growth rate μ = 0.41 h– 1 using glucose as main carbon source. Fluxes were estimated using isotopic stationary 13C-MFA with a data set generated in a CLE with 33% (1-13C)- and 67% (U-13C)-D-glucose. Shown are net flux values, normalized to glucose uptake rate (vGLC = 4,086 μmol gCDW– 1 h– 1), together with their standard deviations. The complete absolute and relative flux distributions are provided in the Supplementary Table 2. The flux map is drawn using the network editor and visualization tool Omix (Omix Visualization GmbH, Lennestadt, Germany, www.omix-visualization.com). UPT, uptake; PPP, pentose-phosphate pathway; ANA, anaplerotic section; BM, biomass; EMP, Embden–Meyerhof–Parnas; AAS, amino acid synthesis; TCA, tricarboxylic acid.
Discussion
Kinetic Studies
Figures 1, 2 together with Tables 1, 3 give evidence to the high repeatability of biological and technical replicates qualifying the data sets as sound and representative. The growth de-coupled maintenance coefficient, mS is identified as (0.44 ± 0.04) mmol D-glucose gCDW–1 h–1 and the growth-coupled maintenance coefficient as (0.103 ± 0.01) gCDW mmol–1 which indicates about 9 and 1% standard deviation, respectively. Surprisingly, the mS value exceeds measurements of Koch-Koerfges et al. (2013) by factor 5.5 whereas of the current study is about 21% lower. Accordingly, results of the current study hint to higher cellular maintenance needs which consequently lead to reduced glucose-to-biomass conversion. As strains and media compositions are similar, no apparent reason is found for the discrepancy. However, determined growth kinetics which built the basis for maintenance calculations in this study agree well with kinetics determined by Cocaign-Bousquet et al. (1996) investigating C. glutamicum WT ATCC 17965 in chemostat tests.
Metabolic and Transcriptional Regulation of Central Metabolism in Chemostat
The metabolic flux map of Figure 8 mirrors cellular efforts to provide sufficient metabolic precursors, reduction equivalents, and ATP at a growth rate of 0.4 h–1 that represents growth conditions typically observed under non-limited batch conditions (Blombach et al., 2013; Grünberger et al., 2013; Graf et al., 2018; Haas et al., 2019). Apparently, the central metabolism of C. glutamicum serves the pivotal need of precursor supply for biomass formation which is mirrored by the strong activity of glycolysis fueling the TCA cycle. Somewhat inferior are cellular needs for NADPH which is disclosed by only 1/3 of consumed glucose branching into the PPP thereby meeting half of the demands required for nucleotide precursors, biomass, and growth.
Pool sizes of upper glycolysis and PPP rise with the growth rate (G6P, F6P, FBP, DHAP) whereas intracellular concentrations of 2,3PG and PEP show opposite trends (see Figure 3). Notably, 2/3PG assigns the lumped pool of 2PG + 3PG of low total size which may be discarded from further discussion. Glycolytic fluxes are expected to increase with growth considering raising biomass specific glucose consumption rates of Table 1. Noack et al. (2017) found constant enzyme concentrations in central metabolism of C. glutamicum ATCC 13032 cultivated in the same CGXII minimal medium and under the same process conditions in chemostat mode (D = 0.05, 0.1, 0.2, and 0.35 h–1) as employed in this study. Our findings agree with the previous study because only gene pgi showed minor reduction of transcript levels of genes encoding enzymes in glycolysis and in PPP. Consequently, increasing glycolytic fluxes should be enabled by elevated intracellular pool concentrations fairly assuming Michaelis–Menten type kinetics for said enzymes. Because extracellular glucose concentrations were limiting under chemostat operation, the majority of glucose consumption is expected to happen via the PTS. PEP is dephosphorylated stoichiometrically to pyruvate (not measured) activating glucose to G6P. Accordingly, increasing PEP consumption coincides with raising glucose consumption rates and growth. Observing falling PEP pools anticipate limited PEP regeneration with increasing growth rate. In general, glycolytic metabolite dynamics agree with independent studies of Noack et al. (2017) hinting to metabolically controlled glycolytic fluxes in glucose-limited chemostats.
In the TCA cycle, metabolite dynamics are less pronounced than in glycolysis and PPP. The strongest increase found in the lumped CIT/ICIT pool might be misleading as the low pool sizes reflect the particular instability of these metabolites using the leakage-reduced fast centrifugation treatment and hot-water extraction protocol for separation and metabolite extraction. However, elevating pools with growth may also mirror increased citrate synthase catalyzed flux (indicated by amplified gltA expression; van Ooyen et al., 2011) which is not passed on to aKG because of missing icd amplification (Figure 4). Rising MAL and FUM levels may mirror rising fluxes catalyzed via Michaelis–Menten type kinetics of fumarate hydratase, malic enzyme and malate:quinone oxidoreductase whose corresponding genes (fum, malE, mqo; Han et al., 2008b) did not show any changes of expression levels. Interesting enough the expression of pck, encoding phosphoenolpyruvate carboxykinase (Riedel et al., 2001), reduces with growth which agrees with the hypothesis of limited PEP regeneration from OAA.
In general, the identification of only a few DEGs in TCA cycle agrees with findings of Noack et al. (2017) analyzing the enzyme content of C. glutamicum. Similar to glycolysis, growth dependent TCA cycle activity appears to be mostly metabolically controlled under chemostat conditions. Rising gltA expression, however, may thus be qualified as one example of transcriptional control. In case of the other DEGs, a coherent regulatory scheme is missing so far. Furthermore, putative regulator genes such as ramA and sugR are unlikely to exert additional control as they show only moderate dynamics with increasing growth rate (Figure 6).
Most of the amino acid pools show rising sizes with increasing growth (Supplementary Figure 1) which reflects increasing needs of said precursors for protein synthesis using the assumption of Michaelis–Menten type enzyme kinetics. Frankly speaking, there are no obvious reasons why MET and LEU pools fall. However, the observation of growth rate independent intracellular pool sizes of ASP, ASN, and GLU agrees with findings of Graf et al. (2018). The authors outlined that those amino acids were consumed non-proportionally with the strain’s amino acid biomass composition under non-limited glucose and amino acid conditions (batch cultivations). They concluded that most likely, these compounds serve as central amino donors for multiple acceptors explaining why their uptake outnumbers stoichiometric biomass needs by far.
Comparability of Chemostat and Batch Observations
Haas et al. (2019) identified the so-called “growth modulon” of C. glutamicum analyzing the growth in the same medium as in this study, but after preceding installation of carbon, nitrogen, and phosphate limitation. The intersection analysis of DEGs changing with accelerating growth rates after previous stress exposure yielded a set of 447 genes belonging to the growth modulon. Noteworthy, the batch study of Haas et al. (2019) differs from chemostat tests by installing saturating nutrient levels including glucose whereas glucose limitation and low extracellular glucose concentrations occur in the continuous runs. Interesting enough, Haas et al. (2019) analyzed transcriptional patterns at the growth rates 0.2, 0.3, and 0.4 h–1 which are identical to the chemostat growth rates of the current study. This allows the direct comparison of transcriptional patterns associated to equal growth but under different glucose levels.
A primary observation is that changes of gene expression levels are more pronounced under batch conditions (Haas et al., 2019) than in chemostat mode. On average, log fold changes (LFCs) of batch DEGs are twice as large as those of the continuous culture. Apparently, non-transcriptional control of cellular growth is more prominent in chemostat than in glucose-rich batch conditions. Interestingly, most of the genes coding for TCA cycle reactions are not members of the “growth modulon” which agrees well with the proteome measurements of Noack et al. (2017) and with the chemostat transcript results of this study. In contrast, acetate kinase (encoded by ackA) and phosphate acetyltransferase (encoded by pta) showed amplifying trends (Figure 4) and are part of the growth modulon. Consequently, both conditions, chemostat, and batch, assigned those genes identical functions, either as part of the non- or as member of the growth correlated fractions.
Contrary, aceA (isocitrate lyase), pqo (pyruvate:quinone oxidoreductase), and sucCD (succinate CoA ligase) revealed opposite expression trends in chemostat runs compared to the expectations as members of the growth modulon derived from batch observations. Even more striking, the entire glycolysis was assigned to the growth modulon anticipating increasing transcripts with rising growth. However, transcriptome (Figure 5) and proteome (Noack et al., 2017) studies of chemostats did not depict such dynamics. Apparently, findings of batch studies may not be transferred one-by-one to chemostat conditions, vice versa.
For explanation, Figure 6 should be discussed: considering that extracellular glucose levels were below the detection limit in chemostats, cells may require stronger amplification of iolT1 (coding for glucose specific EII permease; Ikeda et al., 2011; Lindner et al., 2011) than under high-glucose batch conditions. Notably, early studies of Cocaign-Bousquet et al. (1996) followed by glucose uptake engineering works of Xu et al. (2019) outlined that PTS-based glucose imports dominate glucose uptake by 70–85% in C. glutamicum. Accordingly, non-PTS glucose import may account for roughly 15–30%. Nevertheless, the finding of increasing iolT1 levels with chemostat growth supports the hypothesis that non-PTS glucose uptake may have gained importance. iolT1 is under control of iolR (Klaffl et al., 2013), iolT2 is supposed to be regulated by cg3388 (Brinkrolf et al., 2006). By trend, the second correlation is observed whereas the first is not. Maybe, iolT1 expression is co-controlled by another regulator not discovered yet. Glucose entering the cell via IolT1 requires activation by glucokinase either encoded by glk (Park et al., 2000) or by ppgk (Lindner et al., 2010). The ATP dependent glucokinase reveals slightly rising gene expression with growth whereas expression levels of the PolyP/ATP-dependent glucokinase reduce in continuous culture. Interestingly, glk levels in chemostat are mostly below those of glucose-rich batch conditions anticipating that permease-driven import of glucose is higher when extracellular levels are elevated too. Most remarkably, ramA, encoding one of the key regulators of the growth modulon (Haas et al., 2019) revealed only low expression in each chemostat environment whereas higher, amplifying trends were found in batch tests. As RamA controls expression of glycolytic genes (Auchter et al., 2011; Shah et al., 2018; Haas et al., 2019) their missing amplification in chemostats may be explained as the missing activation of ramA. Most likely, extracellular glucose levels somehow stimulate ramA activation but this remains to be shown.
Conclusion
Investigating C. glutamicum WT under nutrient limiting conditions in chemostat, we found that pool sizes of glycolysis predominately rise with growth. Although not measured explicitly, rising intracellular fluxes are likely to follow the experimentally observed increasing, growth coupled glucose uptake rates. In particular, the scenario pinpoints to a predominant metabolic control of glycolysis because indications for transcriptional control could not be detected in chemostat. By analogy, growth coupled metabolic control of PPP and TCA cycle is anticipated. Again, concerted trends in transcriptional patterns could not be found. The picture is complemented by 13C-studies underlining the central function of central metabolism as supplier of precursors, redox, and energy equivalents.
As such, the study consolidates previous findings outlining a particularity: glycolysis apparently is transcriptionally controlled under glucose-rich batch condition whereas metabolic control dominates in glucose limited chemostats. The important player may be RamA, a key transcriptional regulator of glycolysis. Obviously, it is a highly attractive goal of future studies to unravel the metabolic effector interacting with RamA, one of the remaining puzzle pieces to complete the growth regulation picture of C. glutamicum.
Data Availability Statement
The datasets presented in this study can be found in online repositories. The names of the repository/repositories and accession number(s) can be found below: https://www.ebi.ac.uk/arrayexpress/, E-MTAB-9371.
Author Contributions
MG designed the study, carried out the bioreactor experiments, analyzed the metabolic datasets, and drafted and corrected the manuscript. TH designed the study, analyzed the transcriptomic data sets and, drafted and corrected the manuscript. AT and AF conceptualized and performed metabolic analysis and corrected the manuscript. TB and JK measured the transcript samples and corrected the manuscript. MC and KN designed the flux study, performed the MFA, and drafted and corrected the manuscript together with WW. RT conceptualized the whole study and drafted and corrected the manuscript. All authors read and approved the final manuscript.
Funding
This work was supported by the German Federal Ministry of Education and Research (BMBF; Grant 031A302A and 031A302C).
Conflict of Interest
The authors declare that the research was conducted in the absence of any commercial or financial relationships that could be construed as a potential conflict of interest.
Acknowledgments
We thank Anna-Lena Mayer, Salaheddine Laghrami, and Andreas Freund for excellent support with bioreactor fermentations. Moreover, we thank all members of the 0.6 plus project group for valuable comments on the topic and for their great cooperation. Parts of this contribution previously appeared online in the doctorial thesis of Graf (2019).
Supplementary Material
The Supplementary Material for this article can be found online at: https://www.frontiersin.org/articles/10.3389/fbioe.2020.584614/full#supplementary-material
Abbreviations
2/3PG, 2-/3-phosphoglyceric acid; aKG, alpha ketoglutarate; ASN, L-asparagin; ASP, L-aspartate; ATP, adenosine triphosphate; CDW, cell dry weight; CIT, citrate; CLE, carbon labeling experiment; DEG, differentially expressed gene; DHAP, dihydroxyacetone phosphate; EMP, Emden-Meyerhof-Parnas; F6P, fructose 6-phosphate; FBP, fructose 1,6-bisphosphate; FFC, flux fold change; FUM, fumarate; GAP, glyceraldehyde 3-phosphate; GLC, glucose; GLU, L-glutamate; ICIT, isocitrate; LEU, L-leucine; LFC, log fold change; MAL, L-malate; MET, L-methionine; MFA, metabolic flux analysis; MID, mass isotopomer distribution; NADPH, nicotinamide adenine dinucleotide phosphate; OAA, oxaloacetate; OD600, optical density; OED, optimal experimental design; P5P, pentose-5-phosphate; PEP, phosphoenolpyruvate; PCA, protocatechuic acid; PPP, pentose phosphate pathway; PRO, L-proline; RT, residence time; RNA, ribonucleic acid; S7P, sedoheptulose 7-phosphate; SUC, succinate; SSR, sum of squared residuals; TCA, tricarboxylic acid; TIC, total inorganic carbon; TOC, total organic carbon; WT, wild-type.
References
Auchter, M., Cramer, A., Hüser, A., Rückert, C., Emer, D., Schwarz, P., et al. (2011). RamA and RamB are global transcriptional regulators in Corynebacterium glutamicum and control genes for enzymes of the central metabolism. J. Biotechnol. 154, 126–139. doi: 10.1016/j.jbiotec.2010.07.001
Becker, J., Zelder, O., Häfner, S., Schröder, H., and Wittmann, C. (2011). From zero to hero—design-based systems metabolic engineering of Corynebacterium glutamicum for l-lysine production. Metab. Eng. 13, 159–168. doi: 10.1016/j.ymben.2011.01.003
Beyß, M., Azzouzi, S., Weitzel, M., Wiechert, W., and Nöh, K. (2019). The design of fluxml: a universal modeling language for 13C metabolic flux analysis. Front. Microbiol. 10:1022. doi: 10.3389/fmicb.2019.01022
Blombach, B., Buchholz, J., Busche, T., Kalinowski, J., and Takors, R. (2013). Impact of different CO2/HCO3- levels on metabolism and regulation in Corynebacterium glutamicum. J. Biotechnol. 168, 331–340. doi: 10.1016/j.jbiotec.2013.10.005
Brinkrolf, K., Brune, I., and Tauch, A. (2006). Transcriptional regulation of catabolic pathways for aromatic compounds in Corynebacterium glutamicum. Genet. Mol. Res. 5, 773–789.
Bull, A. T. (2010). The renaissance of continuous culture in the post-genomics age. J. Indust. Microbiol. Biotechnol. 37, 993–1021. doi: 10.1007/s10295-010-0816-4
Cerff, M., Scholz, A., Käppler, T., Ottow, K. E., Hobley, T. J., and Posten, C. (2013). Semi-continuous in situ magnetic separation for enhanced extracellular protease production—modeling and experimental validation. Biotechnol. Bioeng. 110, 2161–2172. doi: 10.1002/bit.24893
Cocaign-Bousquet, M., Guyonvarch, A., and Lindley, N. D. (1996). Growth rate-dependent modulation of carbon flux through central metabolism and the kinetic consequences for glucose-limited chemostat cultures of Corynebacterium glutamicum. Appl. Environ. Microbiol. 62, 429–436. doi: 10.1128/aem.62.2.429-436.1996
Cramer, A., and Eikmanns, B. J. (2007). RamA, the transcriptional regulator of acetate metabolism in Corynebacterium glutamicum, is subject to negative autoregulation. J. Mol. Microbiol. Biotechnol. 12, 51–59. doi: 10.1128/JB.01061-06
Eggeling, L., and Bott, M. (eds) (2005). Handbook of Corynebacterium Glutamicum, 1st Edn. Boca Raton: CRC Press, doi: 10.1201/9781420039696
Feith, A., Teleki, A., Graf, M., Favilli, L., and Takors, R. (2019). HILIC-Enabled 13C metabolomics strategies: comparing quantitative precision and spectral accuracy of QTOF high-and QQQ low-resolution mass spectrometry. Metabolites 9, 63. doi: 10.3390/metabo9040063
Freudl, R. (2017). Beyond amino acids: use of the Corynebacterium glutamicum cell factory for the secretion of heterologous proteins. J. Biotechnol. 258, 101–109. doi: 10.1016/j.jbiotec.2017.02.023
Graf, M. (2019). Investigation of Growth Limitations in (Pseudo-)Steady States with Corynebacterium Glutamicum. Dissertation, University of Stuttgart, Stuttgart.
Graf, M., Haas, T., Müller, F., Harm-Bekbenbetova, J., Freund, A., Nieß, A., et al. (2019). Continuous adaptive evolution of a fast-growing Corynebacterium glutamicum strain independent of protocatechuate. Front. Microbiol. 10:1648. doi: 10.3389/fmicb.2019.01648
Graf, M., Zieringer, J., Haas, T., Nieß, A., Blombach, B., and Takors, R. (2018). Physiological response of Corynebacterium glutamicum to increasingly nutrient-rich growth conditions. Front. Microbiol. 9:2058. doi: 10.3389/fmicb.2018.02058
Grünberger, A., van Ooyen, J., Paczia, N., Rohe, P., Schiendzielorz, G., Eggeling, L., et al. (2013). Beyond growth rate 0.6: corynebacterium glutamicum cultivated in highly diluted environments. Biotechnol. Bioeng. 110, 220–228. doi: 10.1002/bit.24616
Haas, T., Graf, M., Nieß, A., Busche, T., Kalinowski, J., Blombach, B., et al. (2019). Identifying the Growth Modulon of Corynebacterium glutamicum. Front. Microbiol. 10:974. doi: 10.3389/fmicb.2019.00974
Han, S. O., Inui, M., and Yukawa, H. (2008a). Effect of carbon source availability and growth phase on expression of Corynebacterium glutamicum genes involved in the tricarboxylic acid cycle and glyoxylate bypass. Microbiology 154, 3073–3083. doi: 10.1099/mic.0.2008/019828-0
Han, S. O., Inui, M., and Yukawa, H. (2008b). Transcription of Corynebacterium glutamicum genes involved in tricarboxylic acid cycle and glyoxylate cycle. J. Mol. Microbiol. Biotechnol. 15, 264–276. doi: 10.1159/000117614
Hermann, T. (2003). Industrial production of amino acids by coryneform bacteria. J. Biotechnol. 104, 155–172. doi: 10.1016/S0168-1656(03)00149-4
Hoffart, E., Grenz, S., Lange, J., Nitschel, R., Müller, F., Schwentner, A., et al. (2017). High substrate uptake rates empower Vibrio natriegens as production host for industrial biotechnology. Appl. Environ. Microbiol. 83:AEM.1614-17. doi: 10.1128/AEM.01614-17
Hoskisson, P. A., and Hobbs, G. (2005). Continuous culture–making a comeback? Microbiology 151, 3153–3159. doi: 10.1099/mic.0.27924-0
Ikeda, M., Mizuno, Y., Awane, S. I., Hayashi, M., Mitsuhashi, S., and Takeno, S. (2011). Identification and application of a different glucose uptake system that functions as an alternative to the phosphotransferase system in Corynebacterium glutamicum. Appl. Microbiol. Biotechnol. 90, 1443–1451. doi: 10.1007/s00253-011-3210-x
Jungreuthmayer, C., Neubauer, S., Mairinger, T., Zanghellini, J., and Hann, S. (2016). ICT: isotope correction toolbox. Bioinformatics 32, 154–156. doi: 10.1093/bioinformatics/btv514
Kappelmann, J., Wiechert, W., and Noack, S. (2016). Cutting the gordian knot: identifiability of anaplerotic reactions in Corynebacterium glutamicum by means of 13C-metabolic flux analysis. Biotechnol. Bioeng. 113, 661–674. doi: 10.1002/bit.25833
Klaffl, S., Brocker, M., Kalinowski, J., Eikmanns, B. J., and Bott, M. (2013). Complex regulation of the phosphoenolpyruvate carboxykinase gene pck and characterization of its GntR-type regulator IolR as a repressor of myo-inositol utilization genes in Corynebacterium glutamicum. J. Bacteriol. 195, 4283–4296. doi: 10.1128/JB.00265-13
Koch-Koerfges, A., Pfelzer, N., Platzen, L., Oldiges, M., and Bott, M. (2013). Conversion of Corynebacterium glutamicum from an aerobic respiring to an aerobic fermenting bacterium by inactivation of the respiratory chain. Biochim. Biophys. Acta 1827, 699–708. doi: 10.1016/j.bbabio.2013.02.004
Lindner, S. N., Knebel, S., Pallerla, S. R., Schoberth, S. M., and Wendisch, V. F. (2010). Cg2091 encodes a polyphosphate/ATP-dependent glucokinase of Corynebacterium glutamicum. Appl. Microbiol. Biotechnol. 2010 87, 703–713. doi: 10.1007/s00253-010-2568-5
Lindner, S. N., Seibold, G. M., Henrich, A., Krämer, R., and Wendisch, V. F. (2011). Phosphotransferase system-independent glucose utilization in Corynebacterium glutamicum by inositol permeases and glucokinases. Appl. Environ. Microbiol. 77, 3571–3581. doi: 10.1128/AEM.02713-10
Long, C. P., Gonzalez, J. E., Cipolla, R. M., and Antoniewicz, M. R. (2017). Metabolism of the fast-growing bacterium Vibrio natriegens elucidated by 13C metabolic flux analysis. Metab. Eng. 44, 191–197. doi: 10.1016/j.ymben.2017.10.008
Love, M. I., Huber, W., Anders, S., Lönnstedt, I., Speed, T., Robinson, M., et al. (2014). Moderated estimation of fold change and dispersion for RNA-seq data with DESeq2. Genome Biol. 15:550. doi: 10.1186/s13059-014-0550-8
Marx, A., de Graaf, A. A., Wiechert, W., Eggeling, L., and Sahm, H. (1996). Determination of the fluxes in the central metabolism of Corynebacterium glutamicum by nuclear magnetic resonance spectroscopy combined with metabolite balancing. Biotechnol. Bioeng. 49, 111–129. doi: 10.1002/(sici)1097-0290(19960120)49:2<111::aid-bit1>3.0.co;2-t
Möllney, M., Wiechert, W., Kownatzki, D., and de Graaf, A. A. (1999). Bidirectional reaction steps in metabolic networks: iV. Optimal design of isotopomer labeling experiments. Biotechnol. Bioeng. 66, 86–103. doi: 10.1002/(sici)1097-0290(1999)66:2<86::aid-bit2>3.0.co;2-a
Neidhardt, F. C., Ingraham, J. L., and Schaechter, M. (1990). Physiology of the Bacterial Cell — A Molecular Approach. Sunderland, MA: Sinauer Associates.
Noack, S., Voges, R., Gätgens, J., and Wiechert, W. (2017). The linkage between nutrient supply, intracellular enzyme abundances and bacterial growth: new evidences from the central carbon metabolism of Corynebacterium glutamicum. J. Biotechnol. 258, 13–24. doi: 10.1016/j.jbiotec.2017.06.407
Nöh, K., Droste, P., and Wiechert, W. (2015). Visual workflows for 13C-metabolic flux analysis. Bioinformatics 31, 346–354. doi: 10.1093/bioinformatics/btu585
Nueda, M. J., Tarazona, S., and Conesa, A. (2014). Next maSigPro: updating maSigPro bioconductor package for RNA-seq time series. Bioinformatics 30, 2598–2602. doi: 10.1093/bioinformatics/btu333
Park, S. Y., Kim, H. K., Yoo, S. K., Oh, T. K., and Lee, J. K. (2000). Characterization of glk, a gene coding for glucose kinase of Corynebacterium glutamicum. FEMS Microbiol. Lett. 188, 209–215. doi: 10.1111/j.1574-6968.2000.tb09195.x
Pfeifer, E., Gätgens, C., Polen, T., and Frunzke, J. (2017). Adaptive laboratory evolution of Corynebacterium glutamicum towards higher growth rates on glucose minimal medium. Sci. Rep. 7:16780. doi: 10.1038/s41598-017-17014-9
Pirt, S. J. (1982). Maintenance energy: a general model for energy-limited and energy-sufficient growth. Arch. Microbiol. 133, 300–302. doi: 10.1007/bf00521294
Powell, M. J. (2015). On fast trust region methods for quadratic models with linear constraints. Math. Program. Comput. 7, 237–267. doi: 10.1007/s12532-015-0084-4
Riedel, C., Rittmann, D., Dangel, P., Möckel, B., Petersen, S., Sahm, H., et al. (2001). Characterization of the phosphoenolpyruvate carboxykinase gene from Corynebacterium glutamicum and significance of the enzyme for growth and amino acid production. J. Mol. Microbiol. Biotechnol. 3, 573–583.
Sambrook, J. (2001). Molecular Cloning: A Laboratory Manual. Cold Spring Harbor, NY: Cold Spring Harbor Laboratory Press.
Shah, A., Blombach, B., Gauttam, R., and Eikmanns, B. J. (2018). The RamA regulon: complex regulatory interactions in relation to central metabolism in Corynebacterium glutamicum. Appl. Microbiol. Biotechnol. 102, 5901–5910. doi: 10.1007/s00253-018-9085-3
Silberbach, M., Schäfer, M., Hüser, A. T., Kalinowski, J., Pühler, A., Krämer, R., et al. (2005). Adaptation of Corynebacterium glutamicum to ammonium limitation: a global analysis using transcriptome and proteome techniques. Appl. Environ. Microbiol. 71, 2391–2402. doi: 10.1128/AEM.71.5.2391-2402.2005
Unthan, S., Grünberger, A., van Ooyen, J., Gätgens, J., Heinrich, J., Paczia, N., et al. (2014). Beyond growth rate 0.6: what drives Corynebacterium glutamicum to higher growth rates in defined medium. Biotechnol. Bioeng. 111, 359–371. doi: 10.1002/bit.25103
van Ooyen, J., Emer, D., Bussmann, M., Bott, M., Eikmanns, B. J., and Eggeling, L. (2011). Citrate synthase in Corynebacterium glutamicum is encoded by two gltA transcripts which are controlled by RamA. RamB, and GlxR. J. Biotechnol. 154, 140–148. doi: 10.1016/j.jbiotec.2010.07.004
Vertès, A. A., Inui, M., and Yukawa, H. (2012). Postgenomic approaches to using corynebacteria as biocatalysts. Annu. Rev. Microbiol. 66, 521–550. doi: 10.1146/annurev-micro-010312-105506
Wang, Z., Liu, J., Chen, L., Zeng, A. P., Solem, C., and Jensen, P. R. (2018). Alterations in the transcription factors GntR1 and RamA enhance the growth and central metabolism of Corynebacterium glutamicum. Metab. Eng. 48, 1–12. doi: 10.1016/j.ymben.2018.05.004
Weitzel, M., Nöh, K., Dalman, T., Niedenführ, S., Stute, B., and Wiechert, W. (2013). 13CFLUX2—high-performance software suite for 13C-metabolic flux analysis. Bioinformatics 29, 143–145. doi: 10.1093/bioinformatics/bts646
Wendisch, V. F., Bott, M., and Eikmanns, B. J. (2006). Metabolic engineering of Escherichia coli and Corynebacterium glutamicum for biotechnological production of organic acids and amino acids. Curr. Opin. Microbiol. 9, 268–274. doi: 10.1016/j.mib.2006.03.001
Wiechert, W., Siefke, C., de Graaf, A. A., and Marx, A. (1997). Bidirectional reaction steps in metabolic networks: iI. flux estimation and statistical analysis. Biotechnol. Bioeng. 55, 118–135. doi: 10.1002/(sici)1097-0290(19970705)55:1<118::aid-bit13>3.0.co;2-i
Xu, J.-Z., Yu, H. B., Han, M., Liu, L.-M., and Zhang, W.-G. (2019). Metabolic engineering of glucose uptake systems in Corynebacterium glutamicum for improving the efficiency of L-Lysine production. J. Indust. Microbiol. Biotechnol. 46, 937–949. doi: 10.1007/s10295-019-02170-w
Yokota, A., and Lindley, N. D. (2005). “10 Central Metabolism: Sugar Uptake and Conversion,” in Handbook of Corynebacterium Glutamicum, Vol. 2005, eds L. Eggeling and M. Bott (Boca Raton: Taylor & Francis), 215–242. doi: 10.1201/9781420039696.pt5
Keywords: Corynebacterium glutamicum, growth rate, metabolome, transcriptome, continuous bioprocess, stationary flux analysis
Citation: Graf M, Haas T, Teleki A, Feith A, Cerff M, Wiechert W, Nöh K, Busche T, Kalinowski J and Takors R (2020) Revisiting the Growth Modulon of Corynebacterium glutamicum Under Glucose Limited Chemostat Conditions. Front. Bioeng. Biotechnol. 8:584614. doi: 10.3389/fbioe.2020.584614
Received: 17 July 2020; Accepted: 23 September 2020;
Published: 15 October 2020.
Edited by:
Christoph Herwig, Vienna University of Technology, AustriaCopyright © 2020 Graf, Haas, Teleki, Feith, Cerff, Wiechert, Nöh, Busche, Kalinowski and Takors. This is an open-access article distributed under the terms of the Creative Commons Attribution License (CC BY). The use, distribution or reproduction in other forums is permitted, provided the original author(s) and the copyright owner(s) are credited and that the original publication in this journal is cited, in accordance with accepted academic practice. No use, distribution or reproduction is permitted which does not comply with these terms.
*Correspondence: Ralf Takors, dGFrb3JzQGlidnQudW5pLXN0dXR0Z2FydC5kZQ==
†These authors have contributed equally to this work