 Félix L. Santiago-Collazo
 Matthew V. Bilskie
 Peter Bacopoulos
 Scott C. Hagen
- 1Department of Civil and Environmental Engineering, Louisiana State University, Baton Rouge, LA, United States
- 2School of Environmental, Civil, Agricultural, and Mechanical Engineering, University of Georgia, Athens, GA, United States
- 3Center for Coastal Resiliency, Louisiana State University, Baton Rouge, LA, United States
- 4Center for Computation and Technology, Louisiana State University, Baton Rouge, LA, United States
Recent events worldwide demonstrate how coastal communities of integrated natural and human systems are exposed to hydrological and coastal flooding processes. Standard flood hazard assessment practices account independently for rainfall-runoff, tides, storm surge flooding and not the non-linear combination commonly defined as compound flooding. This research evaluates compound flood hazard zones for past, present, and future (c. 1890–2090) conditions of the Mississippi River Delta Plain (MRDP). The MRDP provides a low-gradient coastal land-margin representing similar landscapes around the world that are experiencing relative sea-level rise and serves as a warning beacon for our coastal settlements. A set of plausible synthetic storms and rainfall events, which account for antecedent rainfall-runoff, tropical cyclone-driven rainfall, and tropical cyclone-driven surge, are employed in a tide and surge hydrodynamic model that integrates rain over the mesh. This study demonstrates the evolution of the compound flood hazard zones from the 1890s, before major western settlement and alterations to the Mississippi River and deltaic system, to the present day and out to 2090. Furthermore, near-future projections of the compound flood hazard zones suggest that the coastal flood zone will suffer the most significant changes in coverage area due to a combination of increasing eustatic sea-level rise and alterations to the coastal land-margin during low flood events. Our results emphasize the need to establish evolution trends of compound flood hazard zones to enable more descriptive future projections under a changing climate. Such projections will aid policy-makers, stakeholders, and authorities as they pursue enhanced coastal resilience to compound flooding.
Introduction
The origins of the Mississippi River Delta Plain (MRDP) can be traced to the end of the last ice age (i.e., ~22,000 years before the present time) when glacial melt increased sediments deposited in coastal Louisiana (Keddy et al., 2007). Before major western settlement, the Mississippi River brought sediment-rich water to its deltaic plain during high flow events, maintaining its ecosystem, and transforming marsh regions into swamps. Conversely, during low flow events, the river meandered and cut terraces, which transformed swamps into open marsh (Keddy et al., 2007). During the 1930s, multiple levees were constructed throughout the MRDP. While these levee systems protected communities from high flood events, they also hydraulically disconnected the river from its deltaic plain. These river management actions reduced the inputs of riverine freshwater, sediment, and nutrients, which initiated the environmental downfall of the MRDP. The compaction due to subsurface mining (i.e., hydrocarbon and groundwater) and eustatic sea-level rise (SLR) exacerbate the environmental issues of the MRDP (Blum and Roberts, 2009; Syvitski et al., 2009; Batker et al., 2010). Saltwater intrusion, longer-duration flooding, lack of recruitment in cypress wetlands, reduced accretion rates, subsidence, and diminished wetland productivity, including marsh collapse (Hiatt et al., 2019), are some complications to the resilience of the coupled natural and human system facing the sediment-starved MRDP. Over the last century, the MRDP has lost about 5,000 km2 of coastal Louisiana wetlands, including submergence of most barrier islands (Batker et al., 2010; Nienhuis et al., 2017; Hiatt et al., 2019).
The dynamic behavior of the MRDP represents a constant challenge when it comes to quantifying and forecasting long-term flood hazards within the coastal land-margin. Siverd et al. (2018) developed a procedure to represent various eras of Louisiana's coastal landscape via land-to-water isopleths. The land-to-water isopleths were used to classify three general landscape regions: submerged (i.e., open water to wetland), intermediate (i.e., wetland), and high (i.e., high wetland). Siverd et al. (2019b) used the land-to-water isopleths technique to develop simplified coastal landscapes for storm surge modeling that represented historical conditions (e.g., c. 1850, 1890, 1930, 1970, 1990, and 2010) and future projections (e.g., c. 2030, 2050, 2070, 2090, and 2110) of the MRDP. Their research found that local land and river management practices that starved the MRDP from critical sediment sources led to accelerated relative SLR that exacerbated coastal surge flood characteristics for the near-term historical and impending future conditions of the Louisiana coastal land-margin. Therefore, the rural and inland coastal communities across this low-gradient deltaic system likely face substantial challenges (e.g., emigration, property damage, increased pressure on built infrastructure, and loss of life) in the near-term future.
Many researchers have performed flood hazard assessments for future climate projections using general circulation models (Rojas et al., 2012; Winsemius et al., 2016; Perera et al., 2017; Shrestha and Lohpaisankrit, 2017; Doroszkiewicz et al., 2018; Vousdoukas et al., 2018; Sajjad et al., 2020; Bates et al., 2021). Other studies used alteration of the landscape, such as land use/land cover and topography and bathymetric elevations, to assess future and historical conditions (Bilskie et al., 2014, 2016, 2019; Machado et al., 2015; Passeri et al., 2015a, 2018; Siverd et al., 2019a,b, 2020). Missing from the assessments to-date is the consideration of compound flooding from rainfall-runoff and coastal surges, except for Bates et al. (2021), which assesses the compound flood hazard for future projections of 2035 and 2050.
When two or more flooding mechanisms occur in close succession or simultaneously, the event is known as a compound flood (Santiago-Collazo et al., 2019). Flood inundation maps produced from a compound flood study can delineate flood hazard zones due to rainfall-runoff, storm surge, and their combination (Bilskie et al., 2021). However, simulating compound flooding presents several challenges that extend from computational modeling and the prerequisite environmental drivers. Therefore, there is a need for additional research on compound flood hazard modeling, especially for varying temporal conditions.
The present study's objective is to demonstrate a flood hazard assessment with compound modeling of rainfall-runoff and storm surge that spans across the dimensions of annual exceedance probability and historical/future eras (mean sea level and coastal landscape features). This research effort entails a detailed flood hazard assessment that encompasses multiple drivers of compound flooding. The methods presented by Bilskie et al. (2021) were adopted to delineate compound flood hazard zones in two Louisiana coastal watersheds: Barataria and Lake Maurepas. The methods are described next, including the selected hydrodynamic model, the model inputs, and the technique for delineating the compound flood hazard zone. The compound flood hazard zones are based on the flooding mechanisms that dominated the region, which are divided into hydrologic, coastal, and transition hazard zone. To assess the evolution of the compound flood hazard zones, the coastal landscapes (e.g., c. 1890–2090) developed by Siverd et al. (2019b) are used in the compound flood modeling framework of Bilskie et al. (2021). The spatial extent and rate of change in the coverage area of each compound flood hazard zones are quantified for each coastal land-margin condition, from which the evolution of the compound flood hazard zones are evaluated. Finally, the isolated influence of the eustatic component of SLR in the compound flood hazard zones is assessed to determine the effects of historical vs. current conditions of the coastal land-margin.
Methods
Study Area
The study area consists of two distinct coastal watersheds within southeastern Louisiana: the Barataria watershed and the Lake Maurepas watershed. The Barataria watershed is enclosed by the Mississippi River and Bayou Lafourche and drains into the northern Gulf of Mexico (Figure 1A). The watershed catchment size is ~7,000 km2 with elevations ranging from −28 m (i.e., bathymetric depth) to 40 m (i.e., topographic elevation) NAVD88. The watershed's perimeter consists of natural ridges and levees, while the watershed interior holds forested wetlands, lakes, marshes, and estuaries. More specifically, most of the land use/land cover at this watershed consists of palustrine wetland with 28%, followed by estuarine wetland with 16%, cultivated area with 7%, and developed area with 5% (NOAA, 2016). The only freshwater input to this watershed is rainfall since Bayou Lafourche was hydraulically disconnected from the Mississippi River in 1900, and the Mississippi River continuous levees system, built in the 1930's decade, prevents riverine water input into the watershed (Day et al., 2021). Therefore, the lack of sediment and nutrients, in addition to SLR and subsidence, increased the wetland loss within the watershed, with rates of 28 km2 yr−1 from 1978 to 1990 (Barras et al., 1994). Future scenarios without any protective measurements project that this watershed may convert one-fifth of its wetlands to open water by 2045, where 65% of this wetland loss would occur in the southern half of the basin (CWPPRA, 1995).
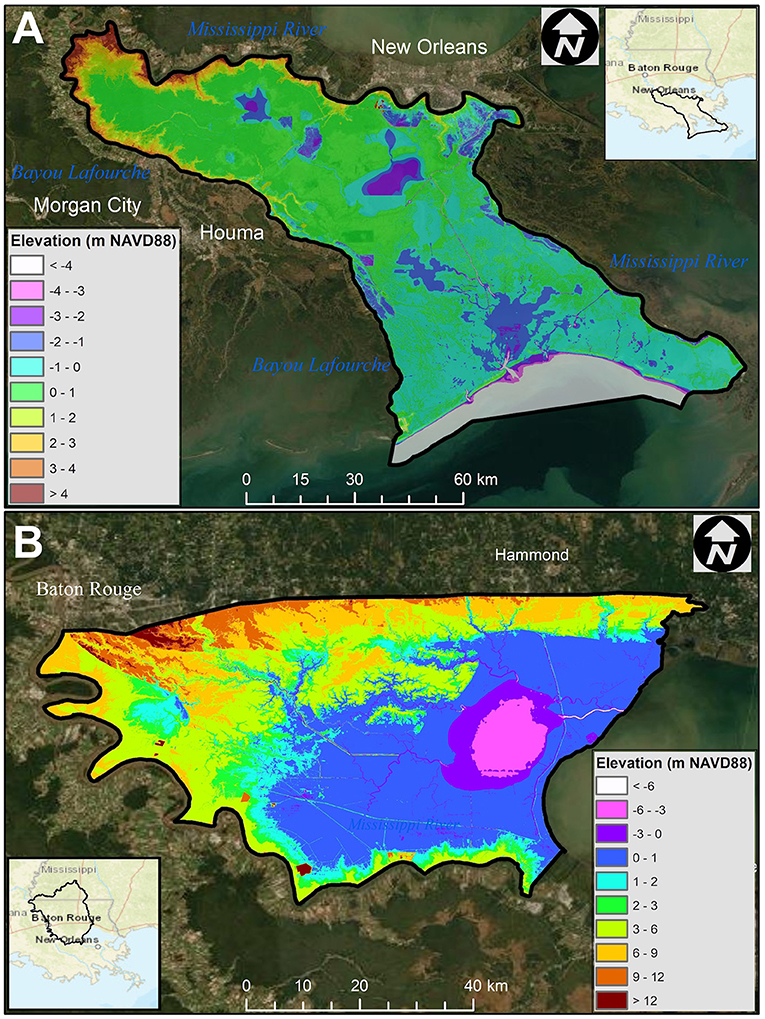
Figure 1. Location of the study area within southeastern Louisiana. Topographic and bathymetric elevations (m,NAVD88) are shown for the (A) Barataria watershed and the (B) Lake Maurepas watershed. Service Layer Credits: Esri, Maxar, GeoEye, Earthstart Geographics, CNES/Airbus DS, USDA, USGS, AeroGRID, IGN, and the GIS User Community.
The Lake Maurepas watershed extends from southwestern Mississippi to Lake Maurepas and includes Baton Rouge, which drains through the Amite and Comite rivers. This watershed drains to Lake Maurepas, which flows through Lake Pontchartrain, then Lake Borgne, and finally reaches the Gulf of Mexico. The watershed catchment size is ~14,455 km2, with elevations ranging from 152 to −18 m NAVD88. The portions of this watershed that were considered for this study were south of Interstate 10 (i.e., between Hammond and Baton Rouge) due to the hydrodynamic model's northern boundary (Figure 1B). This area encompasses 3,360 km2, representing 27% of the total watershed area, with a maximum elevation of 34 m NAVD88. The principal land use/land cover at this region consists of palustrine wetland (south region) with 48%, developed area (northwest region) with 13%, and evergreen forest (north region) with 8% (NOAA, 2016).
Hydrodynamic Model
The hydrodynamic model used to perform the computations was the ADvanced CIRCulation (ADCIRC) model. The model solves the generalized wave-continuity equation, a form of the depth-integrated shallow water equation, for water surface elevation and velocity at every node of an unstructured finite element mesh (Luettich et al., 1992). The simulations performed had the following specifications: one second time step, wetting and drying activated with a 5 cm threshold, the baroclinic and advection terms not activated, and a spatially-constant horizontal eddy viscosity equal to 50 m2/s (Bilskie et al., 2021). Bilskie et al. (2021) developed a rain-on-mesh module within the ADCIRC model source code to account for rainfall-runoff. This module applied rainfall over individual mesh nodes and elements depending on their current wet/dry status. For example, nodes classified as wet received the total amount of rainfall corresponding to a time step increment, which is then added to the current water surface elevation at that node. Meanwhile, for dry nodes, rainfall is only accounted at a mesh node after its accumulation surpasses a specific threshold (i.e., 50 mm), which then changes the node status from dry to wet. When all three nodes from an element have changed their status from dry to wet, then the element itself is considered wet, and the rainfall is accounted in the computations. If multiple rainfall events are being considered simultaneously, the rain-on-mesh module selects the maximum rainfall intensity occurring at each mesh node for each time step.
The unstructured meshes used to represent the historical conditions and future projections of the coastal-land margin were adopted from the Siverd et al. (2019b) study. These unstructured meshes span from the western North Atlantic Ocean (i.e., westward the 60 degrees longitude) and contain 1,478,916 vertices and 2,921,898 elements. The mesh resolution is highest at the Louisiana coastline (e.g., tens to hundreds of meters) and lesser elsewhere (e.g., kilometers to tens of kilometers). Nodal elevations varied according to the zone classification of each mesh. This zone classification was based on the land-to-water isopleths derived from Siverd et al. (2018). The zones classified as high, intermediate, and submersed had elevations (NAVD88) of 0.47, 0.27, and −0.98 m, respectively. Similarly, the Manning's n bottom roughness values for the high, intermediate, and submersed zone were 0.070, 0.045, and 0.025, respectively. Each unstructured mesh had an initial Gulf of Mexico water level specified for the hydrodynamic model (Figure 2). They represented the initial conditions of the model simulations due to observed historical eustatic SLR measurements and a conservative future eustatic SLR scenario [i.e., Intermediate-Low scenario from Sweet et al. (2007)]. More details on the hydrodynamic model and the unstructured meshes can be found at Bilskie et al. (2021) and Siverd et al. (2019b), respectively.
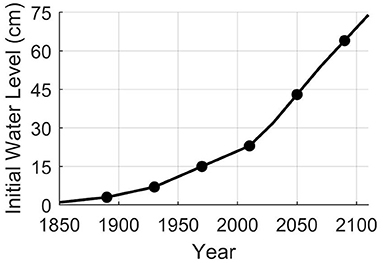
Figure 2. Gulf of Mexico initial water levels for each era used to represent the initial conditions of the hydrodynamic model simulation based on observed historical measurements and a conservative future scenario (i.e., Intermediate-Low scenario from Sweet et al., 2007) of eustatic sea level rise. The dots represents the eras analyzed for the study [Adapted from Siverd et al. (2019b)].
The historical conditions analyzed for this study were circa 1890, 1930, 1970, and 2010. The 2010 condition is considered the base condition since it is the current time's nearest representation (i.e., 2021). The coastal land-margin representation of the circa 1850 conditions was not selected since, according to Siverd et al. (2019b), the storm surge differences between 1850 and 1890 conditions were minimal. The selected future conditions were circa 2050 and 2090 to keep a consistent 40-yr interval between each era, as with the historical conditions selected. Therefore, six different coastal land-margin configurations, represented as unstructured meshes, were evaluated under various compound flood events to assess the flood hazard zone's migration over time.
Compound Flood Model Inputs Used to Generate Flood Hazard Zones
The compound flood event evaluated in this study consisted of two flooding mechanisms: rainfall-runoff and storm surge. This compound flood event consists of two separate events that occur in close succession: an antecedent rainfall event and a tropical cyclone event. First, an antecedent rainfall event floods the area of study with rainfall-runoff. This event can occur due to intense and prolonged rainfall events brought by low-pressure areas that move from west to east within the mainland or warm fronts that bring moisture from the Gulf of Mexico into the mainland. This antecedent rainfall event is a flood event independent from any tropical cyclone event and occurs before the tropical cyclone's landfall. The antecedent rainfall event characteristics (i.e., rainfall accumulation and temporal and spatial distribution) were obtained from seven observed rain gauge data within the study area and occurred within 3 days before a tropical cyclone landfall [see location in Figure 1A on Bilskie et al. (2021)]. Six of these rain gauges reported hourly rainfall, while one reported daily rainfall totals. After excluding the tropical cyclones with a central pressure higher than 990 mb, 21 storms were considered for this analysis, ranging from 1948 to 2019. The complete list of the selected tropical cyclones is found at Bilskie et al. (2021).
Second, the tropical cyclone characteristics (i.e., central pressure, forward speed, radius, and wind speed) were derived from a small set of synthetic storms (i.e., tropical cyclones) extracted from the FEMA storm suite (FEMA and USACE, 2008) at each watershed. These synthetic storms were selected based on the flood water level produced by them, targeting different annual exceedance probability (AEP) floods (i.e., return periods) published by FEMA (Bilskie et al., 2021). The 10, 2, and 1% AEP flood levels are considered and referred to herein as low, medium, and high flood events, respectively. For example, a synthetic storm that produced inundation levels within the study area, similar to the 2% AEP (i.e., 50-yr return period) flood water levels, was labeled as a medium flood event. This set of synthetic storms consisted of four storms per flood magnitude (i.e., AEP flood levels) at each watershed, where three flood magnitudes (e.g., low, medium, and high) were considered. These synthetic storms were selected by (i) sorting the potential storms in ascending order of the differences between the resulting peak storm surge and the targeted AEP water levels published by FEMA, (ii) eliminating the storms that made landfall farther than twice the radius of maximum wind from the study area, and (iii) prioritizing the potential storms that had different parameters (e.g., radius of maximum winds, forward speed, central pressure, and wind speed). Therefore, a total of 23 synthetic storms (i.e., 12 storms for each watershed and one storm is repeated for both) were selected to represent the flood component of a tropical cyclone event in the compound flood event. The rainfall associated with the tropical cyclone event was considered by employing a parametric tropical cyclone rainfall model (Lonfat et al., 2004; US Army Corps of Engineers, 2006). This model estimates the spatially-varying rainfall intensity based on the distance from the tropical cyclone center, azimuth relative to the forward cyclone motion, central pressure deficit, radius of maximum winds, and vertical wind shear (Bilskie et al., 2021).
Four different flooding scenarios were evaluated using each of the synthetic storms. These flooding scenarios are (i) storm surge only, (ii) storm surge and rainfall from the tropical cyclone, (iii) rainfall from the antecedent rainfall event only, and (iv) storm surge, rainfall from the tropical cyclone, and rainfall from the antecedent rainfall event (i.e., combined flood). Note that the results from the storm surge only scenario are only used for quality assurance and quality control of the simulations considering storm surge and are not shown here. These flooding scenarios resulted in 48 simulations for each watershed and 96 simulations for each unstructured mesh. Therefore, 576 simulations were performed to assess the compound flood hazard zones in the historical conditions and future projections.
Flood Hazard Zone Delineation
The compound flood hazard zones are determined from the flooding mechanisms that dominate the compound flood in a specific region. Therefore, three compound flood hazard zones are identified: hydrologic, coastal, and transition. These flood zones were delineated following the method proposed by Bilskie and Hagen (2018). Their work is based on maximum water level for three different flooding scenario: storm surge and rainfall from the tropical cyclone (i.e., ζS), rainfall from the antecedent rainfall event (i.e., ζR), and storm surge and rainfall from the tropical cyclone and antecedent rainfall event (i.e., ζC). The hydrologic flood zone is defined as the region where the flood is dominated by the rainfall-runoff (i.e., ζC ≈ ζR). The coastal flood zone is defined as the region where the flood is dominated by storm surges (i.e., ζS > ζR). Lastly, the transition flood zone is defined as the regions where both the storm surge and rainfall-runoff have influenced the compound flood (i.e., ζR > ζS and ζC > ζR).
The three flood hazard zones are delineated for each of the synthetic storms selected; therefore, there are four sets of flood hazard zones for each flood magnitude. These four sets of flood hazard zones are combined into a single flood hazard zone for each flood magnitude. Therefore, the compound flood hazard zones delineated in this study represent the flood hazard zones for the flood conditions under the combination of antecedent and tropical storms with like flood frequencies. To be clear, the compound flood hazard zones that are generated are only an approximation of a given return period by applying return period environmental forcings where each (i.e., antecedent rainfall and tropical storm) have individual AEPs. The combined coastal flood hazard zone was determined as a coastal flood hazard zone where the four individual coastal flood hazard zones for a given flood magnitude overlap each other. Similarly, the combined hydrologic flood hazard zone was determined as a hydrologic flood hazard zone where the four individual hydrologic flood hazard zones for a given flood magnitude overlap each other. Finally, the combined transition flood hazard zone was determined as a transition flood hazard zone where at least one of the individual transition flood hazard zones for a given flood magnitude occurred. Thus, overall, each watershed will have three combined flood hazard zones (e.g., coastal, hydrologic, and transition) without any other possibility.
Results
Flood Hazard Zone Spatial Distribution
The compound flood hazard zones are delineated for each historical (e.g., c. 1890, 1930, and 1970), base (e.g., c. 2010), and future condition (e.g., c. 2050 and 2090). The flood hazard zones presented in Figures 3, 4 correspond to the combined low flood (i.e., 10-yr return period or 10% AEP flood) events for the Barataria and Lake Maurepas watershed, respectively. These results illustrate the spatial coverage of each flood hazard zone and how it changes for each era. The coastal flood zone on the Barataria watershed inundates further inland over the ensuing decades and overtakes previously defined hydrologic and transition flood zone areas. This change is most prominent along the watershed's eastern boundary. This same behavior occurs within the Lake Maurepas watershed but to a lesser degree. As time progresses, the coastal flood zone moves westward, and the transition flood zone pushes south. Additional flood hazard zone maps for the combined medium flood (i.e., 50-yr return period or 2% AEP flood) events (Supplementary Figures 1, 3) and the combined high flood (i.e., 100-yr return period or 1% AEP flood) events (Supplementary Figures 2, 4) are presented in the Supplementary Material section.
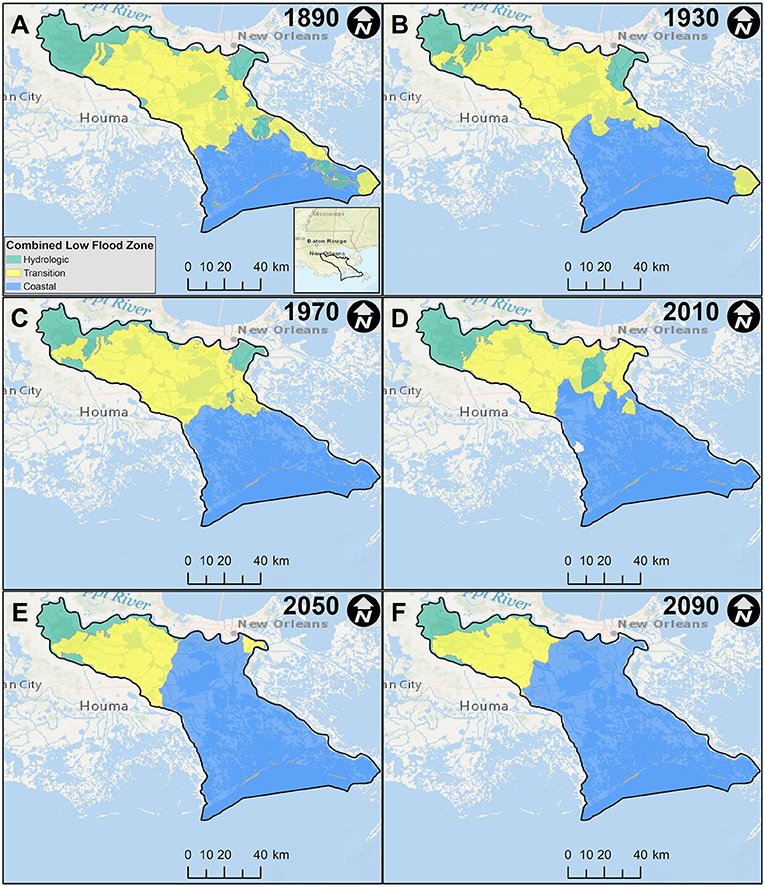
Figure 3. Compound flood hazard zone delineation for the Barataria watershed using low flood events for (A) 1890, (B) 1930, (C) 1970, (D) 2010, (E) 2050, and (F) 2090. Service Layer Credits: Esri, Garmin, GEBCO, NOAA NGDC, OpenStreetMap, and the GIS User Community.

Figure 4. Compound flood hazard zone delineation for the Lake Maurepas watershed using low flood events for (A) 1890, (B) 1930, (C) 1970, (D) 2010, (E) 2050, and (F) 2090. Service Layer Credits: Esri, Garmin, GEBCO, NOAA NGDC, OpenStreetMap, and the GIS User Community.
Barataria Watershed
In the Barataria watershed, the coastal flood zone dominates the base condition (i.e., the 2010 era) by covering 60% of its total basin area average across all flood magnitudes (Figure 5). The transition and hydrologic flood zones follow with 33 and 7%, respectively, averaged over all flood magnitudes. A similar distribution occurs for the historical and future conditions, except for 1890 and 1930. In 1930, the coastal and transition flood zones are virtually the same, with each flood zone encompassing 46% of the basin area, on average, and 8% of the basin area for the hydrologic flood zone. In terms of spatial coverage, the dominant flood hazard for the 1890 condition is the transition flood zone with 53% of the basin area, followed by the coastal and the hydrologic flood zone with 37 and 10% on average across all flood magnitudes, respectively. With increasing flood magnitude for the base condition, the most considerable variation in flood hazard zone coverage occurs at the hydrologic flood zone with a decrease of 11%. Following are the coastal flood zone with an increase of 9% of basin area, while the transition flood zone remained relatively stable (i.e., differences within 2%). This behavior at the base condition occurs for the historical and future conditions as the flood magnitude increases. The coastal flood zone coverage area increases in time for all flood magnitudes, with its minimum in 1890 and its maximum in 2090 (Figure 5). The coverage area reduces in time for all flood magnitudes of the transition flood zone, with its minimum in 2090 and maximum in 1890. A clear trend could not be established for the hydrologic flood zone since its coverage fluctuates within 3% through time for the medium and high flood events. However, the coverage area reduces in time for the low flood event, except for the base condition.
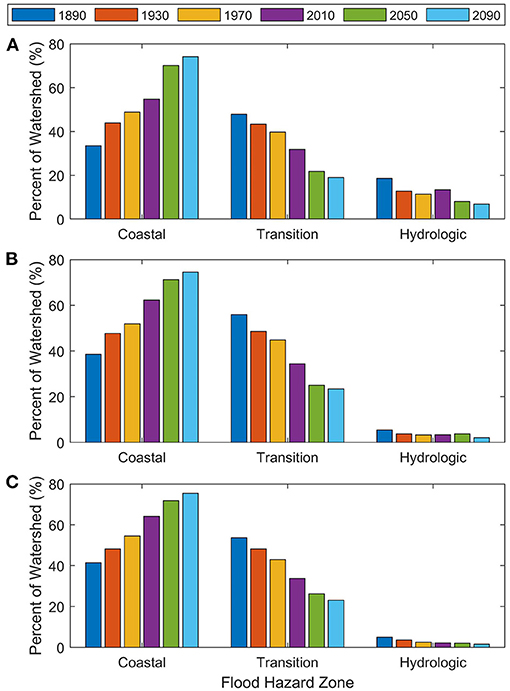
Figure 5. Percent of the watershed made up of each flood hazard zone for the Barataria watershed under different flood magnitudes: (A) low, (B) medium, and (C) high flood events. Each bar color represents a different era condition.
The evolution of the coastal and hydrologic flood zone extents is evaluated under different flood magnitudes for the Barataria watershed (Figure 6). The transition flood zone is not considered in this analysis since it is bounded by both the hydrological and coastal flood zone. In the Barataria watershed, the extent of the hydrologic flood zone does not vary significantly compared to the coastal flood zone extent's temporal evolution, specifically for more severe flood events (e.g., medium and high flood events). A noticeable difference is observed for the 1890 hydrologic flood zone extent under the low flood event (Figure 6B), with the largest coverage area for any era or flood magnitude. These differences occur mainly at the northwestern region of the watershed, where the palustrine forested wetland is currently (i.e., present conditions) the dominating landscape with cultivated land close to the watershed borders. However, these changes are small (e.g., <1% of the total basin area) in terms of the total coverage area of the hydrologic flood zone. Conversely, the coastal flood extent's temporal evolution shows a more significant difference between them under each flood magnitude analyzed, especially at the eastern boundary and central region of the watershed (Figures 6A,C,E). The central regions are currently dominated by palustrine emergent wetland, while the east boundary is dominated by developed land (e.g., south of New Orleans proper), which is protected by a levee system. The guidance of Siverd et al. (2019b) is followed to not include any levee system south and west of the Mississippi River to compare changes in storm surge characteristics due to land loss across all coastal landscapes, which in this case is to evaluate compound flood hazard zones across the eras.
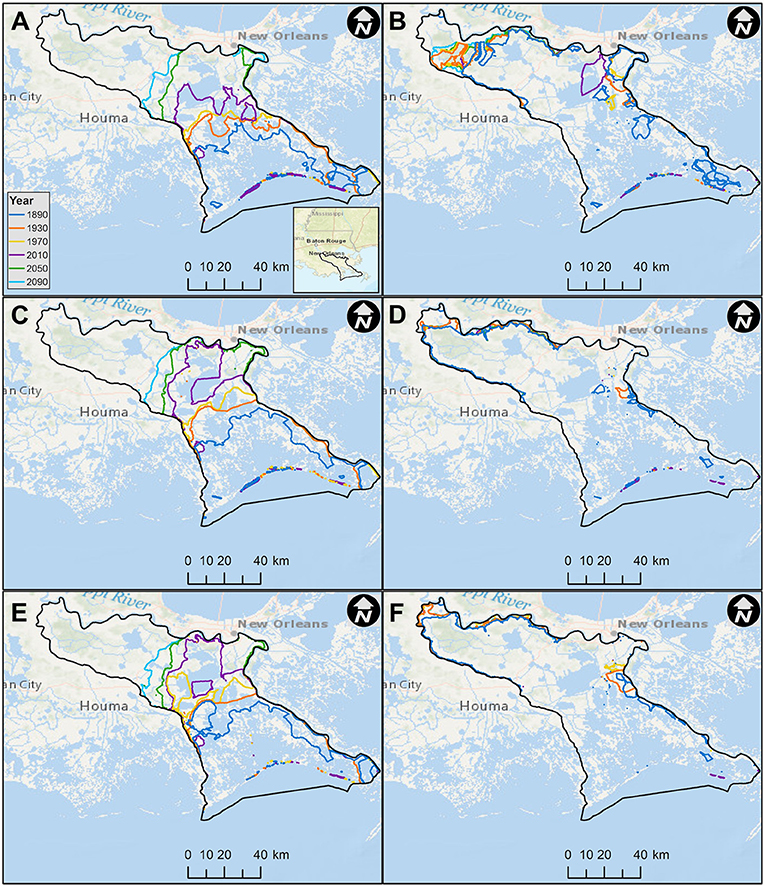
Figure 6. Evolution of the (A,C,E) coastal and (B,D,F) hydrologic flood hazard zone extent for all years using the (A,B) low, (C,D) medium, and (E,F) high flood events at the Barataria watershed. Each color line represents a different era condition. Service Layer Credits: Esri, Garmin, GEBCO, NOAA NGDC, OpenStreetMap, and the GIS User Community.
Lake Maurepas Watershed
For the Lake Maurepas watershed, the hydrologic flood zone dominates the base condition by covering 42% of its total basin area, averaged over all flood magnitudes. In comparison, the coastal and transition flood zones have the same coverage area, on average across all flood magnitudes, with 29% each (Figure 7). A similar distribution occurs for the historical conditions. For the coastal flood zone, the coverage area increases from 6 to 14% greater than the transition flood zone for 2050 and 2090, respectively. This increase in the coverage area implies that the coastal flood zone is the dominant flood zone in 2090, with 39% of its basin area on average across all flood magnitudes, followed by the hydrologic and transition flood zone with 36 and 25% on average across all flood magnitudes, respectively. With increasing flood magnitude for the base condition, the most significant variation in coverage area occurs in the hydrologic flood zone with a decrease of 26%. The hydrologic flood zone is followed by the transition and coastal flood zone with an increase in their coverage area of 18 and 8% of the basin area, respectively. This behavior at the base condition occurs for the historical and future conditions as the flood magnitude increases. The coverage area increases in time for all flood magnitudes of the coastal flood zone, with its minimum in 1890 and maximum in 2090 (Figure 7). The coverage area for the hydrologic flood zone decreases in time for all flood magnitudes, with its minimum in 2090 and maximum in 1890. A clear trend could not be established for the transition flood zone since its coverage area fluctuates within 3% throughout historical conditions for all flood magnitudes. For future conditions, there is a sharp decrease (i.e., up to 7%) in the coverage area of the transition flood zone, especially for the medium flood event.
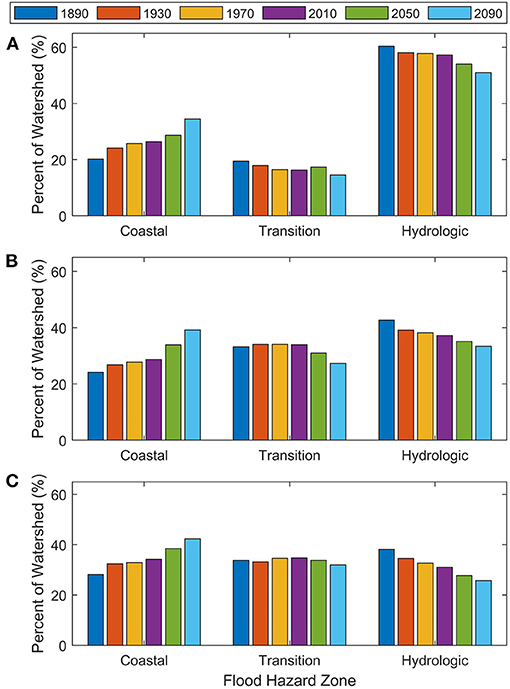
Figure 7. Percent of the watershed made up of each flood hazard zone for the Lake Maurepas watershed under different flood magnitudes: (A) low, (B) medium, and (C) high flood events. Each bar color represents a different era condition.
Similarly, the evolution of the coastal and hydrologic flood zone extents is evaluated under different flood magnitudes for the Lake Maurepas watershed (Figure 8). The hydrologic flood zone extent does not vary significantly through time, especially for low flood events. Areas close to the Mississippi River levee system have a greater difference in the hydrologic flood zone extent during severe flood events (e.g., medium and high flood events) (Figures 8D,F). These regions are mainly dominated by cultivated and developed land. However, these differences are minor (e.g., <2% of the total basin area) compared to the total coverage area of the hydrologic flood zone. Conversely, the coastal flood extent's temporal evolution shows a more significant difference between them under each flood magnitude analyzed, especially at the watershed's central region, which is currently dominated by palustrine forested wetland (Figures 8A,C,E).

Figure 8. Evolution of the (A,C,E) coastal and (B,D,F) hydrologic flood hazard zone extent for all years using the (A,B) low, (C,D) medium, and (E,F) high flood events at the Lake Maurepas watershed. Each color line represents a different era condition. Service Layer Credits: Esri, Garmin, GEBCO, NOAA NGDC, OpenStreetMap, and the GIS User Community.
Encroachment of the Coastal Flood Hazard
The coastal flood hazard zone's encroachment is estimated to quantify the evolution of this flood hazard zone extent under all flood magnitudes at both watersheds (Figure 9). The coastal flood zone's encroachment was computed as the nearest mean distance between two coastal flood zone's extent, which is associated directly with its value. For example, if the encroachment between two successive conditions (e.g., the 1890 and 1930 eras) of coastal flood zones has a positive value, then the coastal flood zone of 1930 is moving toward the sea (i.e., retreating seaward) compared to 1890. Conversely, if the encroachment is negative, then the coastal flood zone of 1930 is moving inland (i.e., migrating landward) compared to 1890. Two different encroachment estimates were computed for each coastal flood zone of both watersheds. First, the encroachment between two coastal flood zone of successive conditions (e.g., the 1890 and 1930 eras) is computed for each 40-yr period (Figures 9A,B), to quantify a rate-of-change in the migration. Second, the encroachment between the coastal flood zone of a given era and the 2010 coastal flood zone was quantified to compare historical and future conditions with the base (i.e., the 2010 era) conditions (Figures 9C,D), to quantify a relative change in the migration.

Figure 9. Coastal flood zone encroachment between (A,B) successive eras, and between (C,D) a given era and the 2010 base condition at the (A,C) Barataria and (B,D) Lake Maurepas watershed for different flood magnitudes. The blue, red, and green lines represent low, medium, and high flood events, respectively. Positive values represent that the coastal flood zone for a given era has moved toward the ocean compared (A,B) to the previous era or (C,D) to the 2010 base conditions. Negative values represent that the coastal flood zone for a given era has moved inland compared (A,B) to the previous era or (C,D) to the 2010 base conditions.
For future conditions at the Barataria watershed, the coastal flood extent moves almost twice further inland from the base condition under low flood events than for more severe floods, especially within the 2010–2050 period (Figures 9A,C). An increasing trend of encroachment between successive eras occurs from 1930 through 2050 (e.g., 1890–1930, 1930–1970, 1970–2010, and 2010–2050) for low flood events. However, for future long-term projections (e.g., 2050–2090 period), the encroachment of the coastal flood zone barely (e.g., 0.03 km yr−1) increased for medium-to-high flood events, while a substantial (e.g., 0.12 km yr−1) decrease was found for low flood events (Figure 9A). However, the encroachment at this period (e.g., 2050–2090 period) is relatively (e.g., within 600 m) equal for all flood magnitudes. This behavior represents that the 2010–2050 period will experience the most dramatic change in coastal flood zone encroachment. There is a significant difference (e.g., more than 10 km) in the coastal flood zone's encroachment concerning the base conditions between high and medium-to-low flood events for historical conditions. This behavior suggests that the coastal flood zone extent for the base condition moved further inland under high flood events than medium-to-low flood events, not necessarily that the coastal flood zones of the historical conditions move farther toward the sea. This is supported by the coastal flood zone's encroachment between successive eras, which is always negative, meaning that the coastal flood zone moves inland over time compared to the previous conditions for all flood magnitude.
For both the historical and future conditions at the Lake Maurepas watershed, the encroachment of the coastal flood extent, concerning the base condition, is similar (e.g., within 2 km) for all flood magnitudes (Figure 9D), which means that the flood magnitude did not influence significantly on the coastal flood extent compared to the base condition. The encroachment between successive eras of the coastal flood zone has a decreasing trend for historical conditions under all flood magnitudes, with medium flood events being relatively constant (e.g., differences <10 m) between 1930 and 2010 (Figure 9B). Conversely, encroachment between successive eras of the coastal flood zone has an increasing trend for future conditions (e.g., 2010 through 2050) under all flood magnitudes, with low flood events extending its increasing trend linearly into 2090.
Temporal Change
The rate of change and relative change is computed to assess each flood hazard zone's area change over time. The rate of change (units of km2 yr−1) for a given flood hazard zone is calculated as the spatial difference for two successive eras (e.g., 1890 and 1930) across the 40 years (Figure 10). The relative change (units of km2 yr−1) is the difference in areal coverage between a given era and the 2010 era (i.e., base condition) divided by the length of the period (Figure 11). If the rate of change between two successive eras (e.g., the eras 1890 and 1930) is a positive value, then the 1930 coverage area has increased (i.e., gain) compared to 1890. Conversely, if the rate of change in the coverage area between two successive eras (e.g., the eras 1890 and 1930) has a negative value, then the 1930 coverage area has decreased (i.e., loss) when compared to 1890.
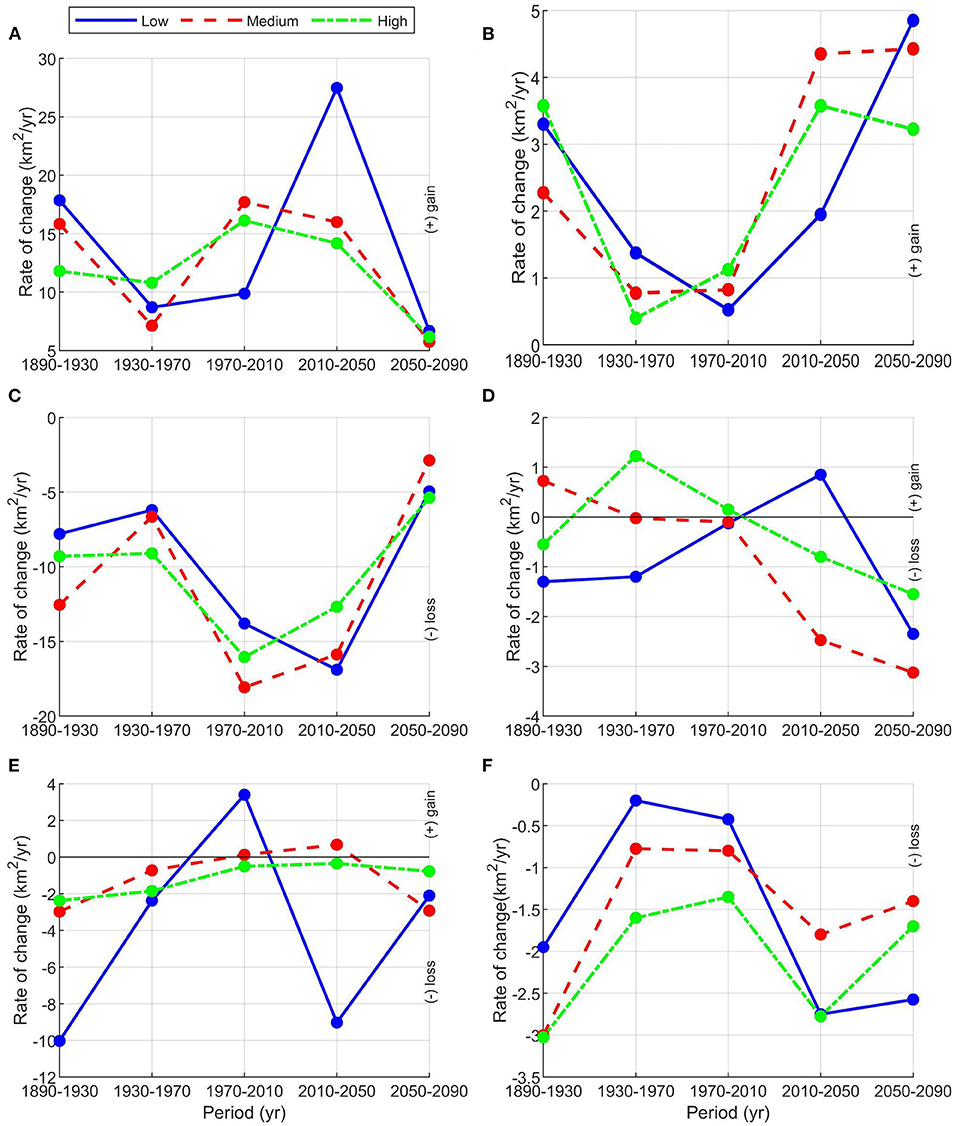
Figure 10. Rate of change in coverage area between successive eras of the (A,B) coastal, (C,D) transition, and (E,F) hydrologic flood zone at the (A,C,E) Barataria and (B,D,F) Lake Maurepas watershed for different flood magnitudes. The blue, red, and green lines represent low, medium, and high flood events, respectively. Positive values represent that the coverage area of a flood hazard zone for a given era has increased compared to the previous era within the period. Negative values represent that the coverage area of a flood hazard zone for a given era has decreased compared to the previous era within the period.

Figure 11. Relative change in coverage area between the historical and future conditions to the 2010 base condition of the (A,B) coastal, (C,D) transition, and (E,F) hydrologic flood zone at the (A,C,E) Barataria and (B,D,F) Lake Maurepas watershed for different flood magnitudes. The blue, red, and green lines represent the low, medium, and high flood events, respectively. Positive values represent that the coverage area of a flood hazard zone for a given era has increased compared to the 2010 base conditions. Negative values represent that the coverage area of a flood hazard zone for a given era has decreased compared to the 2010 base conditions.
Barataria Watershed
For the coastal flood zone in Barataria watershed, the most significant rate of change and relative changes occurred from 2010 to 2050, with an increase of 27 km2 yr−1 for low flood events (Figures 10A, 11A). The rate of change for low flood events increases from 1930 through 2050 for the coastal flood zone and then reduces from 2050 to 2090. For medium-to-high flood events, the change rate has a decreasing trend from 2010 to 2090. The rate of change and relative change for medium-to-high flood events are similar over time. This similarity indicates that the change in coastal flood zone's coverage area does not substantially vary (i.e., 3 km2 yr−1) for higher magnitude flood events. For historical conditions, the coastal flood zone's relative change for medium-to-high flood events is more significant than for low flood events. However, both the rates of change and relative changes for low flood events are greater than for medium-to-high flood events for future conditions. This behavior represents that the eustatic SLR and the alteration to the coastal landscape will significantly affect the coastal flood zone by increasing its coverage area during low flood events for future projections.
For the transition flood zone in Barataria, the most significant rates of change and relative changes occurred from 1970 to 2010, with a change in the coverage area of 18 km2 yr−1 for medium flood events (Figures 10C, 11C). The relative change for the transition flood zone is similar for all flood magnitudes, with a rate of increase for the historical conditions and a rate of decrease for future conditions. The rate of change for medium-to-high flood events has decreased from 1970 to 2090, while low flood events have increased from 1930 to 2050. Like the coastal flood zone, the eustatic SLR and the alteration to the coastal landscape will significantly influence the transition flood zone during low flood events for future projections. As the coastal flood zone increases its coverage area moving inland, the transition flood zone must compensate with a decrease in its coverage area because it cannot extend further inland and gain area from the hydrologic flood zone.
For the hydrologic flood zone in Barataria (Figures 10E, 11E), the most significant rates of change and relative changes occurred for low flood events only, while for medium-to-high flood events, the changes remain relatively stable (e.g., within 2 km2 yr−1). The rate of change for low flood events has a steeper slope (e.g., an order of magnitude greater) than for medium-to-high flood events over time. This behavior implies that the rainfall-runoff can have a more significant contribution when considering lower magnitude flood events.
Lake Maurepas Watershed
For the coastal flood zone in Lake Maurepas, the most significant rates of change and relative changes rate occurred from 2010 to 2050, with an increase of 4.4 km2yr−1 for medium flood events (Figures 10B, 11B). For future conditions, the change in coastal flood zone's coverage area does not substantially vary (e.g., <1 km2yr−1) for medium-to-high flood events from 2010 to 2090. The rate of change for low flood events increases from 1970 to 2090 for the coastal flood zone. This behavior represents that the combination of increasing eustatic SLR and alterations to the coastal landscape will significantly affect the coastal flood zone by increasing its coverage area for near-future projections (e.g., up to the year 2050) during high flood events. However, a more significant influence can be identified farther into the future (e.g., beyond year 2050) during low flood events.
For the transition flood zone in Lake Maurepas, the most significant change and relative change rate occurred from 2010 to 2050 with a decrease of 2.8 km2yr−1 for medium flood events (Figures 10D, 11D). There is no clear distinction on which flood magnitude influences the greatest coverage area for this flood hazard zone when combined with the increase in eustatic SR and the modifications to the coastal landscape. However, the rate of change for the historical conditions is relatively low (e.g., <1 km2 yr−1) for all flood magnitudes. Between 2010 and 2050, the change in coverage area can vary widely, going from an increase of 0.9 km2 yr−1 to a decrease of 2.5 km2 yr−1 for low and medium flood events, respectively. There is virtually no change (e.g., <0.1 km2 yr−1) in the transition flood zone between 1970 and 2010, regardless of the flood magnitude, meaning that the transition flood zone is in equilibrium over this period.
For the hydrologic flood zone in Lake Maurepas, the most significant relative change occurred from 2010 to 2050 with a decrease of 2.8 km2 yr−1 for the low and high flood events (Figure 11F), while for the rate of change occurs from 1890 to 1930 for medium-to-high flood events (Figure 10F). The relative change decreases at both future and historical conditions for all flood magnitudes. However, the coverage area of this flood hazard zone at historical conditions increases, while for the future conditions the coverage area decreases compared to the base conditions for all flood events. Also, the rate of change decreases for historical conditions under all flood magnitudes, while for future conditions, the loss of coverage area increases. This behavior represents that the hydrologic flood zone will decrease its coverage area into the future for any flood magnitude. Therefore, this watershed might change its dominant flooding mechanisms into the future, from mostly hydrologic into coastal or even both.
Influence of Eustatic Sea-Level Rise
An additional set of simulations is performed to isolate and assess the influence eustatic SLR has on the compound flood hazard zones. These simulations evaluated low and high flood events over both watersheds for the base (i.e., the 2010 era) condition with only one modification: the Gulf of Mexico's initial water level. This initial water level represents the hydrodynamic model's initial conditions to recreate the steady-state (i.e., normal or calm) conditions at the Gulf of Mexico. The eustatic SLR mainly dominates the water levels of the Gulf of Mexico. Therefore, this water level was modified from the base condition of 23 cm to the 1890 condition of 3 cm (Figure 2). The compound flood hazard zones are delineated for the modified (i.e., the 2010 era with 3 cm of eustatic SLR) and original (i.e., the 2010 era with 23 cm of eustatic SLR) base conditions using low and high flood events at both watersheds (Figures 12, 13).
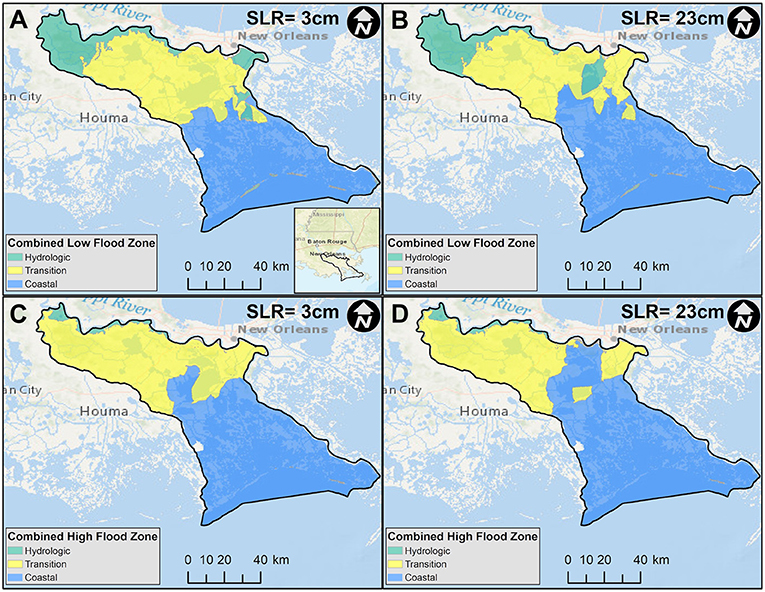
Figure 12. Compound flood hazard zones delineation for the Barataria watershed using (A,B) low and (C,D) high flood events for the 2010 condition with different water levels at the Gulf of Mexico: (A,C) 3 cm and (B,D) 23 cm.
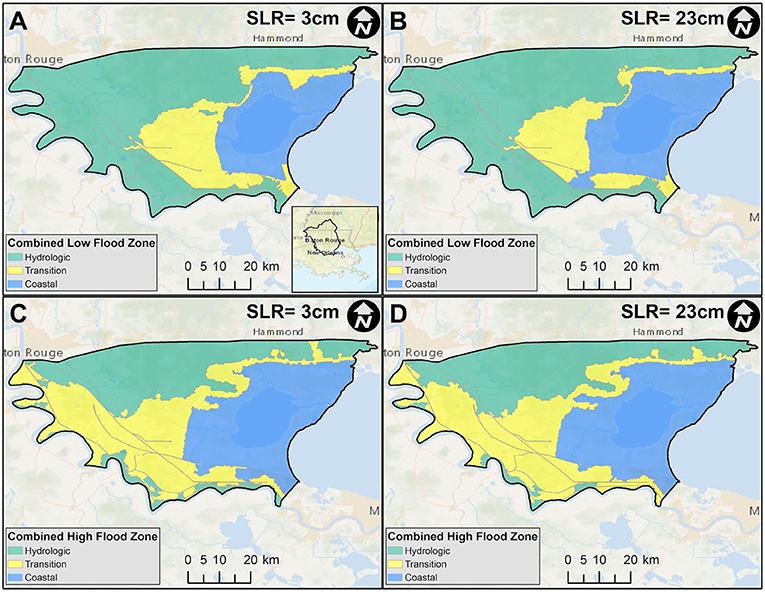
Figure 13. Compound flood hazard zones delineation for the Lake Maurepas watershed using (A,B) low and (C,D) high flood events for the 2010 condition with different water levels at the Gulf of Mexico: (A,C) 3 cm and (B,D) 23 cm.
The most notable changes when modifying the Gulf of Mexico water levels in the Barataria watershed are on its east boundary for low flood events, where regions that are hydrologically dominated change to transition flood zone, and regions that are defined as transition change to coastal flood zone (Figures 12A,B). Similarly, changes from transition to coastal flood zone are observed within the Barataria watershed's central region for high flood events (Figures 12C,D). For the Lake Maurepas watershed, the transition flood zone overtakes the hydrologic flood zone within the central region of the watershed with a westward direction, while the portion of the transition flood zone is changed to a coastal flood zone in a southwesterly direction for low flood events (Figures 13A,B). This same behavior repeats for high flood events but to a more significant extent, modifying regions close to the Mississippi River levee system (Figures 13C,D).
In the Barataria watershed, the modified condition's coastal, transition, and hydrologic flood zone decreases 5% and increases 4 and 1% its coverage area, respectively, compared to the original condition for low flood events. Similarly, the modified condition's coastal and transition flood zone decreases and increases 6% its coverage area, respectively, compared to the original condition for high flow events, while the hydrologic flood zone remained unchanged. The difference in coastal flood zone coverage area between the modified and original base conditions is four times less than the difference between 1890 and the original base conditions for both flood events. The coastal flood zone from the modified base conditions encroaches 4.5 and 9 km seaward compared to the original base conditions of the low and high flood events, respectively. However, the coastal flood zone extent from 1890 moves more than three times the distance seaward than the modified base conditions, concerning the original base conditions, for both flood events (Figure 9C). This behavior represents that the eustatic SLR can influence (e.g., up to 6% of its coverage area) the compound flood hazard zones at the Barataria watershed, while other factors such as changes to the coastal landscape can have a more significant (e.g., up to four times more than the eustatic SLR) impact in the compound flood hazard zones.
For the Lake Maurepas watershed, the modified condition's coastal, transition, and hydrologic flood zone decreases 4% and increases 3 and 1% its coverage area, respectively, compared to the original condition for low flood events. Similarly, the modified condition's coastal and transition flood zone decreases and increases 1% its coverage area, respectively, compared to the original condition for high flood events, while the hydrologic flood zone remained unchanged. The difference in the coastal flood zone's coverage area between the modified and original base conditions is two times less than the difference between 1890 and the original base condition for low flood events, while for high flood events is five times less. The coastal flood zone from the modified base conditions encroaches 2 and 1 km seaward compared to the original base conditions for low and high flood events, respectively. However, the coastal flood zone extent from 1890 moves more than three times the distance seaward than the modified base conditions, concerning the original base conditions, for low flood events, while for high flood events are six times less (Figure 9D). This behavior represents that variations in the eustatic SLR have a minimal (e.g., <1% of the total watershed area) impact in the compound flood hazard zones for higher magnitudes flood events at the Lake Maurepas watershed.
Discussion
The results suggest that the Barataria watershed is dominated by coastal flood mechanisms from 1970 to 2090. While from 1890 to 1930, it is found that both flooding mechanisms (i.e., coastal and hydrological) substantially impacted the compound flood hazard zones. Conversely, the results suggest that the Lake Maurepas watershed is dominated by hydrological flood mechanisms from 1890 to 2050. While for 2090, it is found that coastal flood processes are the primary flood mechanism within the compound flood hazard zones at this watershed. Overall, the coastally dominated flood zone coverage area increases in time for all flood magnitudes (e.g., low, medium, and high) at both watersheds. This behavior is explained primarily by the coastal landscape alterations, which enhance the coastal flood processes (i.e., storm surge and eustatic SLR) impact further inland. For watersheds with compound flood hazard zones dominated by coastal flooding mechanisms, such as the Barataria watershed, a decreasing trend is found for the transition flood zone's coverage area. Additionally, a decreasing trend is determined for the hydrologic flood zone's coverage area at the Lake Maurepas watershed, where hydrologic flooding mechanisms dominate the compound flood hazard zones.
In general, lower magnitude flood events will impact more the flood hazard zones than higher magnitude flood events in future projections in coastally dominated watersheds (e.g., Barataria watershed). Moreover, within an ecological context, Bevington et al. (2017) found that annual flood events (i.e., cold fronts) can eliminate the bed elevation gain in low-gradient deltaic plains, such as the Wax Lake Delta, which is a sediment-abundant coastal watershed in southern Louisiana. The largest rate of increase in the coverage area of the coastal flood zone is between 2010 and 2050, meaning that this near-future period may represent an inflection point in the composition of compound flood hazard zones, where the coastal flood zone will dominate even in watersheds currently controlled by hydrologic flood mechanisms (e.g., Lake Maurepas watershed). The largest rate of change in any flood hazard zone's coverage area occurred at the coastally dominated watershed, regardless of flood magnitude. This means that coastal flood mechanisms largely influence the coverage area's evolution, driven primarily by climate change-induced eustatic SLR. Therefore, low flood events may dominate the coastal flood zone in the near-term future projection, representing an urgent issue that requires action from the local authorities, stakeholders, and policy-makers to counter climate change impacts on compound flood hazard zones. Further implication entails the non-stationarity of climatic processes, including those coastal and hydrologic in origin, and the subsequent adjustment in magnitudes across the probabilistic spectrum, e.g., where present-day higher magnitude flood events occur with greater frequency in the future.
Summarily, the coastal flood zone extent moves inland as time increases under all flood magnitudes at both watersheds. For historical conditions, the coastal flood extent moves at least three times closer to the sea at the Barataria watershed relative to that of the Lake Maurepas watershed, compared to the 2010 base conditions, regardless of the flood magnitude. This observation suggests that the coastal flood extent at the 2010 base condition at the Barataria watershed is far more critical than the conditions at the Lake Maurepas watershed. This behavior can be attributed to the wetland collapse (i.e., land converting into open water) at the Barataria watershed after being hydraulically disconnected from the MRDP in the 1930's decade. As a result of non-stationarity of climate and coastal land-margin conditions the behavior of the changing compound flood hazard zones is non-linear with increasing levels of non-linearity that are subject to the future scenarios imposed.
The increasing rate of eustatic SLR observed during the 20th century, ranging from 1 to 2 mm yr−1 (Church et al., 2013), and the deprivation of sediments and nutrients into this watershed has accelerated the drowning of the wetland system to its deteriorated conditions in 2010. Furthermore, the future projections of eustatic SLR, suggest a more significant rate of increase (i.e., 7 mm yr−1) (Oppenheimer et al., 2019) in the near future, whereby the near-term future projection (i.e., 2010–2050 period) represents an inflection point in the coastally dominated flood hazard zones. Also, the behavior presented by the results of the impact of the eustatic SLR on the compound flood hazard zones suggests that the modification of the coastal land-margin due to climate change and anthropogenic alterations had a more significant impact on the compound flood hazard zones than the eustatic component of SLR alone at both watersheds, especially at the coastal flood zone.
Conclusion
This research assesses compound flood hazard zones' evolution through different historical eras and future projections for two distinct coastal watersheds in southeastern Louisiana. As representative of historical and future conditions, the Louisiana coastal landscapes developed by Siverd et al. (2019b) were used within the modeling framework developed by Bilskie et al. (2021). This modeling framework estimates the total water levels due to an antecedent rainfall event and a tropical cyclone event, including the tropical cyclone's rainfall. A total of 23 synthetic tropical cyclones were employed to provide model forcing to each compound flood simulation. Three different flood hazard zones were delineated based on the relative dominance of the flooding mechanisms: hydrologic, transition, and coastal.
Following the research of Siverd et al. (2019b) combined with Bilskie et al. (2021), this research further demonstrates the importance of recognizing compound flood processes in assessing flood hazards on low-gradient coastal land-margins, especially under historical and future conditions. The present (i.e., the year 2010) dominant flood hazard zone for the Barataria watershed is the coastal flood zone, while the Lake Maurepas watershed is the hydrologic flood zone. The difference in the present dominant flood hazard zone between both watersheds can be attributed to the watershed locations, whereby different watersheds will have different responses of compound flood hazard zones. For example, the coastal flooding effects from the Gulf of Mexico directly affect the Barataria watershed, while these effects are attenuated by a system of lakes (e.g., Lake Ponchartrain and Lake Borgne) that separates Lake Maurepas watershed from the Gulf of Mexico.
The near-future (e.g., the year 2050) projections of the compound flood hazard zones suggest that the coastal flood zone will suffer the most significant changes in coverage area due to a combination of increasing eustatic SLR and alterations to the coastal land-margin during low flood events. These coastal flood zone changes imply that hydrologically-dominated watersheds may change their dominant flood hazard zone to transition or even to coastal flood zone in future long-term projections (i.e., the year 2090). The future landward migration of coastal flood zones can deteriorate many inland ecological systems by increasing the residence time and spatial extent of the high-salinity floodwaters. Eustatic SLR alone is critical in assessing compound flood hazard zones; however, when subsidence and eustatic SLR are combined under relative SLR and the loss of coastal lands is included the changes to compound flood hazard zones are starkly evident. This follows the lessons learned from previous assessments of the coastal dynamics of SLR on low-gradient coastal land-margins (Bilskie et al., 2014, 2016, 2019; Passeri et al., 2015b), particularly the recognition of the complexity of the variations in the highly non-linear responses due to non-stationarity in climate and the coupled natural and human response.
Some of the study's limitations are based on the compound modeling framework and the coastal landscapes developed for historical and future conditions. First, the future GMSL rise scenario selected was a conservative scenario (i.e., Intermediate-Low scenario with a rise of 50 cm by 2100), whereas researchers have concluded that a more aggressive GMSL can be expected in the future due to the conservative projections of the RCP4.5 (i.e., Representative Concentration Pathway) climate change scenarios (Sweet et al., 2007; Kopp et al., 2014; Bates et al., 2021). Second, the Louisiana coastal landscapes are modified through time for locations south of the Intracoastal Waterway, which goes from Sabine Lake in Texas through the Pearl River outlet in Mississippi, crossing through Morgan City, Houma, Lafitte, and the mid-region of the Barataria watershed. Therefore, regions such as the Lake Maurepas watershed do not differ in the coastal land-margin over time. Extending Siverd et al. (2018) analysis to further inland locations, like Lake Maurepas watershed, might alter compound flood hazard zone's delineation, especially for future projection. Third, some hydrologic processes, such as infiltration, evapotranspiration, and initial abstraction, were neglected when accounting for rainfall-runoff within the compound modeling framework. These neglected hydrologic features will affect the volume of rainfall-runoff that contributes to the compound flood levels. For example, the Green and Ampt method can be incorporated into the hydrologic computations to estimate spatially-varied infiltration rates based on soil properties (Torres et al., 2015; Bass and Bedient, 2018).
As a fourth limitation of the approach, the current wetting and drying algorithm employed within the compound modeling work is not well-suited for rainfall-runoff routing (Medeiros and Hagen, 2012; Bilskie et al., 2021). Overland rainfall-runoff is characterized by small (e.g., within 10−3-10−6 m) water depths compared to riverine water depths (e.g., within 101-10−2 m). These small water depths are especially challenging when solving any discretization of the governing shallow water equations. Future work with compound flood modeling should explore alternative methods for the wetting and drying of elements in the hydrodynamic simulation. Fifth, the present study is a limited representation of an annual exceedance probability flood event, where each flooding mechanism is determined from observed rainfall data and synthetic tropical cyclones. Therefore, future precipitation and tropical cyclones patterns should be incorporated into the modeling framework to improve the assessment of compound flood hazard zones under climate change. For example, results from Global Circulation Model and synthetic hurricane precipitation predictions can be used to modify historic annual exceedance probability of precipitation events (Bates et al., 2021). Lastly, future built environments, such as barrier island restoration, dikes, levees, wetland restoration, should be considered for future projections of the coastal land-margin since they can attenuate SLR effects and alter the compound flood hazard zones. Regardless of these limitations this study confirms the need to fully assess compound flood hazard zones in low-gradient coastal land-margin regions. Future enhancement of the coupling technique of the compound flood modeling framework toward a tightly- or fully-coupled approach (Santiago-Collazo et al., 2019) for a more holistic forecast inundation model is warranted to better estimate compound flood hazards zones in any low-gradient coastal region. This study and future advancements will aid policy-makers, stakeholders, and authorities as they pursue enhanced coastal resilience to compound flooding.
Data Availability Statement
The original contributions generated for the study are included in the article/Supplementary Material, further inquiries can be directed to the corresponding author.
Author Contributions
FS-C performed ADCIRC simulations, analyzed results including the flood zone delineation and post-processing results, and led this article's writing. MB provided guidance on the ADCIRC simulations, develop the ADCIRC runs production system and the flood zone delineation algorithm, and assisted in analyzing results. PB assisted in analyzing results and aided in writing/reviewing this article. SH is the PI and conceived the original research ideas, provided guidance during the development of the research, and aided in writing/reviewing this article. All authors contributed to the article and approved the submitted version.
Funding
This material is based upon work supported in part by the National Science Foundation Graduate Research Fellowship Program [Grant No. 1452778], the Department of the Treasury through the Louisiana Coastal Protection and Restoration Authority's Center of Excellence Research Grants Program under the Resources and Ecosystems Sustainability, Tourist Opportunities, and Revived Economies of the Gulf Coast States Act of 2012 (RESTORE Act) (Award No. CPRA-2015-COE-MB), the Gulf Research Program (GRP) of the National Academies of Sciences, Engineering, and Medicine [Award No. 200000829], the Robert Wood Johnson Foundation (RWJF) [Award No. 200000829], and the Louisiana Sea Grant Laborde Chair.
Disclaimer
Any opinions, findings, and conclusions or recommendations expressed in this material are those of the author(s) and do not necessarily reflect the views of the NSF, the Department of Treasury, GRP, RWJF, LSU, LONI, or the Louisiana Sea Grant College Program.
Conflict of Interest
The authors declare that the research was conducted in the absence of any commercial or financial relationships that could be construed as a potential conflict of interest.
Acknowledgments
This work also used High-Performance Computing at Louisiana State University (LSU) and the Louisiana Optical Network Initiative (LONI).
Supplementary Material
The Supplementary Material for this article can be found online at: https://www.frontiersin.org/articles/10.3389/fclim.2021.684035/full#supplementary-material
Supplementary Figure 1. Compound flood hazard zone delineation for the Barataria watershed using medium flood events for (A) 1890, (B) 1930, (C) 1970, (D) 2010, (E) 2050, and (F) 2090. Service Layer Credits: Esri, Garmin, GEBCO, NOAA NGDC, OpenStreetMap, and the GIS User Community.
Supplementary Figure 2. Compound flood hazard zone delineation for the Barataria watershed using high flood events for (A) 1890, (B) 1930, (C) 1970, (D) 2010, (E) 2050, and (F) 2090. Service Layer Credits: Esri, Garmin, GEBCO, NOAA NGDC, OpenStreetMap, and the GIS User Community.
Supplementary Figure 3. Compound flood hazard zone delineation for the Lake Maurepas watershed using medium flood events for (A) 1890, (B) 1930, (C) 1970, (D) 2010, (E) 2050, and (F) 2090. Service Layer Credits: Esri, Garmin, GEBCO, NOAA NGDC, OpenStreetMap, and the GIS User Community.
Supplementary Figure 4. Compound flood hazard zone delineation for the Lake Maurepas watershed using high flood events for (A) 1890, (B) 1930, (C) 1970, (D) 2010, (E) 2050, and (F) 2090. Service Layer Credits: Esri, Garmin, GEBCO, NOAA NGDC, OpenStreetMap, and the GIS User Community.
References
Barras, J. A., Bourgeois, P. E., and Handley, L. R. (1994). Land Loss in Coastal Louisiana 1956–90. National Biological Survey, National Wetlands Research Center Open File Report 94–01.
Bass, B., and Bedient, P. (2018). Surrogate modeling of joint flood risk across coastal watersheds. J. Hydrol. 558, 159–173. doi: 10.1016/j.jhydrol.2018.01.014
Bates, P. D., Quinn, N., Sampson, C., Smith, A., Wing, O., Sosa, J., et al. (2021). Combined modeling of US fluvial, pluvial, and coastal flood hazard under current and future climates. Water Resour. Res. 57, 1–29. doi: 10.1029/2020WR028673
Batker, D., Torre, I., De Costanza, R., Swedeen, P., Day, J., Boumans, R., et al. (2010). Gaining Ground : Wetlands, Hurricanes, and the Economy: The Value of Restoring the Mississippi River Delta, Earth Economics. Earth Economics Project Report. Environmental Law Institute, Washington, DC, United States. doi: 10.3411/col.08230102
Bevington, A. E., Twilley, R. R., Sasser, C. E., and Holm, G. O. (2017). Contribution of river floods, hurricanes, and cold fronts to elevation change in a deltaic floodplain, northern Gulf of Mexico, USA. Estuar. Coast. Shelf Sci. 191, 188–200. doi: 10.1016/j.ecss.2017.04.010
Bilskie, M. V., and Hagen, S. C. (2018). Defining flood zone transitions in low-gradient coastal regions. Geophys. Res. Lett. 45, 2761–2770. doi: 10.1002/2018GL077524
Bilskie, M. V., Hagen, S. C., Alizad, K., Medeiros, S. C., Passeri, D. L., Needham, H. F., et al. (2016). Dynamic simulation and numerical analysis of hurricane storm surge under sea level rise with geomorphologic changes along the northern Gulf of Mexico. Earth's Future 4, 177–193. doi: 10.1002/2015EF000347
Bilskie, M. V., Hagen, S. C., and Irish, J. L. (2019). Development of return period stillwater floodplains for the Northern Gulf of Mexico under the coastal dynamics of sea level rise. J. Waterw. Port Coast. Ocean Eng. 145:04019001. doi: 10.1061/(ASCE)WW.1943-5460.0000468
Bilskie, M. V., Hagen, S. C., Medeiros, S. C., and Passeri, D. L. (2014). Dynamics of sea level rise and coastal flooding on a changing landscape. Geophys. Res. Lett. 41, 927–934. doi: 10.1002/2013GL058759
Bilskie, M. V., Zhao, H., Resio, D., Atkinson, J., Cobell, Z., and Hagen, S. (2021). Enhancing flood hazard assessments in Coastal Louisiana through coupled hydrologic and surge processes. Front. Water 3:609231. doi: 10.3389/frwa.2021.609231
Blum, M. D., and Roberts, H. H. (2009). Drowning of the Mississippi Delta due to insufficient sediment supply and global sea-level rise. Nat. Geosci. 2, 488–491. doi: 10.1038/ngeo553
Church, J. A., Clark, P. U., Cazenave, A., Gregory, J. M., Jevrejeva, S., Levermann, A., et al. (2013). “Sea level change,” in Climate Change 2013 the Physical Science Basis: Working Group I Contribution to the Fifth Assessment Report of the Intergovernmental Panel on Climate Change, ed T. Stocker (Cambridge: Cambridge University Press), 1137–1216.
CWPPRA (1995). Barataria Basin [WWW Document]. Available online at: https://lacoast.gov/new/about/basin_data/ba/default.aspx (accessed February 8, 2021).
Day, J. W., Conner, W. H., Delaune, R. D., Hopkinson, C. S., Hunter, R. G., Shaffer, G. P., et al. (2021). A Review of 50 years of study of hydrology, wetland dynamics, aquatic metabolism,water quality and trophic status, and nutrient biogeochemistry in the Barataria Basin, Mississippi Delta—system functioning, human impacts and restoration approaches. Water 13, 1–31. doi: 10.3390/w13050642
Doroszkiewicz, J., Romanowicz, R. J., and Kiczko, A. (2018). The influence of flow projection errors on flood hazard estimates in future climate conditions. Water 11, 1–19. doi: 10.3390/w11010049
FEMA and USACE (2008). Flood Insurance Study: Southeastern Parishes, Louisiana, Intermediate Submission 2: Offshore Water Levels and Waves. FEMA, US Army Corps of Engineers, New Orleans, LA, United States.
Hiatt, M., Snedden, G., Day, J. W., Rohli, R. V., Nyman, J. A., Lane, R., et al. (2019). Drivers and impacts of water level fluctuations in the Mississippi River delta: implications for delta restoration. Estuar. Coast. Shelf Sci. 224, 117–137. doi: 10.1016/j.ecss.2019.04.020
Keddy, P. A., Campbell, D., McFalls, T., Shaffer, G. P., Moreau, R., Dranguet, C., et al. (2007). The wetlands of lakes Pontchartrain and Maurepas: past, present and future. Environ. Rev. 15, 43–77. doi: 10.1139/a06-008
Kopp, R. E., Horton, R. M., Little, C. M., Mitrovica, J. X., Oppenheimer, M., Rasmussen, D. J., et al. (2014). Probabilistic 21st and 22nd century sea-level projections at a global network of tide-gauge sites. Earth's Future 2, 383–406. doi: 10.1002/2014EF000239
Lonfat, M., Marks, F. D. J., and Chen, S. S. (2004). Precipitation distribution in tropical cyclones using the tropical rainfall measuring mission (TRMM) microwave imager: a global perspective. Mon. Weather Rev. 132, 1645–1660. doi: 10.1175/1520-0493(2004)132<1645:PDITCU>2.0.CO;2
Luettich, R. A., Westerink, J. J., and Scheffner, N. W. (1992). ADCIRC: An Advanced Three-Dimensional Circulation Model for Shelves, Coasts, and Estuaries. Report 1. Theory and Methodology of ADCIRC-2DDI and ADCIRC-3DL. Vicksburg, MS, United States.
Machado, M. J., Botero, B. A., López, J., Francés, F., Díez-Herrero, A., and Benito, G. (2015). Flood frequency analysis of historical flood data under stationary and non-stationary modelling. Hydrol. Earth Syst. Sci. 19, 2561–2576. doi: 10.5194/hess-19-2561-2015
Medeiros, S. C., and Hagen, S. C. (2012). Review of wetting and drying algorithms for numerical tidal flow models. Int. J. Numer. Methods Fluids 71, 473–487. doi: 10.1002/fld.3668
Nienhuis, J. H., Törnqvist, T. E., Jankowski, K. L., Fernandes, A. M., and Keogh, M. E. (2017). A new subsidence map for Coastal Louisiana. GSA Today, 27. doi: 10.1130/GSATG337GW.1
NOAA (2016). NOAA Coastal Change Analysis Program (C-CAP) Regional Land Cover Database [WWW Document]. Available online at: coast.noaa.gov/landcover (accessed March 6, 2021).
Oppenheimer, M., Glavovic, B. C., Hinkel, J., van de Wal, R., Magnan, A. K., Abd-Elgawad, A., et al. (2019). “Sea level rise and implications for low-lying islands, coasts and communities,” in IPCC Special Report on the Ocean and Cryosphere in a Changing Climate (Cambridge: Cambridge University Press), 321–445.
Passeri, D. L., Bilskie, M. V., Plant, N. G., Long, J. W., and Hagen, S. C. (2018). Dynamic modeling of barrier island response to hurricane storm surge under future sea level rise. Clim. Change 149, 413–425. doi: 10.1007/s10584-018-2245-8
Passeri, D. L., Hagen, S. C., Bilskie, M. V., and Medeiros, S. C. (2015a). On the significance of incorporating shoreline changes for evaluating coastal hydrodynamics under sea level rise scenarios. Nat. Hazards 75, 1599–1617. doi: 10.1007/s11069-014-1386-y
Passeri, D. L., Hagen, S. C., Medeiros, S. C., Bilskie, M. V., Alizad, K., and Wang, D. (2015b). The dynamic effects of sea level rise on low-gradient coastal landscapes : a review. Earth's Future 3, 159–181. doi: 10.1002/2015EF000298
Perera, E. D. P., Sayama, T., Magome, J., Hasegawa, A., and Iwami, Y. (2017). RCP8.5-Based future flood hazard analysis for the lower mekong river basin. Hydrology 4:55. doi: 10.3390/hydrology4040055
Rojas, R., Feyen, L., Bianchi, A., and Dosio, A. (2012). Assessment of future flood hazard in Europe using a large ensemble of bias-corrected regional climate simulations. J. Geophys. Res. Atmos. 117:D17109. doi: 10.1029/2012JD017461
Sajjad, M., Lin, N., and Chan, J. C. L. (2020). Spatial heterogeneities of current and future hurricane flood risk along the U.S. Atlantic Gulf Coasts Sci. Total Environ. 713:136704. doi: 10.1016/j.scitotenv.2020.136704
Santiago-Collazo, F. L., Bilskie, M. V., and Hagen, S. C. (2019). A comprehensive review of compound inundation models in low-gradient coastal watersheds. Environ. Model. Softw. 119, 166–181. doi: 10.1016/j.envsoft.2019.06.002
Shrestha, S., and Lohpaisankrit, W. (2017). Flood hazard assessment under climate change scenarios in the Yang River Basin, Thailand. Int. J. Sustain. Built Environ. 6, 285–298. doi: 10.1016/j.ijsbe.2016.09.006
Siverd, C. G., Hagen, S. C., Bilskie, M. V., Braud, D. W. H., Gao, S., Peele, R. H., et al. (2019a). Assessment of the temporal evolution of storm surge across coastal Louisiana. Coast. Eng. 150, 59–78. doi: 10.1016/j.coastaleng.2019.04.010
Siverd, C. G., Hagen, S. C., Bilskie, M. V., Braud, D. W. H., Peele, R. H., Foster-Martinez, M. R., et al. (2019b). Coastal Louisiana landscape and storm surge evolution: 1850–2110. Clim. Change 157, 445–468. doi: 10.1007/s10584-019-02575-7
Siverd, C. G., Hagen, S. C., Bilskie, M. V., Braud, D. W. H., Peele, R. H., and Twilley, R. R. (2018). Hydrodynamic storm surge model simplification via application of land to water isopleths in coastal Louisiana. Coast. Eng. 137, 28–42. doi: 10.1016/j.coastaleng.2018.03.006
Siverd, C. G., Hagen, S. C., Bilskie, M. V., Braud, D. W. H., and Twilley, R. R. (2020). Quantifying storm surge and risk reduction costs: a case study for Lafitte, Louisiana. Clim. Change 161, 201–223. doi: 10.1007/s10584-019-02636-x
Sweet, W., Kopp, R., Weaver, C., Obeyesekera, J., Horton, R., Thieler, E., et al. (2007). Global and regional sea level rise scenarios for the United States. Silver Spring, MD.
Syvitski, J. P. M., Kettner, A. J., Overeem, I., Hutton, E. W. H., Hannon, M. T., Brakenridge, G. R., et al. (2009). Sinking deltas due to human activities. Nat. Geosci. 2, 681–686. doi: 10.1038/ngeo629
Torres, J. M., Bass, B., Irza, N., Fang, Z., Proft, J., Dawson, C., et al. (2015). Characterizing the hydraulic interactions of hurricane storm surge and rainfall-runoff for the Houston-Galveston region. Coast. Eng. 106, 7–19. doi: 10.1016/j.coastaleng,.2015.09.004
US Army Corps of Engineers (2006). Performance Evaluation of the New Orleans and Southeast Louisiana Hurricane Protection System. Interagency Performance Evaluation Task Force.
Vousdoukas, M. I., Mentaschi, L., Voukouvalas, E., Verlaan, M., Jevrejeva, S., Jackson, L. P., et al. (2018). Global probabilistic projections of extreme sea levels show intensification of coastal flood hazard. Nat. Commun. 9, 1–12. doi: 10.1038/s41467-018-04692-w
Keywords: compound flood, flood hazard zone migration, coastal land-margin, rainfall-runoff, tropical cyclone, storm surge, climate change, transition zone
Citation: Santiago-Collazo FL, Bilskie MV, Bacopoulos P and Hagen SC (2021) An Examination of Compound Flood Hazard Zones for Past, Present, and Future Low-Gradient Coastal Land-Margins. Front. Clim. 3:684035. doi: 10.3389/fclim.2021.684035
Received: 22 March 2021; Accepted: 22 June 2021;
Published: 14 July 2021.
Edited by:
Ning Lin, Princeton University, United StatesReviewed by:
Kazuaki Nishii, Mie University, JapanKaiming Hu, Institute of Atmospheric Physics, Chinese Academy of Sciences (CAS), China
Copyright © 2021 Santiago-Collazo, Bilskie, Bacopoulos and Hagen. This is an open-access article distributed under the terms of the Creative Commons Attribution License (CC BY). The use, distribution or reproduction in other forums is permitted, provided the original author(s) and the copyright owner(s) are credited and that the original publication in this journal is cited, in accordance with accepted academic practice. No use, distribution or reproduction is permitted which does not comply with these terms.
*Correspondence: Félix L. Santiago-Collazo, ZnNhbnRpMUBsc3UuZWR1