 Nicole Mendoza1*
 Thomas Mathai2Blake Boren2Jesse Roberts3
 James Niffenegger2
 Volker Sick4
 Arno W. Zimmermann5,6Jochem Weber2Joshua Schaidle7
- 1Wind Energy Systems, National Renewable Energy Laboratory, Arvada, CO, United States
- 2Water Power R&D, National Renewable Energy Laboratory, Golden, CO, United States
- 3Water Power, Sandia National Laboratories, Albuquerque, NM, United States
- 4Global CO2 Initiative, University of Michigan, Ann Arbor, MI, United States
- 5Netzero Partners, Berlin, Germany
- 6Institute of Chemistry, Technische Universität Berlin, Berlin, Germany
- 7Catalytic Carbon Transformation, National Renewable Energy Laboratory, Golden, CO, United States
With the urgent need to mitigate climate change and rising global temperatures, technological solutions that reduce atmospheric CO2 are an increasingly important part of the global solution. As a result, the nascent carbon capture, utilization, and storage (CCUS) industry is rapidly growing with a plethora of new technologies in many different sectors. There is a need to holistically evaluate these new technologies in a standardized and consistent manner to determine which technologies will be the most successful and competitive in the global marketplace to achieve decarbonization targets. Life cycle assessment (LCA) and techno-economic assessment (TEA) have been employed as rigorous methodologies for quantitatively measuring a technology's environmental impacts and techno-economic performance, respectively. However, these metrics evaluate a technology's performance in only three dimensions and do not directly incorporate stakeholder needs and values. In addition, technology developers frequently encounter trade-offs during design that increase one metric at the expense of the other. The technology performance level (TPL) combined indicator provides a comprehensive and holistic assessment of an emerging technology's potential, which is described by its techno-economic performance, environmental impacts, social impacts, safety considerations, market/deployability opportunities, use integration impacts, and general risks. TPL incorporates TEA and LCA outputs and quantifies the trade-offs between them directly using stakeholder feedback and requirements. In this article, the TPL methodology is being adapted from the marine energy domain to the CCUS domain. Adapted metrics and definitions, a stakeholder analysis, and a detailed foundation-based application of the systems engineering approach to CCUS are presented. The TPL assessment framework is couched within the internationally standardized LCA framework to improve technical rigor and acceptance. It is demonstrated how stakeholder needs and values can be directly incorporated, how LCA and TEA metrics can be balanced, and how other dimensions (listed earlier) can be integrated into a single metric that measures a technology's potential.
Introduction
With the increasing need to mitigate climate change and prevent global temperatures from rising further, carbon capture technologies play a key role in decarbonizing the energy, transportation, and building sectors. In particular, there is an urgent need to rapidly deploy carbon removal technologies on a global scale to address global atmospheric CO2 concentrations. The relatively young carbon capture, utilization, and storage (CCUS) industry is growing fast in the United States to meet this incredible demand and has many opportunities for technologies to compete in various markets and sectors (Sick, 2021). The CCUS industry has a plethora of technologies with no dominant technology branch, and hundreds of millions of dollars in investments and financing. How do we properly assess and identify which of the many technologies are the most promising and have the greatest potential and benefits? Which technologies can rapidly scale and are worth investing in? Which technologies can remove the most CO2 from our atmosphere?
To answer these questions, a wide variety of technology assessment methodologies exist. A dominant and ubiquitous type of technology assessment is the technology readiness level (TRL). The TRL has been used extensively by researchers, developers, financiers, and stakeholders in many technology domains since its creation by the National Aeronautics and Space Administration (NASA) in the 1970s and 1980s. In the United States, the U.S. Department of Energy (DOE) began developing a version in 2008 and applying it to DOE programs around 2011 [(US Department of Energy (DOE), 2011)]. In Europe, the European Commission/Union began adopting TRL in 2008 and applying it widely beginning in 2010, with a focused effort in the Horizon 2020 program (European Commission, 2014). A number of organizations have published versions specific to wave and ocean energy Nielsen, 2010; Fitzgerald and Bolund, 2012; Magagna et al., 2018; Ocean Energy Systems, 2021; ESB Ocean Energy, 2011). For CCUS, some recent papers have discussed the application, implementation, and influence of TRL on life cycle assessment (LCA) and techno-economic assessment (TEA) within the CCUS industry. Recent work (as submitted) by Dr. Arno Zimmermann and team examines early-stage technology assessment and outlines the challenges in the interplay of LCA, TEA, and TRL, and presents best practices for assessing early-stage CCUS technologies. TRL has important implications for LCA and TEA for CCUS technologies, as it affects the availability and quality of the inventory data, data and assessment uncertainties, and technology development timelines (Buchner et al., 2019; Cremonese et al., 2020; Wunderlich et al., 2021). Zimmermann et al. (2020) provide an adaptation of these international TRL definitions to the chemical and process industries and discuss common challenges in identifying technology maturity of CCUS systems.
In general, TRL provides a measure of a technology's commercial readiness or maturity. A technology's development path over time is termed its technology development trajectory, and TRL increases as the technology evolves from concept to prototype to minimum viable product. Many governments, funding agencies and organizations, investors, and industries use TRLs to make funding and business decisions. However, TRLs have many shortcomings. An extensive analysis of these shortcomings and suggested improvements is presented in Olechowski et al. (2020). They identified 15 challenges associated with TRL in categories such as system complexity, planning and review, and validity of assessment. Some of these challenges concern superficial attributes like visualization and imprecision, and some concern progress along the TRL spectrum. Others regard some of the more structural and fundamental aspects such as scope, subjectivity, and systems integration, connectivity, and interfacing. The authors also suggested best practices and proposed extensions to the methodology to overcome these challenges. In addition to these challenges, TRLs fail to describe how well a technology will perform and how cost-competitive and economically viable it will be once it matures. TRL describes a technology along only a single dimension (commercial readiness) and does not account for how valuable a technology will be once matured or ready. How well will it compete in the global marketplace? What impacts have been designed into the technology from the beginning? What is the technology's true potential (e.g., market, scalability, and techno-economic)? How valuable will it be to all stakeholders and customers once it is market-ready?
Technology performance levels (TPLs) can address these questions and more. TPL is a comprehensive and holistic assessment of a nascent technology's potential, which includes its techno-economic performance, environmental impacts, social impacts, safety considerations (such as human health risks, hazards during operations and maintenance, etc.), use integration (integration and interfacing with the coupled system), market opportunities, and general risks (Weber, 2012). TPL can account for non-linear and qualitative design drivers, quantify trade-offs between various metrics (such as life cycle assessment and techno-economic analysis), and guide technology developers during the design and development process. It has been shown in the literature (Weber et al., 2017) that the combined consideration of TRL and TPL can drive technology development trajectories (within the TRL-TPL two-dimensional plane) to successful outcomes in less time, at lower cost, and with reduced risk (Figure 1). The conventional technology development trajectory (shown in red) that focuses on maturation of the technology and subsequently addresses techno-economic performance only at high TRL. The alternative technology development trajectory (shown in green) is the inverse approach—focusing on improving the techno-economic performance potential before maturing the technology. A combined approach (shown in black) is illustrated where maturity is favored until reaching a TRL of ~8.5, where it is assumed that it is no longer possible to reach a higher point. At this point, the technology is redesigned/reimagined with a higher potential, and changes are made to increase the TPL. The total technology development costs, time, and risk for each of the three options is presented in the table in Figure 1. It is shown that increasing the TPL before increasing the TRL significantly lowers the costs, time, and risks of technology development (Weber et al., 2017).
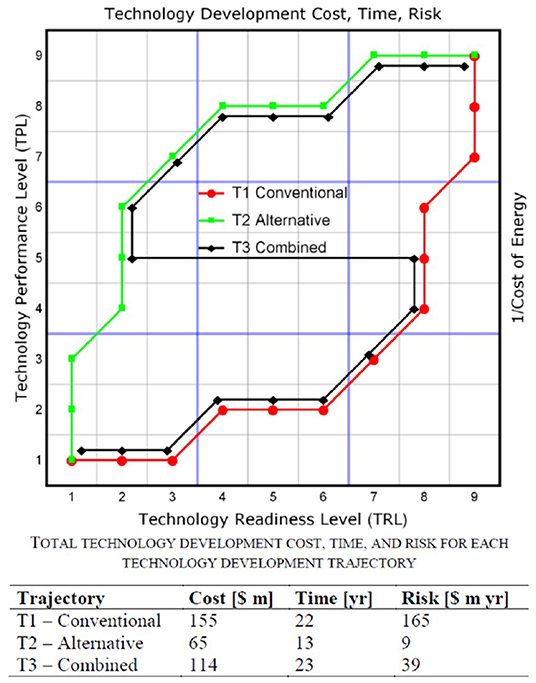
Figure 1. Example technology development trajectory as a function of TRL and TPL.
The TPL integrated assessment framework and methodology that this work builds upon was originally developed for the wave/marine energy industry (Weber, 2012) and is adaptable to the CCUS industry. Both industries suffer from long and slow technology development timelines, as well as high risks and costs during technology development. TPL can guide technology development trajectories to successful outcomes in less time, at lower cost, and with reduced risk, which is important given the urgency to deploy and scale CCUS systems. Hence, the focus of this research is to extend and adapt TPL from the marine energy domain to the CCUS domain.
TPL is an integrated assessment metric that combines LCA and TEA outputs with additional life cycle considerations (such as safety, social impacts and benefits, risks, uncertainties, and deployability) into a single unified metric analogous to TRL (scores of 1–9). In this way, TPL serves as a combined indicator at the top-most level of assessment. In accordance with Wunderlich et al. (2021), TPL is a type of combined indicator with more than two dimensions. It is most closely aligned with a quantitative preference-based integration (type C), but strongly correlates with quantitative combined indicator-based integration (type B) and incorporates some qualitative elements (weakly correlating with type A) (Wunderlich et al., 2021). TPL combines elements of combined indicator-based integration and preference-based integration (McCord et al., 2021).
In addition to TRL and TPL, there are two related technology assessment integration methodologies: multi-criteria decision analysis or multi-attributional decision-making, and multi-objective optimization (McCord et al., 2021; Wunderlich et al., 2021). Multi-objective optimization is characterized by multiple quantitative optimization goals that must be simultaneously maximized or minimized. These optimization objectives are calculated for each design point and are typically plotted on a Pareto chart to determine the design(s) that best achieve a balance of the stated objectives. This type of analysis is not well-suited to TPL. TPL is much more closely aligned with a multi-criteria decision analysis tool because of its incorporation of stakeholder requirements into a well-defined hierarchy and criteria weights. It is truly “a method for supporting decisions that involve multiple dimensions or criteria and thus allows evaluation of trade-offs. It allows economic, social, and environmental criteria, including competing priorities, to be systematically evaluated” (McCord et al., 2021).
The above introduction describes how TPL fits into the multi-criteria decision analysis tools available within the CCUS space, what role it serves, and the benefits it provides to the CCUS industry. The following sections describe how the TPL methodology is adapted to and made consistent with the life cycle framework outlined in Standard 14040 from International Organization for Standardization (ISO) (2006a).
Methodology
Goals and Scope
The TPL methodology is consistent with the internationally standardized framework for impact assessment, ISO 14040 [International Organization for Standardization (ISO), 2006a] and ISO 14044 [International Organization for Standardization (ISO), 2006b]. By adhering to these international standards, TPL is in harmony and alignment with LCA and TEA (which are also aligned to these standards).
Purpose
The purpose of a technology performance assessment is to enable the technology developer to create a valuable, high-performing, and cost-competitive product with minimal impacts, costs, and risks. To support technology developers, TPL can:
• Provide technology developers with guidance on improving their design and detection of cost and impact drivers (hot spots) and/or fatal flaws.
• Identify the most improved technology development trajectory by identifying areas to target with funding and resources.
• Account for both quantitative and qualitative design drivers, even if immeasurable.
TPL is an integrated assessment methodology, and thus is subject to the guidelines and recommendations within Wunderlich et al. (2021). The goals of integrating LCA and TEA include satisfying the TPL objectives listed above in addition to:
• Addressing trade-offs between competing design goals, such as technical performance, lifecycle costs, and environmental impacts.
• Incorporating stakeholder feedback and values into assessment methodology.
The assessment has the potential for a wide target audience. The primary intended audience is also the practitioner—the technology developer. Additional audiences may choose to use the assessment results for decision making, such as:
• Reviewers assessing technologies in competitions or for making funding decisions.
• Investors or project developers doing due diligence.
• Policy makers landscaping the technology domain for formulating research and development strategy.
System Definition
It is critical to clearly define the technology or system being studied, as this significantly affects the system boundaries. For the historical use case, wave energy converters, the system is defined as:
system = all components and subcomponents that comprise the wave energy farm until the point of (electrical) interconnection to the system it is coupled to (e.g., continental grid).
Please note that this definition captures energy storage on the generation side of the connection, but not energy storage on the use side of the connection. For the carbon capture, utilization, and storage domain, the following system definition is recommended:
system = all components and subcomponents that comprise the carbon capture and/or conversion process(es) from the point of interconnection to the coupled system (e.g., emitting source, waste gas stream, or ambient air), including all feedstocks and energy fluxes, to the intended output e.g., separated CO2; construction materials, industrial additives, and products; chemicals; polymers; fuels; materials; food products; commercial products (see Global CO2 Initiative, 2016). Note: the intended output is that which is produced by the capture process and/or which can be further processed into a commercial product or stored/sequestered.
Defining the Functional Unit
The functional unit plays a significant role in defining both the inputs to and the outputs from the assessment. The majority of (but not all) quantities and/or data are normalized by this unit. In the historical context of wave energy conversion, the functional unit is defined as 1 kWh or 1 MWh of electricity produced.
In the CCUS context, the functional unit is usually (1) per unit mass of product (e.g., 1 ton CO2 for capture-only systems or 1 ton CO2 sequestered for capture and storage systems) or (2) per unit product (e.g., 1 bracelet or 1 bottle or 1 chair for capture and utilization systems). Additional information and recommendations for how to select the appropriate functional unit for CCUS technologies can be found in Cremonese et al. (2020). The functional unit can also be based on energy content, mass, quantification of the energy or technical service, and/or satisfaction of the energy demand (Cremonese et al., 2020), as appropriate.
System Boundaries
The TPL assessment methodology is based on two foundational assumptions: the assessment must be technology-agnostic and site-agnostic:
• Technology-agnostic: The assessment must be independent of the technology configuration, archetype, or other characteristics to evaluate different technologies fairly and objectively.
• Site-agnostic: The assessment must be applicable and relevant to any site or locale in which the technology operates (excludes site-specific parameters). The assessment should be executed without a particular site/location in mind. A technology will have a stronger business case and be more market-competitive with more sites where it can be deployed.
For wave energy, the site-agnostic nature of the assessment methodology is proving challenging and is presently under debate as considerable feedback from different stakeholders suggests that early technology development is aligning directly with site resource characteristics and adding site specificity could add value to the assessment. There are multiple components to site-specificity, such as resource characterization, environmental impacts, societal and/or community impacts, etc. A more detailed discussion on this topic is presented in section Discussion.
Selection of Benchmarks
For the historical marine energy use case, six reference technologies have been selected for their widespread use and distinctly different operating principles. A TPL assessment has been performed for three of the six technologies, which are all wave energy converters (WECs). Three wave energy converter TPL assessments are available on the National Renewable Energy Laboratory's Technology Performance Level Assessment for Wave Energy Converters web page.1 A description of the six reference models is available on the Sandia National Laboratories Energy website2 A technology developer can begin by utilizing the reference model assessment to which their technology is most similar and modifying it appropriately. If a suitable reference model is not available, literature and references are supplied to support the creation of a new assessment by providing approximations and estimates.
For the carbon capture and conversion applications, relevant use cases and benchmarks can be found at the Global CO2 Initiative website with their toolkit examples3 and the Assess CCUS website with their CCUS assessment resources.4 These publicly available examples span a range of CCUS applications, such as fuels, chemicals, mineralization, and more.
Additionally, a practitioner may use different versions of the same technology for comparison. First, a technology developer may choose (and is highly encouraged) to perform multiple TPL assessments over time as their technology evolves. In this use case, the original design becomes the reference or benchmark assessment, and improvements or changes are made to it with subsequent designs, more detailed designs, and/or the exploration of alterative configurations. Second, as will be discussed in section Interpretation and Reporting, an alternative method of presenting the results would allow the strengths and weaknesses of the technology to be clearly illustrated and visualized without the need to dissect what a single number/score means or compare the absolute number/score to others.
Inventory
The inventory data required about the technology under development are clearly enumerated in a technology submission request. The technology submission request document specifies and defines the data format, type, units, inclusions, and exclusions.
There are several considerations that must be accounted for when collecting data about the technology. The first is the TRL, because it typically indicates how much data are available, the level of fidelity or quality of the data, and how much uncertainty is associated with that data. This is true for LCA, TEA, and TPL assessments. TPL is intended to be applied to a technology as early in the design and development as possible (TRL ~1–3) to catch problems sooner, minimize embedded costs and impacts in the design promptly, and improve the technology's potential and acceptance (TPL) before market readiness (TRL). However, if the TRL is sufficiently low, then some approximations and estimates from the appropriate literature will be necessary. A lack of data does not justify skipping a TPL assessment—the considerations presented by TPL are still valid and relevant regardless of the current TRL. This is especially critical since up to 80% of final production costs and environmental impacts are determined at very early stages during a product's development (Dowlatshahi, 1992; Thomassen et al., 2019; Moni et al., 2020). Even with estimated data for lower TRL stages, critical decisions (namely go/no-go) can still be made reliably (Faber et al., 2021). As the TRL increases, the data uncertainty decreases, but the ability to make changes to the design (to improve its potential and reduce life cycle impacts and costs) is dramatically reduced due to increasing complexity and sunk costs.
Second, the inventory data required by TPL heavily overlap with the data required for LCA and TEA (Figure 2). The assortment of required input data is shown in the bottom box of Figure 2. TPL requires some additional data beyond what LCA and TEA require, such as safety information (e.g., human health risks, hazards during operations and maintenance, safety philosophy, etc.), infrastructure requirements, job creation potential, regulatory requirements, social impacts, and so on. Some of this data can be obtained from other tools and frameworks, such as the Employment Impact Assessment or the NREL Jobs and Economic Development Impact (JEDI) model. Input data can also be estimated from literature appropriate to the industry. These various types of input data then feed into the LCA and TEA analyses, as well as directly into the TPL calculations (see section Impact Calculation: Systems Engineering Framework). Moving upwards in Figure 2, the outputs from LCA and TEA are then used in the TPL calculations. Please note that the examples (text) given in Figure 2 are intended to be illustrative, not exhaustive.
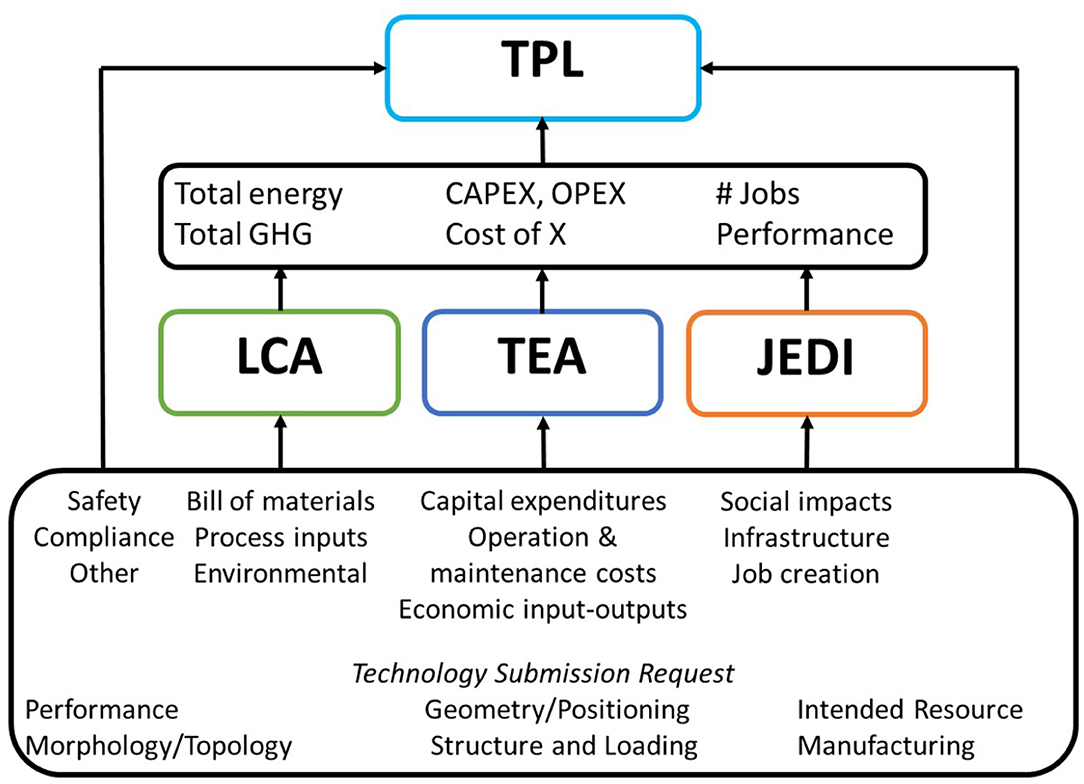
Figure 2. Data hierarchy for LCA, TEA, and TPL.
As with TEA and LCA, if inventory data are not available, data from the literature and publicly available data sets may be used, subject to timeliness, fidelity/quality, and relevance guidelines (such as those in ISO 14046 and Cremonese et al., 2020; Zimmermann et al., 2020).
Impact Calculation: Systems Engineering Framework
The TPL methodology was originally developed from the systems engineering framework (Figure 3). The systems engineering framework follows guidance from ISO 15288 [International Organization for Standardization (ISO), 2015] and Standard 1233 from Institute of Electrical and Electronics Engineers (IEEE) (1998). Systems engineering is a disciplined approach to holistically evaluating the goals that must be achieved by a technology and the fundamental elements of the solution that enable achievement of these goals. The systems engineering approach is employed to formally develop the requirements for a successful system. There are two main components to the systems engineering approach: capabilities and functions. The capabilities are the goals of the system, as determined from an analysis of stakeholder needs. The functions are the activities or behaviors that must be performed, or the characteristics the system must possess, to achieve these goals (capabilities) (Bull et al., 2016). The heart of systems engineering is a stepwise decomposition and flow-down of stakeholder needs to each component of the system. Thus, the first step in the systems engineering approach is to define the mission statement.
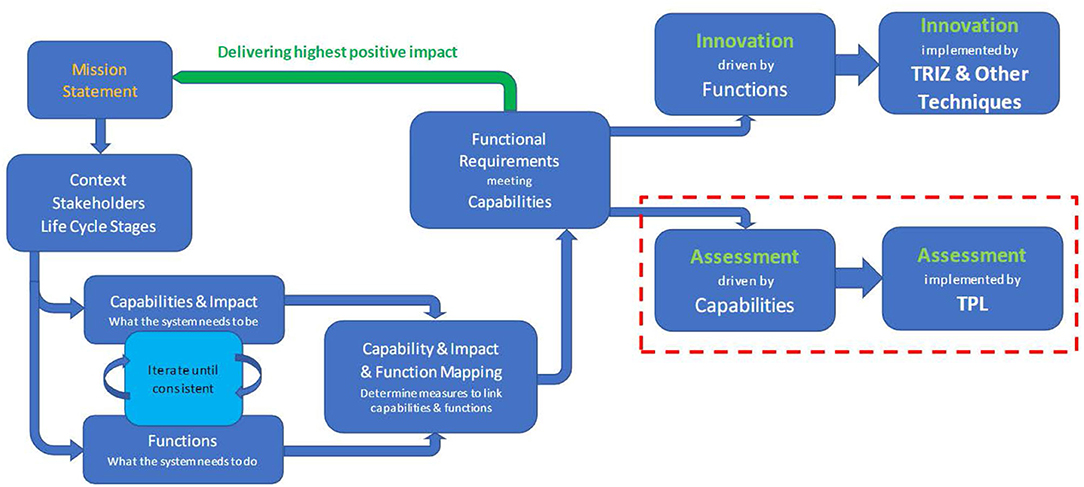
Figure 3. Diagram of capabilities and functions.
Mission Statement
The mission statement for the wave energy farm is:
“The wave energy farm will convert ocean wave energy into electricity and deliver it to the continental grid market in a competitive and acceptable manner across its lifecycle” (Bull et al., 2016).
This mission statement reflects the target application of the wave energy farm—the continental grid. The mission statement for the carbon capture, utilization, and storage system is:
“The carbon capture, utilization, and storage system shall capture, separate, convert (into chemicals, materials, additives, products, or fuels), and/or store carbon dioxide in a competitive manner with minimal costs, risks, and negative impacts over its lifecycle.”
Depending on the specific technology being evaluated, some of these steps (capture, separate, convert, and store) may not be relevant to the analysis. This mission statement will guide the assessment methodology development.
Life Cycle Stages
Consulting Figure 3, the next step is to define the life cycle stages. For historical context, the life cycle stages have been defined in Babarit et al. (2017) (Figure 4A). These terms are associated with the offshore construction industry but loosely correlate with the standardized life cycle phases (Figure 4B). Engineering generally correlates with materials and production; procurement and construction with manufacturing and assembly; installation and operations with application and use; and disposal (or recycle/reuse) with end of life. Moving forward, it is strongly recommended that the TPL assessment be conducted in accordance with ISO 14040 and ISO 14044 and harmonized with LCA and TEA. To this end, TPL shall employ the same life cycle stages used by LCA and TEA, shown in Figure 4B and defined in ISO 14040 and ISO 14046.
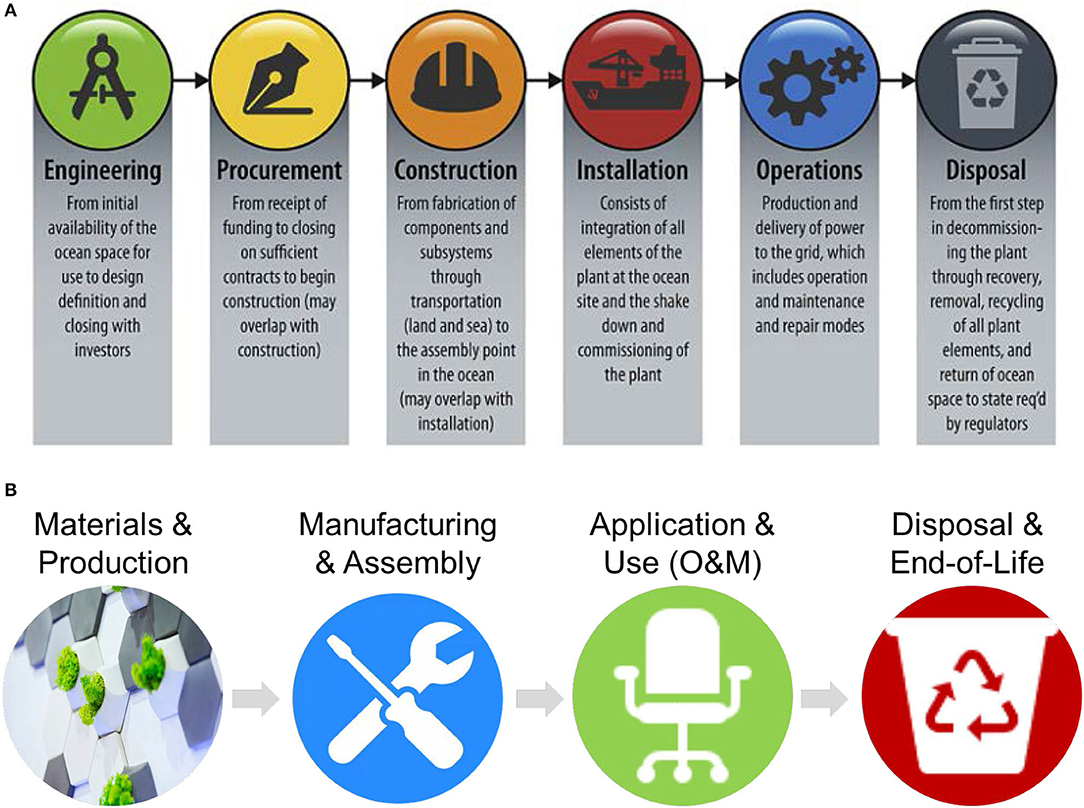
Figure 4. Life cycle stage for (A) wave energy farm and (B) LCA.
These well-established life cycle stages fluctuate very little but can take on different meanings and connotations when evaluating different technologies and/or technology domains.
Stakeholder Analysis
The stakeholder needs drive the technology requirements and design. For any technology in any domain, it is critically important to collaborate with the wide variety of stakeholders involved and invested in the technology to enable success. Stakeholders include but are not limited to technology developers, project developers, integrated system partners, end users, consumers, regulators, investors, operators, suppliers, contractors, and many more (Table 1). Each stakeholder has different needs and values, and some will have greater importance or relevance to the technology than others.
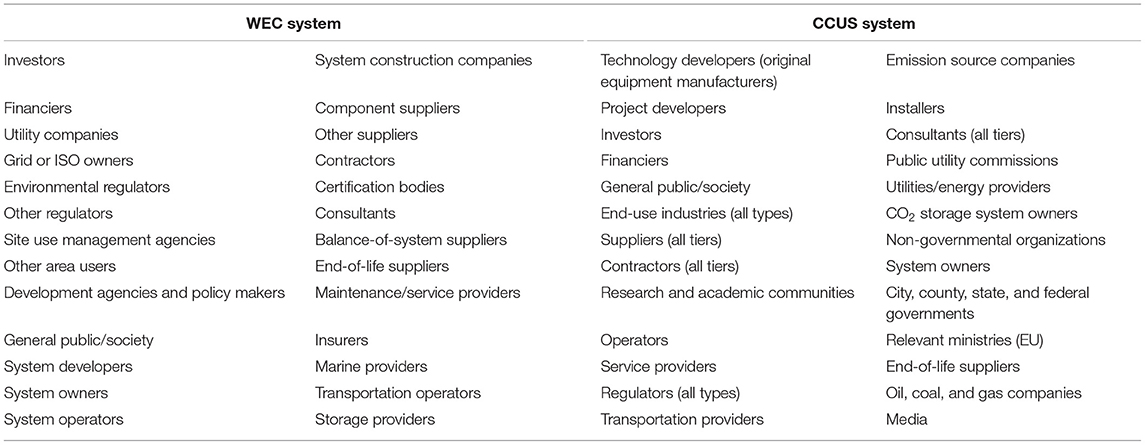
Table 1. List of stakeholders.
Babarit et al. (2017) performed a stakeholder analysis for WECs for the continental grid application. They identified 26 stakeholders and grouped them into four categories: highest-level, core, first-tier suppliers, and lower-level suppliers. These 26 stakeholders are listed in the “WEC system” columns (Table 1). For full details on methods, rankings, and stakeholder selection, please refer to Babarit et al. (2017).
For the CCUS domain, previous stakeholder analyses have shown a similar plethora of stakeholders in different areas. Note that virtually all of these stakeholder analyses emphasize storage applications and not utilization applications. Chaudhry et al. (2013) identified and interviewed 84 different stakeholders across four states (U.S.-centric) and grouped them into four categories: government (elected and non-elected, mostly at the state level), academics and researchers, non-governmental organizations (NGOs), and various industry players (utilities, developers, other). Their analysis was primarily focused on policy-making entities and how their priorities and perceptions shaped the various policies, legislation, and regulations in those states. Caskie (2020) specifically covered direct air capture systems coupled to CO2 storage/sequestration with more of a technology focus (EU-centric). He identified several different stakeholder groups, as well as five key performance indicators (KPIs): levelized cost of CO2, capital expenditures, operational expenditures, energy requirements, and plant CO2 emissions (all of which must be minimized). The first three are economic indicators, whereas the latter two are more performance-oriented. Johnsson et al. (2008) surveyed electric utilities, oil and gas companies, NGOs, and emission source companies across North America, Europe, and Japan. Results from these references have been included in the “CCUS system” columns in Table 1. There is significant overlap between both sets of stakeholders, particularly as it relates to development and deployment, with some industry-specific differences.
Define the Capabilities Taxonomy
Once the stakeholders are identified and their requirements are developed, the capabilities can be defined. Recall that the capabilities are what the system needs to be (the goals) to be successful. These must include technical, economic, environmental, and social aspects (address the triple bottom line, for example: people-planet-profit) to succeed in the global marketplace.
For the marine energy technology domain, the following seven capabilities have been identified (Bull et al., 2017):
1. Have a market-competitive cost of energy (C1)—Economics
2. Provide a secure investment opportunity (C2)—Economics
3. Be reliable for grid operations (C3)—Benefits
4. Benefit society (C4)—Benefits
5. Be acceptable for permitting and certification (C5)—Acceptability
6. Be safe (C6)—Acceptability
7. Be deployable globally (C7)—Economics.
Where “C” represents “capability”, which can generically be represented as Ci. These capabilities are grouped into three categories—economics, acceptability, and benefits—for purposes of assigning weight and importance. Now, the capabilities for the CCUS domain can be defined to meet the mission statement. Successful technologies must:
1. Have low cost of CO2 or cost of product (C1)—Economics
a. Have low capital expenditures and operational expenditures
b. Have high technical performance (e.g., CO2 captured or stored) and availability
2. Have minimal risks and uncertainties (C2)—Economics
3. Use integration: have minimal impacts to the coupled system (for all non-direct-air-capture technologies) (C3)—Acceptability
4. Have minimum social impacts and maximum benefits over its entire lifecycle (C4)—Benefits
5. Have minimum environmental impacts and maximum benefits over its entire lifecycle (C5)—Acceptability
6. Be safe (C6)—Acceptability
7. Be scalable and deployable (C7)—Economics
8. Carbon reduction potential: maximize reduction of CO2 in the atmosphere or prevention of CO2 from entering the atmosphere over its lifecycle (C8)—Benefits.
The first two capabilities can be easily represented and calculated from TEA outputs because both include aspects of technical performance and economics. C1 is the primary quantitative TEA results, and C2 is the uncertainties in those results (including other types of risks). Thus, C1 and C2 are directly formed from and related to TEA. Having “minimal risks and uncertainties” is intended to be a more general form of “provide a secure investment opportunity”, because investors and financiers look for low(er) risks and uncertainties (and the majority of questions in that capability are related to risks and uncertainties). To facilitate lower risks and uncertainties, a stable policy framework is needed for both industries.
One of the biggest differences between the wave energy domain and the CCUS domain is the primary technical performance metric. All wave energy converters produce electricity/power for an external system, application, market, and/or use case. However, the primary performance metric/KPI for CCUS systems varies strongly with and depends heavily on the technology: Capture-only systems typically produce CO2, in which quantity and purity (quality) are the driving metrics. Utilization systems can produce a wide array of products, which will dictate the functional unit, the “efficiency” of the system (how efficiently the system converts inputs to outputs), and the life cycle carbon intensity (carbon-positive, neutral, or negative [and to what degree]). Carbon storage systems can be measured by the total quantity of CO2 capable of being stored before saturating. One generic KPI to measure technical performance could be the ratio of tons of CO2 per kilowatt-hour-equivalent for the system divided by the theoretical minimum of tons of CO2 per kilowatt-hour-equivalent for its CO2 source, which also measures system efficiency. Finding a common or equivalent technical performance metric/KPI across all CCUS systems is challenging and requires further research.
Use integration, or C3, descends from the long history of CCUS technologies. Historically, CCUS systems have drained power and/or performance from the emitting systems they are attached to, which has significantly reduced their acceptability and deployability to date. Modern systems are required to be as small of a burden as possible on the systems supplying them with CO2. Hence, this is an important characteristic for all non-direct-air-capture systems to be successful.
C4 represents a social impact assessment couched in the assessment framework but can also incorporate human-related LCA outputs. C5 is directly tied to LCA, where the outputs of LCA are directly incorporated into the questions that form this capability. For example, total lifetime energy use, renewable energy usage, end-of-life disposal, and total emissions can all be quantitative example questions under C5 (Part II of this series will provide additional information).
The overwhelming need for the nascent CCUS industry is the ability to scale up to draw gigatons of CO2 from the atmosphere to even begin to address global emissions, which is captured in C7 and C8. Some CCUS systems can only be attached to CO2 sources with high purity (>90% CO2), whereas other systems can work with more dilute waste gas streams (~8–30% CO2), and direct air capture systems can operate virtually anywhere with the most dilute CO2 source (~0.042% CO2). Generally speaking, the lower the purity of CO2 required, the higher the deployability. The higher the deployability, the greater the carbon reduction potential.
Derive the Functions Taxonomy (Functional Requirements)
From these capabilities, the functions can be derived. Recall that the functions define the fundamental actions that the system must perform and the behaviors that the system must possess to achieve the mission and deliver the previously mentioned capabilities. High-level functions are independent of the technology or design used to implement the function; however, detailed functions may reflect specific design choices. The functions identify what the system must do and the behaviors the system must have to satisfy its mission (Bull et al., 2016). The five functions for the WEC case are (Bull et al., 2017):
1. Generate and deliver electricity from wave power
2. Control the system (wave energy farm) and its subsystems
3. Maintain structural and operational integrity of systems and components
4. Provide suitable access and transportation
5. Provide synergistic benefits.
These functional requirements could be generalized to:
1. Generate the desired product(s) or output(s)
2. Provide controls and condition monitoring
3. Operate and be dependable in varied environments
4. Provide safe access and be easily transportable
5. Provide benefits (e.g., environmental, social, and use integration).
For CCUS systems, the concept of “survivability/dependability”, or the ability to “operate and be dependable/survive in varied environments”, has a different connotation. One interpretation of this requirement for CCUS systems is the degree to which additional auxiliary systems are needed to pre-process or control the environment. For example, some CCUS technologies might require scrubbers (to remove sulfuric/nitric compounds or particulates), dehumidifiers, and/or heat exchangers (temperature controls) to pre-process the gas stream before it enters the CCUS system (as defined in section System Definition). Such items add additional complexity and costs that must be included in the system boundaries if they are necessary to create a suitable environment for CCUS system operation. Additional considerations for direct air capture systems could include operation in poor or extreme environmental conditions (e.g., in inclement weather).
Proposed functions for CCUS technologies could include:
1. Pre-process the emissions stream to ensure suitable operating conditions (if applicable)
2. Reliably, efficiently, and consistently reduce the atmospheric concentration of CO2 or prevent/avoid CO2 emissions through a capture and separation process
3. Reliably, efficiently, and consistently:
a. Generate high-quality outputs, such as tons of CO2 (capture only)
b. Generate high-quality products, such as liters of fuel (capture and utilization)
4. Store/sequester CO2 (storage/sequestration)
5. Operate in a safe and controlled manner
6. Provide low-carbon supply chains to industry
7. Provide benefits to end users, coupled system stakeholders, society, and the environment.
These functional requirements are further decomposed into subfunctions, sub-subfunctions, and so forth as needed.
Quantification
Once the functions are derived, specific assessment questions are identified at the intersection of the capabilities and functions. The assessment questions form the backbone of the assessment and have four independent qualities or attributes:
• Question wording
• Scoring guidance
• Justification
• Weight.
The individual questions will be specific to the technology domain, and to the specific application within the domain. The total number of questions, as well as their distribution among the capabilities, will vary with application and market. In addition to the qualities mentioned earlier, individual questions may be added or removed for an additional degree of freedom (level of customization). In the wave energy TPL assessment tool for the continental grid, there are 88 questions (with a few redundancies). As the continental grid TPL tool has been adapted to other wave energy markets, this number and the distribution of questions has changed. A compilation of all questions is available in the web version of the tool.5 New individual questions specific to the CCUS domain (and an example assessment) are the subject of Part II of this article series. The following are some examples of how LCA and TEA results can become assessment questions for the CCUS technology domain:
• C1: In production volumes, what is the estimated assembled cost of the CCUS system in dollars per ton of CO2 captured? (capital expenditures—TEA)
• C1 and C2: What is the availability of the CCUS system, allowing for time and emissions while the system is being cycled to regenerate its primary function?
• C4 (and C5): To what degree does the system affect human health? (human toxicity—LCA)
• C5: Does the CCUS system produce toxic levels of environmentally hazardous by-products? (marine and freshwater aquatic ecotoxicity, and terrestrial ecotoxicity—LCA)
• C7: What production volumes are achievable at full-scale production? (total production volume—TEA)
• C7: What minimum level of purity of CO2 is required for the system to function as intended?
It is important to recall that the assessment questions may be qualitative or quantitative in nature. This is to account for both measurable and immeasurable design drivers. The scoring guidance for each assessment question provides the mechanism for converting a qualitative response into a quantitative, numerical, dimensionless value ranging between 1 and 9 that can be utilized in systematic calculations. The scoring guidance typically distinguishes between low (1–3), medium (4–6), and high (7–9) scores.
The individual assessment questions are assigned weights (in agreement and collaboration with the stakeholder community), and these weights are employed to calculate a score for the appropriate capability level. Each capability level is also assigned a weight (which indicates relative importance) that is used to compute the value of the capability level above it. This process continues until all capability levels have been assigned weights and are employed in the calculations for the highest-level capabilities (described in section Define the Capabilities Taxonomy). These calculations employ three mathematical operations: arithmetic mean, geometric mean, and harmonic mean. Arithmetic mean is used when combining scores that measure similar attributes (e.g., when combining costs). The arithmetic mean is like a logical “OR”; for example, when combining costs, it does not matter what the individual costs are, only what the combined cost is. A related situation is one in which the reciprocals of the scores better reflect the attributes to be added together. In that situation, the appropriate way to combine scores is to take their harmonic mean. Geometric mean is used when combining scores that measure disparate attributes. They are like a logical “AND.” They are used to combine “must-haves.” To get a good score in the combined result, it is necessary to have a good score in all of the inputs (e.g., the different types of survivability are must-haves). A complete description of the updated formulas employed by the assessment tool is available in Mendoza et al. (2021). For the wave energy farm, the TPL score is calculated from the top-level capability scores (C1–C7) as follows:
As stated in section Define the Capabilities Taxonomy, the particular groupings of the capabilities are based on their categories (economics, benefits, and acceptability). The various weights can be adjusted based on the application and stakeholder decisions, provided that they are suitably normalized. Note that all quantities and calculations are non-dimensional.
If the capabilities are defined such that each is a different type or category of performance (technical, economic, environmental, social), then the equation allows the stakeholder community to define the relevant importance between the various aspects. In this way, TPL supports harmonizing LCA and TEA results by providing a clear and transparent mechanism to trade off environmental and techno-economic indicators through stakeholder values. For the CCUS system, one can calculate the TPL from the eight capabilities as follows:
where: Cn are the capabilities derived for the CCUS industry and described in section Define the Capabilities Taxonomy; an are the weights defined by and agreed upon by the stakeholder community, ranked from highest to lowest in order of importance; and pn are the weighted exponents in Equation (2) above.
Defining the appropriate weights for the CCUS community requires a clear and transparent stakeholder analysis, in which stakeholders rank their requirements from most important to least important, such as that performed in Trueworthy et al. (2021). Furthermore, each stakeholder can be assigned a relative importance. These two variables can be subsequently combined to create a justifiable, quantitative weight for each capability. Part II of this paper will include an adaptation of the stakeholder analysis done by Trueworthy et al. (2021) for the CCUS technology domain.
Interpretation and Reporting
There are multiple ways to interpret and visualize the results of a TPL assessment, which include but are not limited to: a single TPL score, and visualization of the capability scores such as a spider chart, parallel coordinates plot, or other multi-dimensional techniques.
The single TPL score is intended to have a significance in accordance with Table 2. This score serves as an indicator of both the technology's feasibility and its economic viability—the higher the better. It is designed to be orthogonal (or mutually independent) yet complementary and analogous to TRL, with the same scale and range of values (1–9). As a technology's TRL and TPL change over time, they map out the technology's development trajectory, as shown in Figure 1. All technologies begin with low TRL and low TPL. As development progresses, a high TRL with a low TPL signifies that the technology is quickly maturing but with high costs and risks—coupled with an ever-increasing possibility that the technology will not succeed in the global marketplace. A high TPL with a low TRL will signify that while the technology is not quite yet ready for commercialization, it has both high promise and potential—technology that is likely to succeed when market-ready.
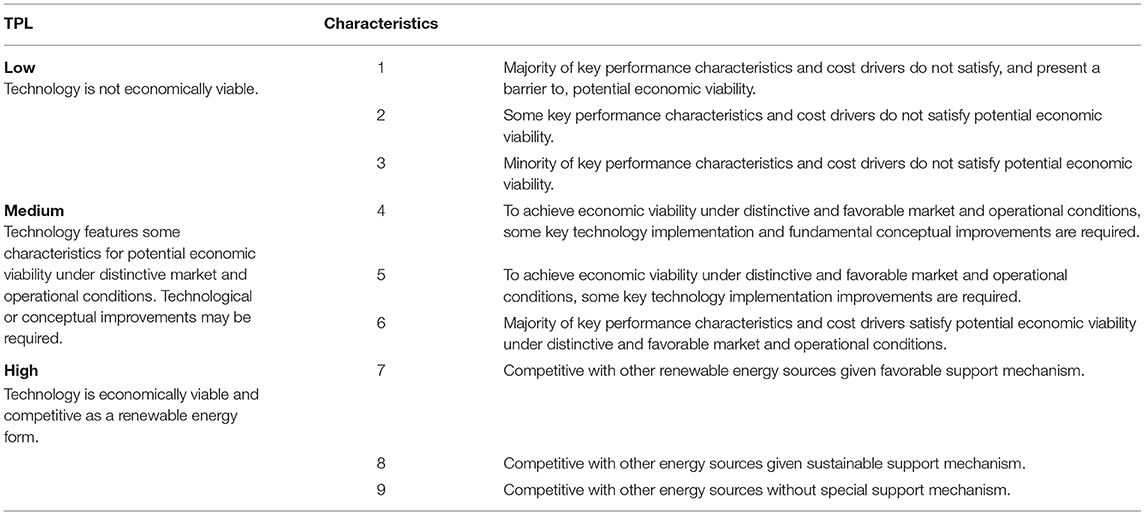
Table 2. TPL level definitions.
The single score can also be valuable when comparing to other TPL scores. First, if it is compared to its previous value for a past design iteration, it can indicate the direction that the technology is moving (greater for a positive change, or lesser for a negative change) and if that change increased the technology's potential or market value. Second, it can be compared to a reference or benchmark score, which can support innovation management. In this case, TPL follows the same guidelines that both LCA and TEA follow when selecting an appropriate benchmark (see section Selection of Benchmarks). The careful and purposeful selection of the most relevant benchmark is important, and must align with the goals of the assessment, as discussed in Wunderlich et al. (2021).
The TPL results may also be interpreted using a spider chart or parallel coordinates plot that compares the individual capability scores. Because each capability inherently represents a different dimension of performance or acceptance, this more visual format allows the practitioner to quickly visualize and understand where their technology currently stands. While any multi-dimensional visualization tool could be useful and relevant, this particular form of results presentation—the spider chart—is consistent with best practices in the LCA community.
Consider an example technology within the wave energy domain, a generic point absorber. This archetype is described on the Sandia National Laboratories Energy website (see text footnote 2). A reference assessment has been conducted for this reference model, and its final score was 5.4. Its capability scores are presented and illustrated in Figure 5 (Mendoza et al., 2021).
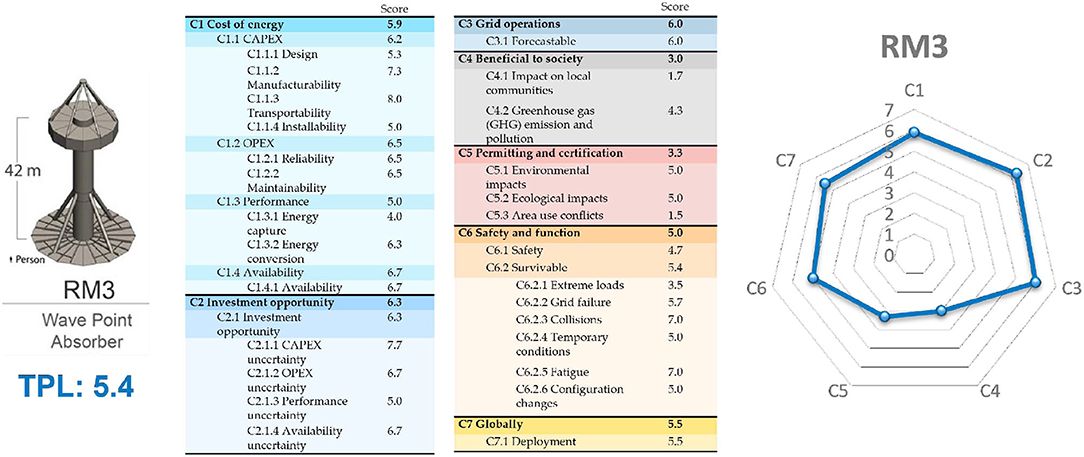
Figure 5. Reference model (3) point absorber results (Mendoza et al., 2021).
This presentation allows practitioners and audience members to clearly visualize both the strengths and weaknesses of a specific technology. In particular, it shows the salient design trade-offs made by the technology developer and the overall product strategy. It also highlights areas for potential improvement, which could then be leveraged when seeking additional funding and/or resources. In Figure 5, the point absorber scores high on investment opportunity (C2), meaning there is less uncertainty, thanks to the use of commonly available materials and standard manufacturing techniques. However, the device doesn't score high on cost of energy (C1), in part because the predominantly steel construction is not conducive in this case to a high power-to-cost ratio. The large footprint of the proposed mooring system and the surface profile of the device create potential conflicts with other ocean users; the low score on permitting and certification (C5) calls attention to this aspect.
Discussion
As a combined indicator, TPL incorporates results from both LCA and TEA and facilitates trade-offs using stakeholder values and requirements through a hierarchal weighting system. TPL also includes other elements, such as social impacts (local and global), risks and uncertainties, and safety considerations (such as human health risks, hazards during operations and maintenance, etc.), some of which may be qualitative—which solves a key problem in current technology approaches.
Although there are many benefits to TPL, it also has some limitations. One of the most poignant limitations is the intentional site-agnostic nature of the assessment methodology. The more sites the technology can be deployed to, the higher the return on investment, the better the business case (market, revenue, sales), and the greater the CO2 removal from the atmosphere. Niche applications with small markets and limited deployment opportunities are generally less competitive and profitable. However, a number of stakeholders and stakeholder groups have indicated that being site-agnostic is a noteworthy limitation that must be considered. Technology developers in the wave energy community have indicated that site-specificity will aid in their design process, due to the large number of variables and complexity in the wave resource. For technology developers in the CCUS industry, the CO2 resource is highly variable in attributes such as purity/concentration, temperature, etc. In addition, it will be important to use TPL to conduct site-specific assessments to account for local conditions, so that decision makers can derive local outcomes and locally deploy a technology. For both industries, it doesn't appear that one technology archetype will be able to efficiently address a wide variety of resource types. Social impact assessments require location information to properly assess energy equity issues. Similarly, LCA depends on location information to compute environmental impacts. This is currently being evaluated for future work and methodology improvements.
Conclusions
With the number of CCUS technologies rapidly increasing across many industries, it is important to quantitatively assess and identify which of these technologies offer the most potential, greatest value, and highest performance across multiple dimensions. TRL, LCA, and TEA are well-established assessment methodologies that each characterize a technology in one specific dimension (commercial readiness, environmental performance, and techno-economic performance, respectively). TPL can provide a holistic and comprehensive measure of a technology's performance across all dimensions in a single metric. As a combined indicator, TPL allows design trade-offs between LCA and TEA that incorporate stakeholder values.
In this article, the TPL assessment methodology has been adapted to the CCUS technology domain. In particular, it has been standardized to be more consistent with ISO 14040 and ISO 14044 by following the life cycle phases, nomenclature, and guidelines. Various definitions have been appropriately adapted for the CCUS technology domain. In this way, the TPL assessment methodology has been moved more toward harmonization with LCA and TEA.
Likewise, the fundamental systems engineering approach has been systematically adapted to CCUS technologies (to the authors' knowledge, a first of its kind), starting from the core fundamentals. In addition, new capabilities and functions for the CCUS industry were derived that reflect the characteristics of the CCUS industry. The systems engineering approach incorporates both stakeholder/customer needs (capabilities) and functional requirements (functions) by offering a methodology to develop the requirements that will enable technical solutions to comprehensively address stakeholder needs. Weights that are tailored to stakeholder values can be assigned to all individual questions and all levels of the capability taxonomy, including weights for LCA- and TEA-based capabilities. Derivation of these weights, based on a stakeholder analysis, and a sensitivity analysis of the TPL score to these weights will be presented in Part II.
The net result is a more consistent framework that enables the integration of LCA and TEA results and incorporates additional performance and impact categories. This paper has described the adaptation of the methodology, and Part II will include a new TPL assessment for the CCUS domain and a relevant example assessment with a full set of new assessment questions.
Data Availability Statement
The original contributions presented in the study are included in the article/supplementary material, further inquiries can be directed to the corresponding author/s.
Author Contributions
NM is responsible for assembling the entire document, contributions from other authors, developed the majority of the content, and flow of the paper. TM, BB, JR, JN, VS, and AZ contributed content, references, and wording changes from abstract through final paper. JW and JS contributed as reviewers (added content). All authors contributed to the article and approved the submitted version.
Funding
This study received funding from the U.S. Department of Energy Office of Energy Efficiency and Renewable Energy Water Power Technologies Office. This work was authored (in part) by the National Renewable Energy Laboratory, operated by Alliance for Sustainable Energy, LLC, for the U.S. Department of Energy (DOE) under Contract No. DEAC36-08GO28308. Sandia National Laboratories is a multimission laboratory managed and operated by National Technology and Engineering Solutions of Sandia, LLC, a wholly owned subsidiary of Honeywell International, Inc., for the U.S. Department of Energy's National Nuclear Security Administration under Contract DE-NA0003525. This paper describes objective technical results and analysis.
Author Disclaimer
Any subjective views or opinions that might be expressed in the paper do not necessarily represent the views of the U.S. Department of Energy or the United States Government. The U.S. Government retains and the publisher, by accepting the article for publication, acknowledges that the U.S. Government retains a non-exclusive, paid-up, irrevocable, worldwide license to publish or reproduce the published form of this work, or allow others to do so, for U.S. Government purposes.
Conflict of Interest
AZ was employed by Netzero Partners.
The remaining authors declare that the research was conducted in the absence of any commercial or financial relationships that could be construed as a potential conflict of interest.
Publisher's Note
All claims expressed in this article are solely those of the authors and do not necessarily represent those of their affiliated organizations, or those of the publisher, the editors and the reviewers. Any product that may be evaluated in this article, or claim that may be made by its manufacturer, is not guaranteed or endorsed by the publisher.
Acknowledgments
The authors would like to thank the teams at the National Renewable Energy Laboratory and Sandia National Laboratories upon whose legacy this research is based, and the International Teams (Global CO2 Initiative) that provided feedback, support, and input into this work. VS acknowledges support from the Global CO2 Initiative and the University of Michigan College of Engineering Blue Sky Program.
Footnotes
1. ^https://tpl.nrel.gov/about
2. ^https://energy.sandia.gov/programs/renewable-energy/water-power/projects/reference-model-project-rmp/
3. ^https://www.globalco2initiative.org/research/techno-economic-assessment-and-life-cycle-assessment-toolkit/
References
Babarit, A., Bull, D., Dykes, K., Malins, R., Nielsen, K., Costello, R., et al. (2017). Stakeholder requirements for commercially successful wave energy converter farms. Renew. Energ. 113, 742–755. doi: 10.1016/j.renene.2017.06.040
Buchner, G. A., Stepputat, K. J., Zimmermann, A. W., and Schomacker, R. (2019). Specifying technology readiness levels for the chemical industry. Ind. Eng. Chem. Res. 58, 6957–6969. doi: 10.1021/acs.iecr.8b05693
Bull, D., Costello, R., Babarit, A., Nielsen, K., Kennedy, B., Bittencourt, C., et al. (2017). “Scoring the technology performance level assessment,” in Paper Presented at the 12th European Wave and Tidal Energy Conference. Cork.
Bull, D. L., Babarit, A., Weber, J., Costello, R., Malins, R. J., Dykes, K., et al. (2016). Systems Engineering Applied to the Development of a Wave Energy Farm. Albuquerque, NM: Sandia National Laboratories. Report no. SAND2016-7950C. Available online at: https://www.osti.gov/biblio/1377733-systems-engineering-applied-development-wave-energy-farm (accessed November 20, 2021).
Caskie, A. (2020). Technical, Policy and Stakeholder Analysis of Direct Air Capture. (Master's thesis). Delft University of Technology, Delft, Netherlands.
Chaudhry, R., Fischlein, M., Larson, J., Hall, D. M., Peterson, T. R., Wilson, E. J., et al. (2013). Policy stakeholders' perceptions of carbon capture and storage: a comparison of four U.S. states. J. Clean. Prod. 52, 21–32. doi: 10.1016/j.jclepro.2013.02.002
Cremonese, L., Olfe-Kräutlein, B., Strunge, T., Naims, H., Zimmermann, A., Langhorst, T., et al. (2020). Making sense of techno-economic assessment and life cycle assessment studies for CO2 utilization: a guide on how to commission, understand, and derive decisions from TEA and LCA studies. Institute for Advanced Sustainability Studies Potsdam. doi: 10.3998/2027.42/156039
Dowlatshahi, S. (1992). Product design in a concurrent engineering environment: an optimization approach. Int. J. Prod. Res. 30, 1803–1818. doi: 10.1080/00207549208948123
ESB Ocean Energy (2011). Appendix 2 Technology Readiness Levels for Supply Chain Study for WestWave. Dublin: ESB Ocean Energy. Report no. ESBIoe-WAV-11-027. Available online at: https://www.seai.ie/publications/ESB-Technology-Readiness-Levels-for-Supply-Chain-Study-for-WestWave-.pdf (accessed November 20, 2021).
European Commission (2014). G. Technology Readiness Levels (TRL). Available online at: https://ec.europa.eu/research/participants/data/ref/h2020/wp/2014_2015/annexes/h2020-wp1415-annex-g-trl_en.pdf (accessed April 4, 2020).
Faber, G., Mangin, C., and Sick, V. (2021). Life cycle and techno-economic assessment templates for emerging carbon management technologies. Front. Sustain. 2, 764057. doi: 10.3389/frsus.2021.764057
Fitzgerald, J., and Bolund, B. (2012). “Technology readiness for wave energy projects; ESB and Vattenfall classification system,” in Paper Presented at the 4th International Conference on Ocean Energy, Dublin, Ireland, October 17, 2012. Available online at: https://www.icoe-conference.com/library/conference/icoe-2012/# (accessed November 20, 2021).
Global CO2 Initiative (2016). Global Roadmap for Implementing CO2 Utilization. Global CO2 Initiative. Available online at: https://hdl.handle.net/2027.42/150624 (accessed November 20, 2021).
Institute of Electrical and Electronics Engineers (IEEE) (1998). IEE Guide for Developing System Requirements Specifications. IEEE 1233:1998. Available online at: https://standards.ieee.org/standard/1233-1998.html (accessed November 4, 2021).
International Organization for Standardization (ISO) (2006a). Environmental Management—Life Cycle Assessment—Principle and Framework. ISO 14040:2006. Available online at: https://www.iso.org/obp/ui/#iso:std:iso:14040:en (accessed October 29, 2021).
International Organization for Standardization (ISO) (2006b). Environmental Management—Life Cycle Assessment—Requirements and Guidelines. ISO 14044:2006. Available online at: https://www.iso.org/obp/ui/#iso:std:iso:14044:ed-1:v1:en (accessed October 29, 2021).
International Organization for Standardization (ISO) (2015). Systems and Software Engineering – System Life Cycle Processes. ISO 15288:2015. Available online at: https://www.iso.org/standard/63711.html (accessed November 4, 2021).
Johnsson, F., Reiner, D., Itaoka, K., and Herzog, H. (2008). Stakeholder attitudes on carbon capture and storage—an international comparison. Energy Proc. 1, 4819–4826. doi: 10.1016/j.egypro.2009.02.309
Magagna, D., Marghetini, L., Alessi, A., Bannon, E., De Castro Boelman, E., Bould, D., et al. (2018). Workshop on Identification of Future Emerging Technologies in the Ocean Energy Sector-−27th March 2018, Ispra, Italy. Luxembourg: Publications Office of the European Union. Report no. JRC112635.
McCord, S., Zaragoza, A. V., Styring, P., Cremonese, L., Wang, Y., Langhorst, T., et al. (2021). Multi-Attributional Decision Making in LCA and TEA for CCU: An Introduction to Approaches and a Worked Example. Ann Arbor, MI: Global CO2 Initiative. doi: 10.7302/805.
Mendoza, N., Mathai, T., Forbush, D., Boren, B., Weber, J., Roberts, J., et al. (2021). “Developing technology performance level assessments for early-stage wave energy converter technologies: preprint.” in Paper Presented at the 14th European Wave and Tidal Energy Conference, Plymouth, United Kingdom, September 5–9, 2021. Available online at: https://www.osti.gov/biblio/1825239-developing-technology-performance-level-assessments-early-stage-wave-energy-converter-technologies-preprint (accessed November 20, 2021).
Moni, S. M., Mahmud, R., High, K., and Carbajales-Dale, M. (2020). Life cycle assessment of emerging technologies: a review. J. Ind. Ecol. 24, 52–63. doi: 10.1111/jiec.12965
Nielsen, K. (2010). Development of Recommended Practices for Testing and Evaluating Ocean Energy Systems, OES-IA Annex II Extension Summary Report. Ramboll. Report no. T02-0.0. Available online at: https://www.waveandtidalknowledgenetwork.com/documents/14492/ (accessed November 20, 2021).
Ocean Energy Systems (2021)., n.d. An International Evaluation and Guidance Framework for Ocean Energy Technology. Available online at: https://www.ocean-energy-systems.org/publications/oes-documents/guidelines/document/an-international-evaluation-and-guidance-framework-for-ocean-energy-technology/ (accessed November 20, 2021).
Olechowski, A. L., Eppinger, S. D., Joglekar, N., and Tomaschek, K. (2020). Technology readiness levels: shortcomings and improvement opportunities. J. Int. Council Syst. Eng. 23, 395–408. doi: 10.1002/sys.21533
Sick, V. (2021). Spiers memorial lecture: CO2 utilization: why, why now, and how? Faraday Discuss. 230, 9–29. doi: 10.1039/D1FD00029B
Thomassen, G., Van Dael, M., Van Passel, S., and You, F. (2019). How to assess the potential of emerging green technologies? Towards a prospective environmental and techno-economic assessment framework. J. Green Chem. 21, 4868–4886. doi: 10.1039/C9GC02223F
Trueworthy, A., Roach, A., Maurer, B., and DuPont, B. (2021). “Supporting the transition from grid-scale to emerging market wave energy converter design and assessment,” in European Wave and Tidal Energy Conference 2021. Plymouth.
US Department of Energy (DOE) (2011). DOE G 413.3-4A, Technology Readiness Assessment Guide. Washington, DC: U.S. Department of Energy. Available online at: https://www.directives.doe.gov/directives-documents/400-series/0413.3-EGuide-04a (accessed November 20, 2021).
Weber, J. (2012). “WEC technology readiness and performance matrix—finding the best research technology development trajectory,” in Paper Presented at the 4th International Conference on Ocean Energy, Dublin, Ireland, October 17, 2012. Available online at: https://www.researchgate.net/publication/233810908_WEC_Technology_Readiness_and_Performance_Matrix_-_finding_the_best_research_technology_development_trajectory (accessed November 20, 2021).
Weber, J., Laird, D., Costello, R., Roberts, J., Bull, D., Babarit, A., et al. (2017). “Cost, time, and risk assessment of different wave energy converter technology development trajectories,” in Paper Presented at the 12th European Wave and Tidal Energy Conference, Cork, Ireland, August 27–September 1, 2017. Available online at: https://www.researchgate.net/publication/326986133_Cost_time_and_risk_assessment_of_different_wave_energy_converter_technology_development_trajectories (accessed November 20, 2021).
Wunderlich, J., Armstrong, K., Buchner, G. A., Styring, P., and Schomäcker, R. (2021). Integration of techno-economic and life cycle assessment: defining and applying integration types for chemical technology development. J. Clean. Prod. 287, 125021. doi: 10.1016/j.jclepro.2020.125021
Keywords: integrated assessment (IA), technology performance level (TPL), technology assessment framework (TAF), combined indicator, technology development trajectory, life cycle assessment (LCA), techno-economic analysis (TEA), carbon capture utilization and storage (CCUS)
Citation: Mendoza N, Mathai T, Boren B, Roberts J, Niffenegger J, Sick V, Zimmermann AW, Weber J and Schaidle J (2022) Adapting the Technology Performance Level Integrated Assessment Framework to Low-TRL Technologies Within the Carbon Capture, Utilization, and Storage Industry, Part I. Front. Clim. 4:818786. doi: 10.3389/fclim.2022.818786
Received: 20 November 2021; Accepted: 04 February 2022;
Published: 18 March 2022.
Edited by:
Ben W. Kolosz, University of Pennsylvania, United StatesReviewed by:
Steven Van Passel, University of Antwerp, BelgiumUdayan Singh, Northwestern University, United States
Copyright © 2022 Mendoza, Mathai, Boren, Roberts, Niffenegger, Sick, Zimmermann, Weber and Schaidle. This is an open-access article distributed under the terms of the Creative Commons Attribution License (CC BY). The use, distribution or reproduction in other forums is permitted, provided the original author(s) and the copyright owner(s) are credited and that the original publication in this journal is cited, in accordance with accepted academic practice. No use, distribution or reproduction is permitted which does not comply with these terms.
*Correspondence: Nicole Mendoza, bmljb2xlLm1lbmRvemFAbnJlbC5nb3Y=