 Joseph V. McGovern
 Stephen Nash
 Michael Hartnett
- 1Oceanographic Services, Ocean Science and Information Services, Marine Institute, Galway, Ireland
- 2Department of Civil Engineering, National University of Ireland Galway, Galway, Ireland
- 3Ryan Institute for Environmental, Marine and Energy Research, National University of Ireland Galway, Galway, Ireland
- 4MaREI Centre for Marine and Renewable Energy Ireland, National University of Ireland Galway, Galway, Ireland
Riverine nutrient loading from agriculture is one of the most prominent pressures in the second cycle of river basin management planning for the European Union (EU) Water Framework Directive (WFD). Better farmyard nutrient management planning is the measure most likely to reduce agricultural nutrient loading to catchment watercourses and coastal receiving waters. The adjoining Argideen Estuary and Courtmacsherry Bay in the south west of Ireland drain a 150 km2 catchment comprising mainly agricultural land. The receiving waters were allocated Poor ecological status under the WFD at the most recent appraisal. Sub-hourly water quality monitoring in the Timoleague River has been carried out by the Teagasc Agricultural Catchments Program to track the changes in nutrient loading to the Argideen Estuary in response to improved farming practice. A bio-physical model of the adjoining Argideen Estuary and Courtmacsherry Bay was calibrated subject to the prevailing climatic and nutrient loading regime. Six nutrient load scenarios were simulated to determine their impact upon macroalgae and phytoplankton bloom magnitude. In addition, nutrient flow-load relationships were derived for summers 2010 and 2016 to elucidate the improvements induced by better catchment management practice. Flow-load relationships for dissolved inorganic nitrogen (DIN) and dissolved inorganic phosphorus (DIP) for each year were applied to the flow data for the other year, to query the outcome if (1) there had been no change in farm management practice between 2010 and 2016, or (2) the improved farm management practice in place by 2016 had been implemented by 2010. The difference between expediting and delaying improvement in farm nutrient management practice was a 5% increase in DIN loading and a 233% increase in DIP load. Application of this higher estimated load to the calibrated bio-physical model projected an increase in 2016 Ulva bloom magnitude from 381t to 1,391t. Although phosphorus retention within the catchment has improved in recent years, with an attendant improvement in Ulva bloom magnitudes, flow connectivity in the catchment still facilitates a higher phosphorus transfer during large rainfall events. A high amount of phosphorus is stored within the catchment, while point source pressures continue to contribute to phosphorus transfer to streams during periods of low flow.
Introduction
Opportunistic macroalgae blooms are a common indicator and response to nutrient enrichment, with effects including displacement of primary producers, increased frequency of eutrophication induced hypoxia and uncoupling of interactions between sediment and the water column (Valiela et al., 2003). In the presence of excessive nitrogen, blooms of macroalgae and phytoplankton can outcompete the very seagrasses that reflect Good ecological status (Nelson and Lee, 2001; Burkholder et al., 2007), due to differing compensation irradiance and rates of nitrogen uptake, growth and grazing (Duarte, 1995). A single macroalgae bloom event increases the likelihood of recurrence of bloom at a later time (Zhang et al., 2010). Varying tolerances to salinity extrema and nitrogen availability differentiate between green macroalgae of the genus Ectocarpus and Ulva (Fong et al., 1996). Ulva and the related species Ulvaria thrive in their respective intertidal and subtidal habitats due to differing tolerance to nitrogen, light availability and grazers (Nelson et al., 2008). Allelopathy, defined as the release of inhibitory or toxic compounds, is both an effect of Ulva upon other species of macroalgae (Van Alstyne et al., 2015) and oyster larvae (Green-Gavrielidis et al., 2018), and a mechanism for Ulva to outcompete Gracilaria (Gao et al., 2014). Ulva spp. also has a higher photosynthetic efficiency than other macroalgae species such as Gracilaria and Hypnea due to a higher ratio of surface area to volume reflected in its sheet-like structure (Whitehouse and Lapointe, 2015). Ulva species have a greater capability than other species to physiologically capitalize on the combination of higher temperatures, CO2 enrichment and increased nitrogen loads anticipated due to climate change and ocean acidification (Parages et al., 2014; Chen et al., 2015). However, the higher growth rate of Ulva induces nitrogen limitation under exposure to higher CO2 concentrations, which may lead to increasing competition from Gracilaria (Young and Gobler, 2017).
Across the European Union, diffuse and point source pressures account for 38 and 18% respectively of the significant pressures in the second WFD River Basin Management Plan cycle (European Environment Agency, 2018), with agriculture and urban wastewater accounting for the majority of each respective pressure. In the period from 2000 to 2013, Irish efforts to reduce nutrient transfer from catchments to estuarine and coastal waters in response to European environmental directives has yielded greater reductions in phosphorus than nitrogen (Ni Longphuirt et al., 2016), which may lead to greater transfer of nitrogen to the coastal zone. Intensification of dairy farming in response to removal of milk quotas may have a moderately deleterious effect on trophic status with increases of up to 20% in trophic status parameters (O’Boyle et al., 2017). The most recent analysis of nutrient loading to Irish surface waters reported that 82,000 tones of nitrogen and 2,700 tones of phosphorus is discharged per annum (Mockler et al., 2017). While nitrogen loading nationally is predominantly attributed to agriculture, phosphorus sources are more evenly distributed across the spectrum of land uses; the consequences of phosphorus discharge to watercourses are influenced by the presence or absence of hydrogeological attenuation. The strength of these attenuation processes, measured by hydrological and biogeochemical time lags may obscure the impact of measures implemented to improve water quality, with the delay between implementation of measures and confident detection of change ranging from 4 to 20 years (Melland et al., 2018). Interannual climate oscillations between wet and dry weather patterns may also offset or magnify improvements in water quality in response to better catchment management practice (Dupas et al., 2018).
The current Irish River Basin Management Plan (DHPLG, 2018) sets out to improve water quality through improving agricultural sustainability, recruitment of implementation teams to liaise with stakeholders, improvement in urban and domestic wastewater treatment efficiency and regulation of forestry and peat extraction; of the surface waterbodies identified as being at risk of not meeting their environmental objective, 53% are at risk due to agriculture.
In a selection of Irish estuarine waters, Ulva rigida was found to be the most dominant species (Wan et al., 2017); of the eight waterbodies classified using the WFD opportunistic macroalgal blooming tool (Wells et al., 2009), Courtmacsherry Bay and a neighboring bay were the only two waterbodies assessed as having Poor ecological status. Courtmacsherry Bay was also allocated Poor status in the most recent national assessment of water quality (Fanning et al., 2017). Agriculture is the predominant land use in Courtmacsherry Bay and the adjoining Argideen Estuary. In recent years, the Argideen Estuary has been blighted by the annual blooming of the opportunistic macroalgae Ulva rigida, with a total wet weight of up to 2,164 tones, corresponding to a mean density of 1,680 g m-2 (Wan et al., 2017).
The advent of integrated catchment management in Ireland (Daly et al., 2016) requires overall nutrient load reduction targets for estuarine and coastal waters, as a starting point for identification of appropriate targeted measures at catchment level. Refinement of programs of measures is also necessary to target persistent nuisance opportunistic macroalgae. Biophysical box models such as the Dynamic Combined Phytoplankton and Macroalgae model (DCPM) (Aldridge et al., 2010) facilitate the identification of nutrient load targets, not least due to their numerical simplicity; short runtimes of the order of minutes for a year-long simulation are a significant benefit, compared to coupled 2D or 3D hydrodynamic, solute transport and water quality models. Reliable high-resolution nutrient loading data and river discharge data is a cornerstone of scenario modeling for identification of nutrient load targets. Monitoring data at hourly resolution has been made available for this study by the Irish Agricultural Catchments Program (ACP) (Shortle and Jordan, 2017) which is operated by Teagasc and funded by the Irish Department of Agriculture, Food and the Marine. Activities of the ACP focus on six catchments throughout Ireland, covering a variety of soil types and agricultural activities. One of the six catchments is the Timoleague, which drains to the Argideen Estuary. The ACP has provided daily rainfall measurements, hourly streamflow measurements and concentrations of dissolved inorganic nitrogen (DIN), total nitrogen, dissolved inorganic phosphorus (DIP) and total phosphorus. In an Irish context, the data has provided a rare opportunity to explore the impact of the timing and magnitude of riverine nutrient loading to an estuary which has been allocated Poor ecological status in recent assessments, mainly attributed to the abundance of intertidal macroalgae.
Previous work by others in an Irish context has sought to quantify the reduction in nitrogen and phosphorus loading to eighteen estuaries over a 20-year period, and the influence of these reductions upon estuarine water quality (Ni Longphuirt et al., 2016). Individual case studies on the Blackwater and Argideen estuaries have set out to determine the influence of hydrological regime (Ni Longphuirt et al., 2015b) and long-term declining in nutrient loading (Ni Longphuirt et al., 2015a) on estuarine water quality. Projected intensification of the dairy sector has also been subject to a modelling study (O’Boyle et al., 2017). However, to the authors’ knowledge, no studies have sought to quantify the outcome if there had been no improvement in nutrient management at farm scale. A sustained reduction in estuarine nutrient loads may be expected leading from measures directed with reducing diffuse pollution from agriculture. However, the fine balance in estuarine trophic cycles must be carefully considered when setting out nutrient reduction targets. Excessive changes to nutrient loads may lead to pollutant swapping resulting in under-assimilated nutrients being transferred to neighboring bays, while neighboring bays may be limited by different physical or biological factors irrespective of proximity (O’Boyle et al., 2015).
This study aims to identify the limiting factor for phytoplankton and macroalgae growth in the Argideen Estuary and Courtmacsherry Bay. A collection of scenarios will be appraised considering the identified limiting factor, to quantify the likely impact of nutrient load reductions upon opportunistic blooms. The European Union (Good Agricultural Practice for the Protection of Waters) Regulations, also known as the ‘GAP Regulations’ or the ‘Nitrates Regulations,’ were introduced to the Irish Statute books in 2006 (DOEHLG, 2006) to give effect to the European Union’s Nitrates Directive (European Commission, 1991). Under the GAP Regulations, the Nitrates Action Program (NAP) was introduced to set restrictions on certain aspects of farm practice in order to improve water quality. The NAP has been reviewed and updated in the intervening years (DOEHLG, 2009, 2010, 2014). The final aim of this research is to assess whether an improvement in water quality in the Argideen Estuary and Courtmacsherry has been induced by changes in nutrient management practice in agriculture, endorsed under successive NAPs.
Materials and Methods
Model
The Dynamic Combined Phytoplankton and Macroalgae (DCPM) model (Aldridge et al., 2013) is a biophysical box model, which describes the growth of phytoplankton and macroalgae in response to available light and system inputs of inorganic nitrogen and phosphorus. Chlorophyll a concentrations are modeled as a proxy for phytoplankton concentrations. The model solves a generic expression (Equation 1) (Aldridge et al., 2010) for the rate of change of solute (salinity, nitrogen, phosphorus, and chlorophyll a) and macroalgae, utilizing an adaptive, 4th order Runge-Kutta solution scheme with a daily timestep.
Here, Yi is the concentration of solute in box i, Φij represents tidal exchange between box i and downstream box j (Equation 2) (Aldridge et al., 2010), βY is the biological source-sink term (Equations 3 and 4) (Aldridge et al., 2010), ΓY is the solute loading term, E is the tidal exchange rate (d-1), YE and YF are the tidally exchanged downstream concentration and freshwater concentration of solute Y.
Gm refers to the net growth rate, Lm is the net biological loss rate, Xm is the net biomass concentration or weight, m refers to the algae type – chlorophyll a or macroalgae. emnt is a grazing coefficient which reflects the recycling of decayed autotrophs into nutrients. The term q is the yield of phytoplankton or macroalgae per unit of each nutrient nt; thus the term qmnt joins Equation 3 and Equation 4 and therefore relates the abundance of primary producers to nutrient concentrations. The growth rate Gm is determined as a product of the maximum daily growth rate Gmax (d-1) and the minimum of three Monod-type expressions describing nitrogen, phosphorus and light limitation.
The model is underpinned by a user-tailored pro-forma spreadsheet, with each additional row in the spreadsheet detailing the next adjacent waterbody upstream. Each row contains the following user-defined parameters: latitude (°N) and longitude (°E), waterbody mean surface area between mean high water and mean low water (km2), intertidal area (percent of mean area), spring tidal range (m), annual average river discharge (m3 s-1), annual total loads for inorganic DIN and DIP (kg yr-1), the ratios between summer and annual discharge RSA for freshwater, DIN and DIP, the winter and summer average offshore DIN and DIP concentrations (μM) and chlorophyll a concentrations (μg l-1), salinity on the adjacent shelf (psu), exchange rate E (d-1) and mean light attenuation Kd (m-1). Default parameters relating to phytoplankton and macroalgae physiology are iteratively modified as part of the model calibration process. Knowledge of bathymetry and waterbody surface area determines the waterbody volume; the bottom topography for each waterbody is defined in terms of the proportion of the waterbody area falling within twenty-two 1m wide depth bins between 10m above lowest astronomical tide (LAT) to 10 m below LAT. Water renewal throughout the system is represented by the exchange rate E (d-1) for each waterbody, which represents the fraction of the volume exchanged with the adjacent downstream waterbody per day. Riverine discharge and nutrient loading is defined as an annual average with a ratio of summer to annual loading RSA to describe variation throughout the year. Calibration of the model proceeds from the most coastal waterbody inward; calibration is initially completed for salinity, which is a proxy for mixing and dilution. Thereafter, modification of biological parameters is necessary to complete calibration. The model generates seasonal average concentrations of DIN (μM), DIP (μM), chlorophyll a (μg l-1) and salinity (psu), as well as the following macroalgae parameters for summer: macroalgae density (g dry weight m-2), over the entire waterbody area or intertidal area, and the total summer standing stock in tones (wet weight). Summer is defined as April to September inclusive, while winter is October to March inclusive. A full exposition of DCPM is beyond the scope of this publication; please refer to Aldridge et al. (2008, 2010, 2013) for further reading.
Study Site
Courtmacsherry Bay and the adjoining Argideen Estuary are situated in the southwest of Ireland. For the purposes of this research, the domain was divided into seven sub-sections of the Argideen Estuary/Courtmacsherry Bay system: Courtmacsherry Inner Bay, Courtmacsherry Bay North, the Lower Argideen Estuary, Flaxfort Strand, Courtmacsherry Intertidal Macroalgae, the Timoleague Receiving Waters and the Upper Argideen Estuary (Figure 1). Five rivers discharge to the Argideen Estuary-Courtmacsherry Bay system: (i) the East Cruary, (ii) the Timoleague, both of which enter the Timoleague Receiving Waters, (iii) the Argideen, (iv) the Flaxfort stream entering at Flaxfort Strand, and (v) the Kilbrittain entering at Courtmacsherry Bay North.
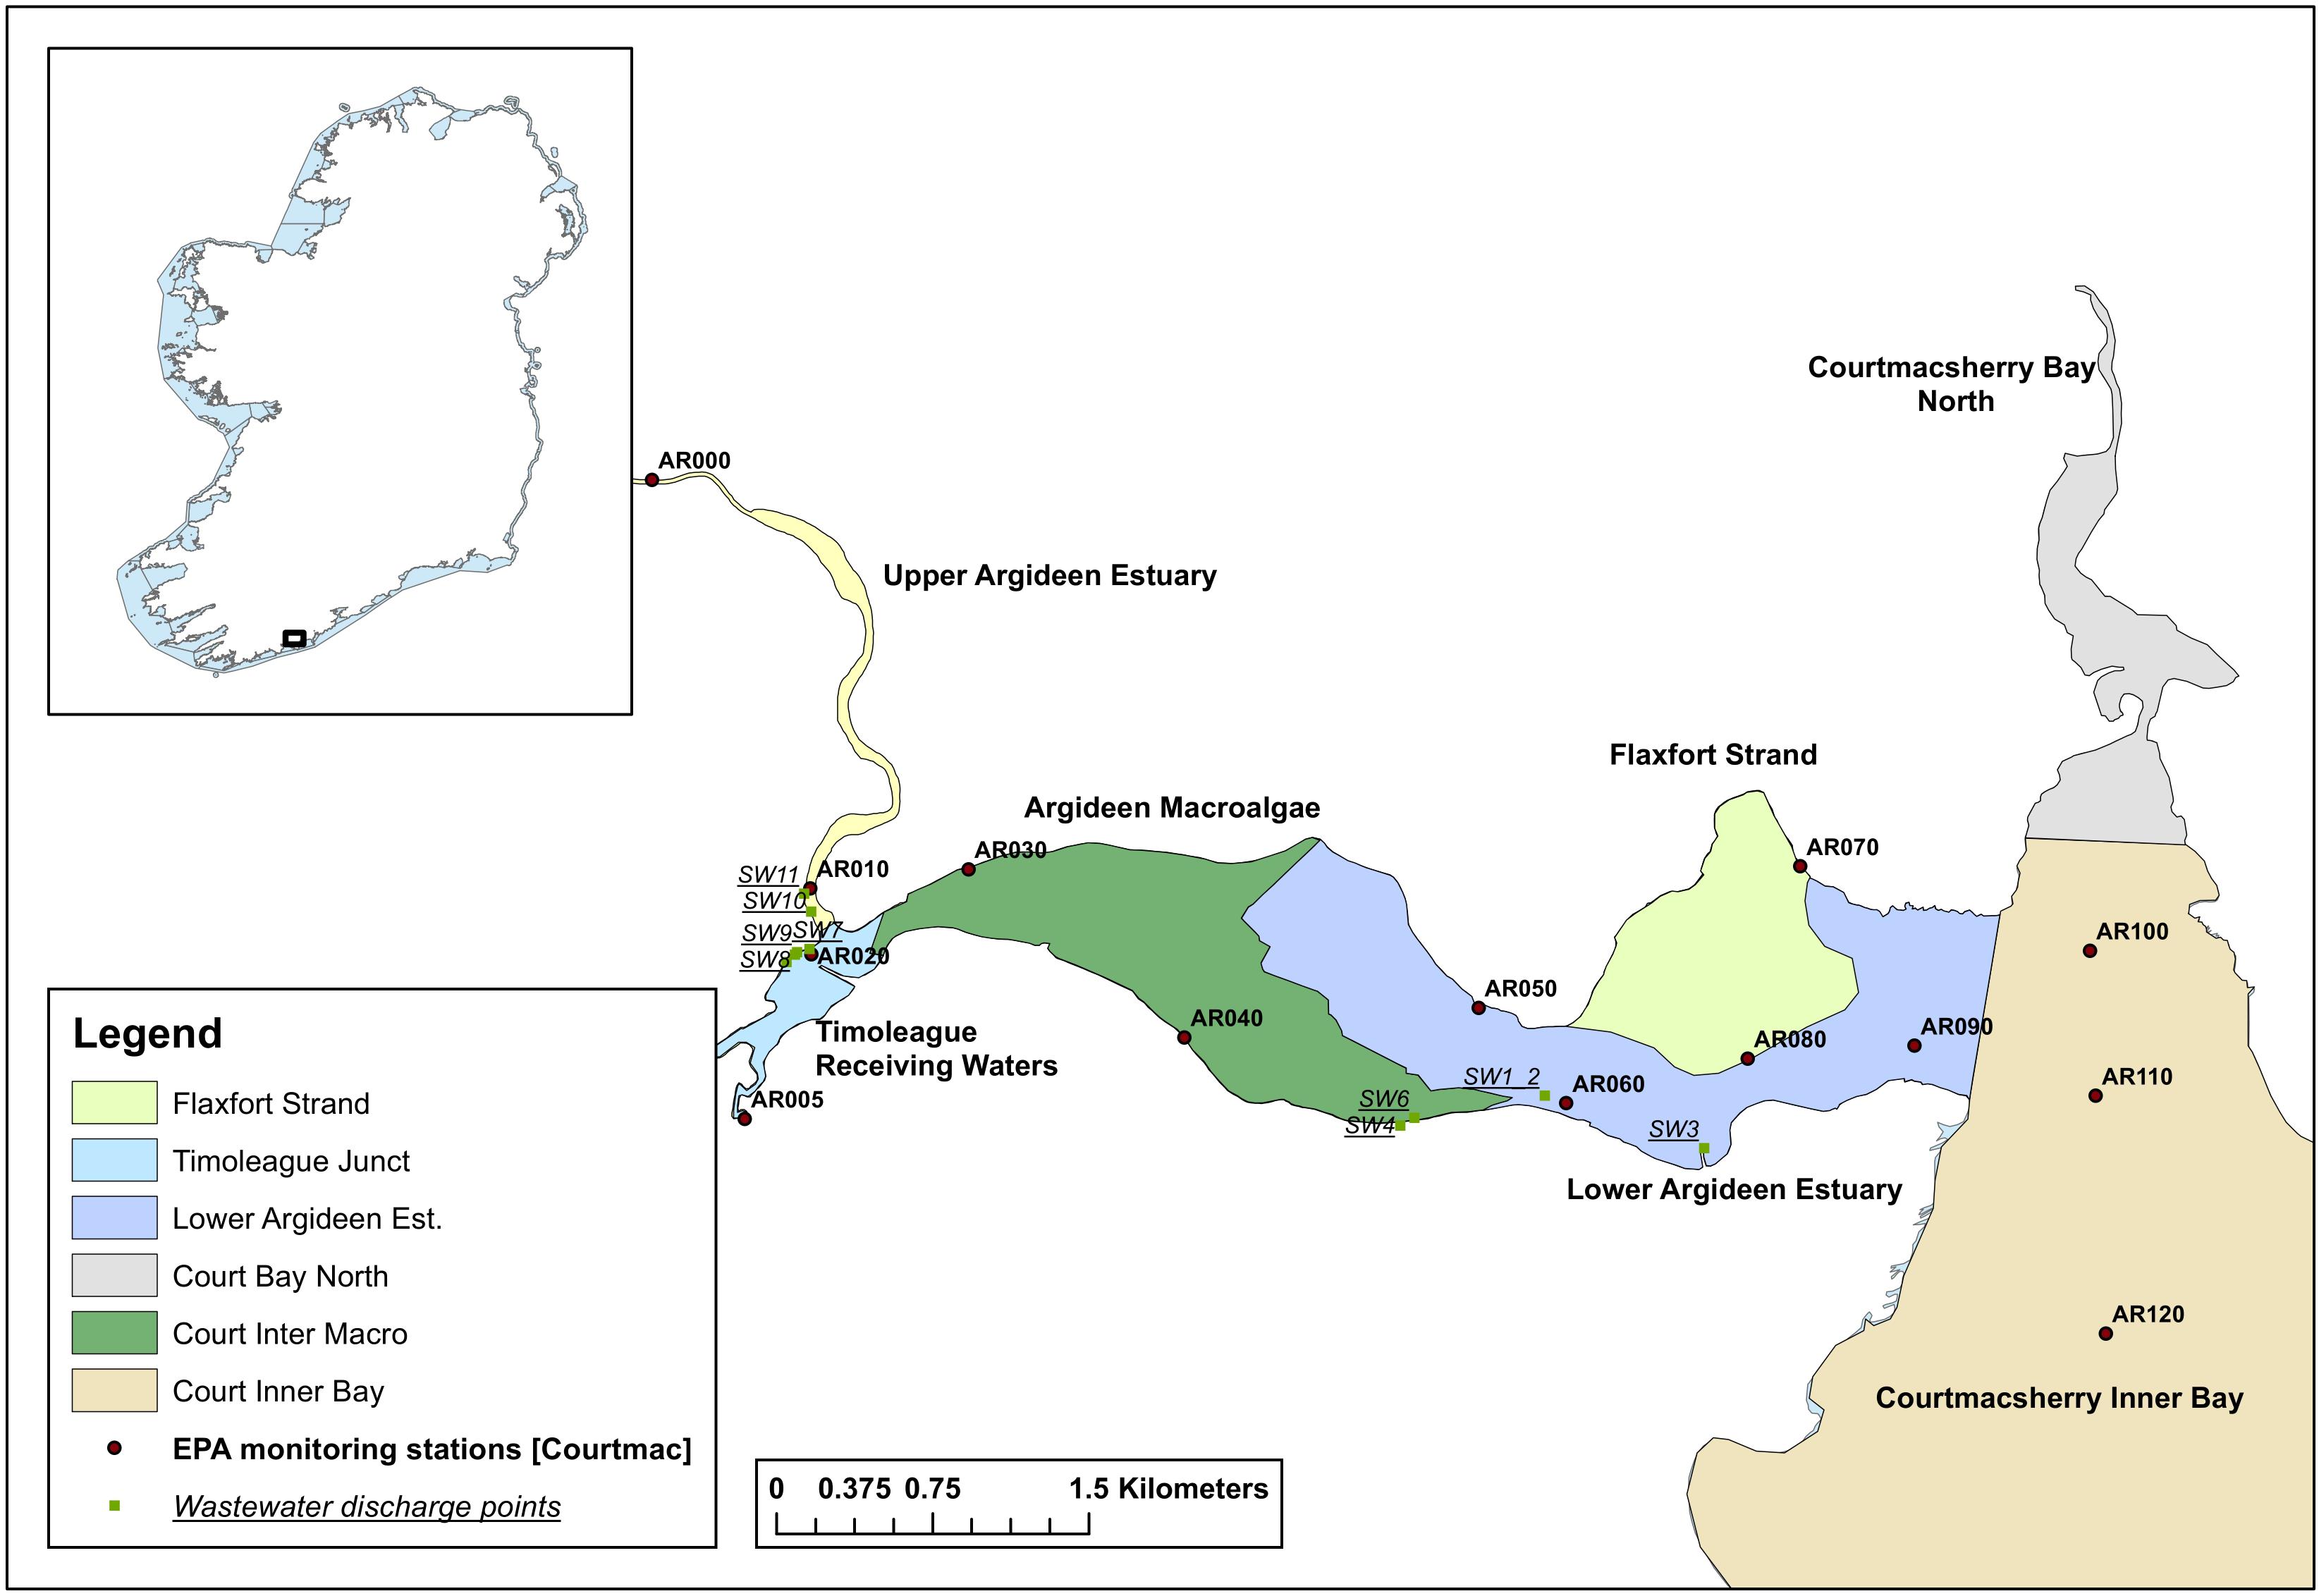
Figure 1. The seven boxes within the Courtmacsherry Bay – Argideen Estuary system spanning monitoring points AR000 to AR120.
Datasets
This research exclusively uses river discharge and nutrient load data provided by the Teagasc Agricultural Catchment Program (ACP) for the Timoleague River for the years 2010 and 2016. Years 2010 and 2016 have been selected primarily due to their hydrological similarity. Summer, winter and annual total and average rainfall for both years are all but identical (Table 1), while the highest daily rainfall in each year occurred in July (Figures 2A,B).

Table 1. Total and average rainfall, by season and per year, for 2010 and 2016.
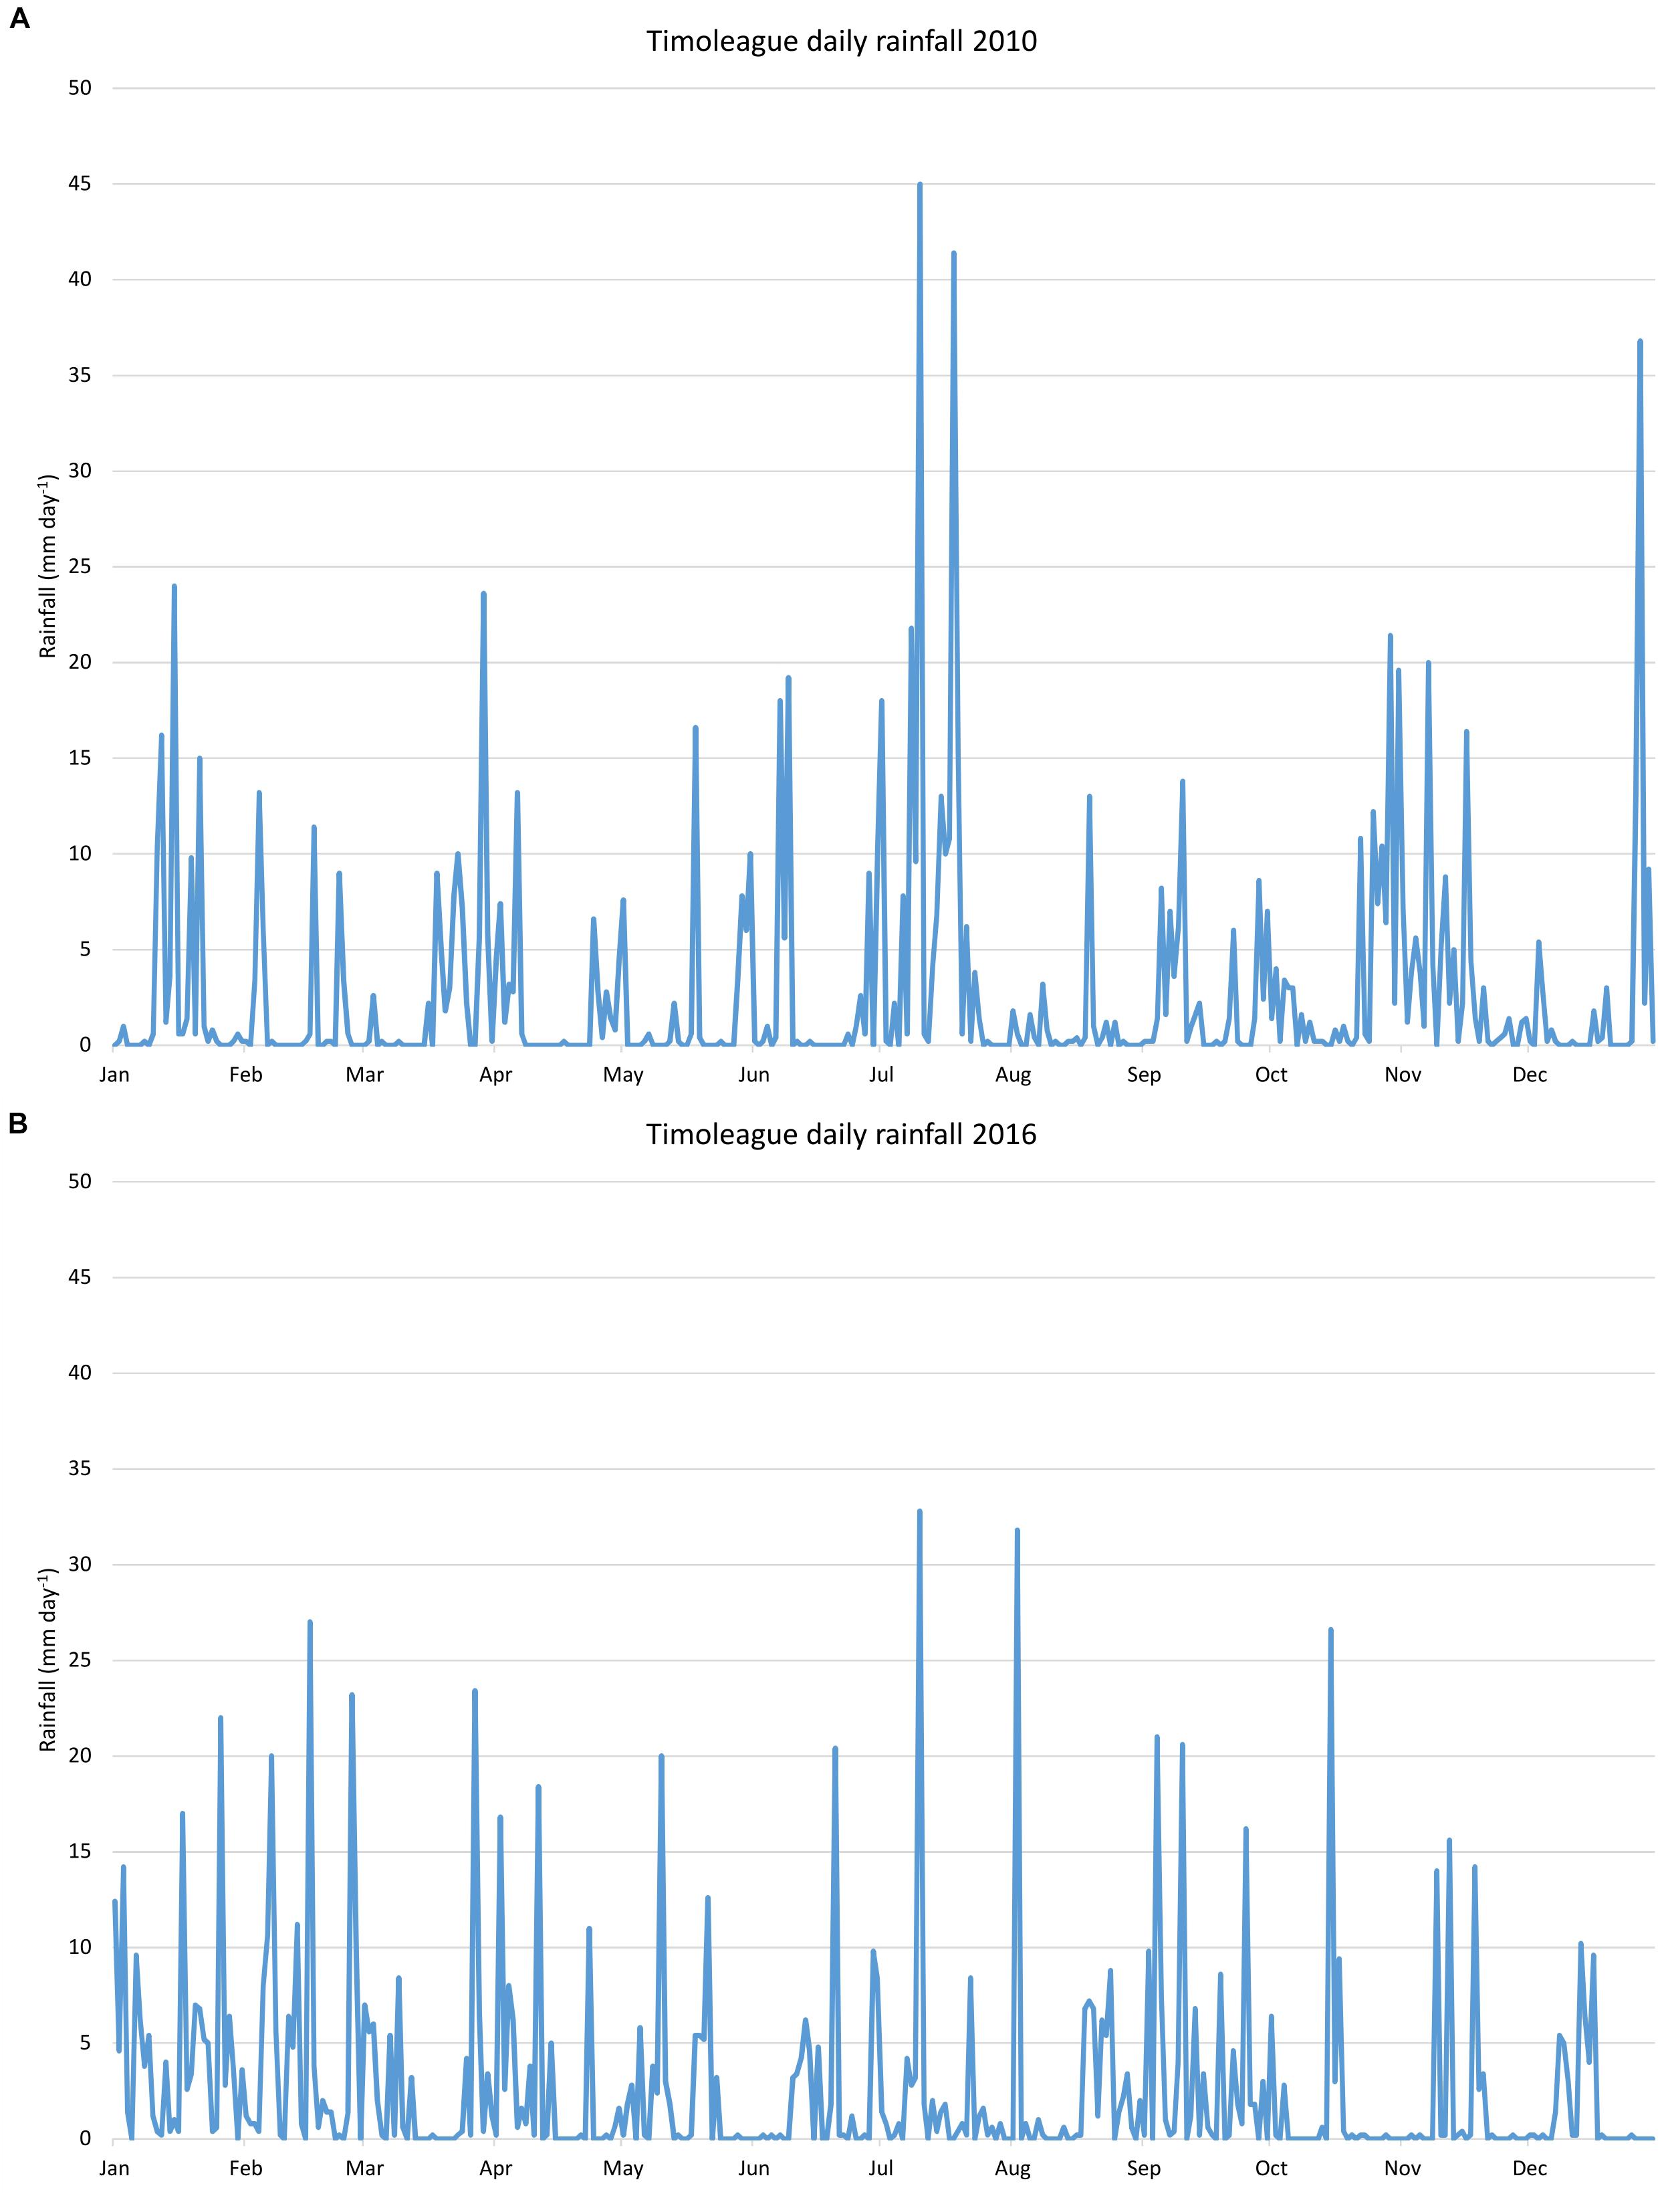
Figure 2. Daily total rainfall in the Timoleague catchment in (A) 2010 and (B) 2016.
Due to the similarity between the five river sub-catchments in terms of catchment slope, subsoil, groundwater connectivity and practices, freshwater discharges and their associated DIN and DIP loads for the Rivers Argideen (135 km2), East Cruary (9.7 km2), Flaxfort (5.4 km2) and Kilbrittain (23.2 km2) have been scaled up from area-normalized data derived from the ACP data for the Timoleague catchment (5.2 km2) (Figure 3).
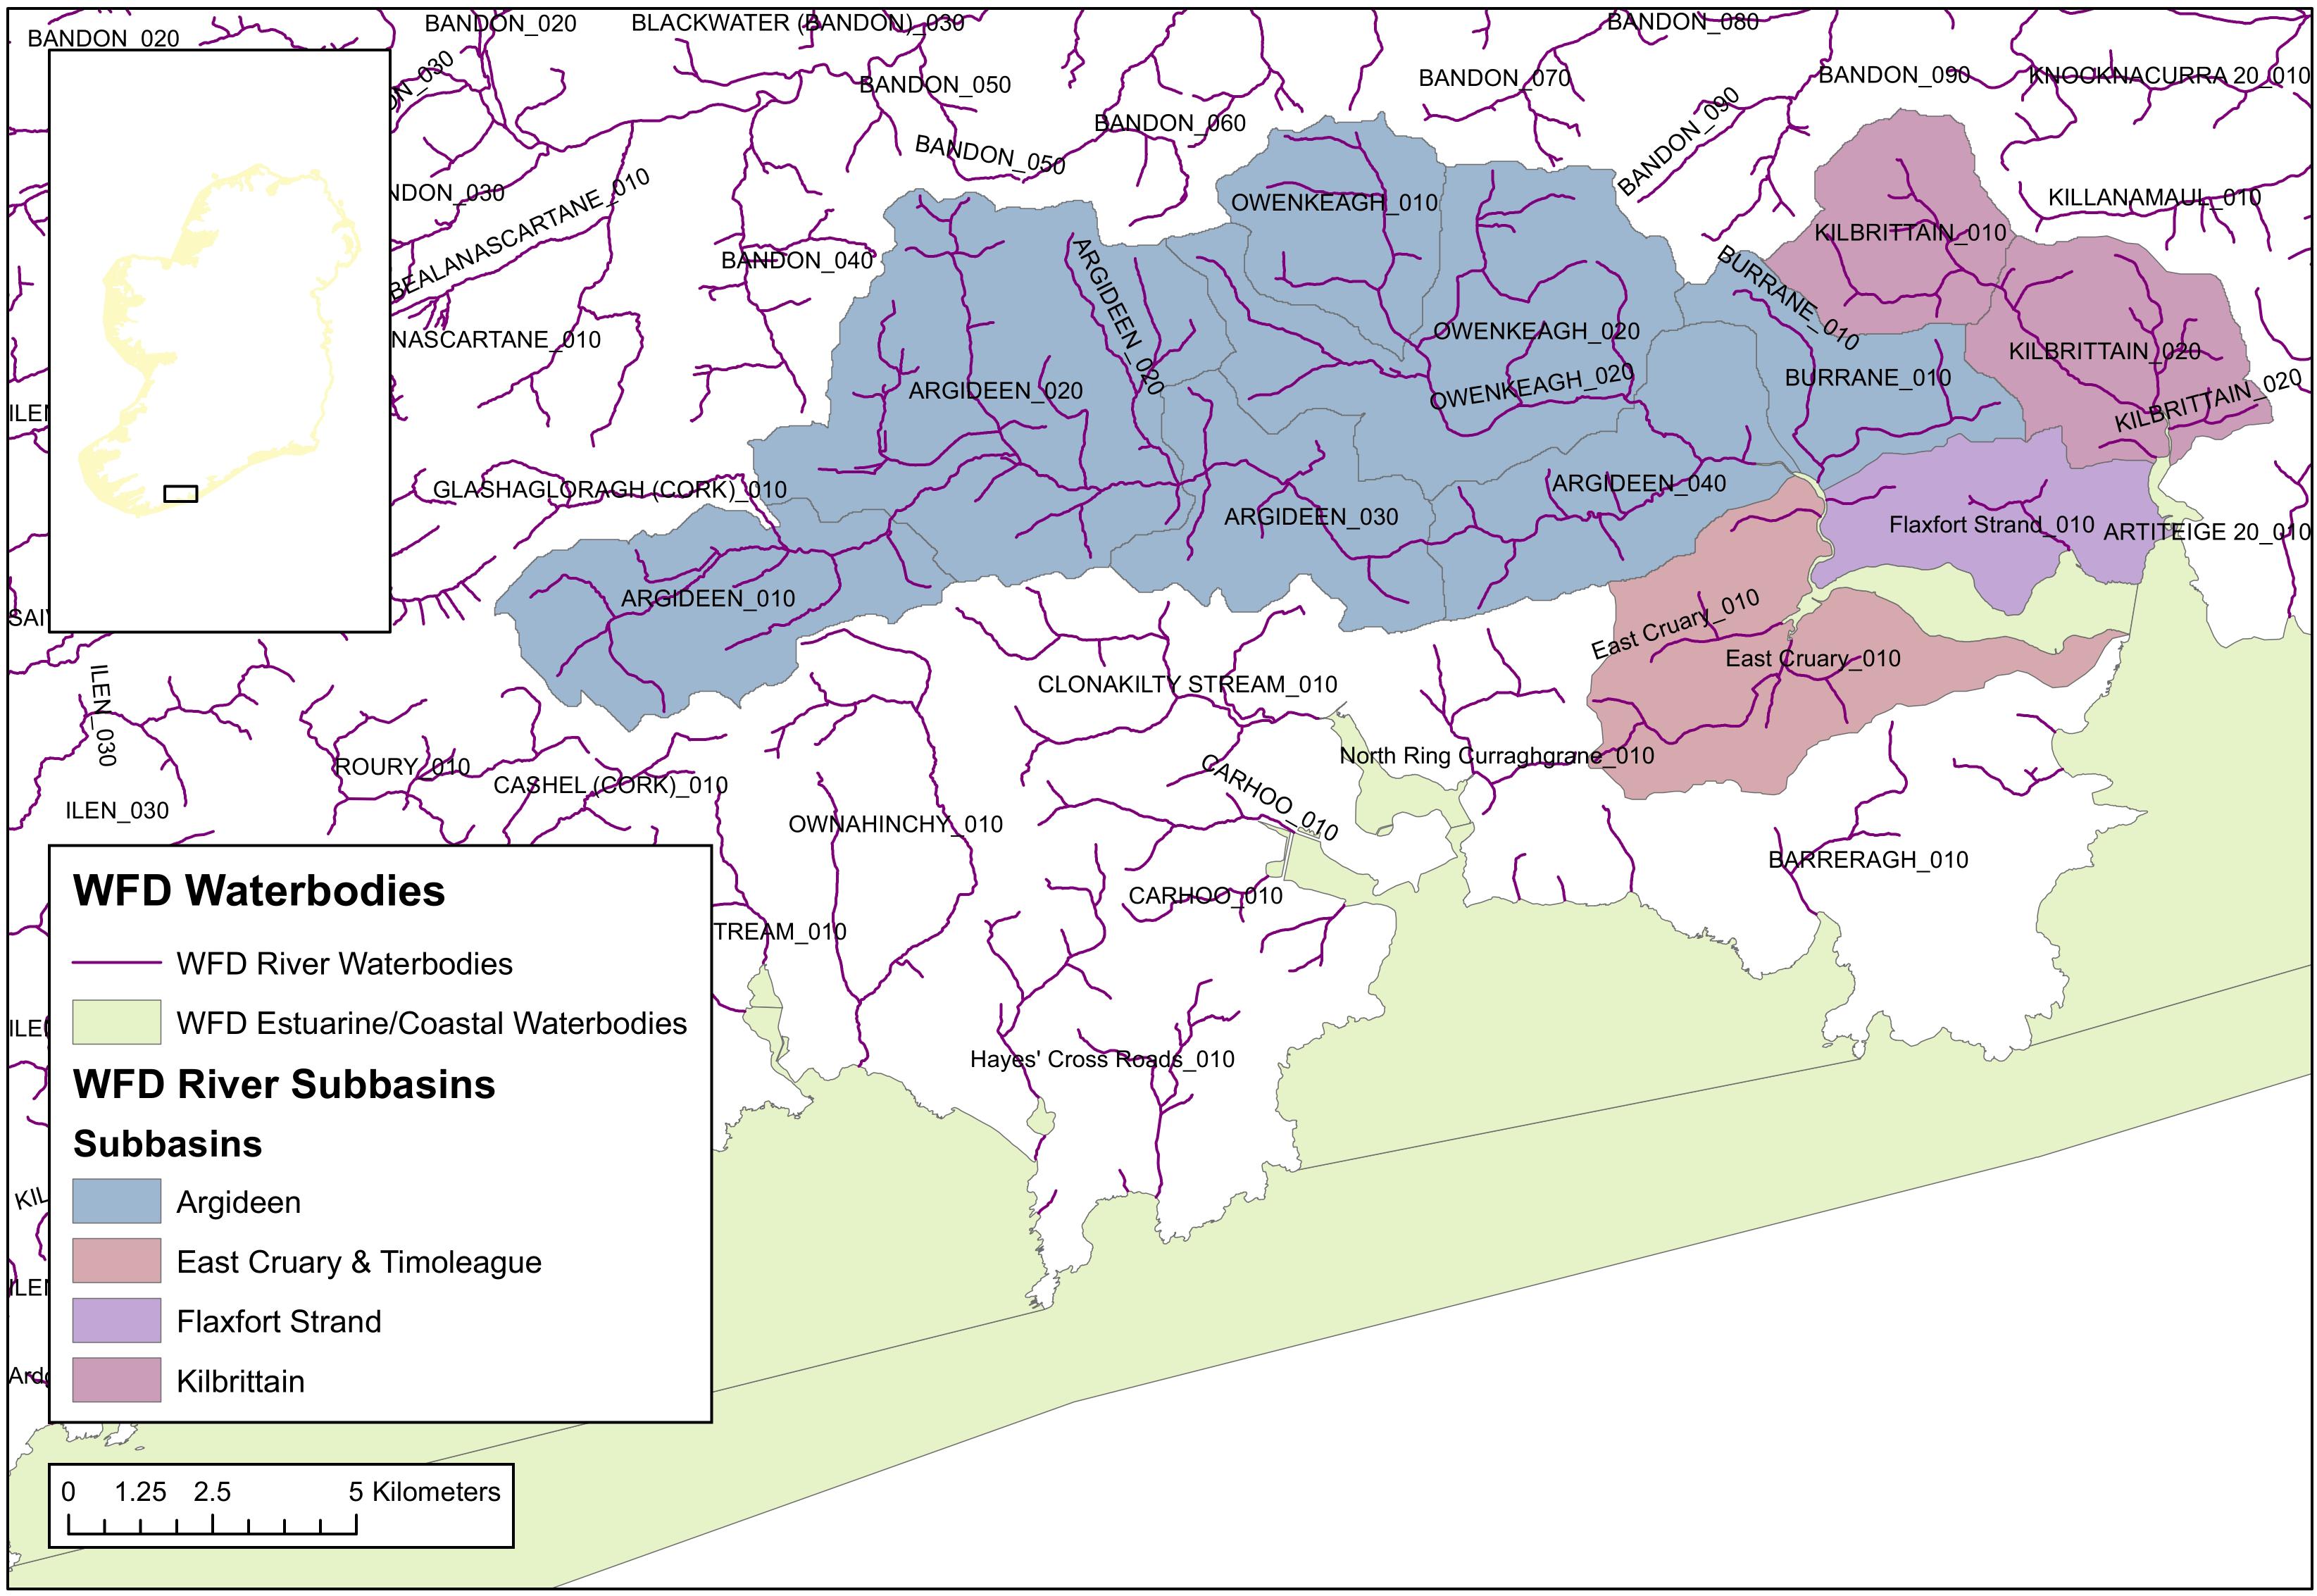
Figure 3. The subbasins which drain to the Argideen Estuary and Courtmacsherry Bay.
While the availability of hourly nutrient and flow data for the Timoleague Estuary may reduce the uncertainty relating to freshwater nutrient loadings, additional uncertainty may pertain to the extrapolation of the nutrient and flow data from the Timoleague catchment to the other four river systems that enter the Argideen Estuary/Courtmacsherry Bay system. However, the catchment descriptors amongst the five catchments are similar (Supplementary Table S1). In addition, the 2018 CORINE land-use maps indicate that pasture is the most common land-use in all river sub-catchments (Supplementary Figure S1). In addition to diffuse nutrient loading from upstream catchments, nutrient loading from point discharge of wastewater effluent was also included; information from the existing wastewater treatment at Courtmacsherry and conveyancing at Timoleague was collated to reflect the outgoing nutrient loads at both locations.
The Irish Environmental Protection Agency sample estuarine and coastal waters three times during summer and once during winter for salinity, DIN (nitrate, nitrite and ammonia), chlorophyll a, DIP, dissolved oxygen, silicate and Secchi depths. Water quality sampling is carried out on both the ebb and flood tide where possible. Macroalgae surveys are carried out once annually at a selection of waterbodies impacted by opportunistic blooms. In the context of the research discussed here, two patches are surveyed within the model domain, in the Argideen Estuary and at Flaxfort Strand.
The net summer phosphorus mass transfer to the system was greater in 2016 than 2010 (Table 2 and Figure 4). Likewise, the summer discharge Q50 from the Timoleague River was greater in 2016 than 2010 (Figure 4). The summer flow exceedance curves indicate that the entire duration of summer 2010 was dryer than an average year, or indeed the year 2016, but with higher flows at lower percentiles (Figure 4). Hence, higher than Q50 flows in 2016 delivered a sustained higher phosphorus transfer (Table 2).
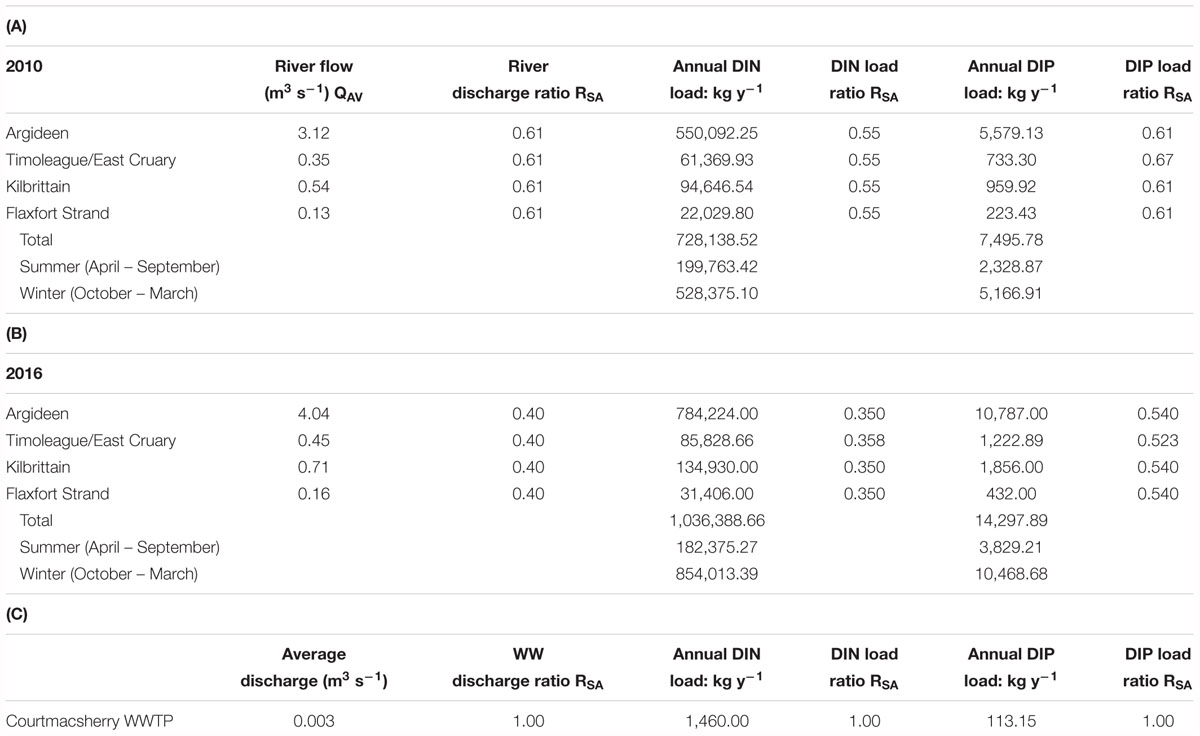
Table 2. River discharge and nutrient loading data for (A) 2010 and (B) 2016, and (C) effluent characteristics from the existing Courtmacsherry wastewater treatment which discharges to the lower Argideen Estuary.
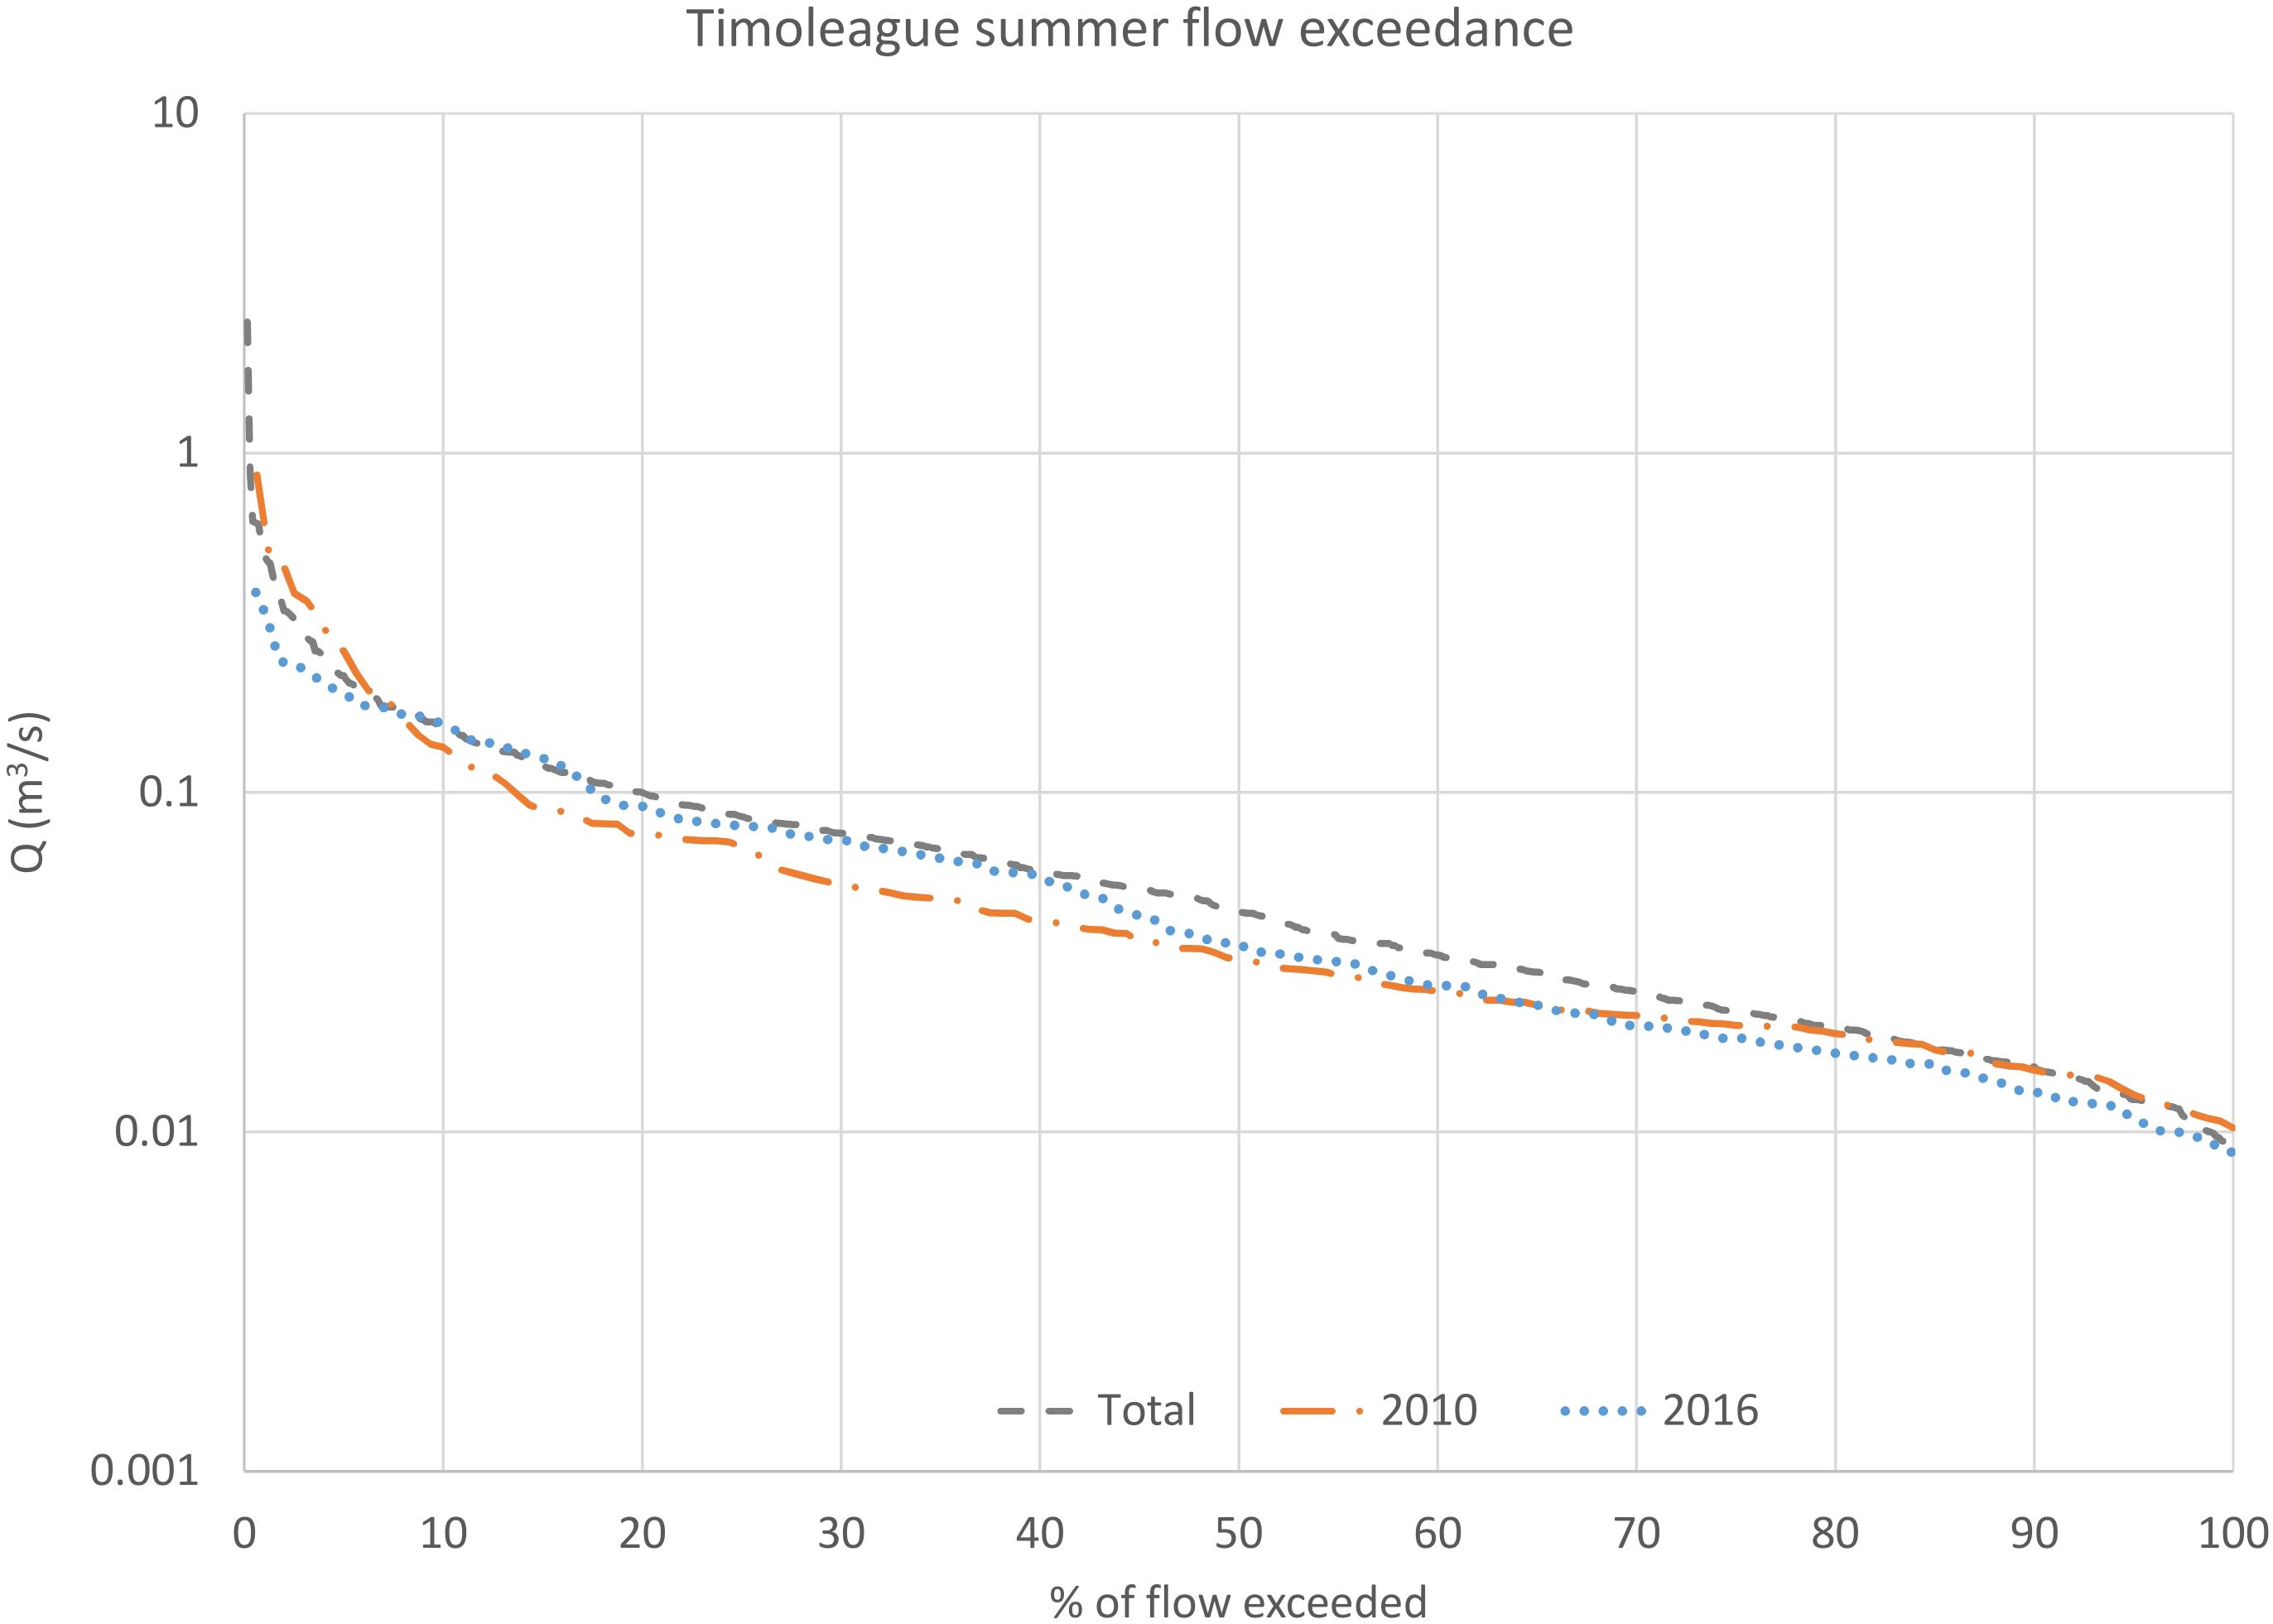
Figure 4. Comparison of the summer flow exceedance distributions for 2010 and 2016 versus the overall summer flow exceedance distribution for 2010-2016.
The relationships between total DIN loading per day and total discharge from the Timoleague River for 2010 and 2016 appear relatively stable (Figure 5A). There has been a substantial difference in the total DIP loading per day throughout the range of long-term flow percentiles in the Timoleague River for 2010 and 2016 (Figure 5B), with the lowest daily orthophosphate loading in 2010 (1.39 kg DIP at Q95) exceeding the largest daily orthophosphate loading in 2016 (1.24 kg DIP at Q05). A change in the relationship between flow in the Timoleague River and the molar N: P ratio of nutrient loading to the Argideen Estuary from the Timoleague River is also apparent (Figure 5C); while in 2010, the relationship indicates a gradual increase in the molar N: P ratio with increasing flow from Q95 to Q05, in 2016, the molar N: P ratio peaked between Q20 and Q30, with the ratio decreasing at higher flows. The implication of this trend is that, at higher flows, estuarine phosphorus limitation that may be induced by excessive nitrate between Q95 and Q30 is offset by increasing DIP loading relative to DIN. The consequence of this sequence of rainfall events would be higher potential growth of primary producers after higher rainfall.
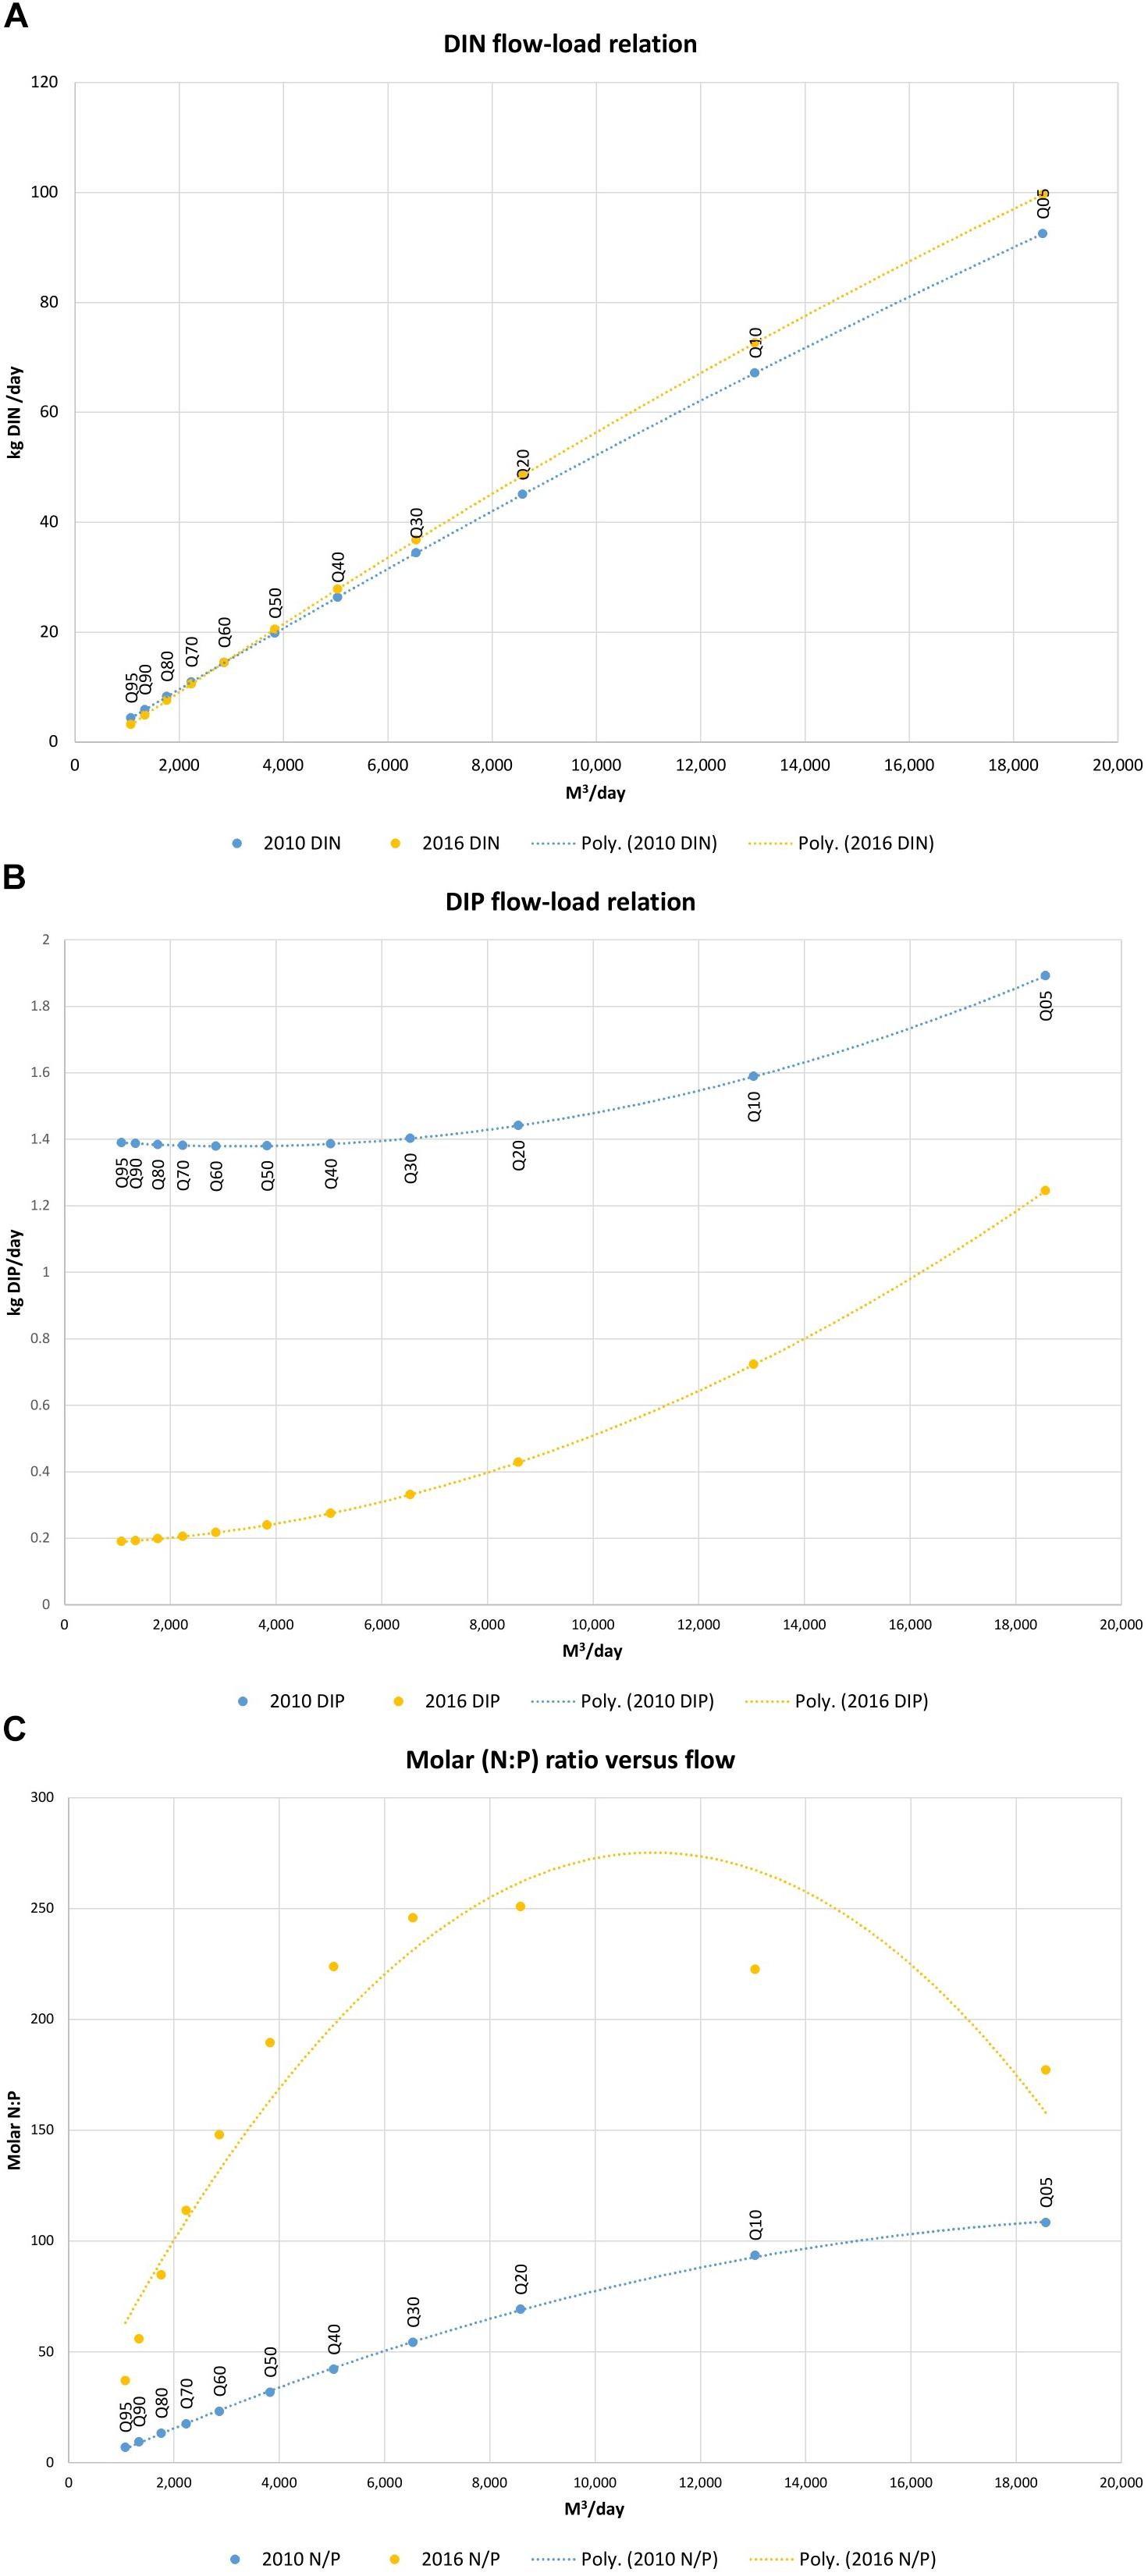
Figure 5. (A) Summer DIN flow-load relation, (B) Summer DIP flow-load relation, and (C) Summer molar N: P ratio vs. flow; flow values are long term summer flow percentiles Q05-Q95.
There is a considerable difference between DIN, DIP and chlorophyll a concentrations at the tidal boundary for both summers (Table 3). The molar N: P ratio varies from 51 in winter to 11 in summer 2010, while for 2016, the ratio is 19 in winter and 25 during summer. Courtmacsherry Bay and the Argideen Estuary are subject to semidiurnal tides. Given the volume that is exchanged on a daily basis during the tidal ebb and flood, the additional coastal P underlying lower molar N: P ratios has been posited as a major factor in sustaining macroalgae in the Argideen Estuary (Ni Longphuirt et al., 2015b) due to the abundance of N in the coastal system.
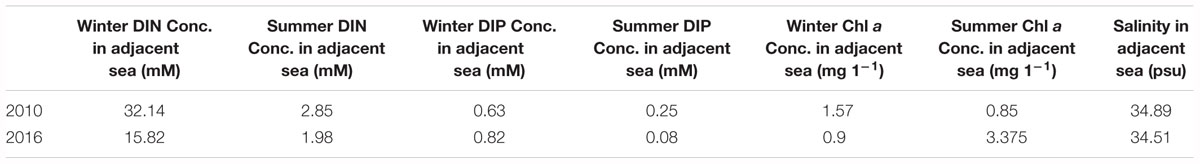
Table 3. Tidal boundary concentrations of DIN, DIP, chlorophyll a and salinity for 2010 and 2016 based on the EPA monitoring data collected at station AR120 at the outer edge of inner Courtmacsherry Bay; values determine the extrema of a standard tidal boundary forcing curve which provides separate tidal boundary concentration values for each day.
Results
Model Calibration
The calculated RSA was left unchanged throughout model calibration, with the daily tidal exchange value, E, being the sole parameter tuned to calibrate physical exchange. Nutrient and freshwater loads were extrapolated from the Timoleague catchment to the other four rivers assuming the RSA and loadings per unit catchment area transferred from 1 catchment to the others.
Daily exchange rate E is related to residence time τr by Equation 5 which is given by Aldridge et al. (2013), as follows:
Residence time is an expression of the length of time necessary to entirely flush an initial concentration of conservative tracer from a waterbody or part thereof, subject to the influence of riverine discharge and variation in tidal elevation. Equation 6, as proposed by Hartnett et al. (2011), was utilized to determine an initial estimate of residence time τ’r based on the length of a waterbody (L) in km, the width of the mouth of the waterbody (B0) in km, and the dimensionless tidal prism ratio (TPR).
The final exchange rates, which were identified from tuning the initial value determined using Equations 1 and 2, fell within a narrow range for each waterbody (Supplementary Table S2). The greater variation in values between the 2 years occurred further upstream to reflect greater exchange due to higher flushing because of higher freshwater flows.
Following calibration of the physical exchange between adjacent waterbodies, the model was tuned to match as closely as possible the seasonal average concentrations of DIN, DIP and chlorophyll a.
Site specific light attenuation coefficient values Kd were determined for each waterbody and year using Secchi depth readings together with separate equations given by Devlin et al. (2008) for estuarine and coastal waters. Using all site-specific values for parameters such as exchange rate and seasonal ratios for river discharge and nutrient loading brought all model observations to the right order of magnitude. The main differences between the final calibrated models were the macroalgae turnover rate and the wet weight to dry weight ratio (Supplementary Table S3). The only other differences between the two model configurations were the nutrient loads, tidal boundary conditions, the exchange rates (Supplementary Table S2) and the river discharge.
There is generally good agreement between the model simulated averages and seasonal average observations for summer 2010 and 2016, with respect to nutrients, phytoplankton and macroalgae (Table 4); the same gradient observed in monitoring data throughout the continuum from freshwaters to the coastal zone is replicated in the equivalent results generated by the model. It is important to emphasize that the seasonal average concentrations of DIN, DIP and chlorophyll a generated by the model are based on daily resolution outputs over the full summer from April to September inclusive, while the EPA monitoring data is collected at three points during the summer. The concentration averages determined by the model are based on volumes estimated based on from Admiralty charts. As concentrations are determined as mass per unit volume, the consequence of under or overestimation of volume must be kept in mind when interpreting the percentage difference. A lack of knowledge with respect to how the river reaches and their adjacent flood banks interact under high flows also must be considered. Under or overestimation of waterbody volumes also influences the modeled exchange for each daily timestep. The waterbodies with the greatest discrepancy between modeling and monitoring averages are those with the greatest measured chlorophyll a concentration, possibly a reflection of nutrient limitation. Furthermore, the greatest deficit in terms of DIP averages lies in sections with significant growth of primary producers, which are all phosphorus limited.
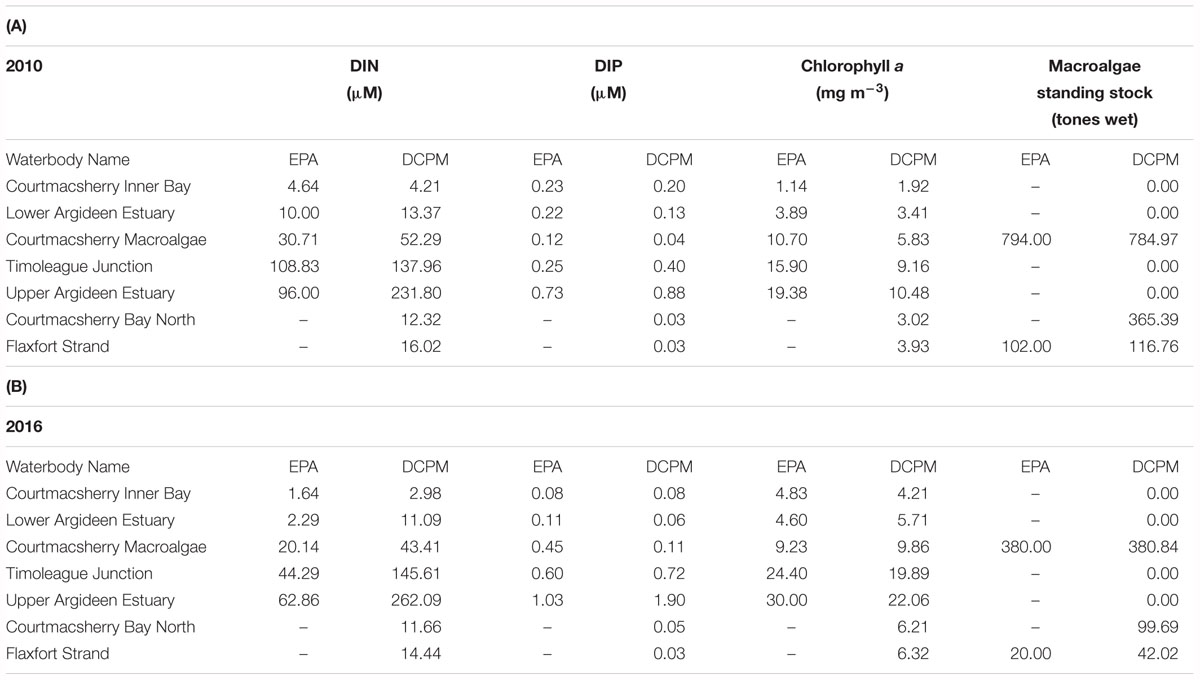
Table 4. Summer N, P, chlorophyll a and macroalgae observations in the Argideen Estuary/Courtmacsherry Bay system area compared to DCPM simulated summer averages after calibration for (A) 2010 and (B) 2016.
For both years, chlorophyll a growth in the system is either light of phosphorus limited (Supplementary Figure S2a). In the Upper Argideen Estuary, which receive the greatest riverine inflow, chlorophyll a growth is light limited throughout the year, whereas all other waterbodies in the system switch from light to phosphorus limitation between April and September and revert back to light limitation from July onward. As macroalgae in the Argideen Estuary proliferates in the intertidal zone, and is thus exposed twice daily, macroalgae growth switches from light limitation in spring due to low irradiance, to phosphorus limitation in summer (Supplementary Figure S2b); the same observation was made for the system in previous works (Ni Longphuirt et al., 2015b).
Scenario Modeling
The changing relationship between daily DIP load and stream discharge between 2010 and 2016 implies that more DIP is being retained in the catchment, and thus not entering watercourses (Figure 5B). Additionally, model results point to a system-wide trend of phosphorus limitation during the peak primary production season (Supplementary Figure S2). Therefore, the scenarios which were considered are primarily focused on possible further decreases in DIP load (Table 5); scenarios 2 and 3 give an insight into the potential outcome if DIP loads continue to decrease during the summer. Although the majority of the system was phosphorus limited during both years, the outcome of a joint reduction in DIN and DIP has also been considered, hereafter referred to as a coupled reduction; scenarios 4 and 5 apply this case. Coupled reductions and DIP reduction alone have been considered in two steps of 33% of the initial diffuse nutrient loading.
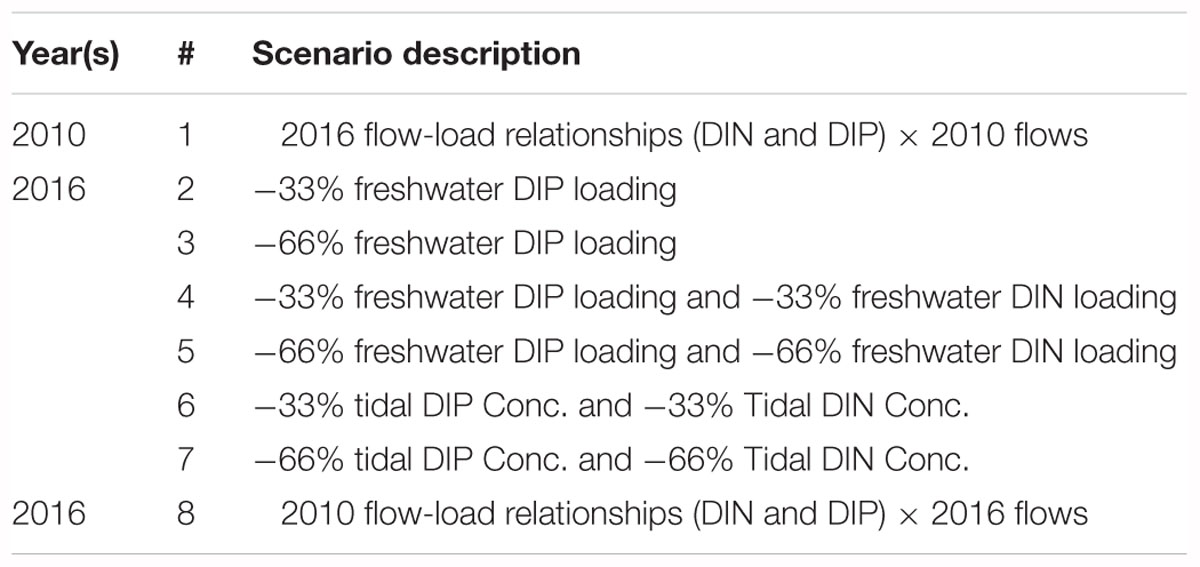
Table 5. Scenarios considered in nutrient load scenario simulations.
Opportunistic macroalgae growth occurs in the intertidal zone in the Argideen Estuary. Consequently, the impact of a coupled decrease in the concentrations of tidally exchanged coastal shelf DIN and DIP have been considered in scenarios 6 and 7.
As previously noted, the years 2010 and 2016 are similar with respect to summer flow exceedance distributions and averages. For this reason, the 2010 flow-load relationship for DIN and DIP was applied to 2016 flows (scenario 8), and vice versa (scenario 1), to establish the improvements in water quality due to better catchment management practice between 2010 and 2016. Scenario 1 represents the outcome if no effort had been made to improve nutrient management practice between 2010 and 2016. Scenario 8 considers the outcome if better nutrient management practices had been adopted sooner.
2010 – Scenario 1
Scenario 1 considered the possibility of the 2016 flow-load relationships being valid in 2010. The net effect to the nutrient loads was an increase in the freshwater DIN loading of 3%, and a 30% increase in the freshwater DIP loading. A moderate 5% increase in summer chlorophyll a in the freshwater Upper Argideen Estuary (Figure 6E) and Timoleague Receiving Waters (Figure 6D) reflects the light limitation of these waters for the early and latter stages of the summer. A 40–50% increase in the DIP concentrations in both reflect a greater availability of DIP. This increase in DIP has a greater impact in the downstream Courtmacsherry Macroalgae zone (Figure 6C), where there is an observed increase of approximately 25% in the Ulva tonnage, 5% increase in the summer averaged chlorophyll a and 7–8% increase in the DIP concentration. System wide, there is a reduction in summer DIN concentrations (Figures 6A–E), which reflects a greater uptake of available DIN in primary producers; this would be the expected result of an increased supply of DIP to a phosphorus limited system, without a concomitant increase in DIN loading.
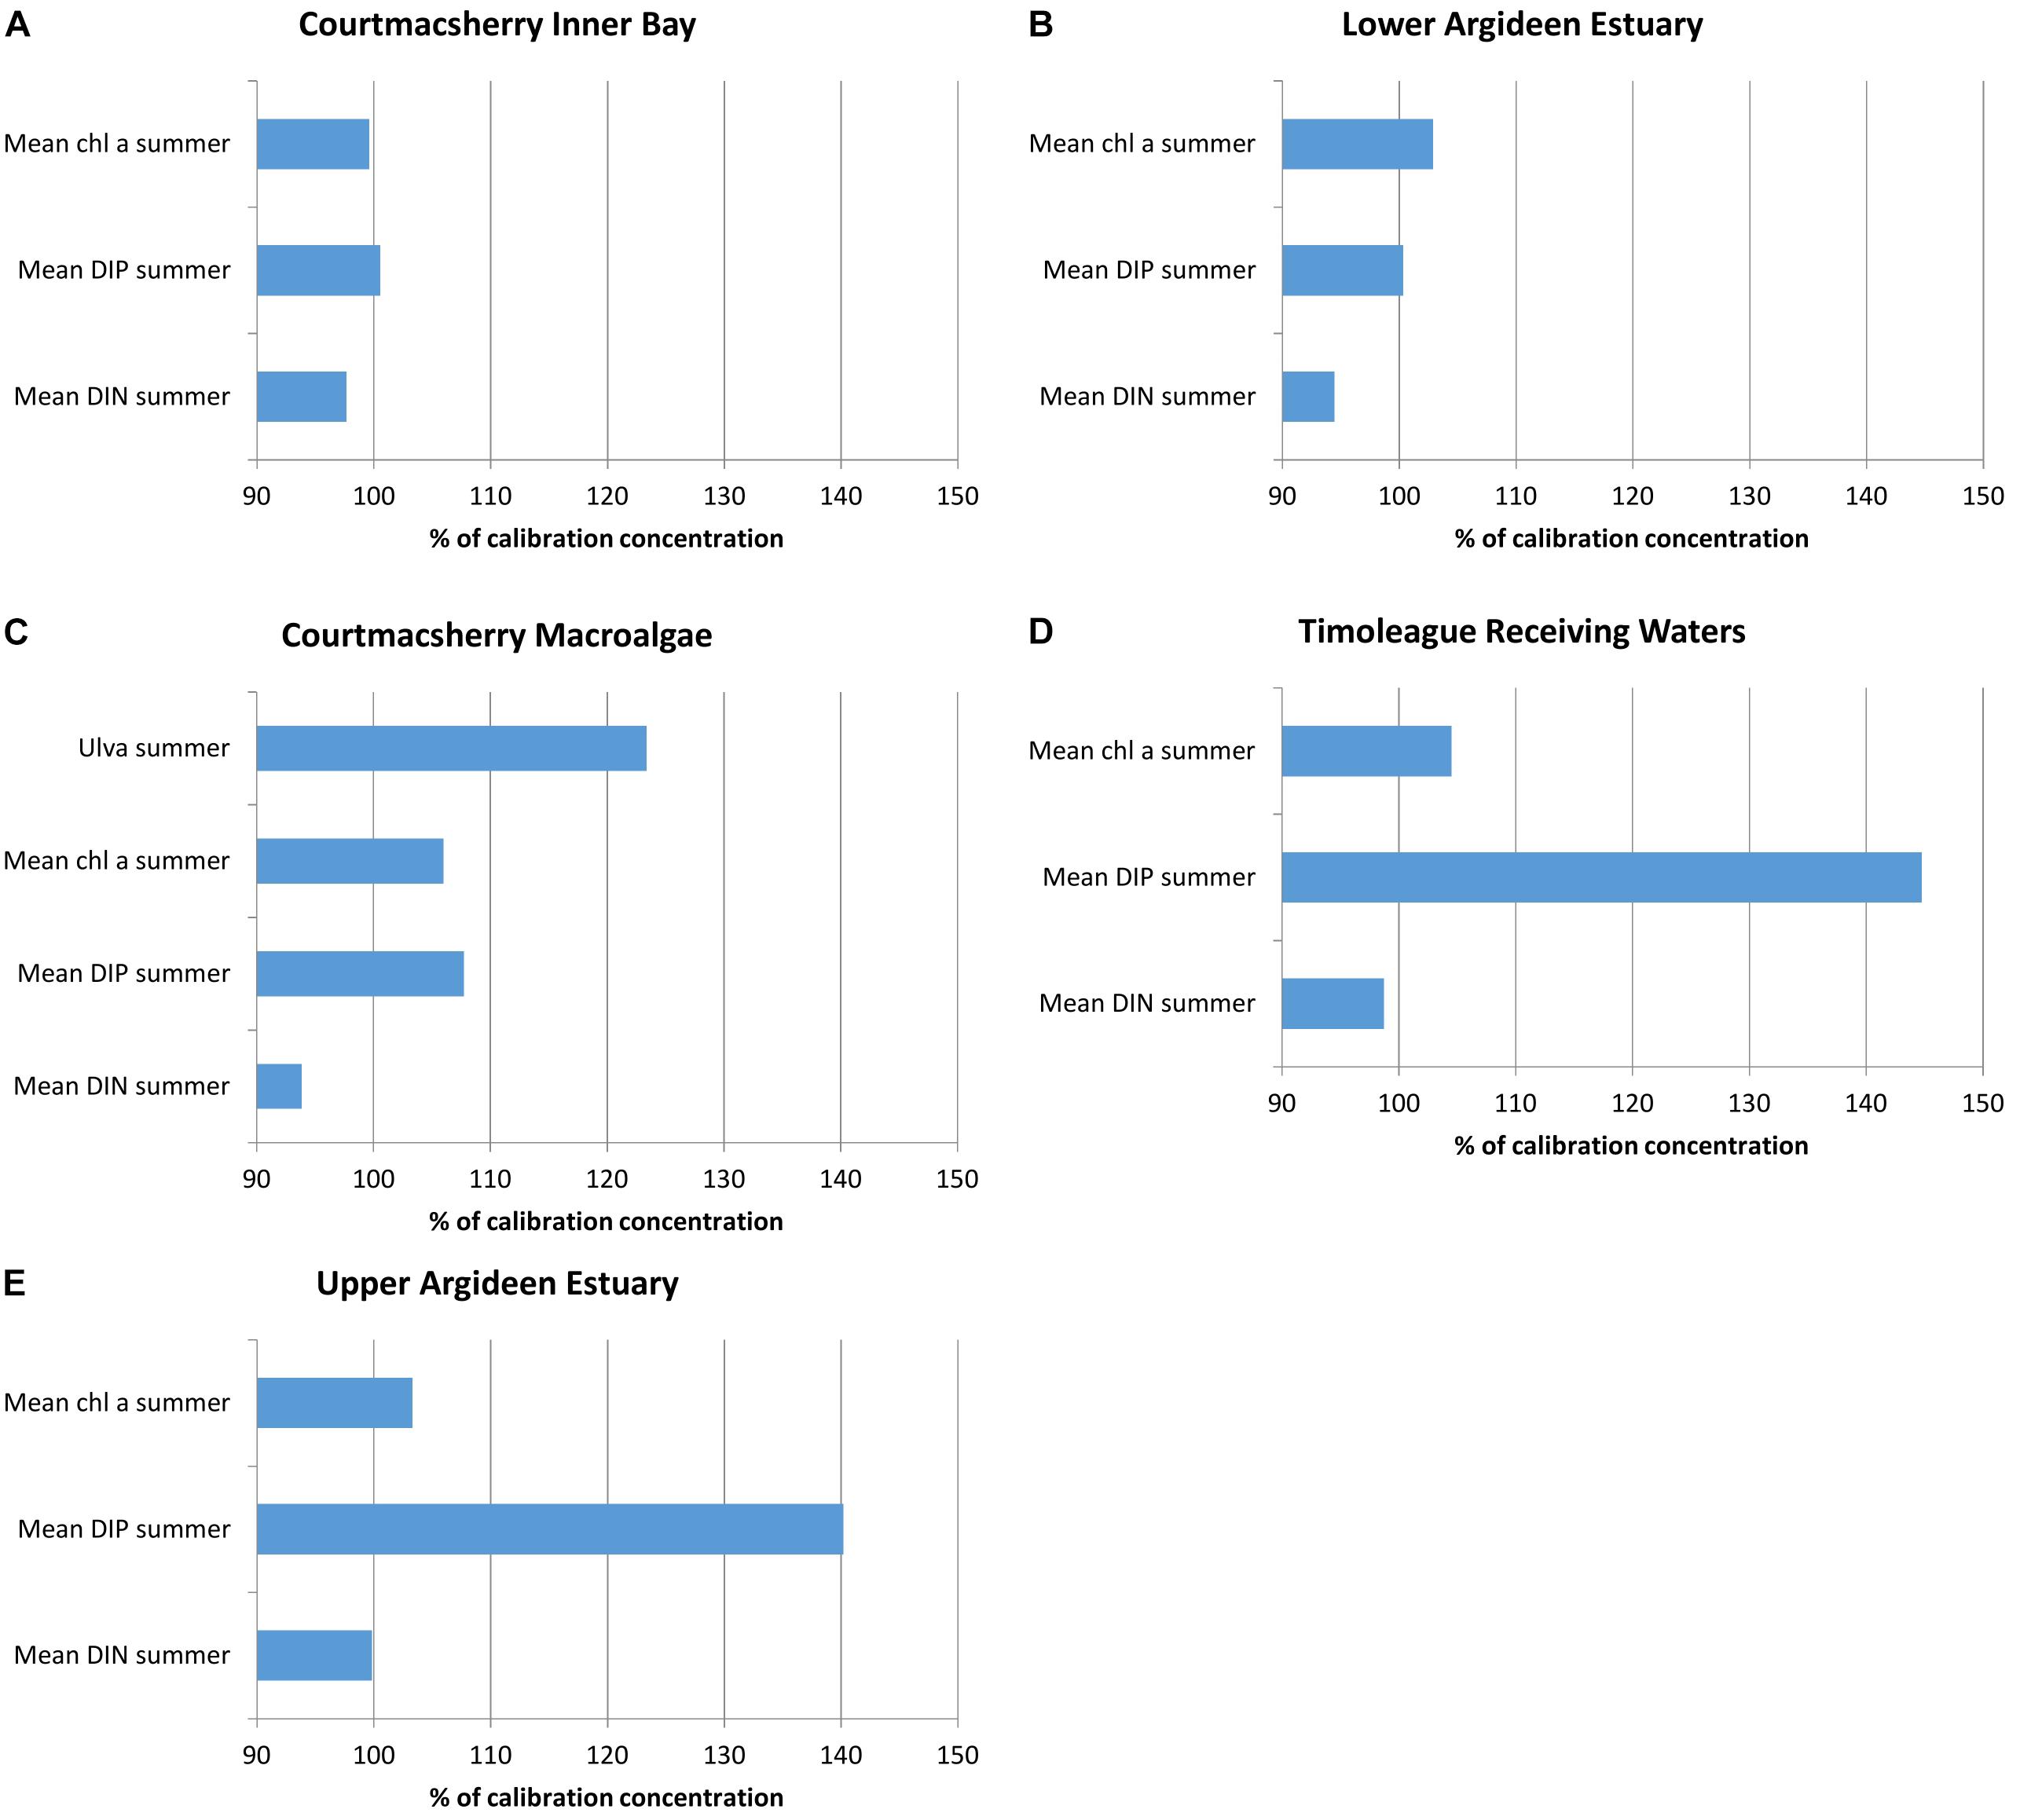
Figure 6. Percentage change in DIN, DIP, chlorophyll a and macroalgae due to imposition of flow load relations for 2016 to 2010 flow data (scenario 1) in (A) Courtmacsherry Inner Bay, (B) the Lower Argideen Estuary, (C) the Courtmacsherry macroalgae zone, (D) the Timoleague Receiving Waters, and (E) the Upper Argideen Estuary.
2016 – Scenarios 2–7
Application of scenarios 2 and 3 resulted in an increase in DIN concentrations throughout the system of 2–17% (Figures 7A–F), with the response increasing in proportion to the DIP load reduction applied. An associated reduction in average DIP concentrations of 4–66% throughout the system was also induced. Due to the phosphorus limitation of primary producers, summer average chlorophyll a concentrations reduced by 2–66% in response to freshwater DIP load reduction, with the greatest effect observed in the freshwater reaches of the system. Macroalgae standing stock declined by up to 50% in response to a freshwater DIP load reduction of 66%.
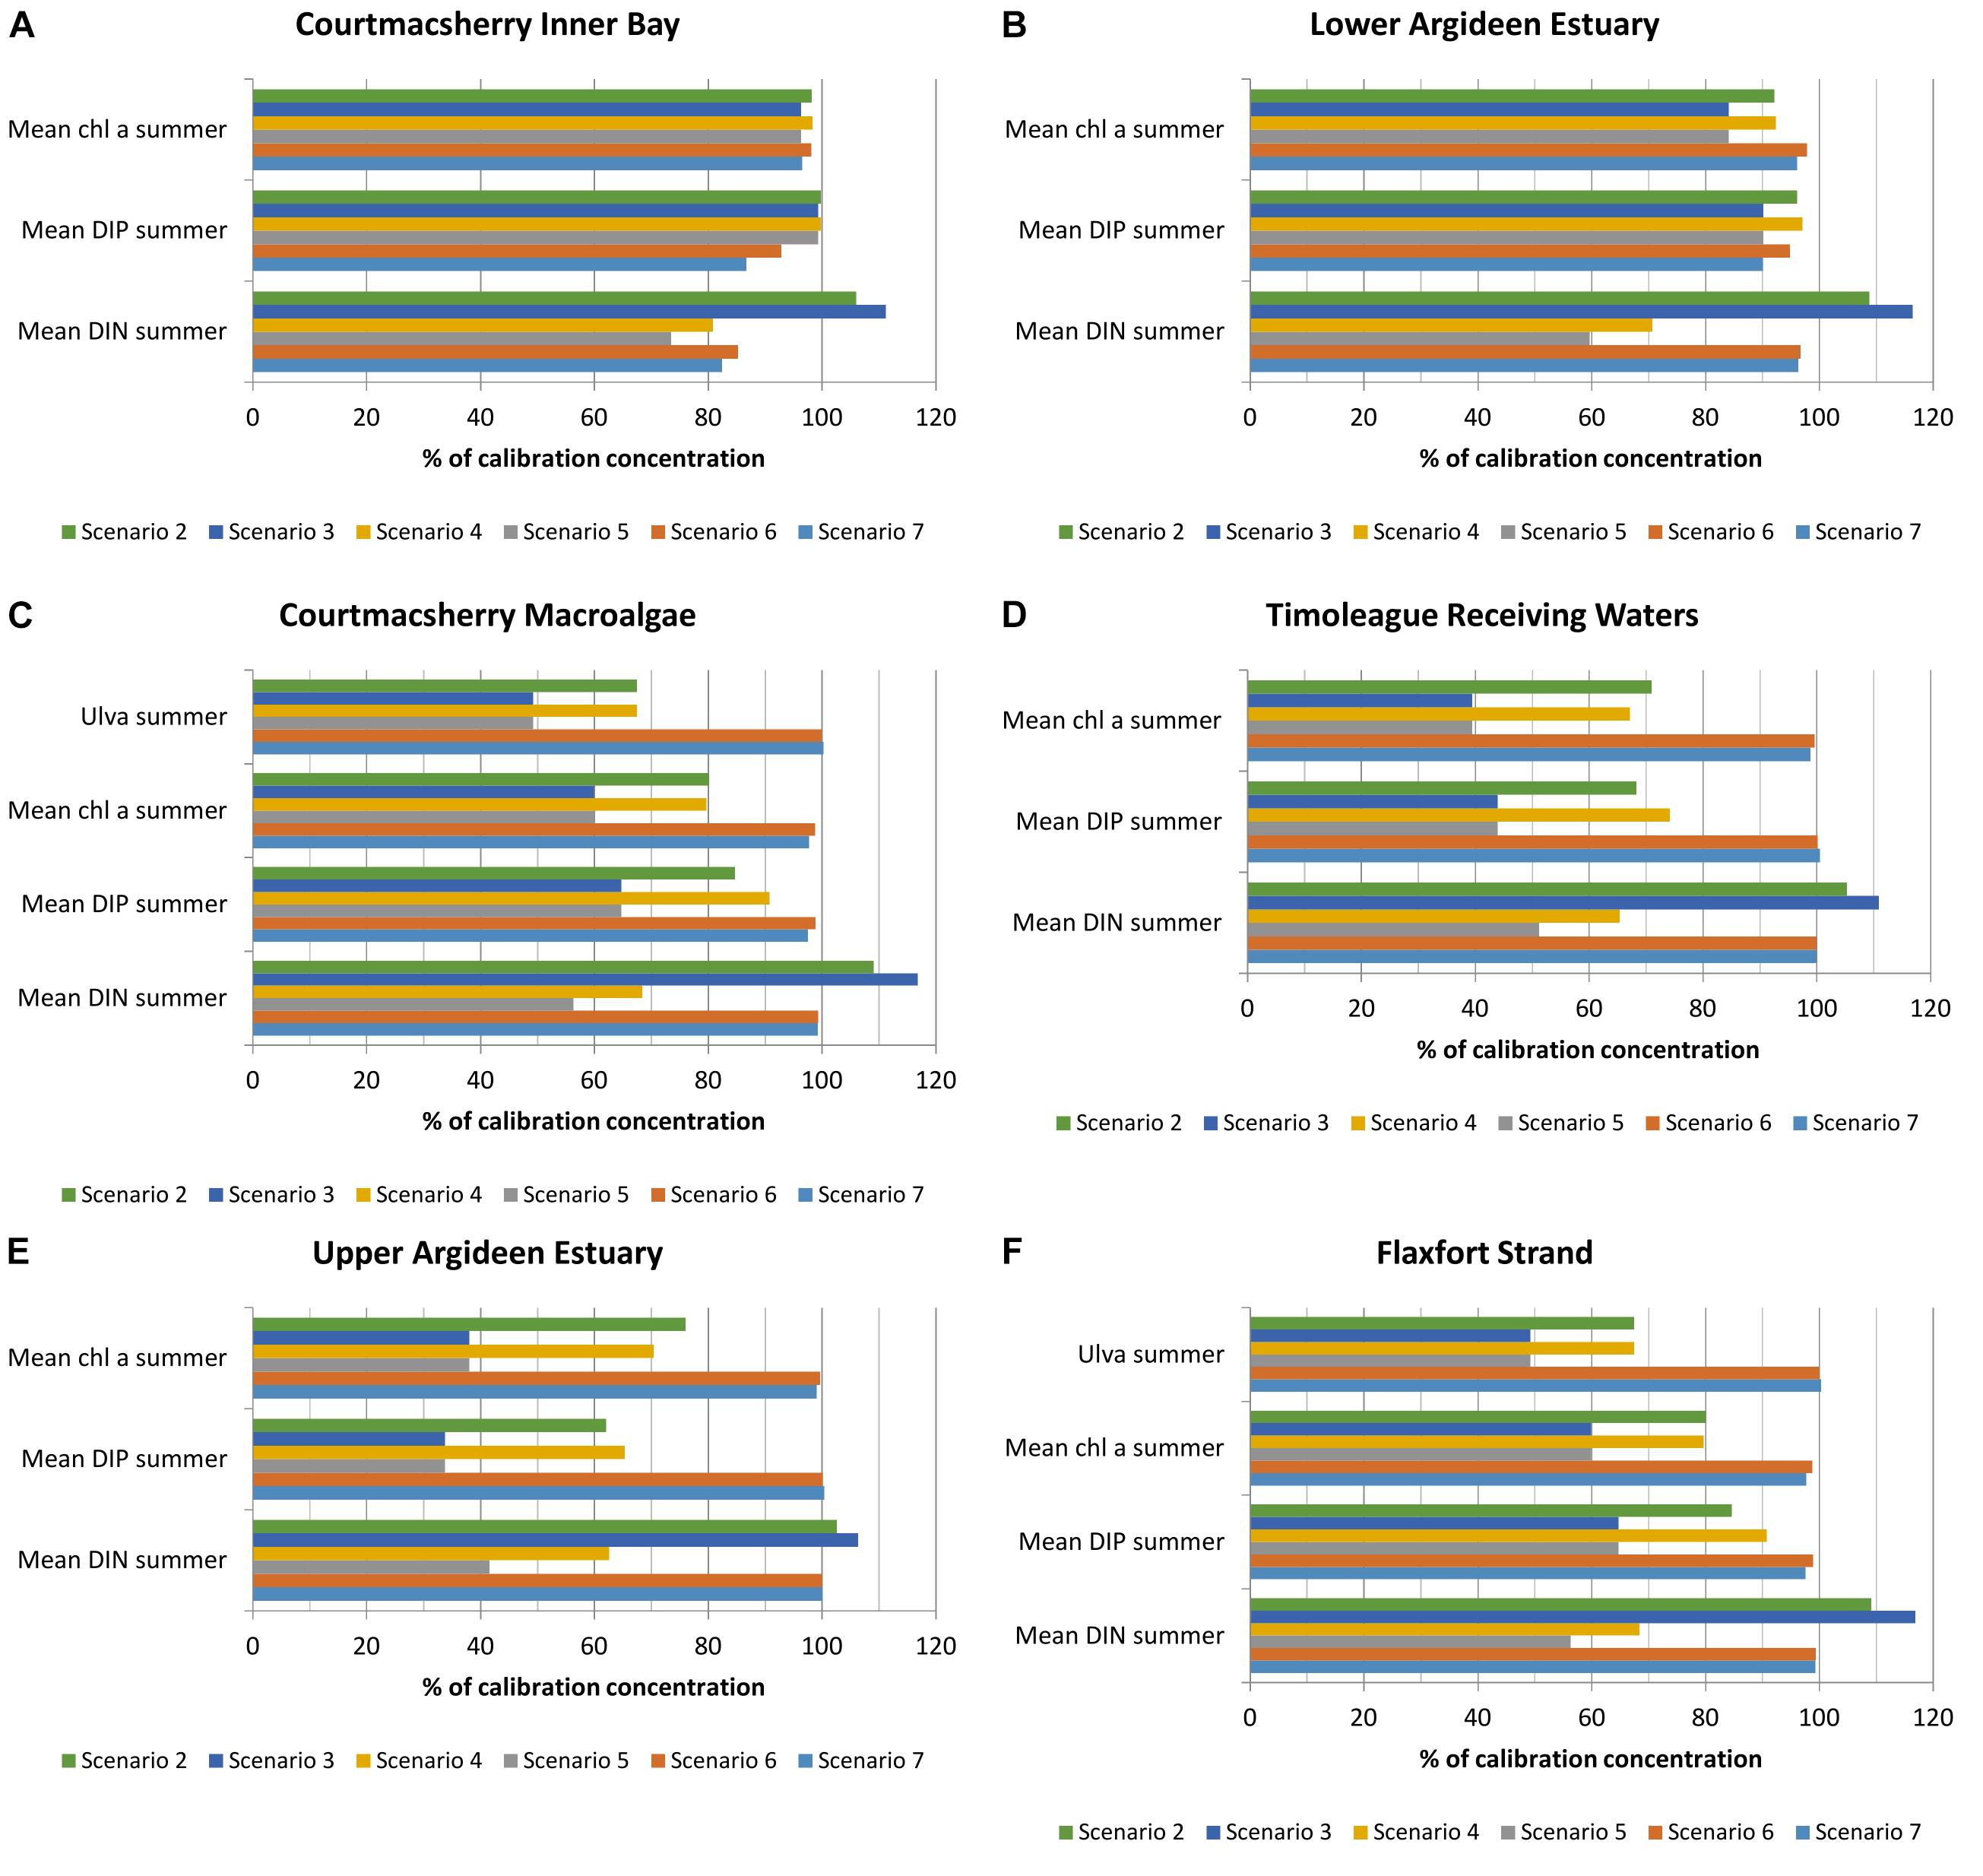
Figure 7. Percentage change in DIN, DIP, chlorophyll a and macroalgae due to riverine nutrient load reduction or boundary reduction based on 2016 loading data in (A) Courtmacsherry Inner Bay, (B) the Lower Argideen Estuary, (C) the Courtmacsherry macroalgae zone, (D) the Timoleague Receiving Waters, (E) the Upper Argideen Estuary, and (F) Flaxfort Strand.
Scenario 4 impacted chlorophyll a concentrations in the freshwater Timoleague receiving waters (Figure 7D) and Upper Argideen Estuary (Figure 7E) more than scenario 2; this reflects the delicate balance regarding nutrient limitation within the system. Scenario 5, however, had a similar impact throughout the system to scenario 3. No additional benefit with respect to Ulva bloom abatement was derived from scenarios 4 and 5, beyond the benefit observed with scenarios 2 and 3.
Scenarios 6 and 7 brought about a minor reduction in chlorophyll a concentrations, DIN and DIP in the brackish-saline reaches of the system, with the effect diminishing with distance from the tidal boundary.
2016 – Scenario 8
Scenario 8 is a counterpoint scenario 1, which presented the opposite approach of applying the summer 2016 flow-load relationships for DIN and DIP to summer 2010 flows; scenario 8 considers the potential impact had there been no improvement in agricultural land management practice between 2010 and 2016. The implication of scenario 8 upon riverine nutrient loading to the system is an increase in DIN load of 0.2% and an increase in DIP load of 134%.
One of the most notable observations is an increase of 25–185% in DIP in the Courtmacsherry Macroalgae Zone (Figure 8C), Timoleague Receiving Waters (Figure 8D) and Upper Argideen Estuary (Figure 8E), with excesses increasing with distance upstream; there is a moderate reduction in DIP of 0.5–2% in the remaining waterbodies. Due to the greater availability of DIP during the peak primary production period, there was an increase of 6–65% in summer averaged chlorophyll a concentrations, and an increase of 265% in summer Ulva standing stock. The increase in available DIP reflects an increase of 134% in summertime freshwater DIP loading upon baseline summer 2016 loading. DIN loading remained static in comparison to the baseline summer 2016 DIN loading. Therefore, the reduction in observed summer averaged DIN concentrations throughout the system (Figure 8) reflect a greater uptake of DIN by primary producers.
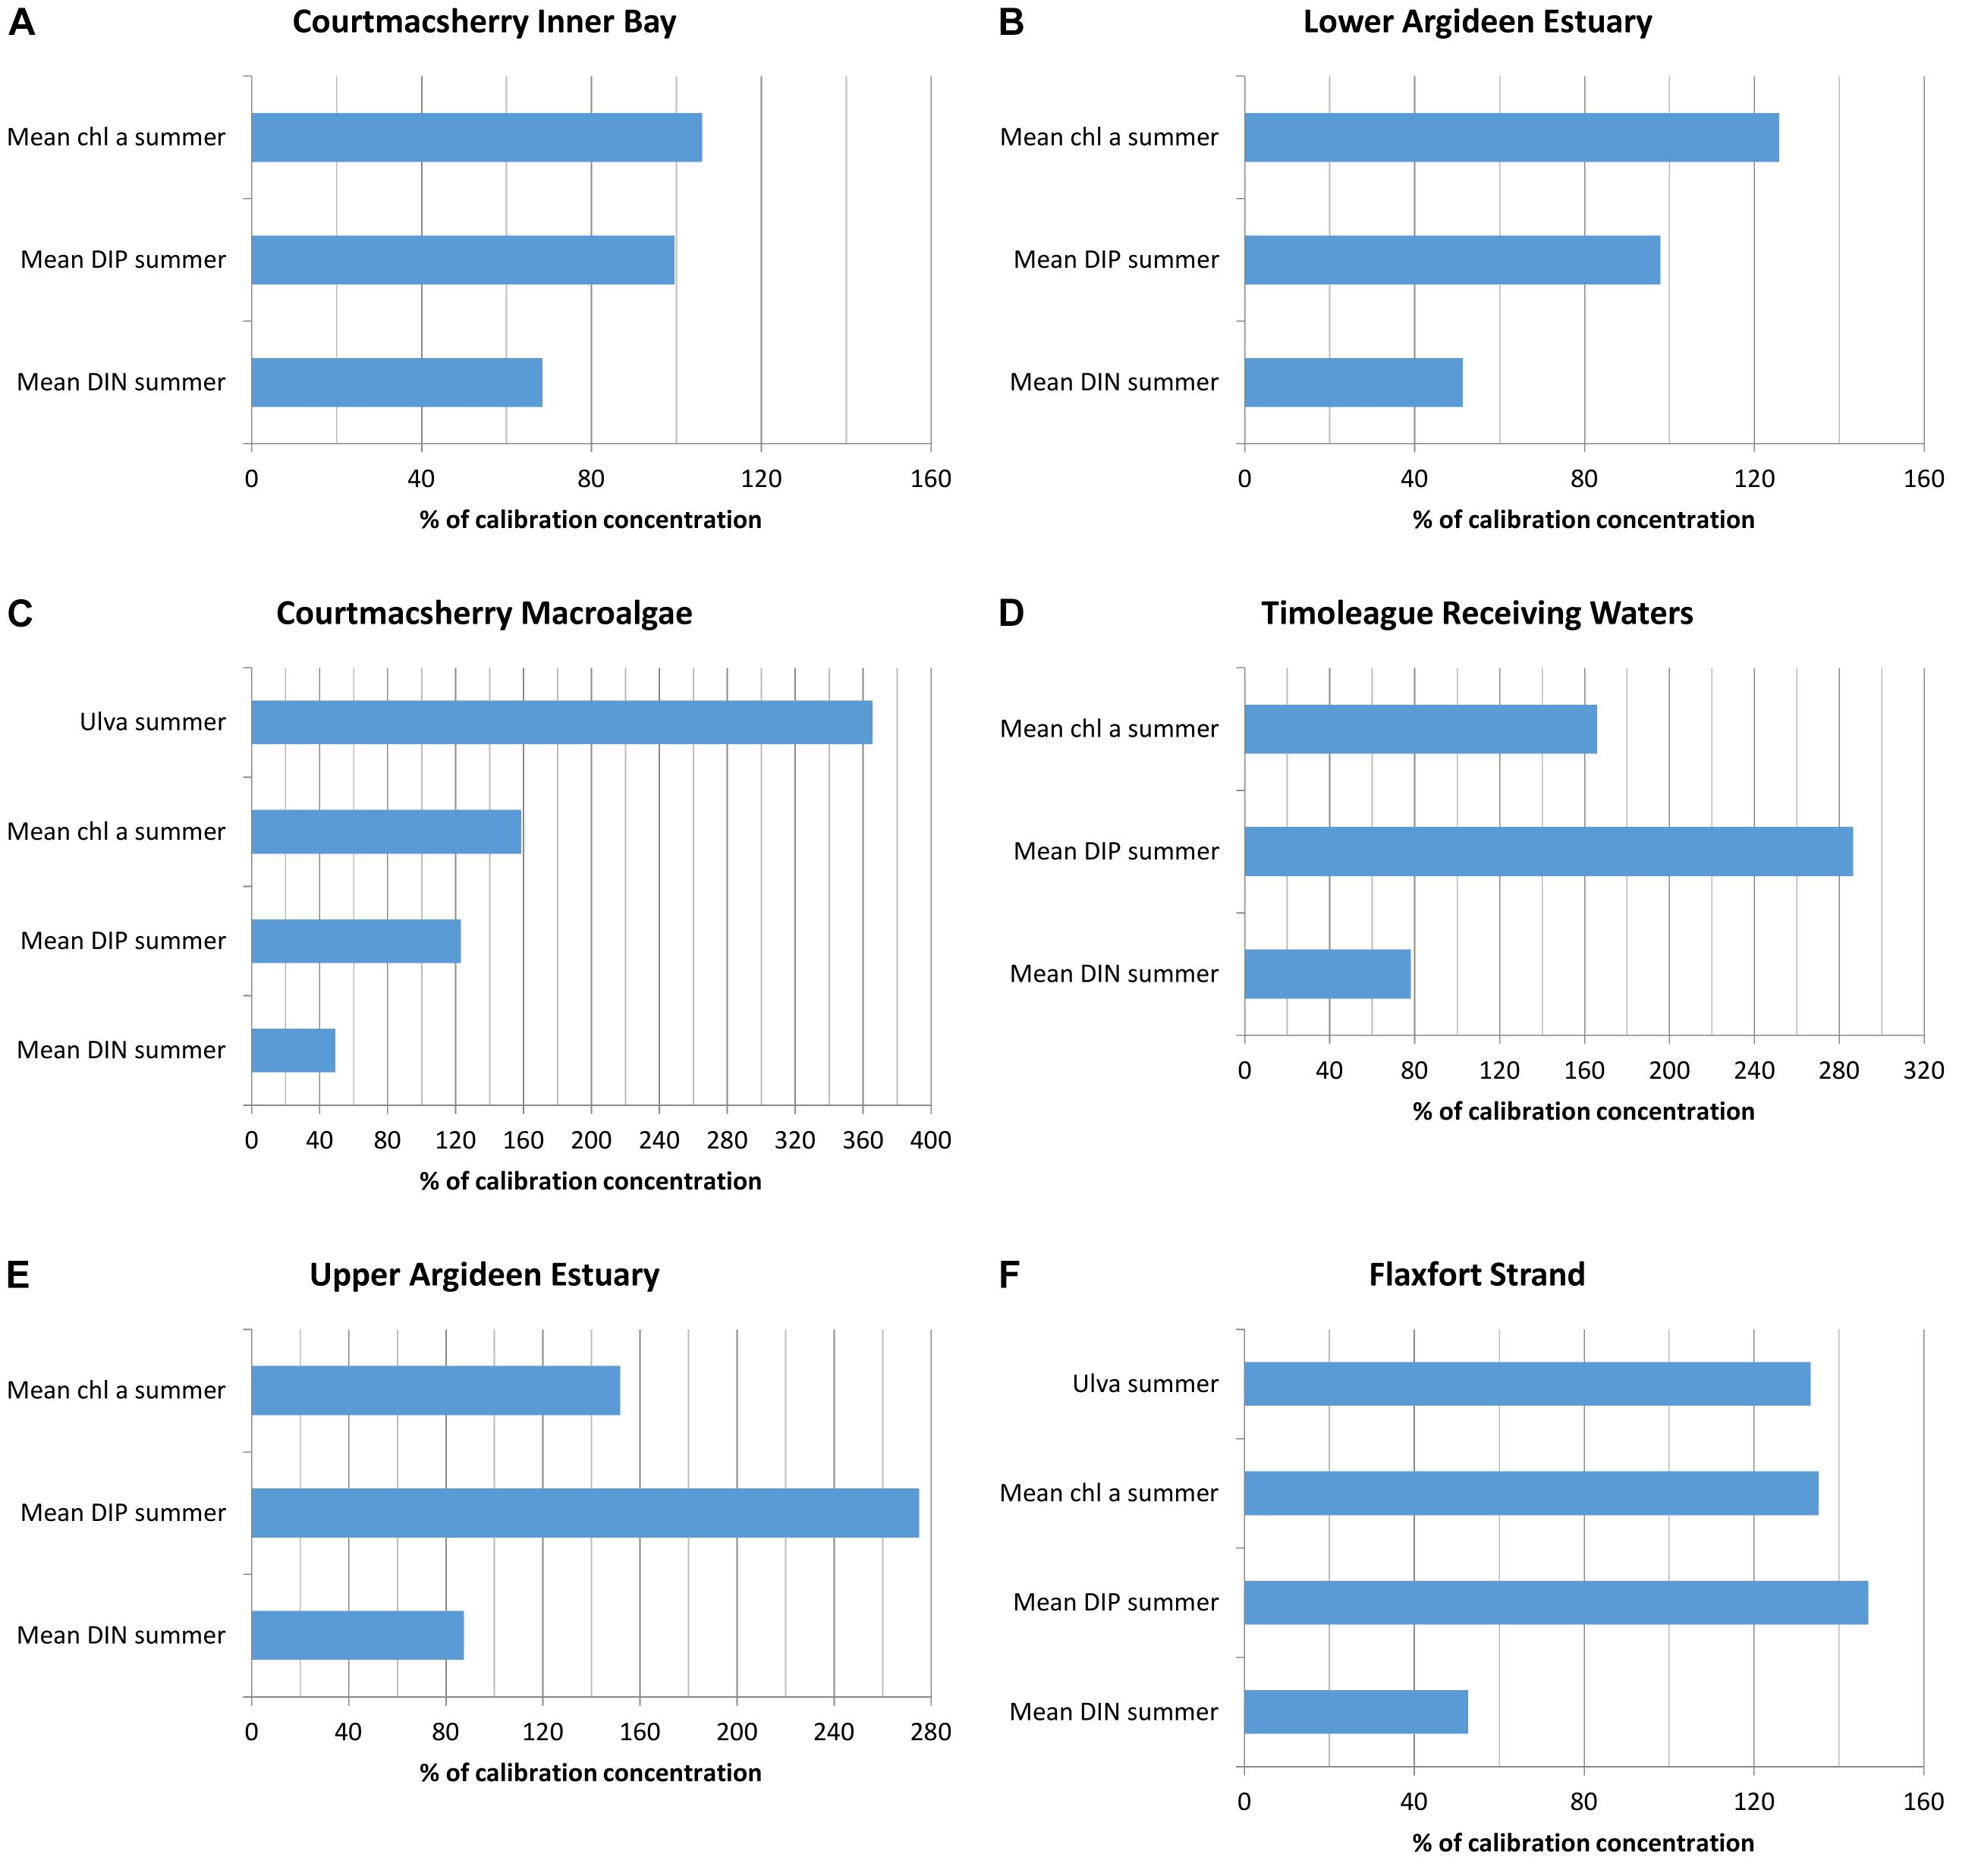
Figure 8. Percentage change in N, P, chlorophyll a and macroalgae due to imposition of flow load relations for 2010 to 2016 flow data in (A) Courtmacsherry Inner Bay, (B) the Lower Argideen Estuary, (C) the Courtmacsherry macroalgae zone, (D) the Timoleague Receiving Waters, (E) the Upper Argideen Estuary, and (F) Flaxfort Strand.
Discussion
A high-level overview of the summertime hydrological patterns of 2010 and 2016 reveal that each summer differs, although summers 2010 and 2016 are close to the 2010–2016 average discharge and flow exceedance curve. Therefore, the outcomes of the six nutrient load reduction scenarios considered in this research for summer 2016 may be interpreted as the potential outcomes for a standard summer.
DIN loading from the Timoleague catchment was linear with increasing rainfall/river flow for the years 2010 and 2016 (Figure 5A). DIP transfer with increasing river discharge across the flow percentiles was curved upward (Figure 5B), indicating greater transfer with increasing precipitation. The curve shape is similar for years 2010 and 2016. The most notable observation in 2016 is the reduction in DIP transfer across the range of flow percentiles (Figure 5B). There has been a sustained improvement in the phosphorus balance in the Timoleague catchment since the Nitrates Action Plans (DOEHLG, 2006) were introduced in 2006, evidenced by a gradual reduction in phosphorus surplus and a convergence of soil phosphorus indices toward optimum values (Murphy et al., 2015). However, whilst the predominant source of phosphorus within the Timoleague catchment is storm runoff from agriculture, Shore et al. (2017) suggested that point source pressures such as domestic wastewater from one-off dwellings play a significant role in baseflow DIP concentrations; an increase in concentrations of total reactive phosphorus was observed during very low flow in Timoleague, due to baseflow point source pressures. In the same catchment, Jordan et al. (2012) also remarked upon significant phosphorus transfer from baseflow during summer.
In summer 2010, the molar ratio of nutrient loading throughout the flow percentile range was much closer to the Redfield ratio (Redfield, 1934) than 2016 (Figure 5C); on a daily basis in summer 2010, irrespective of the mass of nutrients delivered via watercourses, the nutrients were delivered in a ratio that would provide optimum conditions for growth of phytoplankton and macroalgae. In summer 2016, the equivalent curve indicates increasing phosphorus limitation with increasing flow, up to approximately Q10 flows. Thereafter, greater rainfall and the resultant runoff would contain DIN and DIP concentrations closer to the optimum N: P Redfield ratio of 16: 1. However, when overall nutrient loads are considered (Table 2), the molar N: P ratio of nutrient loading to the system in 2010 and 2016 was 190 and 105 respectively. To unite both perspectives on the molar N: P ratio, one must consider the relative frequency of occurrence of low flows in 2016. Days of low flow in 2016 delivered nutrients in more favorable molar ratios of N: P; the infrequent wet days represented by the upper end of the x axis (Figure 5C), would have delivered excess DIN relative to DIP, thus inducing phosphorus limitation. Dupas et al. (2017) deduced from the apparent chemostasis in the Timoleague catchment that there was a high P store in the catchment. The same publication noted the same patterns in nutrient flow load curves, namely an inflection on the flow-nitrate curve above 6mm d-1 rainfall, and the opposite upward flow-phosphate curve above 6 mm d-1 rainfall. These patterns were linked to the combined influence of shallow and overland flow which connects regions of low nitrate and high soluble phosphorus, thus explaining a narrowing of the N: P ratio under high flow conditions. The author cited the potential cause of low nitrogen transfer being a better retention of nitrogen in grasslands such as Timoleague due to longer growth phase of grass than other land use activities, whereas the risk of P mobilization increases in grassland (Haygarth et al., 1998).
Changes in the nutrient flow-load relations from 2010 to 2016 imply an improvement in the prevailing conditions in the Timoleague catchment for an average year (2010 versus 2016), potentially due to better agricultural practices. Growth of benthic and pelagic primary producers has been almost consistently phosphorus limited in recent years, suggesting that continued improvements in phosphorus management and better phosphorus retention in the Timoleague catchment may result in a considerable reduction in macroalgae and phytoplankton bloom magnitudes in forthcoming years.
A 66% reduction in DIP loading in 2016 would have resulted in a reduction of 50% in the total macroalgae wet weight to 190 tones (Figure 7C). Overland flow connectivity in a catchment such as the Timoleague significantly contributes to DIP transfer to watercourses during storm events. Meanwhile, during drier periods, baseflow DIP is responsible for a disproportionate increase in DIP concentrations in watercourses; reducing the contribution from point sources must therefore be considered in detail. The pressure posed by point sources nutrient sources such as domestic septic tanks has been cited in other agricultural catchments (Bowes et al., 2005; Jarvie et al., 2006). Reduction of this pressure would improve trophic status during and after low flow periods; it would allow for easier attribution of stream flow nutrient concentrations to agriculture and thus improvements in nutrient concentrations would be more readily attributable to improvements in farm nutrient management practice.
Notwithstanding the differing hydrological conditions, the results of applying the 2010 flow-load relationships for DIN and DIP to 2016, and vice versa, suggest that there has been an improvement in phosphorus retention within the Timoleague catchment between 2010 and 2016; the combination of 2010 flows and 2016 flow-load relationships lead to an increase in the simulated Ulva tonnage from 784t to 968t. However, applying the 2010 flow-load relationships to the 2016 flows resulted in an increase from 380t to 1391t. There has been a clear improvement in flow-normalized phosphorus transfer between 2010 and 2016, as evidenced by the flow-DIP load curves in Figure 5B. Therefore, the improvements already observed in Ulva bloom magnitudes between 2010 and 2016 may continue with sustained improvement in farm phosphorus management in the catchments discharging to the Argideen Estuary.
Basu et al. (2010) has posited that in well managed catchments with legacy nutrient sources, flow weighted concentrations become temporally invariant, such that nutrient transfer is solely a function of stream discharge following on from rainfall, whereas in less managed catchments without any legacy sources, flow weighted concentrations would be highly variable and limited only by phosphorus application rates. Legacy phosphorus storage within the Timoleague catchment is being utilized, with flow normalized phosphorus transfer throughout the range of flow percentiles reducing between the hydrologically similar summers of 2010 and 2016 (Figure 5B); the Timoleague catchment is in an apparent period of transition, between the two situations suggested by Basu et al. (2010); while phosphorus transfer appears to be reducing, it has not yet become time invariant from year to year.
Considerable effort will be required globally and nationally to maintain and build upon the improvements in catchment management practice observed in recent years; phosphorus loss mitigation measures may be negated if they are not climate-proofed into the future (Schoumans et al., 2015). With respect to other similar agricultural catchments nationally and internationally, Haygarth et al. (2014) proposes that catchments can be characterized with detailed timeseries of nutrient loading inputs and water course discharge outputs to identify the whether it is undergoing phosphorus accumulation or depletion.
Schulte et al. (2010) identified an average lag of 7–15 years from cessation of fertilizer spreading to high phosphorus soils and the reduction in soil phosphorus to a satisfactory value of soil index 3. Therefore, improvements in farm nutrient management may have a long lead in time before they yield results. Collins et al. (2018) has proposed 12 basic farm management measures which would cost $52 Stg. per hectare to implement, and result in reductions in phosphorus load of up to 12%.
Many challenges must be addressed to further reduce phosphorus losses to water in the future (Sharpley et al., 2015) such as identification of phosphorus transport pathways and mitigation measures to stem phosphorus loss, and implementation of these measures. Roberts and Johnston (2015) advocate the 4R approach to efficiently managing phosphorus and increasing phosphorus recovery, by applying the right source of fertilizer at the right rate, time and place.
The 2016 N: P ratio for the summer freshwater loading, at 105: 1, is closer than the 2010 ratio (190: 1) to the Redfield ratio of 16: 1 which would lead to optimum growth of primary producers, the tidal molar N: P ratio in 2016, at 25:1, represents a state of phosphorus limitation. Simulated Ulva tonnages in the Argideen Estuary are sensitive to tidal boundary nutrient forcing during the summer. While the total diffuse freshwater DIN loads for 2010 and 2016 were quite similar, the total diffuse freshwater DIP load in summer 2016 was 64% greater than in summer 2010. Consequently, were the tidal DIP concentration in 2016 (0.08 μM) the same as 2010 (0.25 μM), a greater bloom would most likely have occurred as previously determined in this system (Ni Longphuirt et al., 2015b), the possibility of tidally exchanged coastal shelf phosphorus concentrations downstream fuelling opportunistic blooms must be borne in mind. Indeed, previously modelled reductions in P loadings to the estuary were shown to have little effect on the standing stock of macroalgal biomass due to the influx of seawater with relatively high P concentration (Ni Longphuirt et al., 2015b).
The North Atlantic Oscillation (NAO) affects both nutrient losses from catchments (Mellander et al., 2018), and ocean circulation (Marshall et al., 2001), thus influencing the model forcing data at either end of the estuary, i.e., nutrient losses, freshwater discharges and coastal shelf nutrient concentrations. The results presented here consider two summers in isolation. Therefore, the impact of the NAO on estuaries should be considered in future research to build upon this research and provide a wider context for the 2 years discussed.
Conclusion
The DCPM model was applied to the system comprising the Argideen Estuary and Courtmacsherry Bay for 2010 and 2016. A series of scenarios were simulated for the year 2016 to inform integrated catchment management in the Argideen Estuary, with a view to eradicating the annual macroalgae bloom.
A 33% reduction in DIP loading produced a macroalgae bloom which was approximately 33% smaller, while a 66% reduction in DIP loading produced a macroalgae bloom that was 50% smaller. Therefore, in the Argideen Estuary the impact of DIP load reduction upon macroalgae bloom magnitudes diminishes with as the DIP load is reduced.
DIP load reduction without parallel DIN load reduction resulted in an increase in DIN concentrations of up to 20% throughout the Argideen Estuary-Courtmacsherry Bay system. The implication of this observation is that if the DIP loads delivered throughout the flow percentile range, without any concomitant change in the DIN flow-load relationship, DIN will be transferred to coastal waters.
Flow-load relationships for 2010 and 2016 suggested there was an improvement in nutrient management within the Timoleague catchment. The 2010 flow-nutrient load relationships were applied to 2016 daily flow measurements, and 2016 flow-nutrient load relationships were applied to 2010 daily flow measurements. The total nutrient loadings were applied to the model for the respective years to determine the improvements caused by implementation of better agricultural nutrient management, advocated by Nitrates Action Programs, in the intervening years. Including 2016 flow-load relationships in the 2010 model represented the scenario that better agricultural nutrient management practice had been brought about sooner. Including the 2010 flow-load relationships in the 2016 model represented the scenario if there had been no improvement in agricultural nutrient management between 2010 and 2016.
Whilst the hydrological conditions during summer 2010 and 2016 differ, the overall flows were similar. The main distinction between the summers was a difference with respect to flow duration, with some higher daily flows observed in summer 2010.
(1) Applying the 2016 flow-load relationships for N and P to 2010 flows resulted in an increase in the simulated Ulva tonnage of 24%.
(2) Applying the 2010 flow-load relationships for N and P to 2016 flows resulted in an almost four-fold increase in the simulated Ulva tonnage.
The differing flow-nutrient load curves between 2010 and 2016 indicate that there was a reduction in transfer of P from the Timoleague catchment to surface waters. Given the P-limitation of primary production for summer 2010, a reduction in the P transfer rate between the hydrologically similar summers of 2010 and 2016 would ostensibly indicate that a reduction in Ulva magnitudes would be induced. A reduction in the monitored Ulva tonnages in the main macroalgae patch of Courtmacsherry from 2010 to 2016 from 784 to 391 tones would bear out this hypothesis. In an effort to confirm this improvement, application of the flow-load relationships from each year to the other indicates that a dramatic increase in Ulva tonnages would have been caused were the nutrient management regime in 2010 to remain in place in 2016.
Data Availability
Requests for the datasets used in this study will be facilitated by the corresponding author.
Author Contributions
JM conceptualized the paper scope, sourced input data, calibrated the model, and authored the first draft of the paper and the subsequent paper version post peer-review. MH and SN have reviewed all research from inception through to completion and reviewed drafts of this paper.
Funding
This project was funded under the Irish EPA Research Program 2014–2020, project number 2015-W-FS-17. The EPA Research Program is a Government of Ireland initiative funded by the Department of Communications, Climate Action and Environment.
Conflict of Interest Statement
The authors declare that the research was conducted in the absence of any commercial or financial relationships that could be construed as a potential conflict of interest.
Acknowledgments
We would like to thank the Irish Environmental Protection Agency and the Government of Ireland for the provision of research fellow status and funding for the JM. We would like to thank the steering committee for their input and guidance: Sorcha Ni Longphuirt (EPA), Tomasz Dabrowski (Marine Institute), Joe Silke (Marine Institute), Ronan Kane (Irish Water) and Trudy Higgins (Irish Water). We would like to thank Robert Wilkes (EPA) for the provision of macroalgae monitoring survey data. We would like to thank the United Kingdom Environment Agency for providing the DCPM model code under the United Kingdom open government license, the details of which are available at the following webpage: http://www.nationalarchives.gov.uk/doc/open-government-licence/version/3/. We would like to thank Paul Tett of the Scottish Association for Marine Science (SAMS) and John Aldridge of the United Kingdom Centre for Environment, Fisheries and Aquaculture Science (CEFAS) who co-developed the DCPM code, and Karen Edwards of the United Kingdom Environment Agency, for providing access to the DCPM code and arranging provision of the code under the United Kingdom open government license. We would also like to thank Per-Erik Mellander, Sara Vero and Ger Shortle of the Teagasc Agricultural Catchments Program, Johnstown Castle, Wexford, for providing hourly nutrient loading and streamflow data and daily rainfall data for the Timoleague catchment for 2010 and 2016 for this publication, which has yielded a greater insight into nutrient loading regimes.
Supplementary Material
The Supplementary Material for this article can be found online at: https://www.frontiersin.org/articles/10.3389/fmars.2019.00064/full#supplementary-material
References
Aldridge, J. A., Painting, S. J., Mills, D. K., Tett, P., Foden, J., and Winpenny, K. (2008). The Combined Phytoplankton and Macroalgae (CPM) Model: Predicting the Biological Response to Nutrient Inputs in Different Types of Estuaries in England and Wales. CEFAS Contract C1882 Report. Bristol: Environment Agency.
Aldridge, J. N., Painting, S., Tett, P., Capuzzo, E., and Mills, D. K. (2013). The Dynamic Combined Phytoplankton and Macroalgae (CPM) Model, Version 2.0.
Aldridge, J. N., Tett, P., Painting, S. J., Capuzzo, E., and Mills, D. K. (2010). The Dynamic Combined Phytoplankton and Macroalgae (CPM) Model: Technical Report. Contract C3290 Report. Bristol: Environment Agency.
Basu, N. B., Destouni, G., Jawitz, J. W., Thompson, S. E., Loukinova, N. V., Darracq, A., et al. (2010). Nutrient loads exported from managed catchments reveal emergent biogeochemical stationarity. Geophys. Res. Lett. 37:L23404. doi: 10.1029/2010GL045168
Bowes, M. J., Hilton, J., Irons, G. P., and Hornby, D. D. (2005). The relative contribution of sewage and diffuse phosphorus sources in the River Avon catchment, southern England: implications for nutrient management. Sci. Total Environ. 344, 67–81. doi: 10.1016/j.scitotenv.2005.02.006
Bowie, G. L., Mills, W. B., and Porcella, D. B. (1985). Rates, Constants and Kinetic Formulations in Surface Water Quality Modelling. Washington, DC: EPA.
Bree, T., Quinn, R., O’Rourke, F., Fitzpatrick, J., Walsh, R., Mills, P., et al. (2010). Estimation of flow for ungauged catchments. Paper Presented at the Continuing Professional Development Event of the Institution of Engineers of Ireland, Ballsbridge.
Burkholder, J. M., Tomasko, D. A., and Touchette, B. W. (2007). Seagrasses and eutrophication. J. Exp. Mar. Biol. Ecol. 350, 46–72. doi: 10.1016/j.jembe.2007.06.024
Chen, B., Zou, D., and Jiang, H. (2015). Elevated CO2 exacerbates competition for growth and photosynthesis between Gracilaria lemaneiformis and Ulva lactuca. Aquaculture 443, 49–55. doi: 10.1016/j.aquaculture.2015.03.009
Collins, A. L., Newell Price, J. P., Zhang, Y., Gooday, R., Naden, P. S., and Skirvin, D. (2018). Assessing the potential impacts of a revised set of on-farm nutrient and sediment ‘basic’ control measures for reducing agricultural diffuse pollution across England. Sci. Total Environ. 621, 1499–1511. doi: 10.1016/j.scitotenv.2017.10.078
Daly, D., Archbold, M., and Deakin, J. (2016). Progress and challenges in managing our catchments effectively. Biol. Environ. 116B, 157–166. doi: 10.3318/bioe.2016.16
Devlin, M. J., Barry, J., Mills, D. K., Gowen, R. J., Foden, J., Sivyer, D., et al. (2008). Relationships between suspended particulate material, light attenuation and Secchi depth in UK marine waters. Estuar. Coast. Shelf Sci. 79, 429–439. doi: 10.1016/j.ecss.2008.04.024
DOEHLG (2006). S.I. No. 378 of 2006 European Communities (Good Agricultural Practice for Protection of Waters) Regulations. Stationery Office. Dublin: DOEHLG.
DOEHLG (2009). S.I. No. 101 of 2009 European Communities (Good Agricultural Practice for Protection of Waters) Regulations. Stationery Office. Dublin: DOEHLG.
DOEHLG (2010). S.I. No. 610 of 2010 European Communities (Good Agricultural Practice for Protection of Waters) Regulations. Stationery Office. Dublin: DOEHLG.
DOEHLG (2014). S.I. No. 31 of 2014 European Communities (Good Agricultural Practice for Protection of Waters) Regulations. Stationery Office. Dublin: DOEHLG.
Duarte, C. M. (1995). Submerged aquatic vegetation in relation to different nutrient regimes. Ophelia 41, 87–112. doi: 10.1080/00785236.1995.10422039
Dupas, R., Mellander, P.-E., Gascuel-Odoux, C., Fovet, O., McAleer, E. B., McDonald, N. T., et al. (2017). The role of mobilisation and delivery processes on contrasting dissolved nitrogen and phosphorus exports in groundwater fed catchments. Sci. Total Environ. 59, 1275–1287. doi: 10.1016/j.scitotenv.2017.05.091
Dupas, R., Minaudo, C., Gruau, G., Ruiz, L., and Gascuel-Odoux, C. (2018). Multidecadal trajectory of riverine nitrogen and phosphorus dynamics in rural catchments. Water Resour. Res. 54, 5327–5340. doi: 10.1029/2018WR022905
European Commission (1991). Council Directive 91/676/EEC of 12 December 1991 Concerning the Protection of Waters Against Pollution Caused by Nitrates from Agricultural Sources. Available at: http://eur-lex.europa.eu/LexUriServ/LexUriServ.do?uri=CELEX:31991L0676:EN:HTML
European Environment Agency (2018). European Waters Assessment of Status and Pressures. EEA (No. 7/2018). Copenhagen: European Environment Agency.
Fanning, A., Craig, M., Webster, P., Bradley, C., Tierney, D., Wilkes, R., et al. (2017). Water Quality in Ireland 2010-2015. Wexford: EPA.
Fong, P., Boyer, K. E., Desmond, J. S., and Zedler, J. B. (1996). Salinity stress, nitrogen competition, and facilitation: what controls seasonal succession of two opportunistic green macroalgae? J. Exp. Mar. Biol. Ecol. 206, 203–221. doi: 10.1016/S0022-0981(96)02630-5
Gao, Z., Xu, D., Meng, C., Zhang, X., Wang, Y., Li, D., et al. (2014). The green tide-forming macroalga Ulva linza outcompetes the red macroalga Gracilaria lemaneiformis via allelopathy and fast nutrients uptake. Aquat. Ecol. 48, 53–62. doi: 10.1007/s10452-013-9465-9
Green-Gavrielidis, L., MacKechnie, F., Thornber, C., and Gomez-Chiarri, M. (2018). Bloom-forming macroalgae (Ulva spp.) inhibit the growth of co-occurring macroalgae and decrease eastern oyster larval survival. Mar. Ecol. Prog. Ser. 595, 27–37.
Hartnett, M., Dabrowski, T., and Olbert, A. (2011). A new formula to calculate residence times of tidal waterbodies. Water Manag. 164, 243–256.
Haygarth, P. M., Hepworth, L., and Jarvis, S. C. (1998). Forms of phosphorus transfer in hydrological pathways from soil under grazed grassland. Eur. J. Soil Sci. 49, 65–72. doi: 10.1046/j.1365-2389.1998.00131.x
Haygarth, P. M., Jarvie, H. P., Powers, S. M., Sharpley, A. N., Elser, J. J., Shen, J., et al. (2014). Sustainable phosphorus management and the need for a long-term perspective: the legacy hypothesis. Environ. Sci. Technol. 48, 8417–8419. doi: 10.1021/es502852s
Jarvie, H. P., Neal, C., and Withers, P. J. A. (2006). Sewage-effluent phosphorus: a greater risk to river eutrophication than agricultural phosphorus? Sci. Total Environ. 360, 246–253. doi: 10.1016/j.scitotenv.2005.08.038
Jordan, P., Melland, A. R., Mellander, P. E., Shortle, G., and Wall, D. (2012). The seasonality of phosphorus transfers from land to water: implications for trophic impacts and policy evaluation. Sci. Total Environ. 434, 101–109. doi: 10.1016/j.scitotenv.2011.12.070
Lydon, K., and Smith, G. (2014). CORINE Landcover 2012 Ireland FInal Report. Wexford: Environmental Protection Agency.
Marshall, J., Johnson, H., and Goodman, J. (2001). A study of the interaction of the North Atlantic oscillation with ocean circulation. J. Clim. 14, 1399–1421.
Melland, A. R., Fenton, O., and Jordan, P. (2018). Effects of agricultural land management changes on surface water quality: a review of meso-scale catchment research. Environ. Sci. Policy 84, 19–25. doi: 10.1016/j.envsci.2018.02.011
Mellander, P.-E., Jordan, P., Bechmann, M., Fovet, O., Shore, M. M., McDonald, N. T., et al. (2018). Integrated climate-chemical indicators of diffuse pollution from land to water. Sci. Rep. 8:944. doi: 10.1038/s41598-018-19143-1
Mockler, E. M., Deakin, J., Archbold, M., Gill, L., Daly, D., and Bruen, M. (2017). Sources of nitrogen and phosphorus emissions to Irish rivers and coastal waters: estimates from a nutrient load apportionment framework. Sci. Total Environ. 60, 326–339. doi: 10.1016/j.scitotenv.2017.05.186
Murphy, P. N. C., Mellander, P. E., Melland, A. R., Buckley, C., Shore, M., Shortle, G., et al. (2015). Variable response to phosphorus mitigation measures across the nutrient transfer continuum in a dairy grassland catchment. Agric. Ecosyst. Environ. 207, 192–202. doi: 10.1016/j.agee.2015.04.008
Nelson, T. A., Haberlin, K., Nelson, A. V., Ribarich, H., Hotchkiss, R., Alstyne, K. L. V., et al. (2008). Ecological and physiological controls of species composition in green macroalgal blooms. Ecology 89, 1287–1298. doi: 10.1890/07-0494.1
Nelson, T. A., and Lee, A. (2001). A manipulative experiment demonstrates that blooms of the macroalga Ulvaria obscura can reduce eelgrass shoot density. Aquat. Bot. 71, 149–154. doi: 10.1016/S0304-3770(01)00183-8
Ni Longphuirt, S., Mockler, E. M., O’Boyle, S., Wynne, C., and Stengel, D. B. (2016). Linking changes in nutrient source load to estuarine responses: an Irish perspective. Biol. Environ. 116B, 295–311. doi: 10.3318/bioe.2016.21
Ni Longphuirt, S., O’Boyle, S., and Stengel, D. B. (2015a). Environmental response of an Irish estuary to changing land management practices. Sci. Total Environ. 521–522, 388–399. doi: 10.1016/j.scitotenv.2015.03.076
Ni Longphuirt, S., OŠBoyle, S., Wilkes, R., Dabrowski, T., and Stengel, D. B. (2015b). Influence of Hydrological Regime in Determining the Response of Macroalgal Blooms to Nutrient Loading in Two Irish Estuaries. Estuaries Coast. 39, 478–494. doi: 10.1007/s12237-015-0009-5
O’Boyle, S., Wilkes, R., McDermott, G., and Longphuirt, S. N. (2017). Will recent improvements in estuarine water quality in Ireland be compromised by plans for increased agricultural production? A case study of the Blackwater estuary in southern Ireland. Ocean Coast. Manag. 143, 87–95. doi: 10.1016/j.ocecoaman.2016.12.020
O’Boyle, S., Wilkes, R., McDermott, G., Ní Longphuirt, S., and Murray, C. (2015). Factors affecting the accumulation of phytoplankton biomass in Irish estuaries and nearshore coastal waters: a conceptual model. Estuar. Coast. Shelf Sci. 155, 75–88. doi: 10.1016/j.ecss.2015.01.007
Parages, M., Figueroa, F., Conde-Álvarez, R., and Jiménez, C. (2014). Phosphorylation of MAPK-like proteins in three intertidal macroalgae under stress conditions. Aquat. Biol. 22, 213–226.
Redfield, A. C. (1934). The haemocyanins. Biol. Rev. 9, 175–212. doi: 10.1111/j.1469-185X.1934.tb01002.x
Roberts, T. L., and Johnston, A. E. (2015). Phosphorus use efficiency and management in agriculture. Resour. Conserv. Recy. 105, 275–281. doi: 10.1016/j.resconrec.2015.09.013
Scarrott, R. M. J., Reed, D. W., and Bayliss, A. C. (1999). “Chapter 4. Indexing the attenuation effect attributable to reservoirs and lakes,” in Flood Estimation Handbook, eds A. Robson and D. Reed (Wallingford: Centre for Ecology & Hydrology), 19–26.
Schoumans, O. F., Bouraoui, F., Kabbe, C., Oenema, O., and van Dijk, K. C. (2015). Phosphorus management in Europe in a changing world. AMBIO 44, 180–192. doi: 10.1007/s13280-014-0613-9
Schulte, R. P. O., Melland, A. R., Fenton, O., Herlihy, M., Richards, K., and Jordan, P. (2010). Modelling soil phosphorus decline: expectations of water framework directive policies. Environ. Sci. Policy 13, 472–484. doi: 10.1016/j.envsci.2010.06.002
Sharpley, A. N., Bergström, L., Aronsson, H., Bechmann, M., Bolster, C. H., Börling, K., et al. (2015). Future agriculture with minimized phosphorus losses to waters: research needs and direction. AMBIO 44, 163–179. doi: 10.1007/s13280-014-0612-x
Shore, M., Murphy, S., Mellander, P.-E., Shortle, G., Melland, A. R., Crockford, L., et al. (2017). Influence of stormflow and baseflow phosphorus pressures on stream ecology in agricultural catchments. Sci. Total Environ. 590, 469–483. doi: 10.1016/j.scitotenv.2017.02.100
Shortle, G., and Jordan, P. (2017). Agricultural Catchments Programme Phase 2 Report. Wexford: Teagasc.
Valiela, I., McClelland, J., Hauxwell, J., Behr, P. J., Hersh, D., and Foreman, K. (2003). Macroalgal blooms in shallow estuaries: controls and ecophysiological and ecosystem consequences. Limnol. Oceanogr. 42, 1105–1118. doi: 10.4319/lo.1997.42.5_part_2.1105
Van Alstyne, K. L., Nelson, T. A., and Ridgway, R. L. (2015). Environmental chemistry and chemical ecology of “green tide” seaweed blooms. Integr. Comp. Biol. 55, 518–532. doi: 10.1093/icb/icv035
Wan, A. H. L., Wilkes, R. J., Heesch, S., Bermejo, R., Johnson, M. P., and Morrison, L. (2017). Assessment and characterisation of Ireland’s green tides (Ulva Species). PLoS One 12:e0169049. doi: 10.1371/journal.pone.0169049
Wells, E., Best, M., Scanlan, C., and Foden, J. (2009). Water Framework Directive Development of Classification Tools for Ecological Assessment: Opportunistic Macroalgae Blooming. Stirling: WFD-UKTAG.
Whitehouse, L. N. A., and Lapointe, B. E. (2015). Comparative ecophysiology of bloom-forming macroalgae in the Indian River Lagoon, Florida: Ulva lactuca, Hypnea musciformis, and Gracilaria tikvahiae. J. Exp. Mar. Biol. Ecol. 471, 208–216. doi: 10.1016/j.jembe.2015.06.012
Young, C. S., and Gobler, C. J. (2017). The organizing effects of elevated CO2 on competition among estuarine primary producers. Sci. Rep. 7:7667. doi: 10.1038/s41598-017-08178-5
Keywords: macroalgae, biophysical model, agriculture, catchment management, flow-load relationship
Citation: McGovern JV, Nash S and Hartnett M (2019) Interannual Improvement in Sea Lettuce Blooms in an Agricultural Catchment. Front. Mar. Sci. 6:64. doi: 10.3389/fmars.2019.00064
Received: 01 October 2018; Accepted: 05 February 2019;
Published: 18 March 2019.
Edited by:
Marianne Holmer, University of Southern Denmark, DenmarkReviewed by:
Autumn Oczkowski, Environmental Protection Agency (EPA), United StatesKapuli Gani Mohamed Thameemul Ansari, Indian Institute of Science Education and Research Kolkata, India
Copyright © 2019 McGovern, Nash and Hartnett. This is an open-access article distributed under the terms of the Creative Commons Attribution License (CC BY). The use, distribution or reproduction in other forums is permitted, provided the original author(s) and the copyright owner(s) are credited and that the original publication in this journal is cited, in accordance with accepted academic practice. No use, distribution or reproduction is permitted which does not comply with these terms.
*Correspondence: Joseph V. McGovern, am9lLm1jZ292ZXJuQG1hcmluZS5pZQ==