 Richard D. Brodeur
 Toby D. Auth2
- 1NOAA Fisheries, NWFSC, Fish Ecology Division Hatfield Marine Science Center, Newport, OR, United States
- 2Pacific States Marine Fisheries Commission, Newport, OR, United States
- 3College of Earth, Ocean, and Atmospheric Sciences, Oregon State University, Corvallis, OR, United States
The community structure of pelagic zooplankton and micronekton may be a sensitive indicator of changes in environmental conditions within the California Current ecosystem. Substantial oceanographic changes in 2015 and 2016, due to the anomalously warm ocean conditions associated with a large-scale marine heatwave perturbation, resulted in onshore and northward advection of warmer and more stratified surface waters resulting in reduced upwelling. Here we quantify changes in the macrozooplankton and micronekton community composition and structure based on five highly contrasting ocean conditions. Data from fine-mesh pelagic trawl surveys conducted off Oregon and Washington during early summer of 2011 and 2013–2016 were examined for interannual changes in spatial distribution and abundance of fish and invertebrate taxa. Overall species diversity was highest in 2015 and lowest in 2011, but 2016 was similar to the other years, although the evenness was somewhat lower. The community of taxa in both 2015 and 2016 was significantly different from the previously sampled years. Crustacean plankton densities (especially Euphausiidae) were extremely low in both of these years, and the invertebrate composition became dominated mostly by gelatinous zooplankton. Fishes and cephalopods showed mixed trends overall, but some species such as age-0 Pacific hake were found in relatively high abundances mainly along the shelf break in 2015 and 2016. These results suggest dramatically different pelagic communities were present during the recent warm years with a greater contribution from offshore taxa, especially gelatinous taxa, during 2015 and 2016. The substantial reorganization of the pelagic community has the potential to lead to major alterations in trophic functioning in this normally productive ecosystem.
Introduction
Changes in global climate patterns are driving ecosystem responses in coastal and open oceans around the world. These systems are undergoing significant physical and chemical changes due to buildup of greenhouse gases, including increases in ocean temperature and acidification, decreases in dissolved oxygen concentrations, changes in circulation patterns, and alterations to freshwater inputs into the coastal ocean (Hoegh-Guldberg and Bruno, 2010; Doney et al., 2012; Howard et al., 2013; Hewitt et al., 2016). These stressors have had a multitude of effects, including changes in productivity, phenology, and species distributions relative to the historical record (Poloczanska et al., 2016).
Among the stressors resulting from climate change in marine ecosystems, increases in ocean temperatures are likely to affect marine organisms the most, leading to poleward or deeper shifts in distribution, anomalous timing of life history events, and changes in physiology required to adapt to the warmer conditions (Doney et al., 2012; Hauser et al., 2016; Poloczanska et al., 2016). In addition to the long-term secular warming observed in many marine ecosystems, a more recent phenomenon has been the increased occurrence and severity of anomalous warming events, termed marine heat waves (MHWs, Hobday et al., 2016, 2018; Scannell et al., 2016; Oliver et al., 2018). To date, most of the impacts of these MHWs have been documented for demersal habitats and their effects of pelagic ecosystems are poorly known.
The northern California Current (NCC) is a highly productive upwelling region that stretches from Vancouver Island, Canada to Cape Mendocino in California. The high productivity can be attributed to intense seasonal upwelling, but also to retention on the shelf of nutrients from river runoff and other sources (Hickey and Banas, 2008). The NCC undergoes substantial variability in temperature related to local and remote forcing, and may fluctuate between warm and cold periods on a regular basis (Fiedler and Mantua, 2017) with apparent increasing frequency in the recent decades (Sydeman et al., 2013). Well beyond this normal variability, conditions since 2014 have been extraordinary due to the development of the so-called “warm blob” that covered much of the Subarctic North Pacific Ocean (Bond et al., 2015) followed by the northward progression of a major tropical El Niño (Jacox et al., 2016). The superposition of several anomalous atmospheric and oceanographic drivers resulted in a prolonged MHW, with temperature anomalies of 2–3°C affecting the entire California Current (Di Lorenzo and Mantua, 2016; Jacox et al., 2018). Profound ecosystem effects have been attributed to this anomaly including changes in species abundance and distribution patterns, spawning occurrence, feeding, and mass mortalities (Cavole et al., 2016; Di Lorenzo and Mantua, 2016; McClatchie et al., 2016; Daly et al., 2017; Peterson et al., 2017; Auth et al., 2018; Jacox et al., 2018). Among the MHWs recognized to have occurred in recent decades, this North Pacific event had the longest duration by far (711 days–almost three times longer than any other heatwave) and was classified as a Category III (Severe) event, among the strongest in terms of intensity (Hobday et al., 2018). These MHW events have had devastating biodiversity and economic consequences for both temperate and tropical ecosystems in many parts of the world's oceans (Mills et al., 2013; Wernberg et al., 2013; Smale et al., 2019), and are predicted to be more intense and common under current climate projection scenarios (Frölicher et al., 2018).
Most of the climate-related changes documented so far in the NCC have been made for smaller planktonic and larger nektonic species which tend to be extensively sampled through time and therefore possess a well-established baseline of normal distribution and abundance patterns. Although sampled extensively during some periods (e.g., Brodeur et al., 2003; Phillips et al., 2009), the intermediate trophic level referred to as macrozooplankton (euphausiids and other large sized zooplankton) and micronekton (i.e., large crustaceans and small fish and squid) has been substantially less sampled and on an intermittent basis, such that the effects of major environmental perturbations are not as well known (Brodeur et al., 2006). Off California, the pronounced effects of the 2015 “warm blob” have recently been documented for this community (Sakuma et al., 2016; Santora et al., 2017), but to date there exists no similar studies of the effect of the recent anomalous marine heatwave on macrozooplankton and micronekton in the northern region of the California Current.
In this paper, we analyze environmental and trawl catch data from 5 years that were highly variable oceanographically based on early summer surveys of the NCC. We examine the trawl catches in terms of overall species richness, diversity, and evenness, and then analyze the community structure of the dominant taxa in relation to the varying ocean conditions, with special emphasis on the recent MHW. Our overarching hypothesis is that the recent extreme warming will affect locally-adapted taxa most heavily and introduce novel species to the system, resulting in major changes to ecosystem standing stocks and production.
Materials and Methods
Sampling Procedures
Trawl samples from a total of 212 hauls were collected from five annual cruises between late-May and early-July 2011 and 2013-16: June 1–16, 2011; June 23-July 6, 2013; June 18–28, 2014; May 30-June 9, 2015; and June 13–25, 2016. Samples were collected at 3–5 predetermined stations (4–6 stations in 2011) extending ~7–92 km offshore at ~20 km intervals along each of 10 transects at 0.5°-latitude lines from 42 to 46.5°N off the Oregon and southern Washington coasts, for a total of ~ 40 stations per annual cruise (54 stations in 2011; Figure 1).
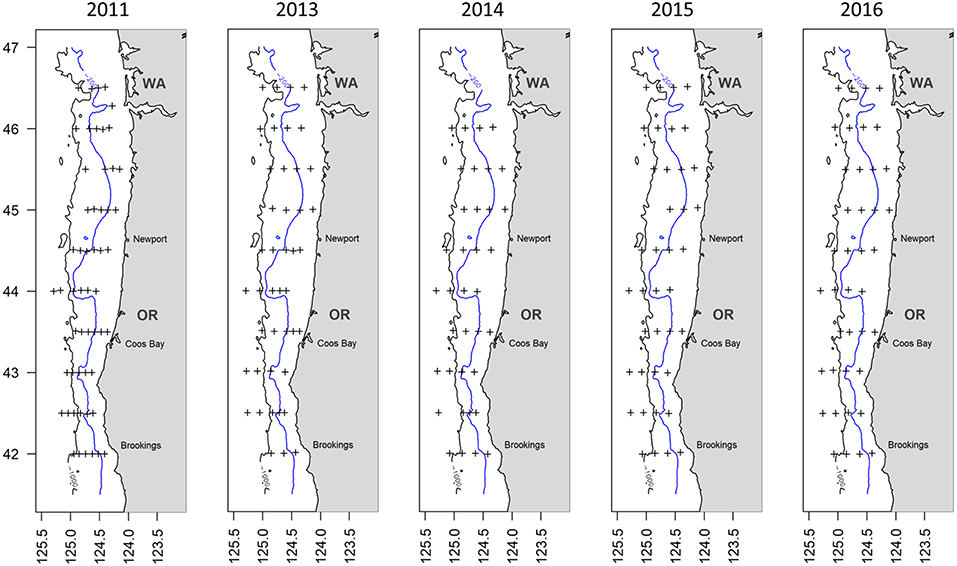
Figure 1. Location of stations (plus signs) used in the analysis for each year. Also shown are the 200-m (blue line) and 1,000-m (black line) isobaths which delineate the depth strata.
Samples were collected at night using a modified-Cobb midwater trawl (MWT) with a 26-m headrope towed for 15 min (~1 km) at an average ship speed of 3.7 km h−1. The mouth opening was estimated to be ~144 m3 (Sakuma et al., 2016). The outside net mesh size (stretched) decreased from 152 mm in the wings and body to 38 mm in the codend but the net had a 9.5 mm liner. Target depth range of sampling was between 30 and 42 m for each tow. At two stations sampled in 2016, we conducted a series of three consecutive night time tows to examine the vertical distribution of our main species (see below). These tows were done at the normal target depth and also one tow shallower and another deeper in randomized order. Each tow started with 25–85 m of wire out with adjustments made if target depth was not obtained, as determined from depth recordings collected from time-depth recorders (TDRs) and the ship's acoustic trawl net monitoring sensors, which were attached to the net during each tow. Ship speed was adjusted while trawling to maintain target depth (using the acoustic trawl net monitoring system) while the amount of wire out remained fixed. Temperature (°C), salinity, density (sigma theta, kg m−3), chlorophyll a (mg m−3), turbidity (mg m−3), dissolved oxygen concentration (DO, ml L−1), and DO saturation (%) were measured throughout the water column (to a maximum depth of 500 m) at each station during the day using a Seabird SBE 43 CTD (Sea-Bird Electronics Inc., Bellevue, WA, USA). Not all environmental parameters were measured at all stations due to periodic instrumentation malfunctions.
All organisms (except for Cancer spp. megalopae and zoeae, and smaller gelatinous taxa such as Pleurobrachia spp., Mitrocomidae, and Cymbuliidae) collected from each sample were sorted, measured, counted, and identified to the lowest taxonomic level possible at sea according to a standard sample processing protocol (see below). Certain appropriate fish species were separated into two stage categories and processed separately: adult and young (mostly age-0 fish that have not yet achieved adult characteristics). Other fish and all invertebrate taxa were categorized as undetermined stage (U). All pelagic juvenile Sebastes spp. were frozen for later identification to species or species groups in the laboratory. For the sample processing protocol, if the sample was small (i.e., there did not appear to be >30 individuals from any one taxon), then all organisms of concern in the sample were sorted, identified, counted, and measured. If not, then we measured the smallest random subsample (based on volume; ml) that yielded at least 30 individuals from the most numerous taxon and processed completely as described above. We continued to measure out, and process completely, sequential subsamples (based on the smallest volume that yielded at least 30 individuals from the next numerous taxon total from the second, third, fourth, etc. subsamples combined) until at least 30 individuals or the entirety of individuals from all taxa had been processed. We then measured the total volume of the full sample, and scaled up the total counts of each taxon based on the proportion of the subsample volumes for each taxon to the total sample volume.
Data Analyses
The total number of individuals per taxon collected in each haul was used as the basic measure for all analyses, since the tow duration and mouth opening (and therefore volume of water filtered) was assumed to be uniform for all tows. Taxon richness, diversity, and evenness were analyzed based on all identifiable collected taxa except for Euphausiidae (n = 141), which when present were often disproportionally more numerous than any other taxon. Both adult and juvenile individuals were combined for taxa that had representatives of both stages. This resulted in a matrix of 111 taxa and 177 stations. Richness was defined as the number of different taxa present in a haul. The Shannon diversity index (H') was used to measure diversity, where higher H' values denote greater diversity. Evenness was assessed using Pielou's evenness index (J'), which ranges from 0 to 1, with the maximum J' value indicating that all taxa are represented in the same relative concentrations. Both H' and J' were calculated according to the formulas found in Shannon and Weaver (1949) and Krebs (1989). Hauls where 0–1 individuals were collected were not included in the analyses because richness, J′, and H′ cannot be calculated (although richness = 0 at n = 1 taxon). The software utilized to calculate the richness, diversity, and evenness indices was the PRIMER 7 statistical software package (Clarke and Gorley, 2015). Significant differences among years in these indices were tested using the non-parametric Kruskal-Wallis One Way ANOVA followed by a Dunn's Test.
We restricted our analysis of community structure to the common taxa by removing taxa not found in at least 10% of the collections. This resulted in a matrix of 38 taxa and 176 collections. To minimize the importance of the most abundant taxa, we fourth-root transformed the abundance data and conducted multivariate analyses on data grouping by year, area, and depth categories (Clarke and Gorley, 2015). For the depth categories, we grouped the data in depth-strata bins with bottom depth < 200 m (shelf), between 200 and 1,000 m (slope), and >1,000 m (offshore). To examine regional differences, we divided the entire sampling area into three latitudinal strata with stratum boundaries at 44.75 and 43.25°N, such that all strata contained 3–4 transects of sampling.
We used Principal Coordinate Analysis (PCoA) to resolve patterns in the communities in relation to our three factors. PCoA reduces the dimensionality of complex data matrices by transforming dissimilarities in sample compositions and uses rank transformation to describe non-linear distributions, as commonly found when examining the spatial distribution of organisms (McCune and Grace, 2002). Dissimilarities between sample units (trawls) were calculated using the Bray-Curtis (Sørensen) measure (McCune and Grace, 2002). Analysis of the stress statistic indicated that two axes were appropriate for this dataset. PCoA plots were rotated such that the greatest variation in the data was represented by axis 1. We overlaid vectors of the four main in situ environmental variables sampled (temperature, salinity, chlorophyll a, and dissolved oxygen at 30 m) on the first two axes to show their explanatory contributions to the ordination.
Community differences were explored using a non-parametric Multi-Response Permutation Procedure (MRPP) to test for significant annual, cross-shelf, and regional community changes. The MRPP generates an A-statistic ranging from 0 to 1 with the maximum value indicating complete agreement between groups (McCune and Grace, 2002). To determine which taxa contributed to significant annual, depth, or regional differences, Indicator Species Analysis (ISA) was also performed on fourth-root transformed abundance data using 5000 random restarts for each Monte Carlo simulation to test taxonomic fidelity within each group (Dufrêne and Legendre, 1997). All MRPP and ISA analyses were performed using PC-Ord Version 5 statistical software (McCune and Mefford, 2006).
Contour Maps were made in R [version 3.5.2, (R Core Team, 2015)] with the “akima” package using the function “interp.” The function “interp” implements bivariate interpolation onto a grid for irregularly spaced input data (Akima, 1996). The function “interp” is meant for cases in which x, y values are scattered over a plane with a corresponding z value for each. The abundance data were transformed: ln(number + 1). To allow for better comparison of the plots, the contour plots are displayed on the same scale for all years.
Results
Physical Environment
Although the warm blob first appeared in the Gulf of Alaska in the winter of 2013–2014, strong upwelling anomalies in the summer of 2014 kept the surface signature of the warm anomaly off the Oregon shelf until relaxation in mid-September of 2014 (Peterson et al., 2017). This delay can be seen in the sea surface temperature (SST) anomaly plot for the study area since 2011 (Supplementary Figure 1). The SST values exceeded the threshold for a MHW event throughout much of the following winter and spring before returning to near the 1983–2012 climatological mean in late spring of 2015. This was followed by another extended period of anomalous warm water from the fall of 2015 to the spring of 2016 (Supplementary Figure 1). There was another short but highly anomalous warm period in the fall of 2016, subsequently returning to near-normal conditions by that winter.
Temperatures at the depth of the trawl headrope (30 m) averaged over all stations showed that 2011 had cool but not extreme temperatures (median ~9.5°C), but significantly lower temperatures were observed in 2013 indicative of new-upwelled water (Dunn's Multiple Comparison Test, all p < 0.001; Figure 2). Temperatures increased for the next 3 years, with 2015 and especially 2016 being exceptional as compared to normal June temperatures. Salinities at 30 m depth were similar overall, with 2011 being slightly lower than the other 4 years (Figure 2). Dissolved oxygen was more variable, with the highest value in 2015 and relatively low levels in 2013 and 2014, but all years were well above the level demarcating hypoxic conditions (1.4 mL l−1, Figure 2). Chlorophyll a concentrations were more variable, with low levels in 2013 and 2014 and highly variable levels in 2011 and 2015, with only 2015 being significantly higher than the other years (all p < 0.001; Figure 2).
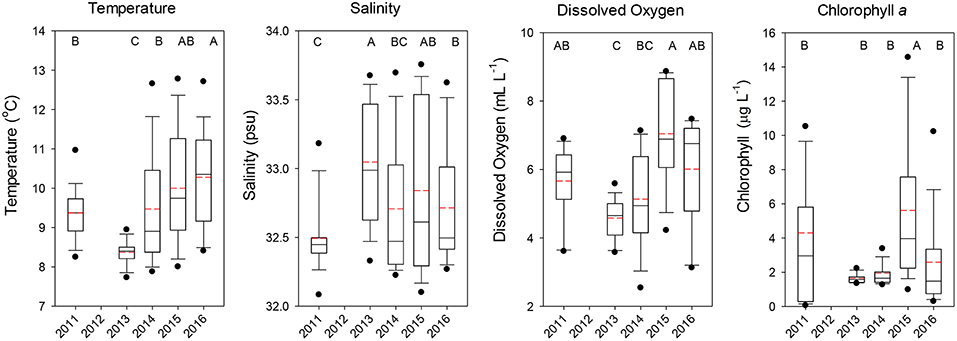
Figure 2. Boxplots of the temperature, salinity, dissolved oxygen, and chlorophyll a observed at the depth of the top of the trawl (30 m) for all stations combined by year. The lower boundary of the box indicates the 25th percentile, a line within the box marks the median, and the upper boundary of the box indicates the 75th percentile. Whiskers (error bars) and data points above and below the box indicate the 90 and 10th percentiles and 95 and 5th percentiles, respectively. Dashed red line indicates the mean value. Years with significantly (p < 0.05) different values are designated with different letters on the top of each graph.
These interannual differences were also reflected in vertical profiles taken at the same location (station at 43.0°N, 124.5°W, 49.8 km off of Coos Bay, Oregon) all 5 years (Figure 3). The water column at this location in 2013 was well-mixed and relatively cool throughout, typical of upwelling conditions, whereas it was well stratified in 2015 and 2016, with a thermocline at or slightly above the sampling strata. Salinity showed a gradual increase with depth, with only 2011 showing the presence of fresher water at the surface above the trawl sampling depths (Figure 3). Dissolved oxygen showed a relatively slow decline with depth in all years, with 2015 exhibiting the highest oxygen levels at most depths (Figure 3). Finally, chlorophyll was most variable, with 2011, 2015, and 2016 having subsurface chlorophyll a maxima around the trawl depth, with a second maximum around 100 m in 2015 (Figure 3).
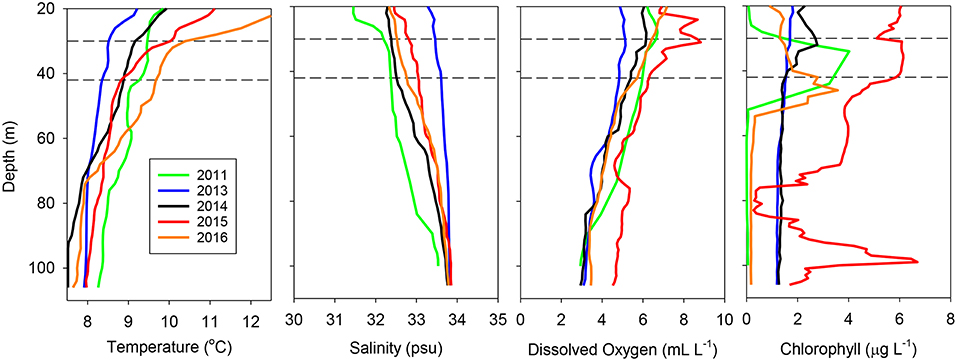
Figure 3. Temperature, salinity, dissolved oxygen, and chlorophyll a profiles for the same station (43.0°N, 124.5°W) during each of the years examined. The horizontal dashed lines represent the approximate depth interval sampled by the trawl at all stations.
Catch and Diversity Patterns
A total of over a million individuals were caught representing ~142 taxa in the trawls examined. Of these, 43 taxa were represented by more than 100 individuals captured (Table 1). Euphausiids represented the bulk of the catch and were >95% of the total catch in this group. Two crustacean species, the pink shrimp (Pandalus jordani) and the glass shrimp (Sergestes similis), were also among the dominant taxa caught. Several gelatinous taxa (i.e., the pelagic tunicates Salpa spp., Thetys vagina, and Pyrosoma atlanticum, and the hydrozoan Aequorea victoria) were very abundant some years but were scarce in others (Table 1). Teleost fishes were the most diverse group among these dominant taxa (24 out of 43), but only three fell within the top ten by abundance ranking—two were mesopelagic lanternfish species (i.e., Stenobrachius leucopsarus and Tarletonbeania crenularis) and the other was age-0 Pacific hake (Merluccius productus). The last major taxonomic group, Cephalopoda, was dominated by the black-tip squid (Abraliopsis felis) and the clawed armhook squid (Gonatus onyx) (Table 1).
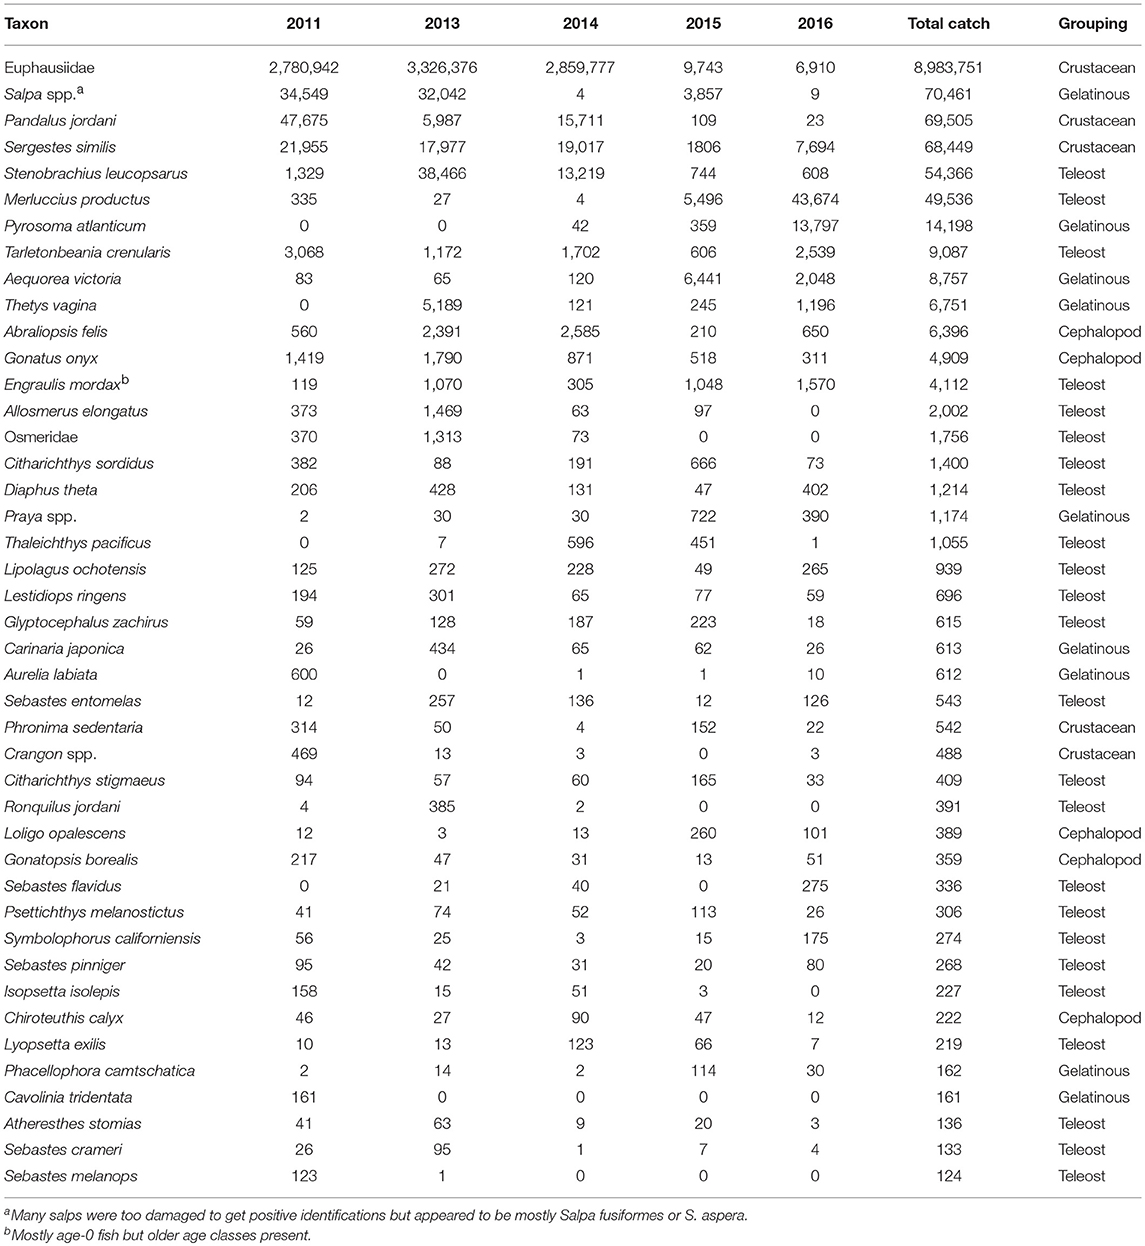
Table 1. Yearly abundance of the dominant taxa collected in the trawls by year ranked by total catch for all years combined.
The average number of species caught at each station was significantly lower (median = 7) for 2011 (Dunn's Multiple Comparison Tests, all p < 0.001), whereas the other years had similar mean numbers of species caught (median = 14–16; Figure 4). Similarly for Shannon diversity, 2011 and 2016 were the lowest years overall, but were only significantly lower than 2015, which had the highest value of the 5 years examined (Figure 4). Pielou's evenness was not significantly different among the first 4 years, but 2016 had a significantly lower evenness (median J′ = 0.364; all p < 0.035; Figure 4) due to the dominance of a few taxa such as Salpa spp., M. productus, and P. atlanticum that were extremely abundant at a few stations (Table 1, Supplementary Figure 2).
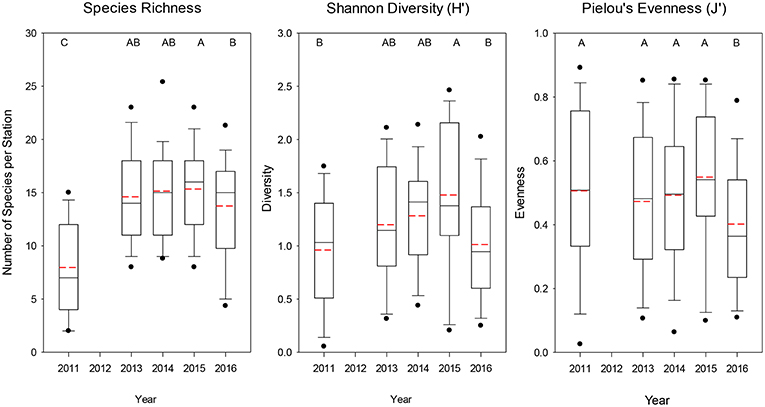
Figure 4. Boxplots of overall species richness, Shannon diversity index, and Pielou's evenness index for all trawls included for each year. The lower boundary of the box indicates the 25th percentile, a line within the box marks the median, and the upper boundary of the box indicates the 75th percentile. Whiskers (error bars) and data points above and below the box indicate the 90 and 10th percentiles and 95 and 5th percentiles, respectively. Dashed red line indicates the mean value. Years with significantly (p < 0.05) different values are designated with different letters on the top of each graph.
The sum of the total annual abundances by the four major taxonomic groupings (i.e., cephalopods, crustaceans, gelatinous, and teleosts) showed significant shifts during the 5 years of sampling (Figure 5). The first 3 years were dominated by crustaceans (mainly euphausiids but also P. jordani and S. similis) which were located throughout the sampling region (Figure 5B). Crustaceans continued to be an important group, but their abundances decreased by several orders of magnitude during 2015 and 2016. They were supplanted as the top group by gelatinous taxa during these 2 years, which were more evenly spread throughout the shelf (Figure 5C). Teleosts and cephalopods showed a mixed pattern but both were fairly important in 2013 and 2014 (Figure 5A and AD), whereas teleosts were equally important in 2016 mainly due to a high number of M. productus caught in the northern part of the survey area that year (Table 1, Supplementary Figure 2).
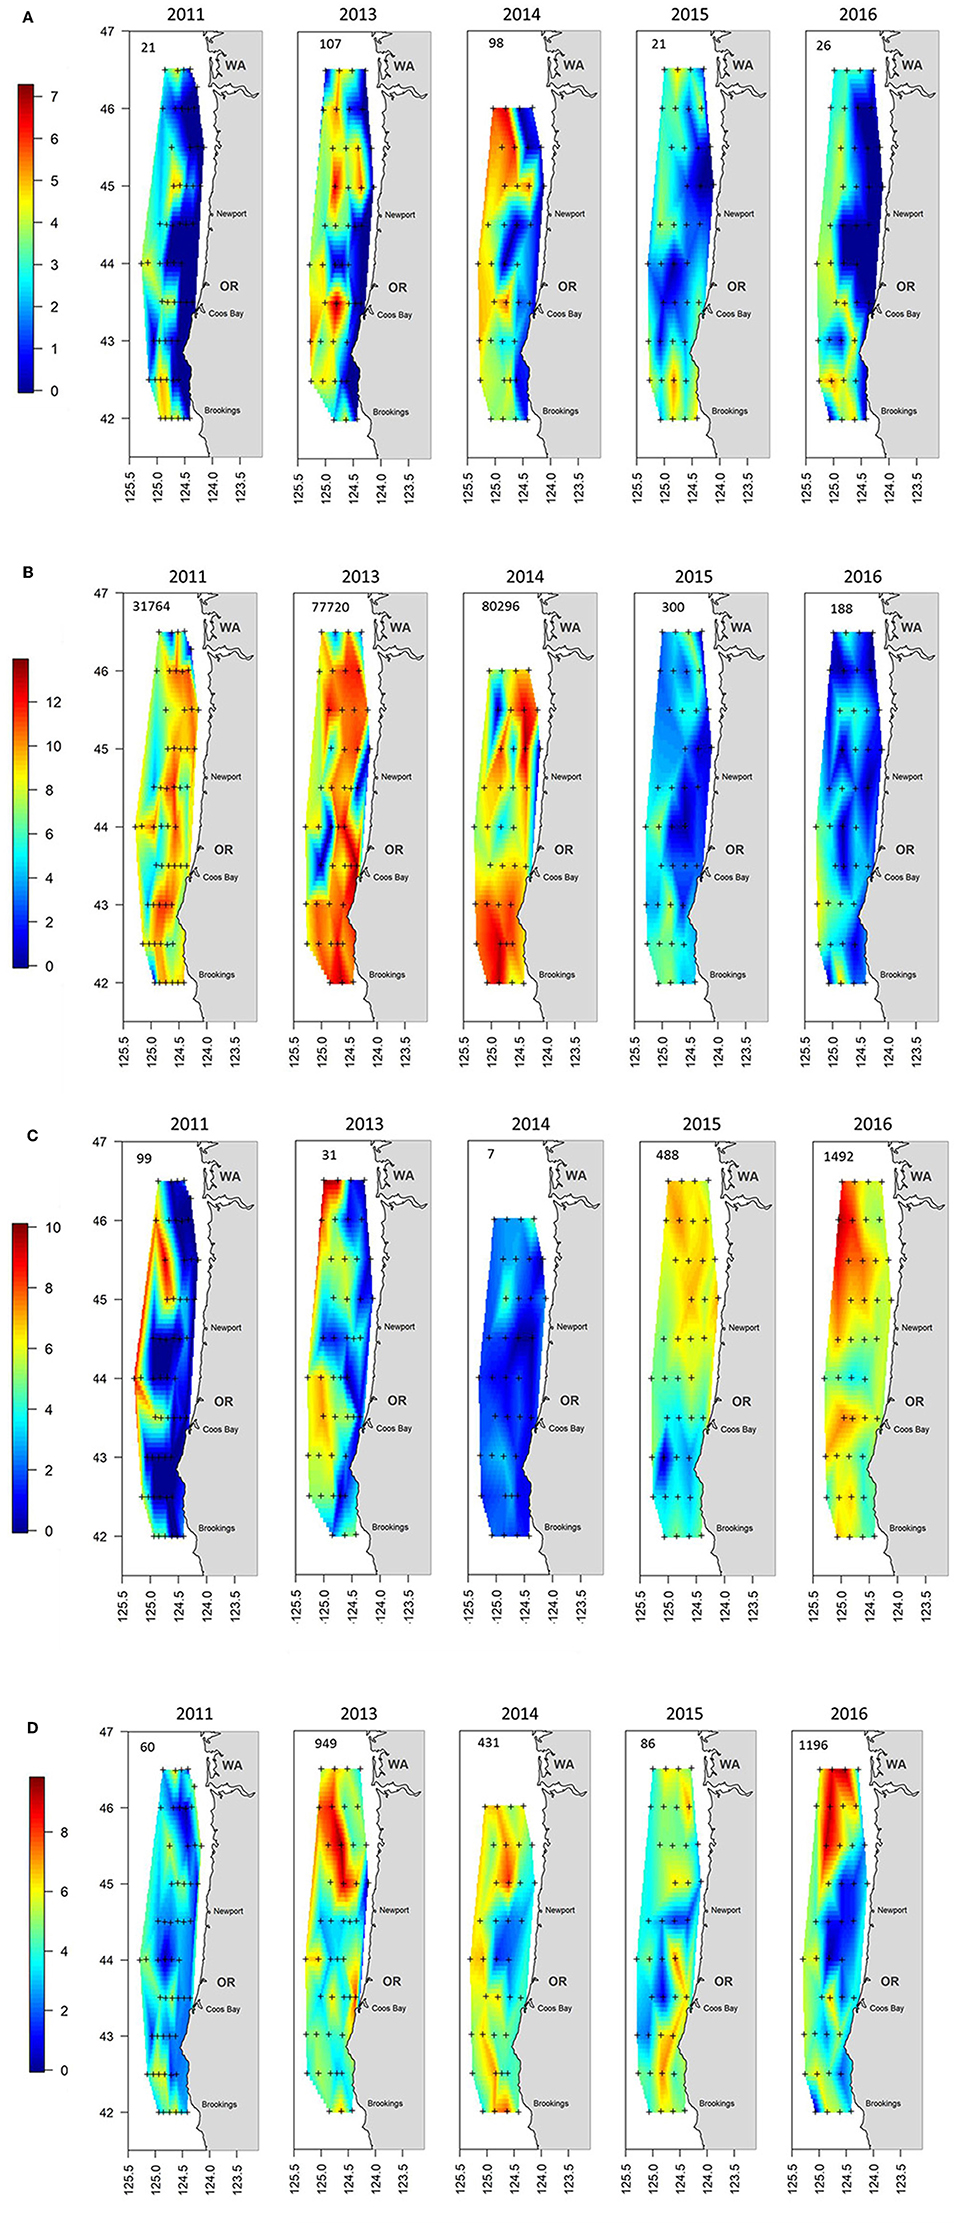
Figure 5. Distribution maps of the catch by year for the aggregated groupings of (A) Cephalopods, (B) Crustacea, (C) Gelatinous, and (D) Teleosts. The number in the upper left of each panel indicates the geometric mean catch of that grouping per haul by year. Note that the scale bar is logarithmic. The plus signs indicate locations where trawling was conducted.
Community Analysis
The Principal Coordinate Ordination revealed some differences among the stations grouped by year (Figure 6). The first 3 years (2011, 2013, and 2014) overlapped somewhat in ordination space, and none of the years were significantly different from each other (MRPP, all p > 0.05). In contrast, 2015 and to a greater extent 2016 were more distinct in multivariate space, and were distinguished from the other years mainly along the second PCoA axis (Figure 6). These 2 years were significantly different (MRPP, p < 0.05) from each other and individually from all the other years. The taxa most influential in driving the first two ordination axes (vectors on Figure 6) were butter sole Isopsetta isolepis (indicative of cooler, inshore stations), T. crenularis (indicative of cooler, offshore stations), A. victoria (indicative of warmer, inshore stations), and P. atlanticum (indicative of warmer, offshore stations). The results of the ISA analysis (Figure 7) show that at least a third of the assemblages showed overlap among the first 3 years, although 2011 had substantially different indicator species compared to 2013 and 2014, which had two of their top three indicator species in common. In contrast, 2015 and 2016 shared many of the same dominant indicator species despite being significantly different in terms of their overall assemblages (Figure 7).
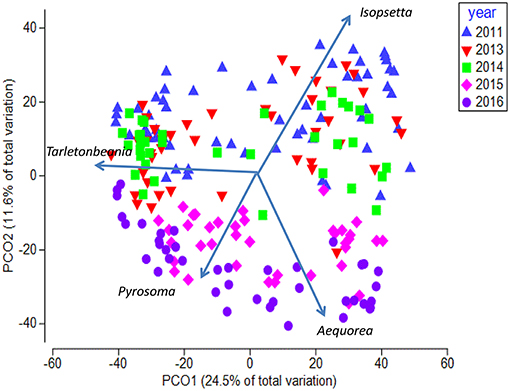
Figure 6. Principal Coordinate Analysis biplot for first two axes showing yearly differences. Each symbol represents the catch of a single trawl. Overlaid are the vectors for the most influential species driving the observed differences in species composition. The amount of variance explained by each axis is shown on the axes labels.
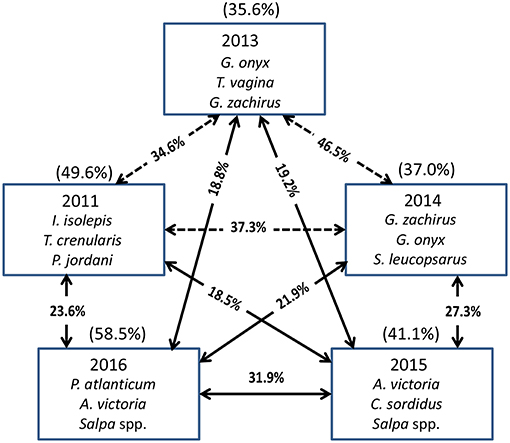
Figure 7. The top three species contributing to the assemblages each year based on Indicator Species Analysis (ISA). Their cumulative percentage contribution to the total assemblage is given in parentheses above each box. The percentage similarity between year pairs is shown on the arrows between the boxes. The solid arrows connect years that are significantly different from each other (MRPP, p < 0.05), whereas the dashed arrows connect years that are not significantly different from each other.
When the stations were displayed in terms of their bottom depth, a clear segregation was observed along the first axis between the inshore shelf stations (< 200 m, mostly positive values on PCO1) and the other two depth strata (mostly negative values on PCO2; Figure 8). The shelf stratum (< 200 m) was significantly different from both offshore strata (ANOSIM, p < 0.05), whereas the offshore two depth strata were not significantly different from each other (p = 0.17). Temperature was negatively and salinity was positively associated with axis 2, whereas chlorophyll a (higher inshore) and to a lesser extent dissolved oxygen (higher offshore) were associated with axis 1 (vectors on Figure 8).
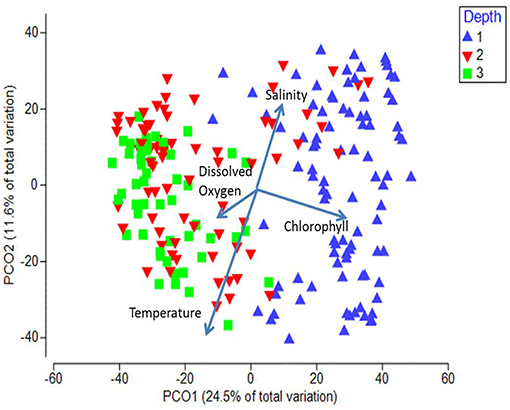
Figure 8. Principal Coordinate Analysis biplot for first two axes showing depth differences. Each symbol represents the catch of a single trawl. Depth strata are as follows: 1 = < 200 m, 2 = 200–1,000 m, 3 = >1,000 m. The amount of variance explained by each axis is shown on the axes labels. Overlaid are the vectors of the environmental parameters measured at each station.
In terms of indicator species, the shelf stations were represented by A. victoria and two age-0 flatfish species (i.e., Citharichthys sordidus and Glyptocephalus zachirus), while the slope and offshore groupings were characterized by two squid species and two myctophid fish species (Figure 9). When examined by latitudinal geographic areas, none of the three regions had significantly different overall taxonomic compositions from the others (ANOSIM, all p > 0.05), indicating that there was a general continuous distribution of these micronekton along the shelf in the study area for most of the taxa examined.
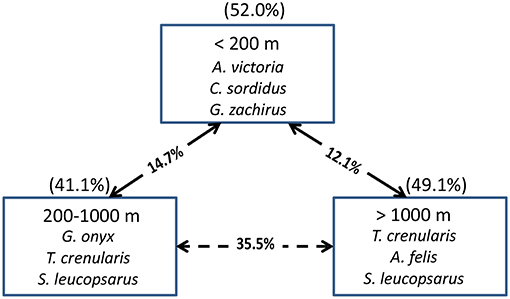
Figure 9. The top three species contributing to the assemblages in each depth strata for all years combined based on Indicator Species Analysis (ISA). Their cumulative percentage contribution to the total assemblage is given in parentheses above each box. The percentage similarity between depth strata pairs is shown on the arrows between the boxes. The solid arrows connect depth strata that are significantly different from each other (MRPP, p < 0.05), whereas the dashed arrows connect depth strata that are not significantly different from each other.
Discussion
These results depict a major upwelling ecosystem that has undergone dramatic changes resulting from an extraordinary and unprecedented environmental perturbance lasting multiple years. Consistent sampling using standardized methodology makes it possible to capture differences in species diversity, distribution, and abundance patterns as they evolved in response to the dramatic physical changes. Similar changes have already been documented in the NCC for lower trophic levels such as zooplankton and ichthyoplankton (Peterson et al., 2017; Auth et al., 2018). This shift followed the neritic arrival of the “warm blob” water mass that came onto the Oregon shelf in September 2014 (Peterson et al., 2017), resulting in large positive SST anomalies that remained until at least September of 2017 (Gentemann et al., 2017). Although above-average upwelling winds were evident off Newport, Oregon in the spring of both 2015 and 2016, the resulting cool water was found mainly nearshore and off southern Oregon, and these waters had warmed to above average SSTs by mid-summer (Gentemann et al., 2017). Although we show substantial changes in water temperature and other variables before and after the MHW event, it is beyond the scope of this paper to present detailed relationships to environmental variables, and this topic is the focus of another paper (Friedman et al., 2018) that examines relationships to modeled, high resolution physical data for many of our dominant taxa collected over a much broader geographic area.
In most respects, the dominant teleost and cephalopod taxa, their relative abundances, and cross-shelf assemblages documented in the present study conform to those identified by Phillips et al. (2009) in a similar study of epipelagic micronekton collected in the NCC during 2004–2006. Similar to the more recent work, the cross-shelf location (distance offshore or bottom depth) of the sampling was the major determinant of the community composition, with the shelf break serving as the transition region between nearshore and offshore fauna (Phillips et al., 2009). Although all three of these earlier years examined were relatively warm years of reduced ocean upwelling, euphausiids were by far the dominant taxa collected all years, although gelatinous organisms were not examined by Phillips et al. (2009).
The recent increase in gelatinous taxa we observed did not hold uniformly for all gelatinous taxa. Some gelatinous taxa such as the colonial salp, Salpa spp., was commonly found in 2011 as well (Supplementary Figure 2), a somewhat cool year inshore but marked with warm water offshore, which led to the incursion of these salps to nearshore waters throughout the northeast Pacific Ocean (Li et al., 2016). Similarly, although the cephalopods and teleosts as a whole did not show a distinct shift related to the arrival of the “warm blob,” some individual species did appear to respond positively (e.g., M. productus), whereas others such as A. felis and S. leucopsarus were relatively more abundant during the two cooler years of 2013 and 2014 (Supplementary Figure 2). The high densities of M. productus mainly at the northernmost stations sampled in 2016 were all age-0 fish that have been noted to occur in the NCC only during previous warm years (Brodeur et al., 2006; Phillips et al., 2007). As noted by Auth et al. (2018), this species was observed to be spawning off the coast of Oregon in the winter of 2016, well north of their more typical spawning area in the southern California Bight. We suspect that the distribution of the age-0 M. productus extended well north of our sampling area during 2016. With the exception of the along-shelf variation in M. productus, there were few latitudinal differences in the distribution of the taxa (Supplementary Figure 2), suggesting that the entire sampling region represented a somewhat cohesive zoogeographical community, as was shown by Friedman et al. (2018) for all stations north of Cape Mendocino (40.5°N).
Although we did not speciate our euphausiids for most of the hauls, Peterson et al. (2017) showed a similar pattern to ours from sampling along a single transect off Newport, Oregon (latitude 44.6°N), where the northern inshore species of euphausiid (Thysanoessa spinifera) was extremely rare in both 2015 and 2016 compared to previous years. The smaller offshore species (Euphausia pacifica) also showed a decline in 2015 but a rebound in 2016 (Peterson et al., 2017). Even within this species, there appears to be a decline in mean size starting in October of 2014 which would further decrease the biomass per individual (McClatchie et al., 2016). Off Vancouver Island, Canada, Galbraith and Young (2017) found high abundances of euphausiids overall for the last few years, but a demonstrative shift to mostly E. pacifica in 2016. We also observed a substantial increase in 2015 and 2016 for a more southern species of euphausiid, Nematoscelis difficilis (Galbraith and Young, 2017), which is rarely collected in cooler years. In a similar survey of epipelagic forage taxa off the coast of central California in 1990–2012, Ralston et al. (2015) observed the lowest abundances of euphausiids during their 12-year time series in 1992 and 1998, which were both strong El Niño years. In contrast, Morgan et al. (2019) found anomalously high larval euphausiid abundances in 2014–2016 from plankton sampling conducted closer to shore in our study area.
The most dramatic increase in gelatinous abundance associated with the warming were predominantly offshore or southern taxa such as Aequorea victoria in 2015 and the tropical pelagic tunicate P. atlanticum, which dominated the catches in 2016. The latter species was found in even higher densities in the summer of 2017, occurring well into the Gulf of Alaska (Brodeur et al., 2018; Sutherland et al., 2018). Despite the increase in offshore gelatinous taxa such as Hydromedusae, salps, and pelagic tunicates, it should be noted that the normal inshore large medusae, such as Chrysaora fuscescens and Aurelia labiata, which are dependent on strong upwelling and high productivity (Suchman et al., 2012), showed concomitant decreases in 2015 and 2016 (McClatchie et al., 2016; Sakuma et al., 2016; Morgan et al., 2019).
Our abundance results likely underestimate the impacts of this shift from crustacean to gelatinous taxa on the ecosystem. Unfortunately, we are able to only report changes in abundance, which is what we could measure at sea, since we did not have available a highly-precise, motion-compensated balance needed to get biomass of such relatively small organisms. However, if our abundance estimates were to be converted to a more useful currency in food web models (e.g., biomass or carbon content per individual), then the shifts observed in 2015 and 2016 are likely to be even more dramatic. Many of the crustaceans normally caught in this survey (e.g., euphausiids, sergestid shrimp) are at the smaller (15–25 mm) end of the micronekton size spectrum (Kwong et al., 2018). For example, the average weight of an adult E. pacifica is 0.10 g and the average weight of an adult T. spinifera is 0.12 g (based on collections in both warm and cold years, Elizabeth Daly, Oregon State University, unpublished data). Most of the gelatinous taxa are much larger in size and even accounting for the high moisture content of many of the taxa we caught, they would still represent per individual a relative high biomass on a dry weight or carbon content basis. A typical A. victoria sampled in 2015 was on average 69 mm in bell diameter with an average wet weight of 4.4 g (Sam Zeman, OSU, unpublished data) where a typical P. atlanticum averaging 36 mm weighed 1.28 g wet weight and 0.14 g dry weight [based on 28–46 mm individuals measured by Lebrato and Jones (2009); well below our average pyrosome lengths of 64.0 and 86.3 mm measured in 2015 and 2016, respectively].
The abundance we estimated for both these groups may be considered only as an index rather than an absolute abundance, since some taxa such as euphausiids and small salps may be extruded through the larger meshes at the mouth of the trawl. However, we expect that the relative levels we observed between years are likely to be somewhat robust. Observations on the deck of the vessel as the contents of the trawl were emptied showed a stark contrast between multiple large baskets of krill present at almost every station in the earlier cooler years to just a few liters per haul in the latter 2 years, with the gelatinous taxa showing the opposite pattern. In the region north of our study area off southern Vancouver Island, Canada, Galbraith and Young (2017) found a shift from a crustacean-dominated to a gelatinous-dominated plankton assemblage, and both 2015 and 2016 were the most extreme outliers in their 27-year time series. The dramatic shift we observed in the community composition following the MHW event would have statistically more significance had we included euphausiids in the ordination, thus our results could be considered somewhat conservative. It is interesting to note that the species richness and diversity both peaked in 2015, and then declined in 2016. A possible explanation is that the ecosystem was in transition at this time between the cool nearshore assemblage and the warm offshore assemblage, and both communities were represented in the sampling. Santora et al. (2017) found that diversity was the highest in 2015 of their 26-year time series off California using the same midwater trawl gear we used, although 2016 was not included in their study.
The warming event of 2015 and 2016 contrasted with previous strong El Niño events in that the temperature anomalies were exhibited mainly in the surface layer (upper 50–80 m), while below this layer temperature conditions were close to the climatological mean (Peterson et al., 2017; Auth et al., 2018). As our nighttime trawling occurred for the most part within this warm layer above the sharp thermocline (Figure 3), we cannot ascertain the community composition of the micronekton in the deeper layers which possibly may not have been as affected as much as the surface layer. Our stratified tow series from two stations in 2016 only (Supplementary Figure 3) indicated that, although there were both euphausiids and gelatinous taxa below the target depth of the survey (~30–42 m), they were not substantially different from the depth strata that we examined throughout all years of this study. Moreover, although the net was towed at each target depth for 15 min and quickly retrieved to the surface, there would be some limited catch on the retrieval of the net to the surface and this bias would be the greatest for the deepest stratum sampled. Catches were generally the lowest in the shallowest strata which were mostly within the warm surface layer (Supplementary Figure 3). Concurrent 120 kHz acoustical data along these transects revealed the presence of intense scattering layers below 100 m in 2015 that may have been aggregations of euphausiids and other micronekton that remained below the surface warm layer throughout the diel period (Brodeur, personal observation). Thus, it is possible that many components of the deep-scattering layer, such as crustaceans and fishes, did not undergo their normal diel vertical migration into the surface layers at night in the latter 2 years of our study. Thus, they would not be available to our trawl net, which could therefore skew our midwater abundance estimates. Although the deeper layer may have been exploited by deeper-dwelling fishes (e.g., older age classes of M. productus), it is likely to be beyond the diving capacity of many seabirds, possibly contributing to the starvation mortality and reduced reproductive success observed in many populations (Cavole et al., 2016; McClatchie et al., 2016).
The shift from a crustacean dominated system to one dominated by gelatinous taxa is likely to be caused by changes in the physics and mediated through regulation of the size structure and taxonomic composition of the lower trophic-level primary and secondary producers (Parsons and Lalli, 2002; Richardson, 2008). Under strong upwelling conditions, surface waters are cool and nutrients are often in excess, leading to a phytoplankton community dominated by diatoms and a zooplankton community dominated by large crustaceans (Rykaczewski and Checkley, 2008). The upper trophic level food web is then dominated by planktivorous fishes, which in turn are fed upon by predatory fishes, seabirds, and marine mammals. In contrast, during warm and stratified ocean conditions, the surface waters are limited in nutrients leading to picoplankton and flagellates as the dominant primary producers (Lindegren et al., 2017). The intermediate trophic levels are dominated by gelatinous zooplankton capable of feeding on these fine particles (e.g., salps, tunicates, and appendicularians), which are much less utilized by higher trophic levels. During warm years such as El Niños, food webs tend to be more elongated with additional intermediate trophic levels compared to cool years, leading to less trophic efficiency in the system (Brodeur and Pearcy, 1992; Ruiz-Cooley et al., 2017). The increased densities of these gelatinous microcarnivorous predators such as Aequorea victoria may have depressed populations of grazing copepods, thus creating a trophic cascade typical of many jellyfish blooms (Schnedler-Meyer et al., 2018), leading to the high chlorophyll levels we observed in 2015. In contrast, pelagic tunicates such as pyrosomes feed on smaller particles including phytoplankton (Perissinotto et al., 2007, but see Pakhomov et al., 2019), which may have depressed chlorophyll a levels as seen in 2016.
Although most planktivorous forage species consume mainly small pelagic crustaceans such as copepods and euphausiids, the apparent lack of large-bodied crustaceans in 2015 and 2016 (Peterson et al., 2017, this study) appears to have led to a pronounced diet shift in many dominant pelagic fish species. For example, northern anchovy (Engraulis mordax) and Pacific sardine (Sardinops sagax), two of the dominant forage taxa in this region, were observed to be feeding on gelatinous zooplankton such as salps and smaller gelatinous taxa these 2 years, in contrast to a mostly crustacean diet during normal or cool years (Brodeur et al., 2019).
Our cruises during late-spring/early-summer provide a simple “snapshot” of the communities at only one time of the year. In addition to climate-driven changes in productivity, we also see temperature mediated effects on phenology in this region. For example, Auth et al. (2018) provide evidence of earlier and more prolonged spawning of both northern anchovy and Pacific sardine in the NCC since 2015, thus shifting the availability of juveniles of these species in our surveys. Although we did see many younger age-classes of these taxa in our samples, the differences were not striking. However, Auth et al. (2018) also documented a northern shift in the spawning of Pacific hake in 2016, which corresponded to a substantial increase in age-0 hake mostly in the northern part of our sampling region, such that this species became the dominant fish taxa sampled that year (Table 1). Although the normal spawning area of Pacific hake is off southern California, they have been shown to spawn within the NCC during the anomalously warm years that occurred during the mid-2000s, leading to high catches of age-0 fish off Oregon and Washington in the summer (Phillips et al., 2007). Major temperature changes in this region can also lead to interannual variations in growth rate and survival of larval and juvenile fishes, as observed for northern anchovy in the NCC (Takahashi et al., 2012), thus affecting their availability to predators.
This study and others (Phillips et al., 2009; Friedman et al., 2018) that looked at macrozooplankton and micronekton abundance patterns found temperature to be the dominant environmental variable correlated with interannual variability in catches. The NCC has cycled through warm and cool phases in the past, which led to alternations between a crustacean-dominated and gelatinous-dominated zooplankton system (Francis et al., 2012). Similar patterns have been observed for plankton in other upwelling areas such as off the NW Iberian coast (Bode et al., 2013). The major question is whether these outbursts of gelatinous plankton will continue to occur in the future under projected temperature increases in the North Pacific. However, eastern boundary current regions are not expected to necessarily warm with the projected buildup of greenhouse gases and might actually exhibit enhanced upwelling and cooler temperatures in the future (Wang et al., 2010; Sydeman et al., 2013). Model projections indicate that multiyear marine heat waves are likely to occur more frequently and be of greater intensity in the Northeast Pacific in the coming decades (Joh and Di Lorenzo, 2017), and may be exacerbated by secular trends in anthropogenic warming (Jacox et al., 2018). Frölicher et al. (2018) showed that under projected climate change scenarios, the probability of MHWs will increase by a factor of 41 and be 21 times stronger than pre-industrial conditions, suggesting that these anomalous conditions may be more normal in the future.
It is uncertain whether the intensity and duration of this recent warming event could have exceeded some threshold or tipping point (Duarte, 2014), and result in a long-term increase in gelatinous zooplankton, as seen in some other ecosystems (Atkinson et al., 2004; Attrill et al., 2007; Brotz et al., 2012; Roux et al., 2013), making the return to the previous state quite unlikely without another counteracting major perturbation. Indeed, the extensive bloom of pyrosomes documented here in 2016 continued and actually intensified in 2017 and 2018 (Brodeur et al., 2018; Sutherland et al., 2018), long after the effects of the MHW phenomenon was considered to have abated (Hobday et al., 2018). Conversely, this system may be resilient enough to shift back to cooler conditions, resulting in a lower phase of gelatinous abundance (Lavaniegos and Ohman, 2003; Brodeur et al., 2008; Condon et al., 2013). Only through continual, long-term monitoring of this productive ecosystem will we be able to determine whether this critical trophic level and the apical level taxa that depend on them will continue to be affected by such major ecological perturbations.
Author Contributions
All three authors collected and processed the field data. RB analyzed the physical data and community structure. TA analyzed the diversity indices. AP generated the maps. RB wrote the first draft with later additions by TA and AP. All authors listed have made substantial direct and intellectual contribution to the work, and approved it for publication.
Funding
This research was funded by the Northwest Fisheries Science Center and the NOAA Cooperative Research Program. This is Contribution Number 2019-3 of the California Current Integrated Ecosystem Assessment Program.
Conflict of Interest Statement
The authors declare that the research was conducted in the absence of any commercial or financial relationships that could be construed as a potential conflict of interest.
Acknowledgments
We thank the officers and crew of the R/V Ocean Starr, R/V Bell Shimada, and the F/V Excalibur for their assistance in collecting the samples. Numerous individuals helped with the sorting and processing of the catches including: Paul Chittaro, Will Fennie, Sam Zeman, Kat Dale, Julia Adams, Ashley Hann, Delvin Neville, Thomas Adams, Ken Baltz, and Keith Bosley. We thank Hillary Scannell for producing Supplementary Figure 1. We also thank Keith Bosley, Jay Peterson, and three reviewers for constructive comments on earlier versions of the manuscript.
Supplementary Material
The Supplementary Material for this article can be found online at: https://www.frontiersin.org/articles/10.3389/fmars.2019.00212/full#supplementary-material
Supplementary Figure 1. Sea surface temperature (SST) time series for the area averaged from 46.625-42.125° N and 124.375-124.875° W. I used the OISST dataset (https://www.esrl.noaa.gov/psd/) and the climatology referenced to 1983-2012. The threshold is defined as the 90th percentile defined over the climatology using the marineHeatWave module (Hobday et al., 2016). The shaded categories follow Hobday et al. (2016). The map on the right shows the SST anomalies on Dec. 20, 2014 relative to climatology and denoted by the red triangle marker on the plot. (Figure courtesy of Hillary Scannell, University of Washington).
Supplementary Figure 2. Distribution maps for the dominant taxa by year. The number in the upper left of each panel indicates the geometric mean catch per haul by year. Note the scale on the plots is logarithmic.
Supplementary Figure 3. Nighttime vertical distribution of some dominant taxa based on series of three tows made at stations on the Columbia River transect (46.0° N; top) and the Tillamook transect (45.5° N; bottom). Depth indicated on y-axis is the range of depths occupied for most of the tow for each depth stratum. Plots on the right are the vertical distribution of temperature at each location with the approximate depth of the tows at each location indicated by the blue lines.
References
Akima, H. (1996). Rectangular-Grid-Data surface fitting that has the accuracy of a bicubic polynomial. ACM Trans. Math. Softw. 22, 357–361. doi: 10.1145/232826.232854
Atkinson, A., Siegel, V., Pakhomov, E., and Rothery, P. (2004). Long-term decline in krill stock and increase in salps within the Southern Ocean. Nature 432, 100–103. doi: 10.1038/nature02996
Attrill, M. J., Wright, J., and Edwards, M. (2007). Climate-related increases in jellyfish frequency suggest a more gelatinous future for the North Sea. Limnol. Oceanogr. 52, 480–485. doi: 10.4319/lo.2007.52.1.0480
Auth, T. D., Daly, E. A., Brodeur, R. D., and Fisher, J. L. (2018). Phenological and distributional shifts in ichthyoplankton associated with recent warming in the northeast Pacific Ocean. Global Change Biol. 24, 259–272. doi: 10.1111/gcb.13872
Bode, A., Álvarez-Ossorio, M. T., Miranda, A., and Ruiz-Villarreal, M. (2013). Shifts between gelatinous and crustacean plankton in a coastal upwelling region. ICES J. Mar. Sci. 70, 934–942. doi: 10.1093/icesjms/fss193
Bond, N. A., Cronin, M. F., Freeland, H., and Mantua, N. (2015). Causes and impacts of the 2014 warm anomaly in the NE Pacific. Geophys. Res. Lett. 42, 3414–3420. doi: 10.1002/2015GL063306
Brodeur, R. D., Decker, M. B., Ciannelli, L., Purcell, J. E., Bond, N. A., Stabeno, P. J., et al. (2008). Rise and fall of jellyfish in the eastern Bering Sea in relation to climate regime shifts. Prog. Oceanogr. 77, 103–111. doi: 10.1016/j.pocean.2008.03.017
Brodeur, R. D., Hunsicker, M. E., Hann, A., and Miller, T. W. (2019). Effects of warming ocean conditions on feeding ecology of small pelagic fishes in a coastal upwelling ecosystem: a shift to gelatinous food sources. Mar. Ecol. Prog. Ser. doi: 10.3354/meps12497
Brodeur, R. D., and Pearcy, W. G. (1992). Effects of environmental variability on trophic interactions and food web structure in a pelagic upwelling ecosystem. Mar. Ecol. Prog. Ser. 84, 101–119. doi: 10.3354/meps084101
Brodeur, R. D., Pearcy, W. G., and Ralston, S. (2003). Abundance and distribution patterns of nekton and micronekton in the Northern California Current Transition Zone. J. Oceanogr. 59, 515–534. doi: 10.1023/A:1025548801541
Brodeur, R. D., Perry, R. I., Boldt, J. L., Flostrand, L., Galbraith, M., King, J., et al. (2018). An unusual gelatinous plankton event in the NE Pacific: the great pyrosome bloom of 2017. PICES Press 26, 22–27.
Brodeur, R. D., Ralston, S., Emmett, R. L., Trudel, M., Auth, T. D., and Phillips, A. J. (2006). Recent trends and anomalies in pelagic nekton abundance, distribution, and apparent recruitment in the Northeast Pacific Ocean. Geophys. Res. Lett. 33:L22SL08. doi: 10.1029/2006GL026614
Brotz, L., Cheung, W. W. L., Kleisner, K., Pakhomov, E., and Pauly, D. (2012). Increasing jellyfish populations: trends in large marine ecosystems. Hydrobiologia 690, 3–20. doi: 10.1007/s10750-012-1039-7
Cavole, L. M., Demko, A. M., Diner, R. E., Giddings, A., Koester, I., Pagniello, C. M. L. S., et al. (2016). Biological impacts of the 2013–2015 warm-water anomaly in the Northeast Pacific: winners, losers, and the future. Oceanography 29, 273–285. doi: 10.5670/oceanog.2016.32
Condon, R. H., Duarte, C. M., Pitt, K. A., Robinson, K. L., Lucas, C. H., Sutherland, K. L., et al. (2013). Recurrent jellyfish blooms are a consequence of global oscillations. Proc. Natl. Acad. Sci. U.S.A. 110, 1000–1005. doi: 10.1073/pnas.1210920110
Daly, E. A., Brodeur, R. D., and Auth, T. D. (2017). Anomalous ocean conditions in 2015: impacts on spring Chinook salmon and their prey fields. Mar. Ecol. Prog. Ser. 566, 169–182. doi: 10.3354/meps12021
Di Lorenzo, E., and Mantua, N. (2016). Multi-year persistence of the 2014/2015 North Pacific marine heatwave. Nat. Climate Change 6, 1042–1047. doi: 10.1038/nclimate3082
Doney, S. C., Ruckelshaus, M. H., Duffy, J. E., Barry, J. P., Chan, F., English, C., et al. (2012). Climate change impacts on marine ecosystems. Annu. Rev. Mar. Sci. 4, 11–37. doi: 10.1146/annurev-marine-041911-111611
Duarte, C. M. (2014). Global change and the future ocean: a grand challenge for marine sciences. Front. Mar. Sci. 1:63. doi: 10.3389/fmars.2014.00063
Dufrêne, M., and Legendre, P. (1997). Species assemblages and indicator species: the need for a flexible asymmetrical approach. Ecol. Monogr. 67, 345–366. doi: 10.2307/2963459
Fiedler, P. C., and Mantua, N. J. (2017). How are warm and cool years in the California Current related to ENSO? J. Geophys. Res. 122:13094. doi: 10.1002/2017JC013094
Francis, T. B., Scheuerell, M. D., Brodeur, R. D., Levin, P. S., Ruzicka, J. J., Tolimieri, N., et al. (2012). Climate shifts the interaction web of a marine plankton community. Global Change Biol. 18, 2498–2508. doi: 10.1111/j.1365-2486.2012.02702.x
Friedman, W. R., Santora, J. A., Schroeder, I. D., Huff, D. D., Brodeur, R. D., Field, J. C., et al. (2018). Environmental and geographic relationships among salmon forage assemblages along the continental shelf of the California Current. Mar. Ecol. Prog. Ser. 596, 181–198. doi: 10.3354/meps12598
Frölicher, T. L., Fischer, E. M., and Gruber, N. (2018). Marine heatwaves under global warming. Nature 560, 360–364. doi: 10.1038/s41586-018-0383-9
Galbraith, M., and Young, K. (2017). “Zooplankton along the B.C. continental margin,” in State of the Physical, Biological and Selected Fishery Resources of Pacific Canadian Marine Ecosystems in 2016, eds P. C. Chandler, S. A. King, and J. Boldt, Canadian Technical Report of Fisheries and Aquatic Sciences 3225, 67–75.
Gentemann, C. L., Fewings, M. R., and García-Reyes, M. (2017). Satellite sea surface temperatures along the West Coast of the United States during the 2014–2016 northeast Pacific marine heat wave. Geophys. Res. Lett. 44, 312–319. doi: 10.1002/2016GL071039
Hauser, D. D., Tobin, E. D., Feifel, K. M., Shaw, V., and Pietri, D. M. (2016). Disciplinary reporting affects the interpretation of climate change impacts in global oceans. Global Change Biol. 22, 25–43. doi: 10.1111/gcb.12978
Hewitt, J. E., Ellis, J. I., and Thrush, S. E. (2016). Multiple stressors, nonlinear effects and the implications of climate change impacts on marine coastal ecosystems. Global Change Biol. 22, 2665–2675. doi: 10.1111/gcb.13176
Hickey, B. M., and Banas, N. S. (2008). Why is the northern end of the California Current system so productive? Oceanography 21, 90–107. doi: 10.5670/oceanog.2008.07
Hobday, A. J., Alexander, L. V., Perkins, S. E., Smale, D., Straub, S., Oliver, E. C. J., et al. (2016). A hierarchical approach to defining marine heatwaves. Prog. Oceanogr. 141, 227–238. doi: 10.1016/j.pocean.2015.12.014
Hobday, A. J., Oliver, E. C. J., Sen Gupta, A., Benthuysen, J. A., Burrows, M. T., Donat, M. G., et al. (2018). Categorizing and naming marine heatwaves. Oceanography 31, 162–173. doi: 10.5670/oceanog.2018.205
Hoegh-Guldberg, O., and Bruno, J. F. (2010). The impact of climate change on the world's marine ecosystems. Science 328, 1523–1528. doi: 10.1126/science.1189930
Howard, J., Babij, E., Griffis, R., Helmuth, B., Himes-Cornell, A., Niemier, P., et al. (2013). Oceans and marine resources in a changing climate. Oceanogr. Mar. Biol. 51, 71–192.
Jacox, M. G., Alexander, M. A., Mantua, N. J., Scott, J. D., Hervieux, G., Webb, R. S., et al. (2018). Forcing of multiyear extreme ocean temperatures that impact California Current living marine resources in 2016. Bull. Am. Meteorol. Soc. 99, S27–S33. doi: 10.1175/BAMS-D-17-0119.1
Jacox, M. G., Hazen, E. L., Zaba, K. D., Rudnick, D. L., Edwards, C. A., Moore, A. M., et al. (2016). Impacts of the 2015-2016 El Niño on the California Current System: early assessment and comparison to past events. Geophys. Res. Lett. 43, 1–9. doi: 10.1002/2016GL069716
Joh, Y., and Di Lorenzo, E. (2017). Increasing coupling between NPGO and PDO leads to prolonged marine heatwaves in the Northeast Pacific. Geophys. Res. Lett. 44, 663–671. doi: 10.1002/2017GL075930
Kwong, L. E., Pakhomov, E. A., Suntsov, A. V., Seki, M. P., Brodeur, R. D., Pakhomova, L. G., et al. (2018). An intercomparison of the taxonomic and size composition of tropical macrozooplankton and micronekton collected using three sampling gears. Deep-Sea Res. I 135, 34–45. doi: 10.1016/j.dsr.2018.03.013
Lavaniegos, B. E., and Ohman, M. D. (2003). Long-term changes in pelagic tunicates of the California Current. Deep Sea Res. II 50, 2473–2498. doi: 10.1016/S0967-0645(03)00132-2
Lebrato, M., and Jones, D. O. B. (2009). Mass deposition event of Pyrosoma atlanticum carcasses off Ivory Coast (West Africa). Limnol. Oceanogr. 45, 1197–1209. doi: 10.4319/lo.2009.54.4.1197
Li, K., Doubleday, A. J., Galbraith, M. D., and Hopcroft, R. R. (2016). High abundance of salps in the coastal Gulf of Alaska during 2011: a first record of bloom occurrence for the northern Gulf. Deep-Sea Res. II 132, 136–145. doi: 10.1016/j.dsr2.2016.04.009
Lindegren, M., Checkley, D. M. Jr., Koslow, J. A., Goericke, R., and Ohman, M. (2017). Climate-mediated changes in marine ecosystem regulation during El Niño. Global Change Biol. 24, 796–809. doi: 10.1111/gcb13993
McClatchie, S., Goericke, R., Leising, A., Auth, T. D., Bjorkstedt, E., Robertson, R. R., et al. (2016). State of the california current 2015-16: comparisons with the 1997-98 El Niño. Calif. Coop. Ocean. Fish. Invest. Rep. 57, 5–61.
McCune, B., and Grace, J. B. (2002). Analysis of Ecological Communities. Gleneden Beach, OR: MjM Software.
McCune, B., and Mefford, M. J. (2006). PC-Ord, Multivariate Analysis of Ecological Data, Version 5. Gleneden Beach, OR: MjM Software.
Mills, K. E., Pershing, A. J., Brown, C. J., Chen, Y., Chiang, F.-S., Holland, D. S., et al. (2013). Fisheries management in a changing climate: lessons from the 2012 ocean heat wave in the Northwest Atlantic. Oceanography 26, 191–195. doi: 10.5670/oceanog.2013.27
Morgan, C. A., Beckman, B. R., Weitkamp, L. A., and Fresh, K. L. (2019). Recent ecosystem disturbance in the Northern California current. Fisheries. doi: 10.1002/fsh.10273
Oliver, E. C. J., Donat, M. G., Burrows, M. T., Moore, P. J., Smale, D. A., Alexander, L. V., et al. (2018). Longer and more frequent marine heatwaves over the past century. Nat. Commun. 9:1324. doi: 10.1038/s41467-018-03732-9
Pakhomov, E. A., Henschke, N., Hunt, B. P. V., Stowasser, G., and Cherel, Y. (2019). Utility of salps as a baseline proxy for food web studies. J. Plankton Res. 41, 3–11. doi: 10.1093/plankt/fby051
Parsons, T. R., and Lalli, C. M. (2002). Jellyfish population explosions: revisiting a hypothesis of possible causes. La Mer 40, 111–121.
Perissinotto, R., Mayzaud, P., Nichols, P. D., and Labat, J. P. (2007). Grazing by Pyrosoma atlanticum (Tunicata, Thaliacea) in the south Indian Ocean. Mar. Ecol. Prog. Ser. 330, 1–11. doi: 10.3354/meps330001
Peterson, W. T., Fisher, J. L., Strub, P. T., Du, X., Risien, C., Peterson, J., et al. (2017). The pelagic ecosystem in the northern California Current off Oregon during the 2014-2016 warm anomalies within the context of the past 20 years. J. Geophys. Res. 122:12952. doi: 10.1002/2017JC012952
Phillips, A. J., Brodeur, R. D., and Suntsov, A. V. (2009). Micronekton community structure in the epipelagic zone of the northern California Current upwelling system. Prog. Oceanogr. 80, 74–92. doi: 10.1016/j.pocean.2008.12.001
Phillips, A. J., Ralston, S., Brodeur, R. D., Auth, T. D., Emmett, R. L., Johnson, C., et al. (2007). Recent Pre-recruit Pacific Hake (Merluccius productus) occurrences in the Northern California current suggest a northward expansion of their Spawning Area. Calif. Coop. Ocean. Fish. Invest. Rep. 48, 215–229.
Poloczanska, E. S., Burrows, M. T., Brown, C. J., Molinos, J. G., Halpern, B. S., Hoegh-Guldberg, O., et al. (2016). Responses of marine organisms to climate change across oceans. Front. Mar. Sci. 3:62. doi: 10.3389/fmars.2016.00062
R Core Team (2015). R: A Language and Environment for Statistical Computing. R Foundation for Statistical Computing, Vienna, Austria. Available online at: https://www.R-project.org/.
Ralston, S., Field, J. C., and Sakuma, K. M. (2015). Long-term variation in a central California pelagic forage assemblage. J. Mar. Syst. 146, 26–37. doi: 10.1016/j.jmarsys.2014.06.013
Richardson, A. J. (2008). In hot water: zooplankton and climate change. ICES J. Mar. Sci. 65, 279–295. doi: 10.1093/icesjms/fsn028
Roux, J. P., van der Lingen, C. D., Gibbons, M. J., Moroff, N. E., Shannon, L. J., Smith, A. D. M., et al. (2013). Jellyfication of marine ecosystems as a likely consequence of overfishing small pelagic fishes: lessons from the Benguela. Bull. Mar. Sci. 89, 249–284. doi: 10.5343/bms.2011.1145
Ruiz-Cooley, R. I., Gerrodette, T., Fiedler, P. C., Chivers, S. J., Danil, K., and Balance, L. T. (2017). Temporal variation in pelagic food chain length in response to environmental change. Sci. Adv. 2017:e1701140. doi: 10.1126/sciadv.1701140
Rykaczewski, R. R., and Checkley, D. M. (2008). Influence of ocean winds on the pelagic ecosystem in upwelling regions. Proc. Natl. Acad. Sci. U.S.A. 105, 1965–1970. doi: 10.1073/pnas.0711777105
Sakuma, K. M., Field, J. C., Mantua, N. J., Ralston, S., Marinovic, B. B., and Carrion, C. N. (2016). Anomalous epipelagic micronekton assemblage patterns in the neritic waters of the California current in spring 2015 during a period of extreme ocean conditions. Calif. Coop. Ocean. Fish. Invest. Rep. 57, 163–183.
Santora, J. A., Hazen, E. L., Schroeder, I. D., Bograd, S. J., Sakuma, K. M., and Field, J. C. (2017). Impacts of ocean-climate variability on biodiversity of pelagic forage species in an upwelling ecosystem. Mar. Ecol. Prog. Ser. 580, 205–220. doi: 10.3354/meps12278
Scannell, H. A., Pershing, A. J., Alexander, M. A., Thomas, A. C., and Mills, K. E. (2016). Frequency of marine heatwaves in the North Atlantic and North Pacific since 1950. Geophys. Res. Lett. 43, 2069–2076. doi: 10.1002/2015GL067308
Schnedler-Meyer, N. A., Kiørboe, T., and Mariani, P. (2018). Boom and bust: life history, environmental noise, and the (un)predictability of jellyfish blooms. Front. Mar. Sci. 5:257. doi: 10.3389/fmars.2018.00257
Shannon, C. E., and Weaver, W. (1949). The Mathematical Theory of Communication. Urbana, IL: University of Illinois Press.
Smale, D. A., Wernberg, T., Oliver, E. C. J., Thomsen, M., Harvey, B. P., Straub, S. C., et al. (2019). Marine heatwaves threaten global biodiversity and the provision of ecosystem services. Nat. Climate Change. 9, 306–312. doi: 10.1038/s41558-019-0412-1
Suchman, C. L., Brodeur, R. D., Daly, E. A., and Emmett, R. L. (2012). Large medusae in surface waters of the Northern California Current: variability in relation to environmental conditions. Hydrobiologia 690, 113–125. doi: 10.1007/s10750-012-1055-7
Sutherland, K. R., Sorensen, H. L., Blondheim, O. N., Brodeur, R. D., and Galloway, A. W. E. (2018). Range expansion of tropical pyrosomes in the northeast Pacific Ocean. Ecology 99, 2397–2399. doi: 10.1002/ecy.2429
Sydeman, W. J., Santora, J. A., Thompson, S. A., Marinovic, B., and Di Lorenzo, E. (2013). Increasing variance in North Pacific climate relates to unprecedented ecosystem variability off California. Global Change Biol. 19, 1662–1675. doi: 10.1111/gcb.12165
Takahashi, M., Checkley, D. M., Litz, M. N. C., Brodeur, R. D., and Peterson, W. T. (2012). Responses in growth rate of larval northern anchovy (Engraulis mordax) to anomalous upwelling in the northern California Current. Fish. Oceanogr. 21, 393–404. doi: 10.1111/j.1365-2419.2012.00633.x
Wang, M., Overland, J. E., and Bond, N. A. (2010). Climate projections for selected large marine ecosystems. J. Mar. Syst. 79, 258–266. doi: 10.1016/j.jmarsys.2008.11.028
Keywords: micronekton, Euphausiidae, fish, gelatinous, warm blob, El Niño, California current, Pacific Ocean
Citation: Brodeur RD, Auth TD and Phillips AJ (2019) Major Shifts in Pelagic Micronekton and Macrozooplankton Community Structure in an Upwelling Ecosystem Related to an Unprecedented Marine Heatwave. Front. Mar. Sci. 6:212. doi: 10.3389/fmars.2019.00212
Received: 26 January 2018; Accepted: 04 April 2019;
Published: 07 May 2019.
Edited by:
Susana Agusti, King Abdullah University of Science and Technology, Saudi ArabiaReviewed by:
Santiago Hernández-León, Universidad de Las Palmas de Gran Canaria, SpainRobert William Schlegel, Dalhousie University, Canada
Albertus J. Smit, University of the Western Cape, South Africa
Copyright © 2019 Brodeur, Auth and Phillips. This is an open-access article distributed under the terms of the Creative Commons Attribution License (CC BY). The use, distribution or reproduction in other forums is permitted, provided the original author(s) and the copyright owner(s) are credited and that the original publication in this journal is cited, in accordance with accepted academic practice. No use, distribution or reproduction is permitted which does not comply with these terms.
*Correspondence: Richard D. Brodeur, cmljay5icm9kZXVyQG5vYWEuZ292